📺 Watch the Full Video Analysis
This article was automatically generated by the NFC Market Live AI analysis system. (Updated: 2026-11-07 07:13 JST)
📄 Primary Source
米国労働省(DOL)— 新規失業保険申請件数
https://www.dol.gov/newsroom/releases/eta/eta20261105
米国エネルギー情報局(EIA)— 週間石油状況レポート
https://www.eia.gov/petroleum/supply/weekly/pdf/highlights.pdf
連邦準備制度理事会(FRB)— H.4.1 バランスシート
https://www.federalreserve.gov/releases/h41/current/h41.htm
📊 A weekly review of three U.S. macro gauges: DOL jobless claims, EIA petroleum data and the Fed H.4.1 balance sheet.
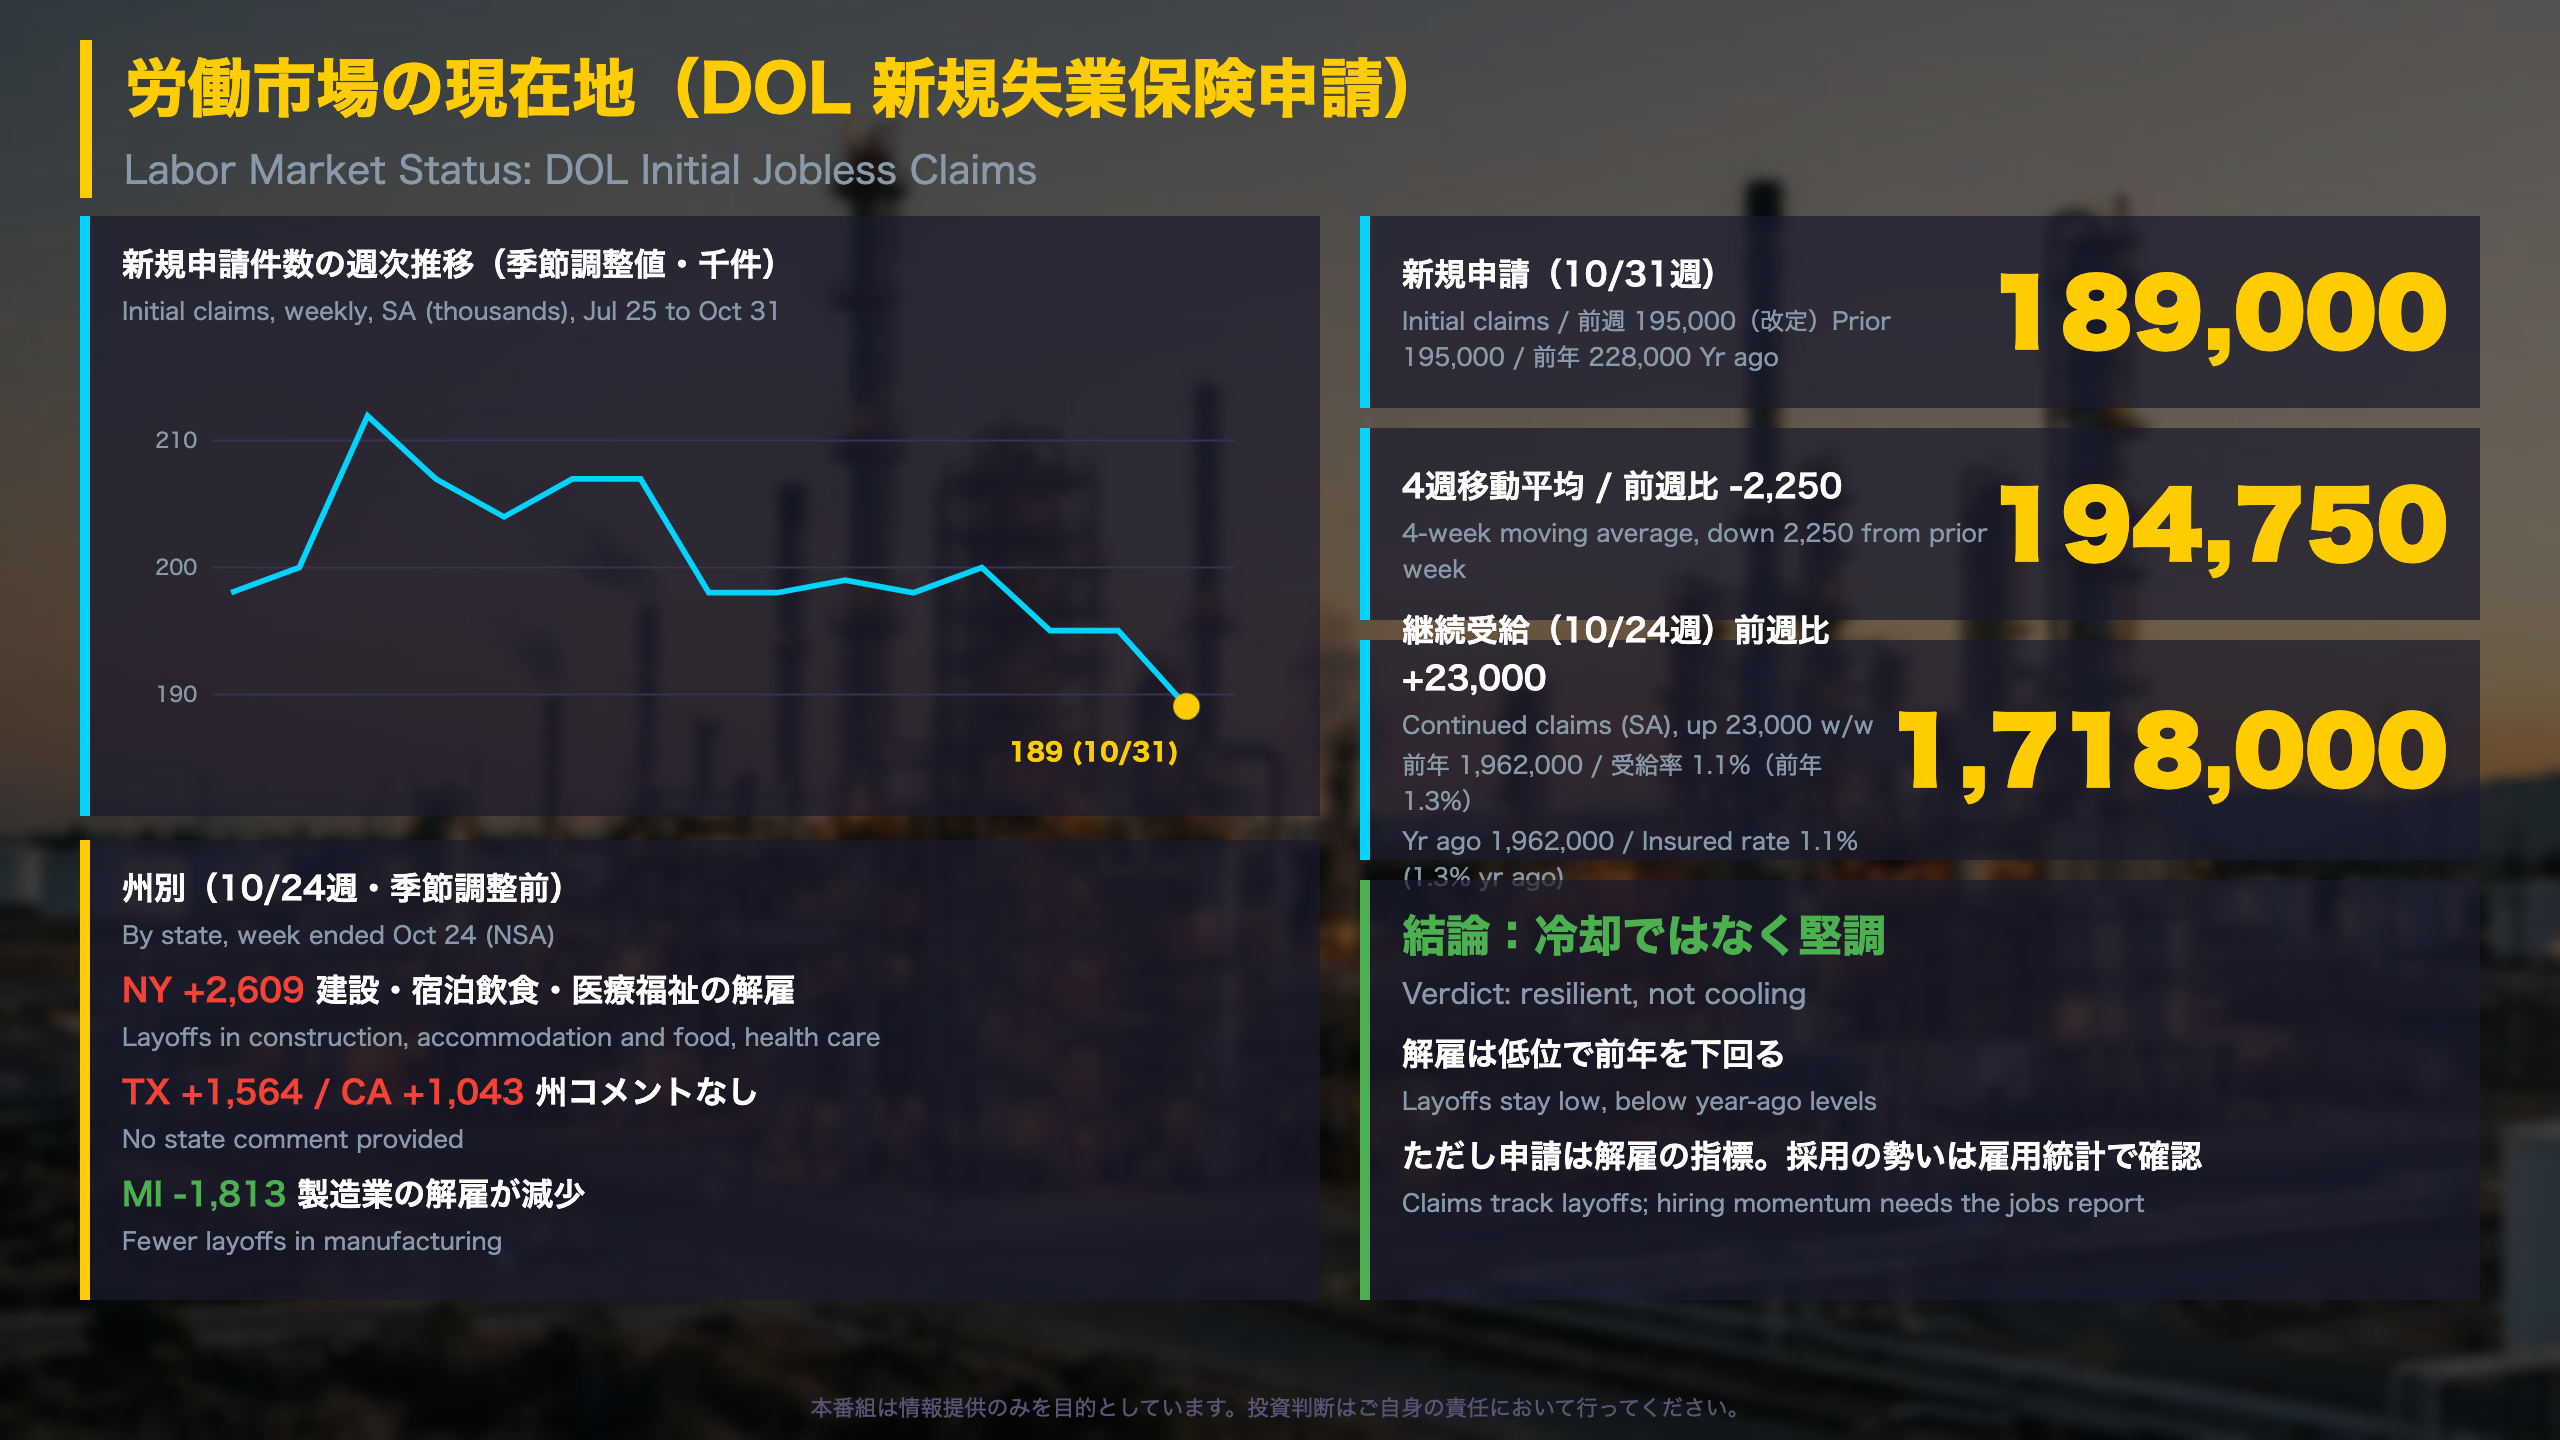
📉 Initial claims fell to 189,000 from 195,000 (revised); continued claims were 1.718M vs 1.962M a year ago.
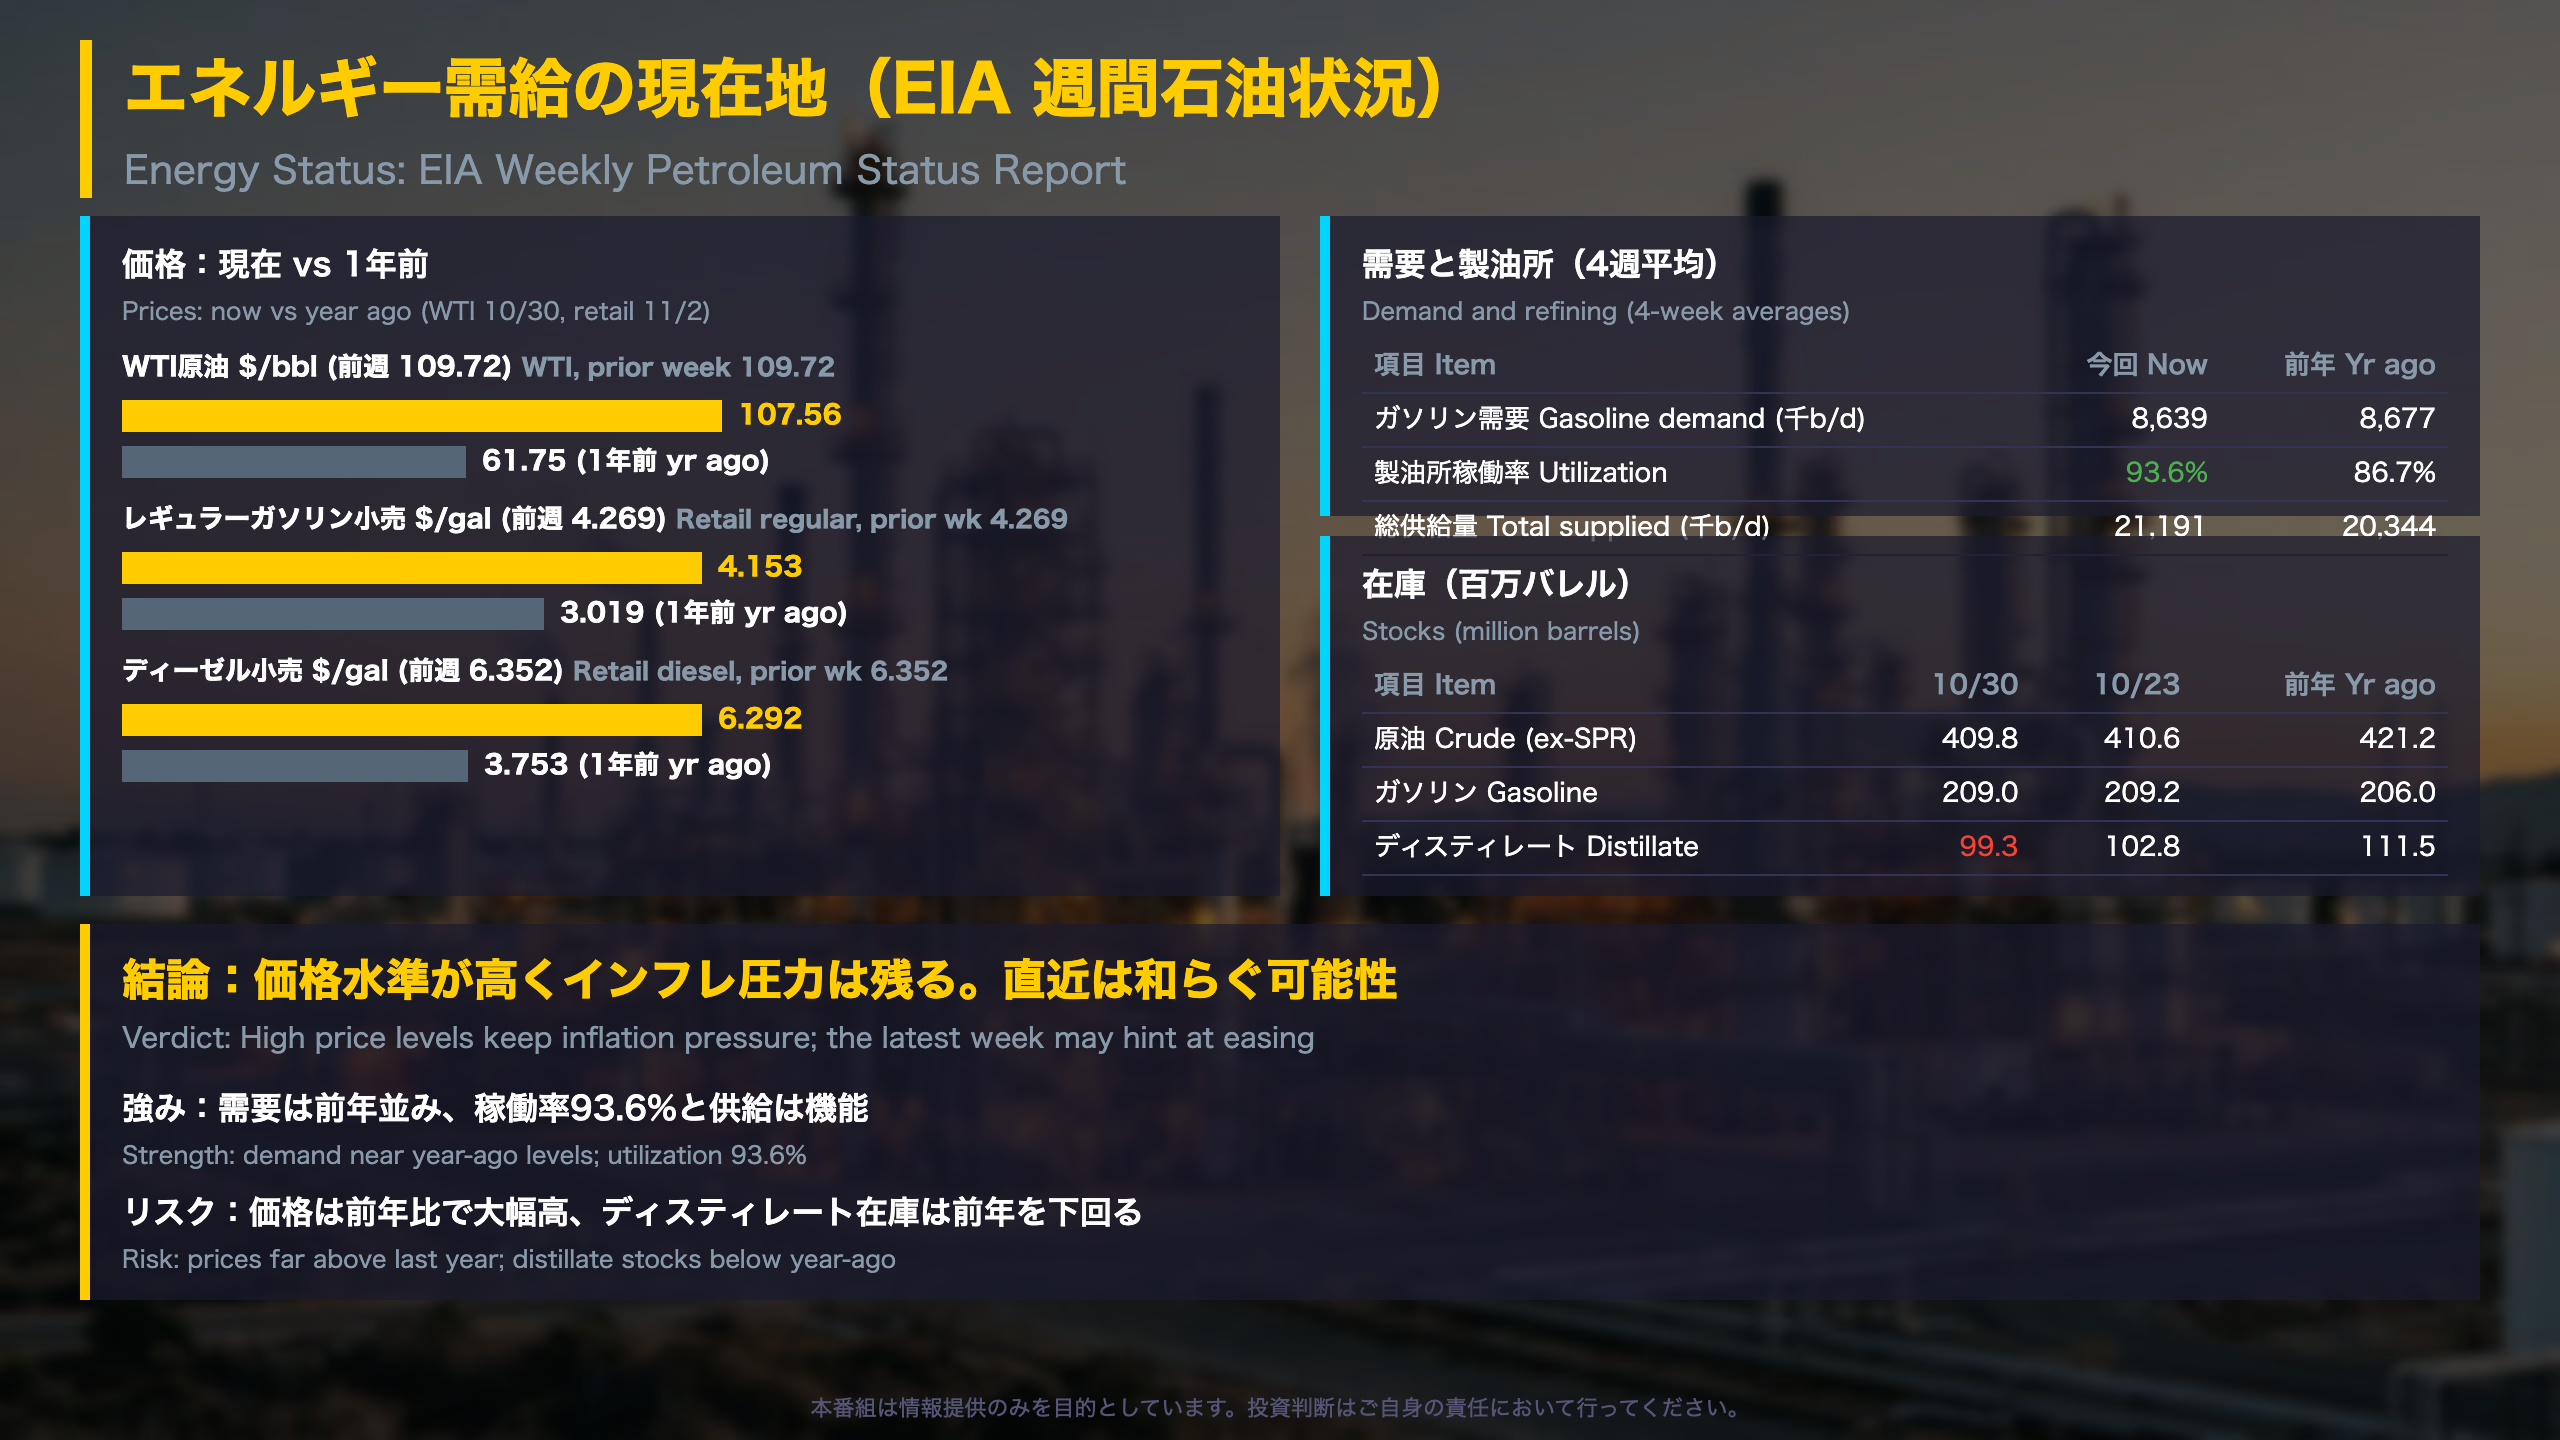
🛢️ WTI spot was $107.56, far above $61.75 a year earlier, but slightly below last week’s $109.72.
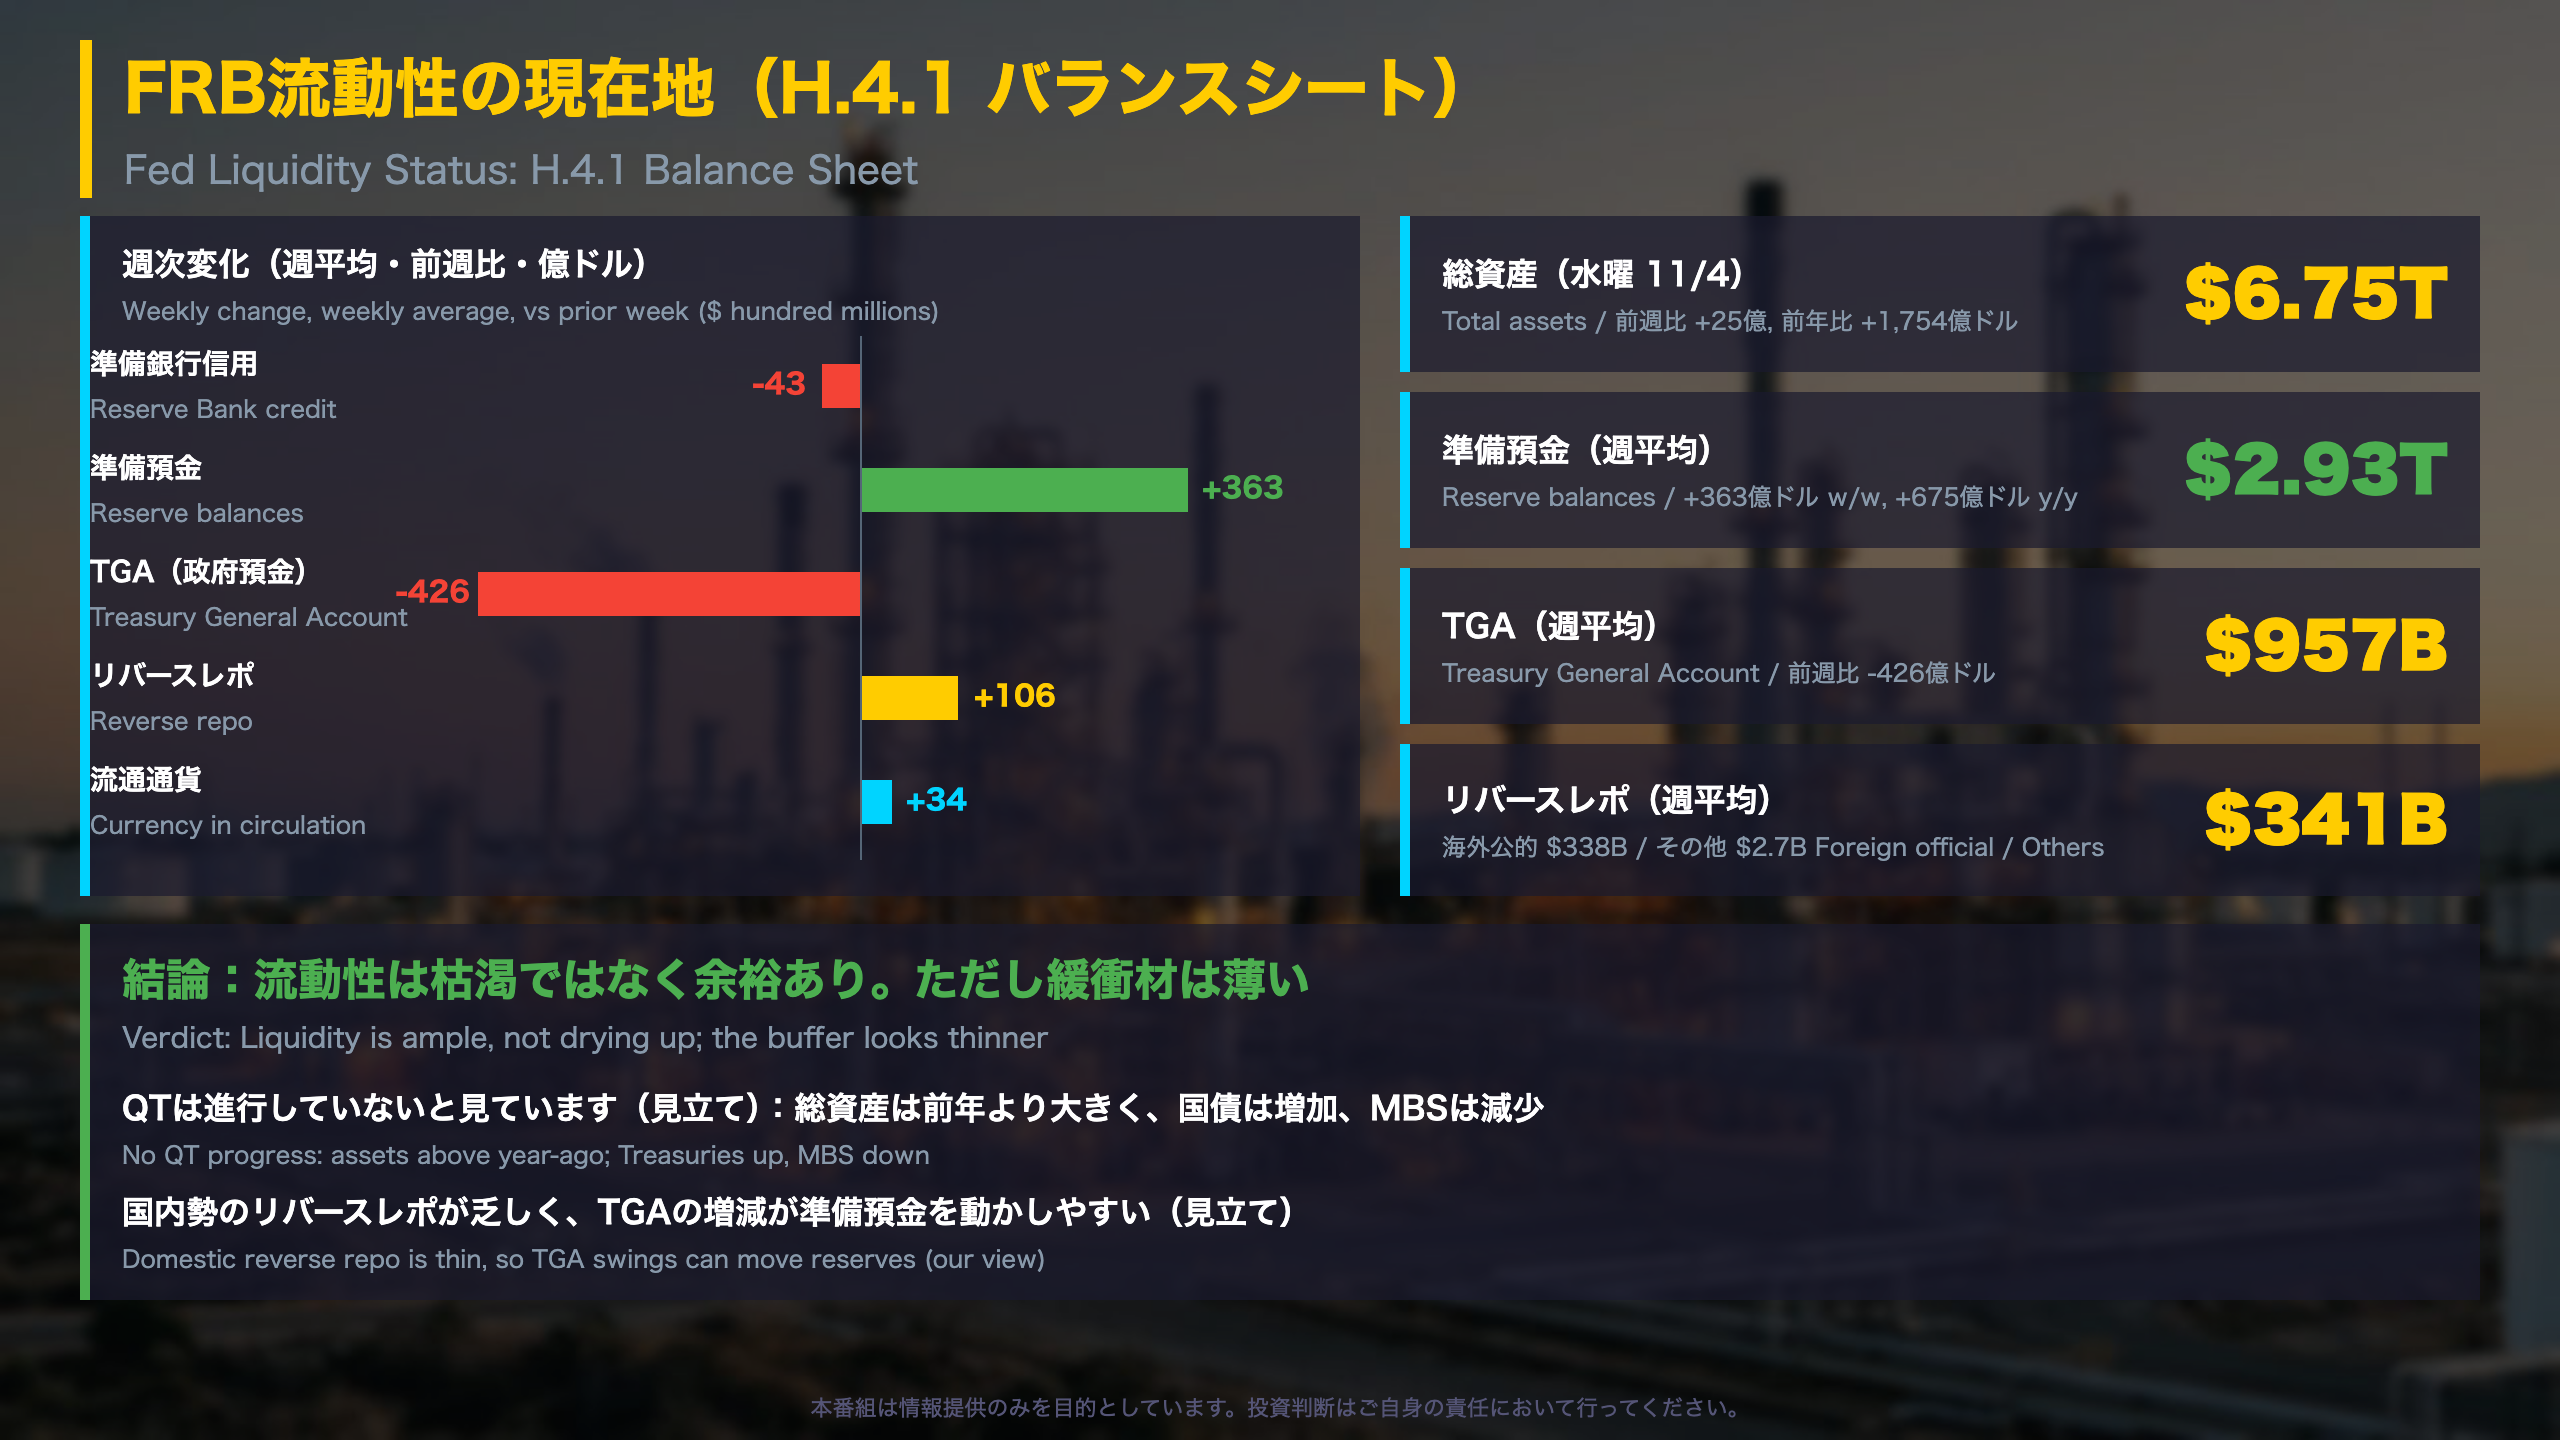
💧 Fed reserve balances averaged $2.93T, up from the prior week as the Treasury General Account fell.
⚠️ Domestic reverse repo balances are tiny, so the liquidity buffer looks thinner.
💡 Labor and funding look solid; energy costs remain a headwind.
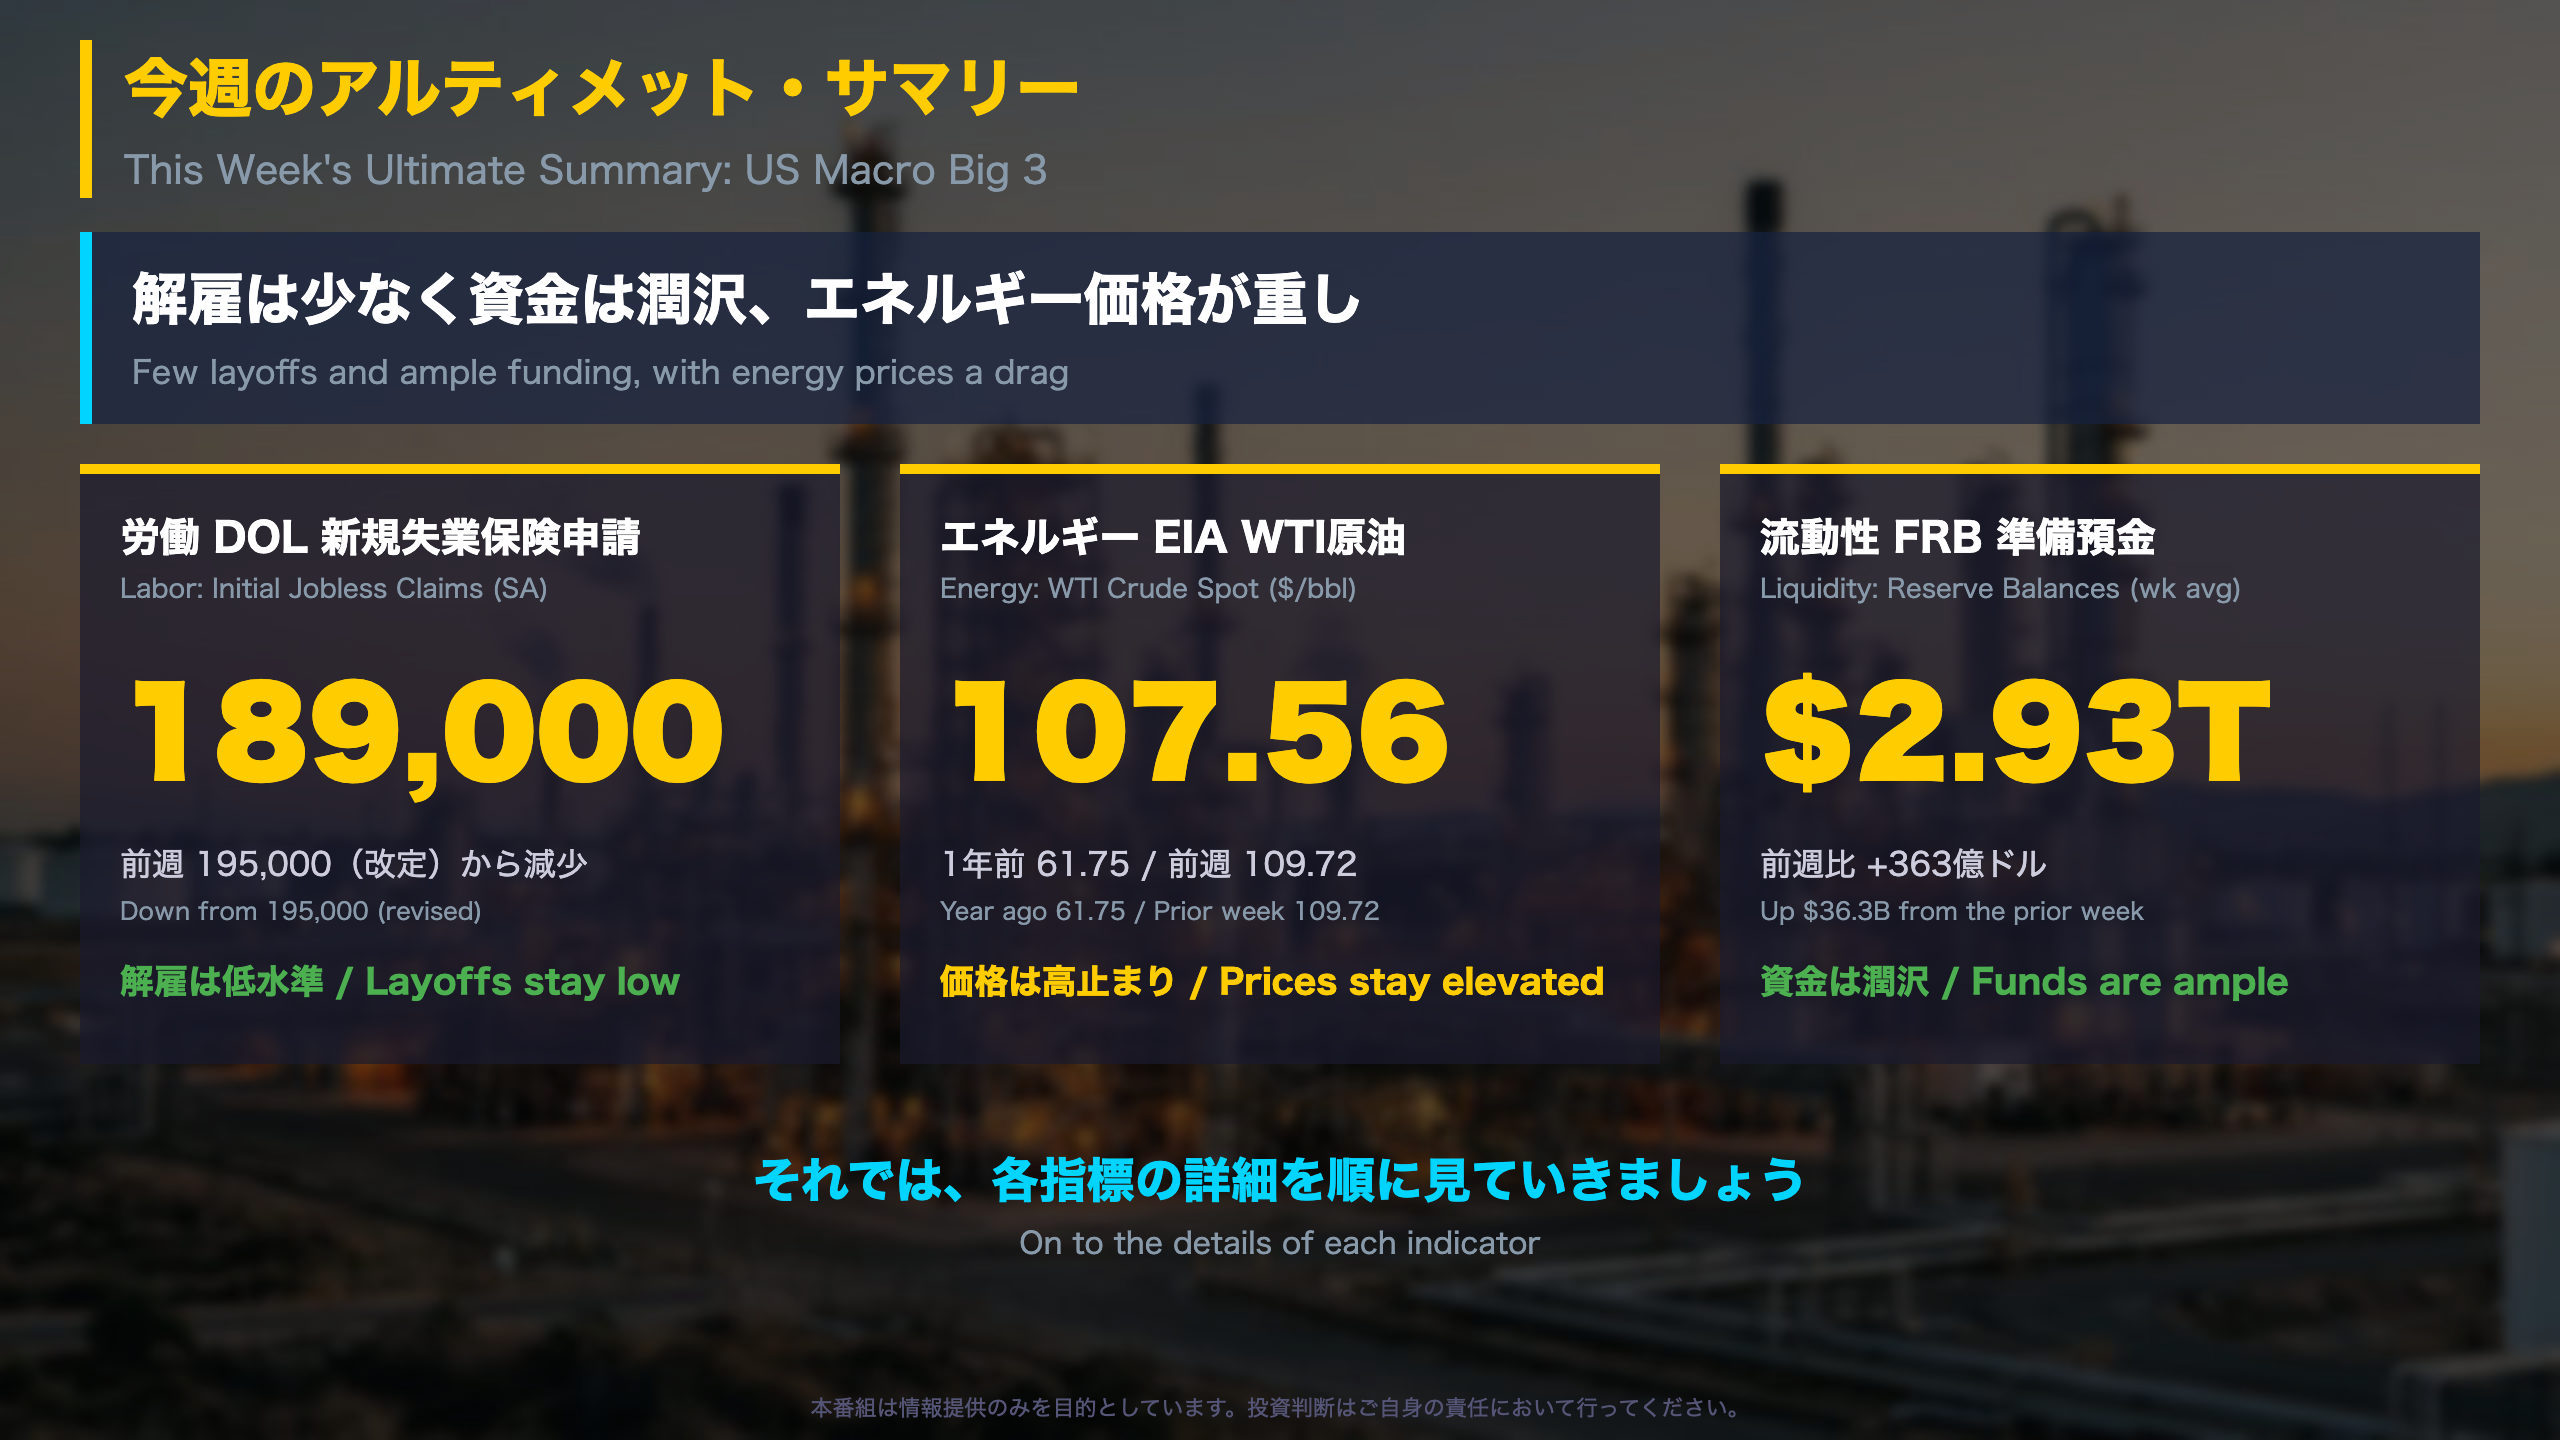
今週のアルティメット・サマリー
Three weekly gauges, one picture
This review combines labor (the Department of Labor, DOL), energy (the Energy Information Administration, EIA) and liquidity (the Federal Reserve’s H.4.1 balance sheet release). Together they cover who is losing jobs, what energy costs, and how much cash sits in the banking system.
Headline figures
- Initial jobless claims (seasonally adjusted): 189,000, versus 195,000 revised the prior week and 228,000 a year ago.
- WTI spot: $107.56 per barrel, versus $109.72 a week earlier and $61.75 a year earlier.
- Fed reserve balances (weekly average): $2.93 trillion, up about $36.3 billion from the prior week.
Our regime model
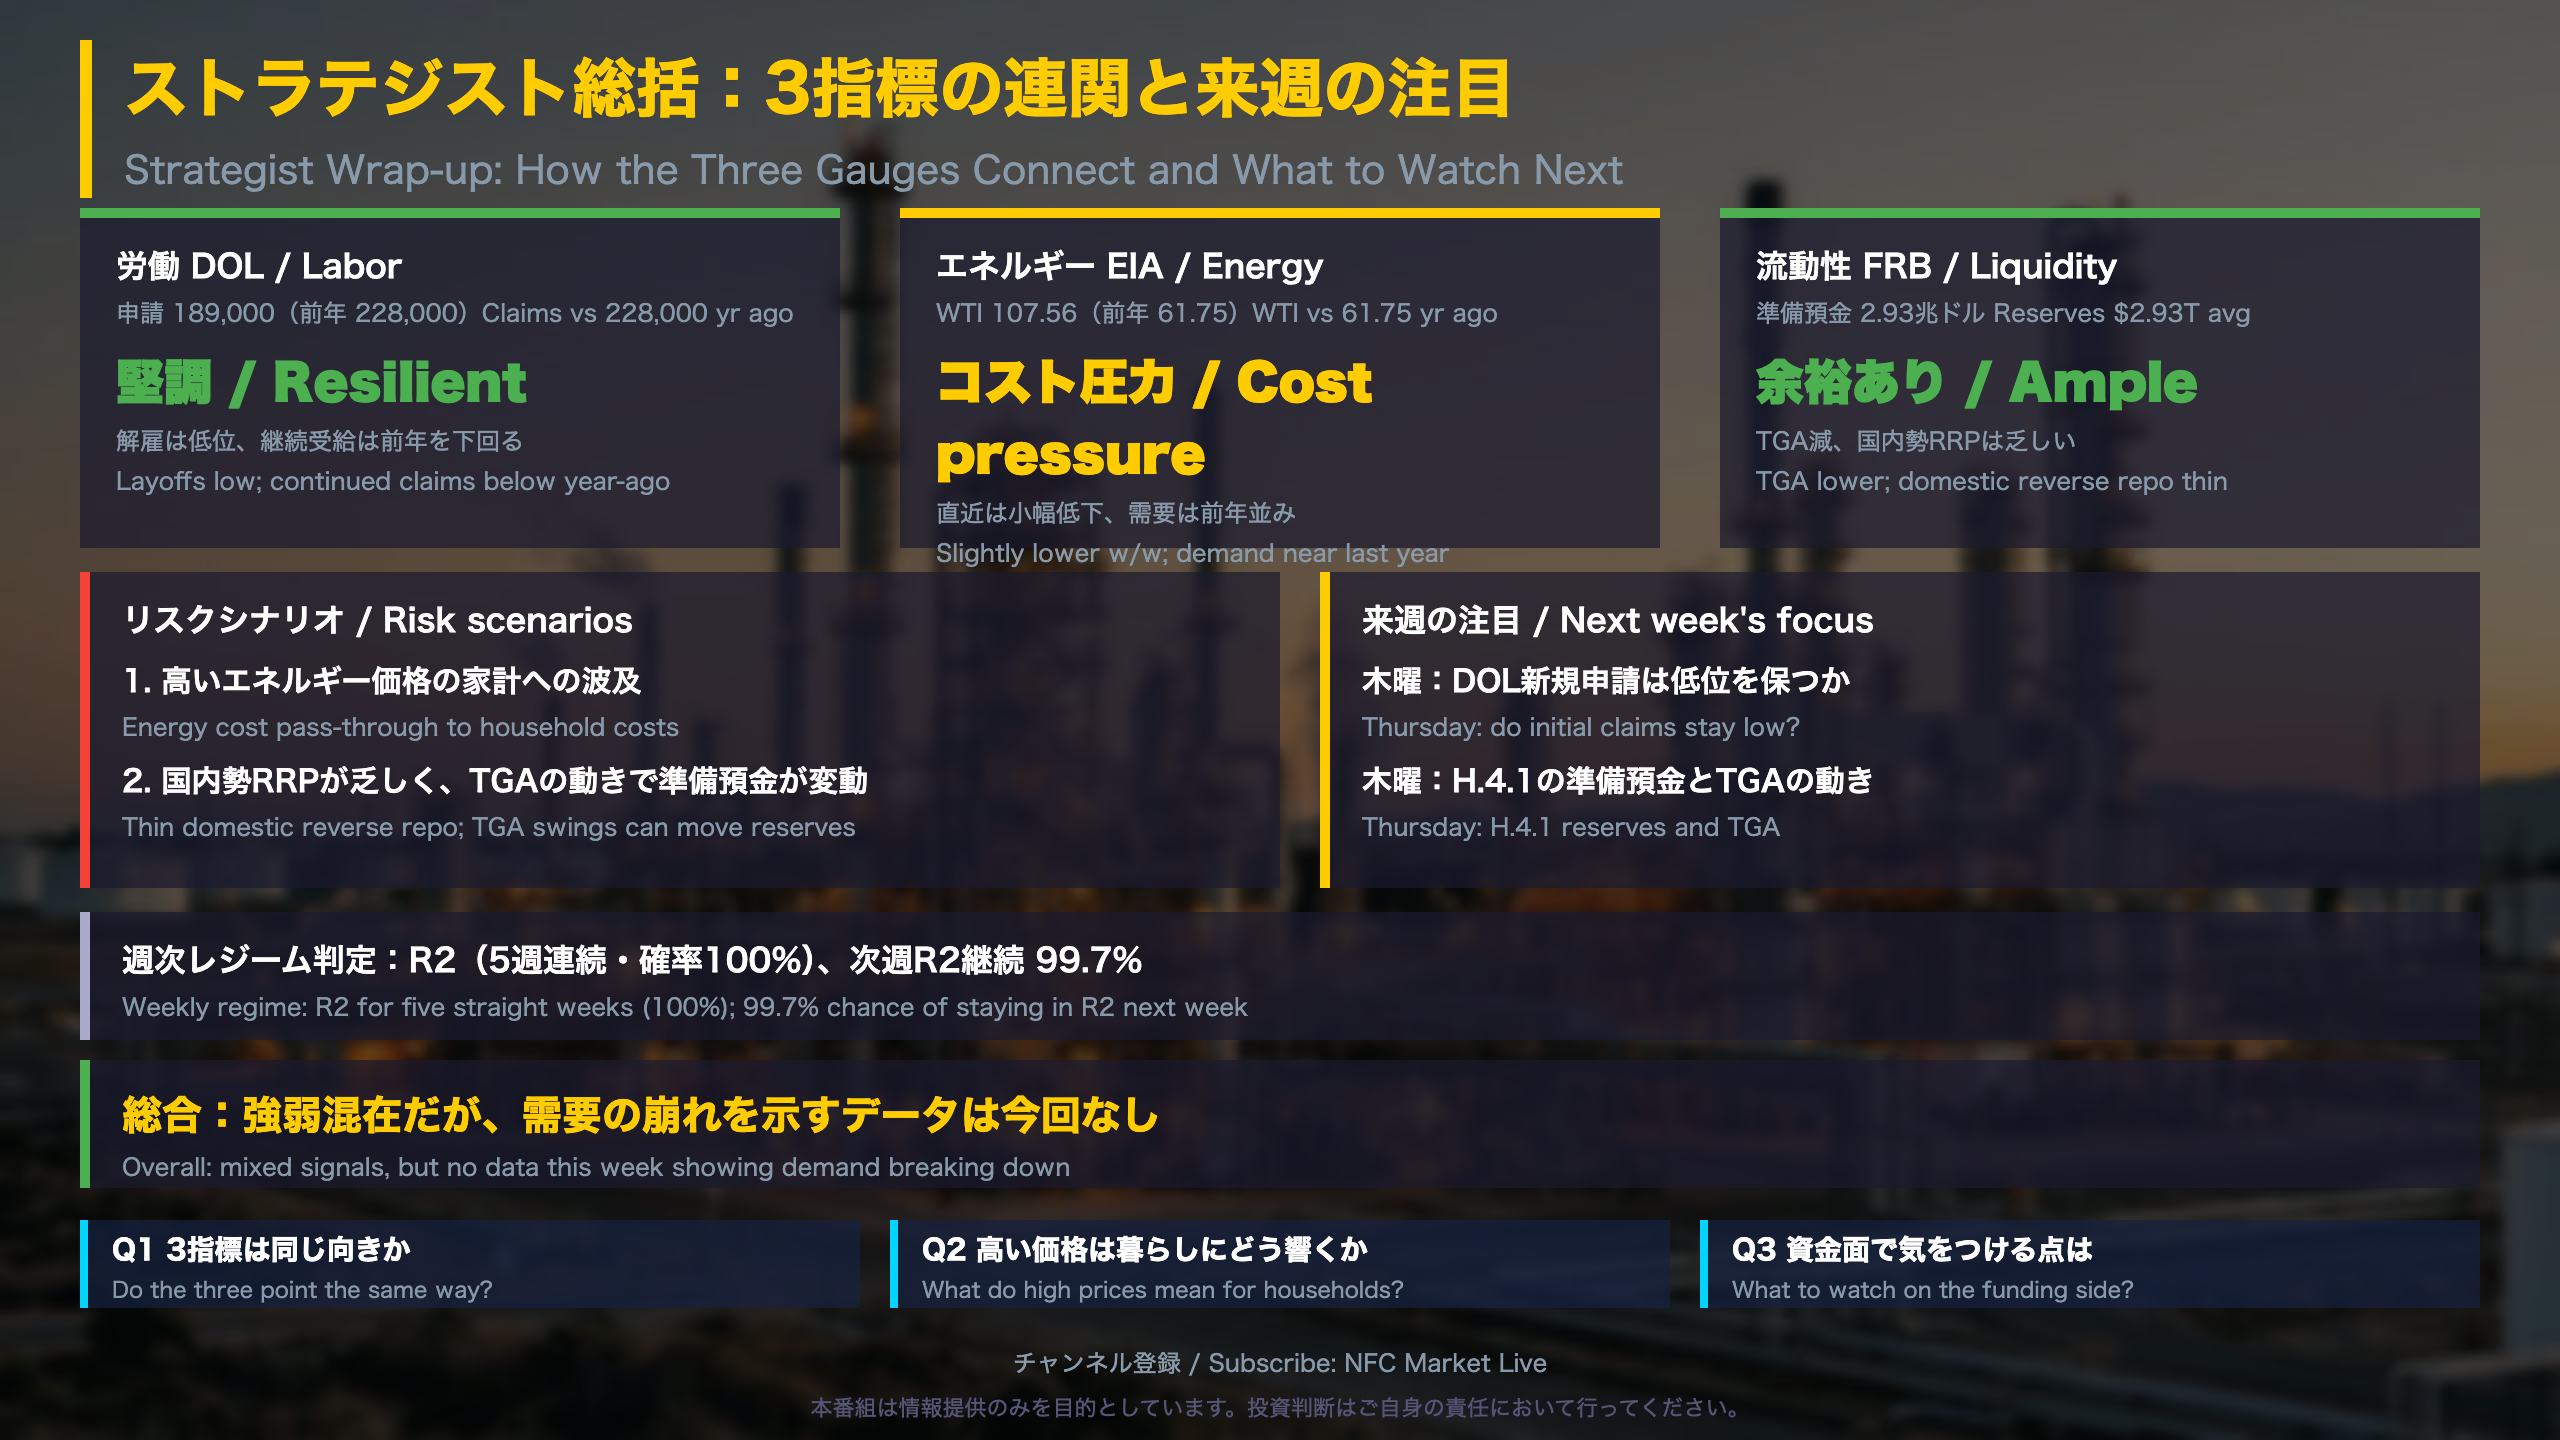
The weekly hidden Markov regime model has read R2 for five straight weeks with 100% probability, and puts next week’s chance of staying in R2 at 99.7%. Its extended indicators flag BLS CPI gasoline (34.2% y/y) and energy (20.4% y/y) as far from the R2 norm.
Caveat
The three reports cover different reference periods. The EIA highlights text supplied was for the week ending September 11, so we rely on the tables through October 30. Unlike the Fed’s FOMC decisions, none of these weekly series moves policy directly, but they frame the data investors weigh between meetings.
労働市場の現在地(DOL 新規失業保険申請)
Context: a 2026 low, tied
The Department of Labor’s weekly claims report is the most timely read on U.S. layoffs. Seasonally adjusted initial claims of 189,000 equal the July 18 reading and are the lowest in the 2026 weekly table, which has ranged from 189,000 to 230,000. A year ago the figure was 228,000. The four-week average, 194,750, compares with 225,500 a year earlier.
Continued claims and sub-indicators
- Insured unemployment (continued claims, SA): 1.718 million, versus 1.962 million a year ago; insured unemployment rate 1.1% versus 1.3%.
- Federal employee initial claims: 552, versus 9,436 a year earlier.
- Highest insured unemployment rates: New Jersey (2.0%), Washington (1.8%), California and Massachusetts (1.7%).
Seasonal quirks
Unadjusted claims fell 1.6% when seasonal factors had expected a 1.4% rise, which magnifies the adjusted decline. The DOL notes that weekly claims are ‘difficult to seasonally adjust’, so single-week moves deserve caution.
How to read it
The bullish reading is persistently low layoffs. The caution is that claims measure firings, not hiring, and continued claims rose by 23,000 on the week. Compared with the Fed’s focus on the unemployment rate in the monthly BLS jobs report, claims are a faster but noisier signal. We would watch whether next week’s print stays near the bottom of this year’s range.
エネルギー需給の現在地(EIA 週間石油状況)
Refining, inventories and prices in detail
The EIA’s Weekly Petroleum Status Report tracks U.S. crude, fuel stocks, refinery runs and implied demand, and is a common high-frequency input for energy-driven inflation. Unlike the CPI, it arrives weekly and shows prices before they pass through to consumers.
Refining and demand (four-week averages)
- Crude input to refineries: 16.63 million b/d (15.33 million a year ago)
- Utilization: 93.6% (93.1% prior week; 86.7% a year ago)
- Total products supplied: 21.19 million b/d, versus 20.34 million a year ago; gasoline 8.64 million b/d versus 8.68 million
Stocks (million barrels)
Commercial crude 409.8 (421.2 a year ago), gasoline 209.0 (206.0), distillate 99.3 (111.5). The Strategic Petroleum Reserve stands at 282.2, versus 409.6 a year ago.
Prices
Retail regular gasoline was $4.153 per gallon versus $3.019 a year ago; diesel was $6.292 versus $3.753. WTI spot was $107.56 versus $61.75.
Reading the data
Stable demand and high refinery utilization suggest the supply chain is working, which is the constructive view. The cautious view is that price levels remain far above last year and distillate and SPR stocks are lower. Note that the highlights text supplied referred to September, so we used the tables through October 30. For international comparison, the Fed watches energy through headline CPI, where our regime model flags gasoline CPI at 34.2% y/y.
FRB流動性の現在地(H.4.1 バランスシート)
H.4.1 in detail
The Federal Reserve’s H.4.1 release is the weekly balance sheet showing the factors that supply and absorb bank reserves. Unlike the Bank of Japan’s monthly accounts, it is published every Thursday and is a standard liquidity gauge for U.S. money markets.
Assets (weekly average)
- Reserve Bank credit: $6.70T (-$4.3B w/w, +$150.3B y/y)
- Treasuries: $4.58T (+$385.2B y/y), of which bills $573.1B (+$377.6B y/y)
- Mortgage-backed securities: $1.88T (-$6.7B w/w, -$186.4B y/y)
Liabilities and reserves
- Reserve balances: $2.93T (+$36.3B w/w, +$67.5B y/y); Wednesday level $2.96T
- Treasury General Account: $957.2B average (-$42.6B w/w); Wednesday $936.2B, down $79.4B from the prior Wednesday
- Reverse repo: $341.0B average (-$46.8B y/y); foreign official $338.2B, others only $2.7B
Interpretation
The constructive view is that reserves are higher than a year ago and lending through the discount window is small (primary credit about $10B). The cautious view is that domestic reverse repo balances are very small, so the Treasury account can swing reserves more easily. Compared with the ECB and the Bank of Japan, which are still shrinking balance sheets, the Fed’s holdings are above year-ago levels in this release.
ストラテジスト総括:3指標の連関と来週の注目シナリオ
Reading the three gauges together
| Axis | This week’s signal | Direction |
|---|---|---|
| Labor | Claims 189,000 (228,000 a year ago); continued claims below year-ago | Resilient |
| Energy | WTI $107.56 ($61.75 a year ago), slightly lower w/w, demand near last year | Cost pressure (possible easing) |
| Liquidity | Reserves $2.93T, TGA lower, domestic reverse repo thin | Ample, thin buffer |
Same direction or mixed?
Labor and liquidity point the same way; energy points the other way. The balanced read is therefore mixed, but there is no sign in this week’s data that demand is breaking. One week of data cannot establish a structural trend.
Risk scenarios to monitor
- Energy cost pass-through: retail gasoline at $4.153 and diesel at $6.292 are far above last year. Watch whether this shows up in household-facing data such as CPI.
- Thin funding buffer: with non-foreign reverse repo at only $2.7 billion, swings in the Treasury General Account could move reserves more.
What to check next week
The next DOL claims release (Thursday) will show whether claims stay near the bottom of 2026’s range (189,000 to 230,000), and H.4.1 will update reserves ($2.93T average) and the TGA ($957B). Dates for other releases such as the jobs report, CPI and FOMC were not in the source material, so check official calendars. For investors outside the U.S., the contrast with Japan is that these Fed data move weekly while many BOJ-related gauges are monthly. Our weekly regime model remains in R2 with a 99.7% chance of staying there next week.
Disclaimer: This article is for informational purposes only. All investment decisions are made solely at your own risk.