
📺 Watch the Full Video Analysis
This article was automatically generated by the NFC Market Live AI analysis system. (Updated: 2026-11-01 01:23 JST)
📄 Primary Source
米国労働省(DOL)— 新規失業保険申請件数
https://www.dol.gov/newsroom/releases/eta/eta20261029
米国エネルギー情報局(EIA)— 週間石油状況レポート
https://www.eia.gov/petroleum/supply/weekly/pdf/highlights.pdf
連邦準備制度理事会(FRB)— H.4.1 バランスシート
https://www.federalreserve.gov/releases/h41/current/h41.htm
📊 A weekly wrap of the three key US releases: DOL jobless claims, EIA petroleum status and the Fed’s H.4.1 balance sheet.
📉 Initial claims were 194,000, below 221,000 a year earlier; the four-week average is 196,750.
⛽ WTI crude was $109.72 vs $62.27 a year ago, and retail gasoline and diesel are also higher year on year.
💡 Fed reserve balances averaged about $2.89 trillion: down on the week as the Treasury account rose, but still high.
⚠️ Labor and liquidity look steady while energy is the one pressure point. Next week we check whether claims and reserves hold these levels.
今週のアルティメット・サマリー
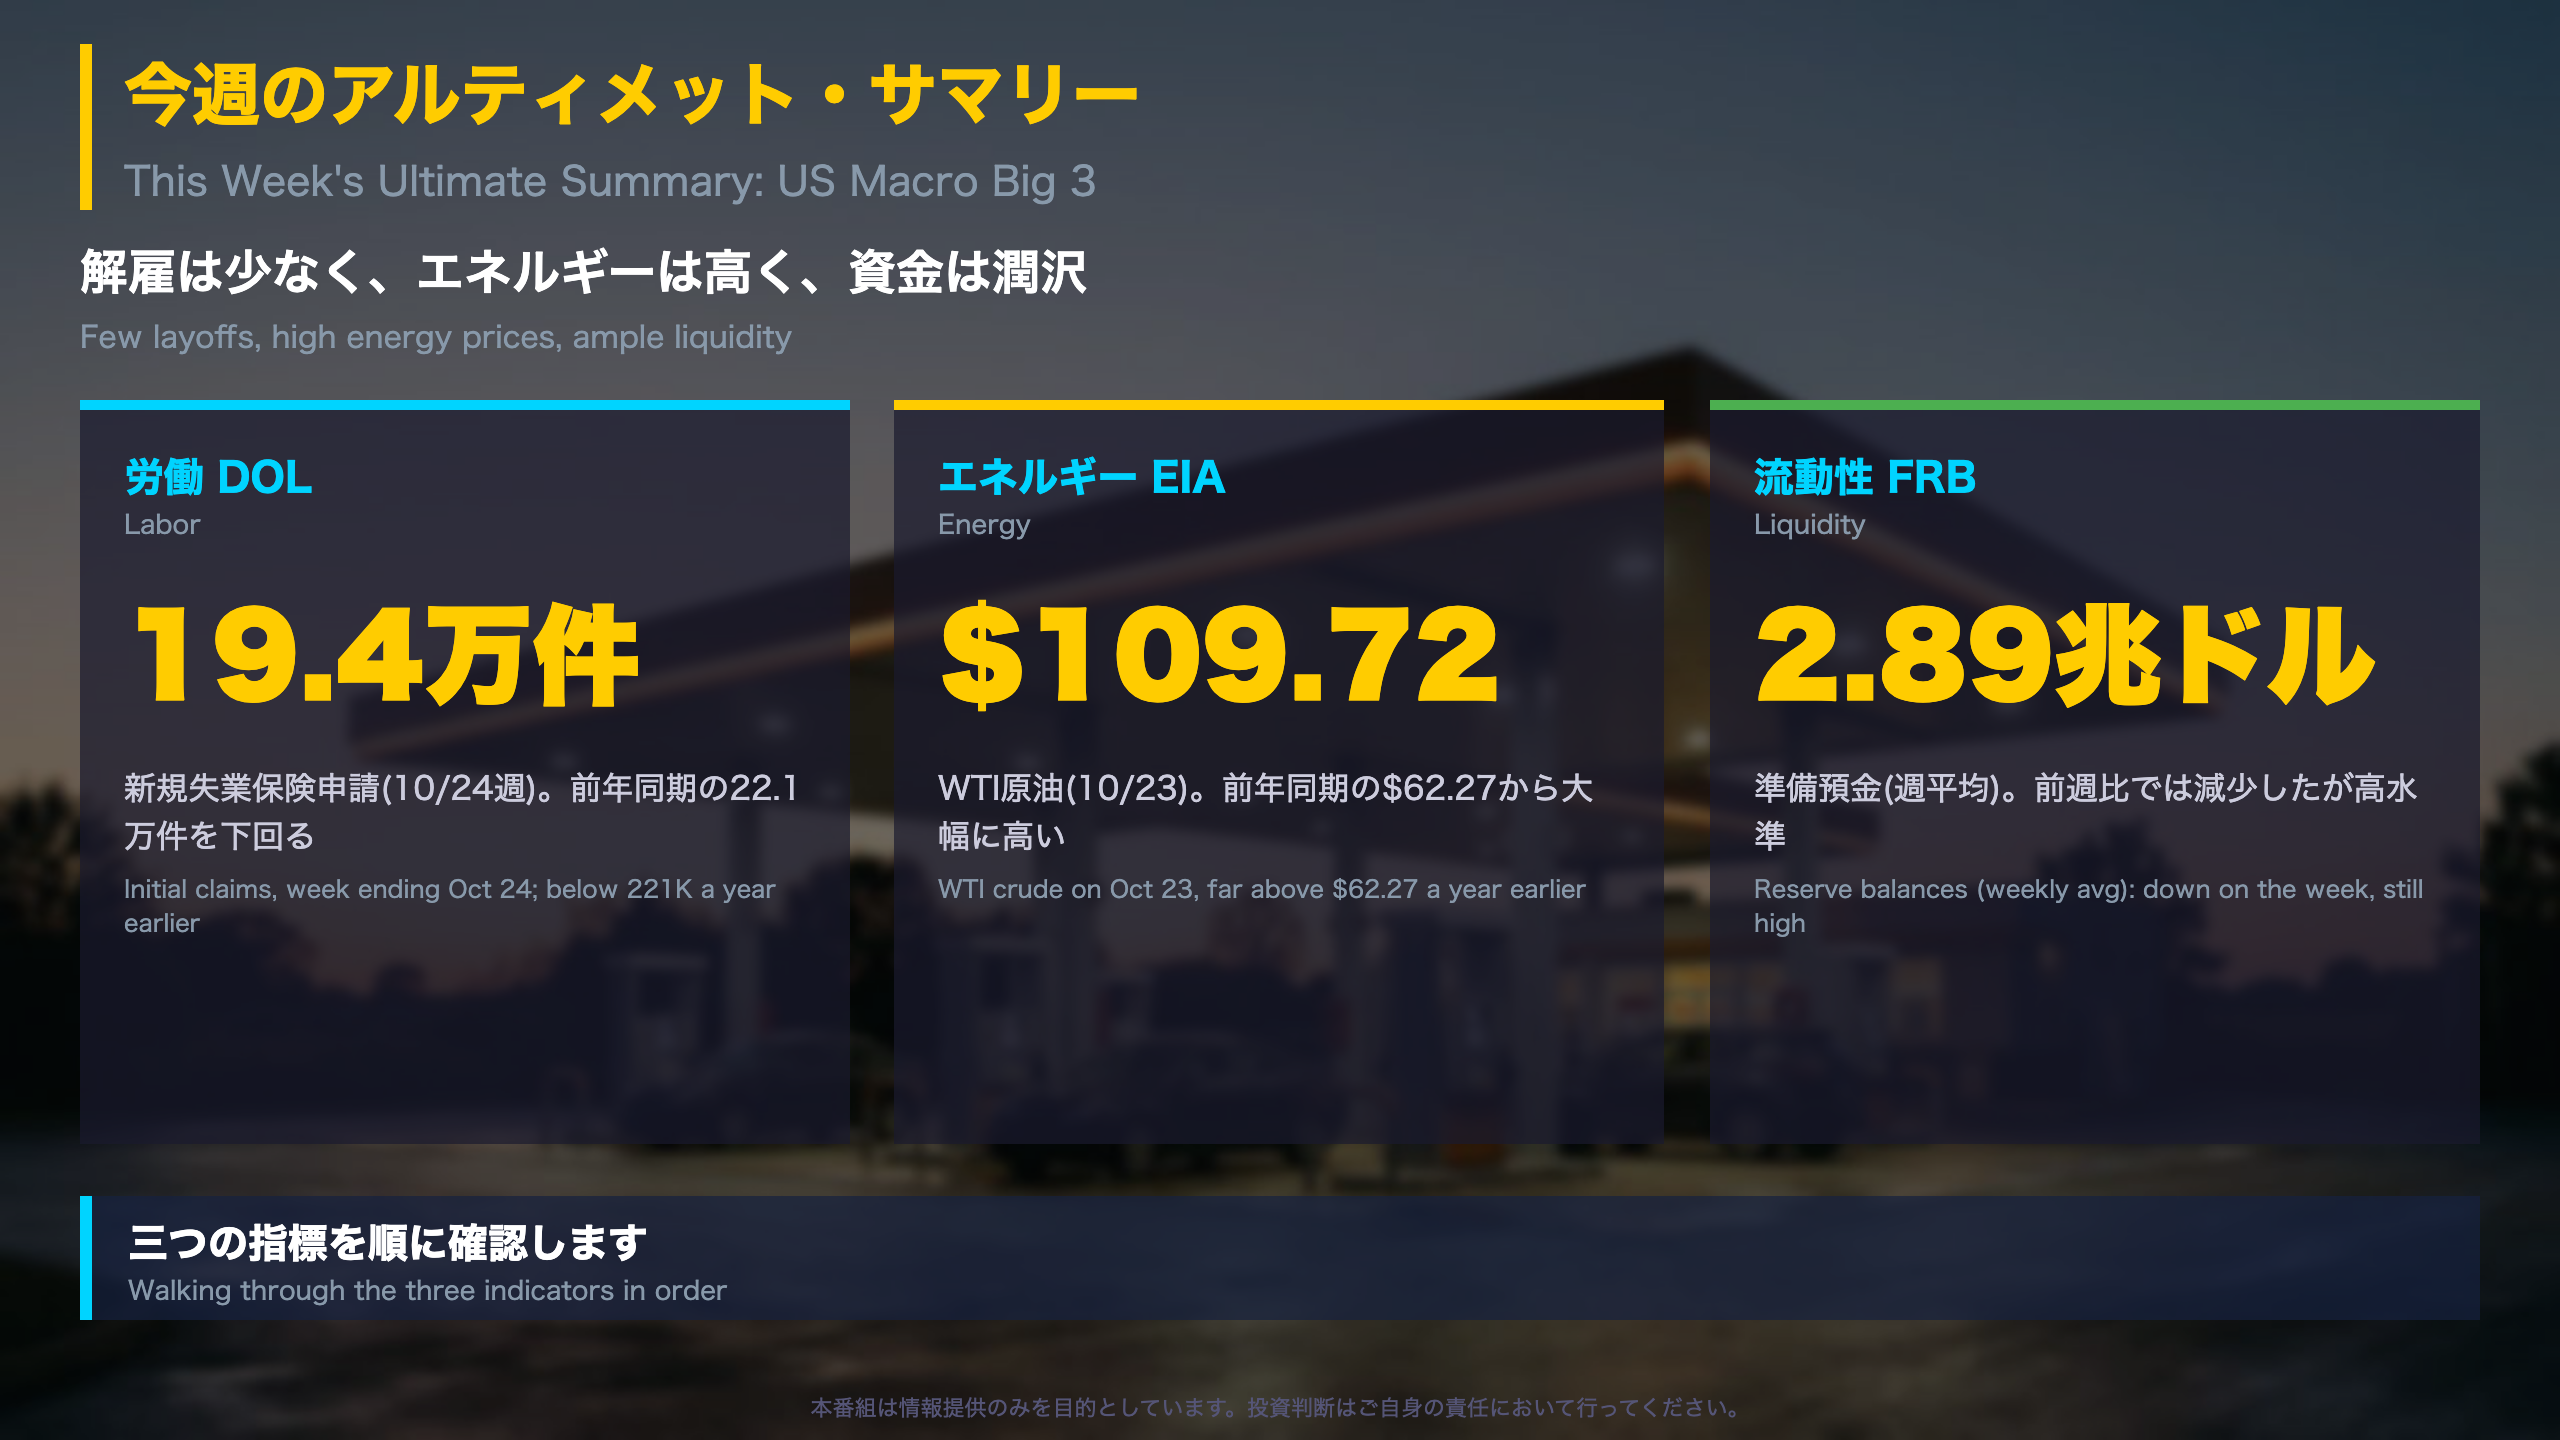
This Week’s U.S. Macro Big Three: A Composite Read
This episode combines three weekly U.S. releases: the Labor Department’s (DOL) unemployment insurance claims, the Energy Information Administration’s (EIA) Weekly Petroleum Status Report, and the Federal Reserve’s H.4.1 balance sheet release. Together they cover labor, energy and liquidity.
What each release measures
- DOL claims: new filings for jobless benefits. It is a leading indicator because it captures layoffs as they emerge, but it is volatile week to week.
- EIA weekly: US crude and fuel inventories, refinery runs and implied demand.
- Fed H.4.1: the factors that drive bank reserve balances, i.e. the cash banks hold at the Fed.
Key readings
| Item | Latest | Comparison |
|---|---|---|
| Initial claims | 194,000 | 221,000 a year ago |
| WTI | $109.72 | $62.27 a year ago |
| Reserve balances | $2.894T | -$68.8B w/w (weekly avg) |
Context
Initial claims are the third-lowest print in the 52-week table, and the four-week average of 196,750 is the lowest in that window. Unlike the monthly payrolls report, claims capture only the layoff side, not hiring.
Independent take
The signals are mixed rather than uniform: resilient labor and ample reserves on one hand, an energy price level far above last year on the other. None of this is a forecast; it frames what next week’s releases need to confirm.
Model note
Our weekly regime model (HMM) has stayed in regime R0 for five straight weeks, though the distance from the regime centroid has widened from 1.64 to 1.75.
労働市場の現在地(DOL 新規失業保険申請)
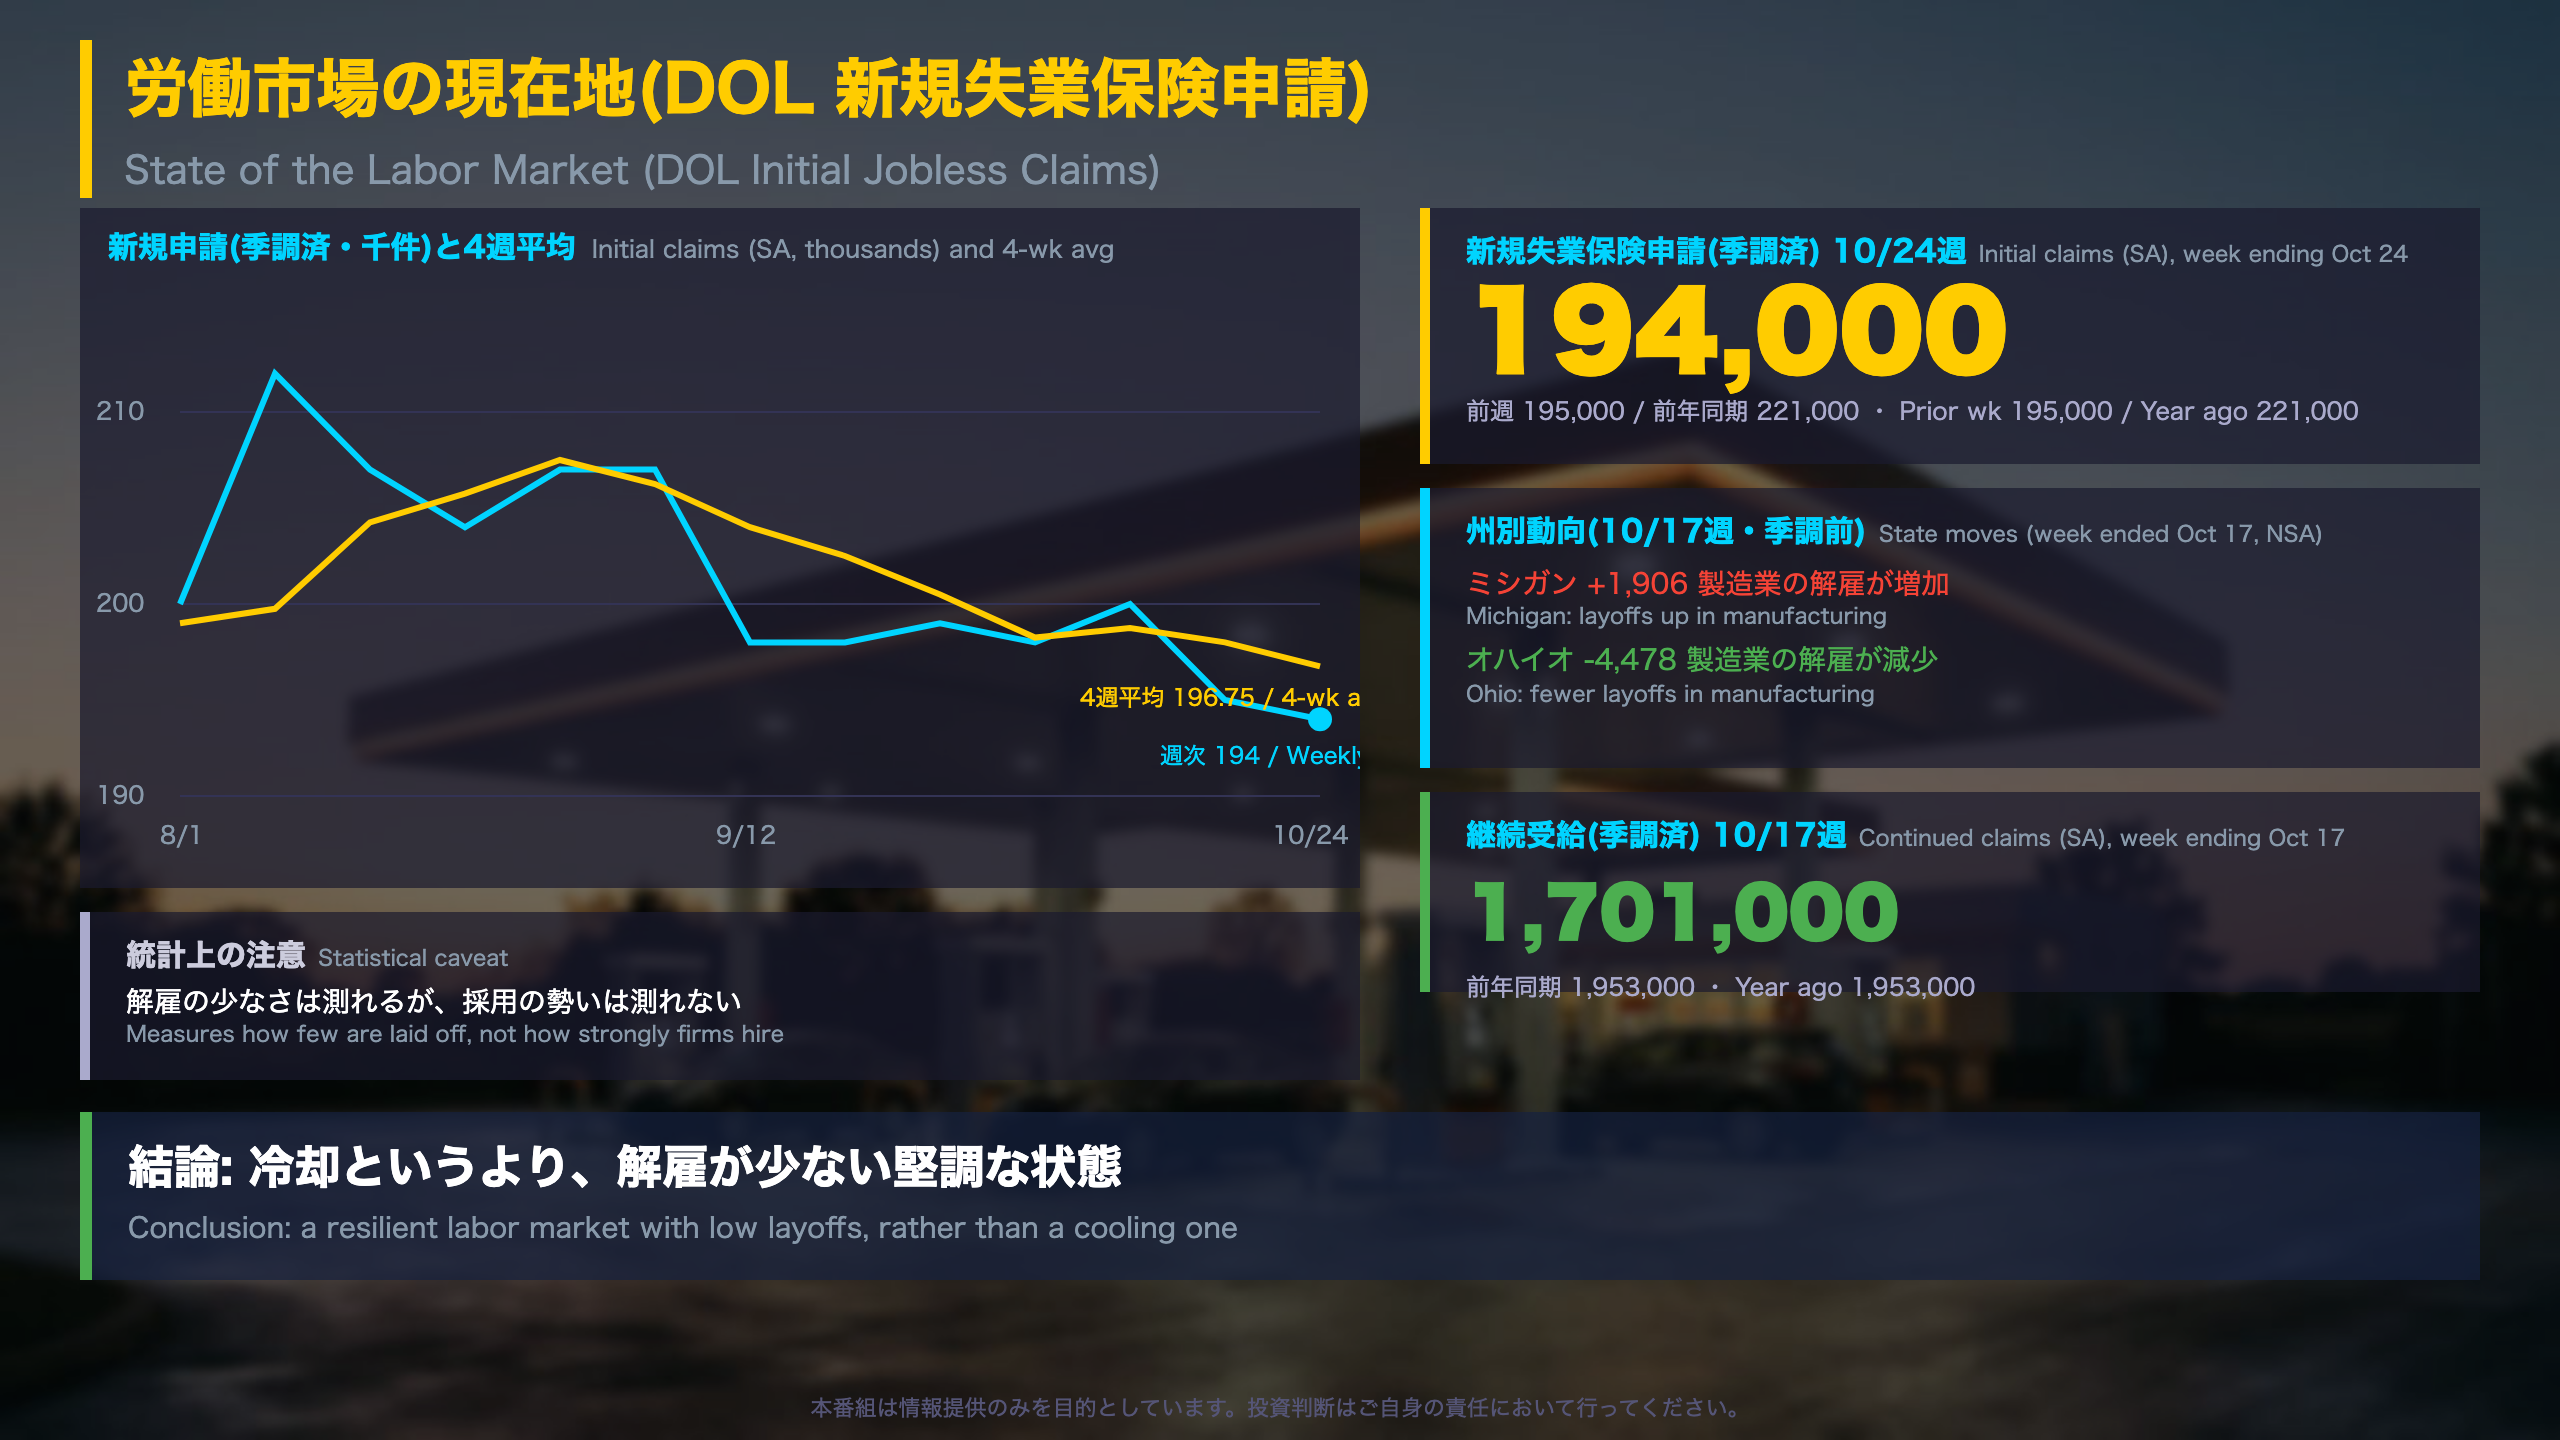
DOL Weekly Claims: Beyond the Headline
What the report is
The Labor Department’s weekly Unemployment Insurance claims release is the highest-frequency read on US layoffs. DOL itself calls initial claims “a leading economic indicator” but notes the series is “difficult to seasonally adjust” and therefore volatile.
Unadjusted detail
- Unadjusted initial claims: 178,851, up 5,648 (+3.3%). Seasonal factors had expected +6,040, so the actual rise was slightly smaller, consistent with the small seasonally adjusted decline.
- Unadjusted continued claims: 1,490,071, up 14,007 against an expected +32,725.
- Federal employee (UCFE) initial claims: 442, versus 10,064 a year earlier.
Why continued claims matter
Continued claims roughly coincide with the cycle and confirm direction; they are not a leading indicator. At 1.70 million (seasonally adjusted) versus 1.95 million a year ago, they show no build-up of long-term insured unemployment.
Two readings
Resilient view: layoffs are low and stable. Cautious view: claims are blind to weak hiring, and a single week can mislead. State data show Michigan manufacturing layoffs rising (+1,906) while Ohio’s fell (-4,478).
Data caveat
The table lists Illinois’ insured unemployment rate at 13.1, an order of magnitude above other states. It looks like a typo, and we do not rely on it.
What to watch
A sustained move of initial claims well above 200,000, or manufacturing layoffs spreading across states, would change the picture.
エネルギー需給の現在地(EIA 週間石油状況)
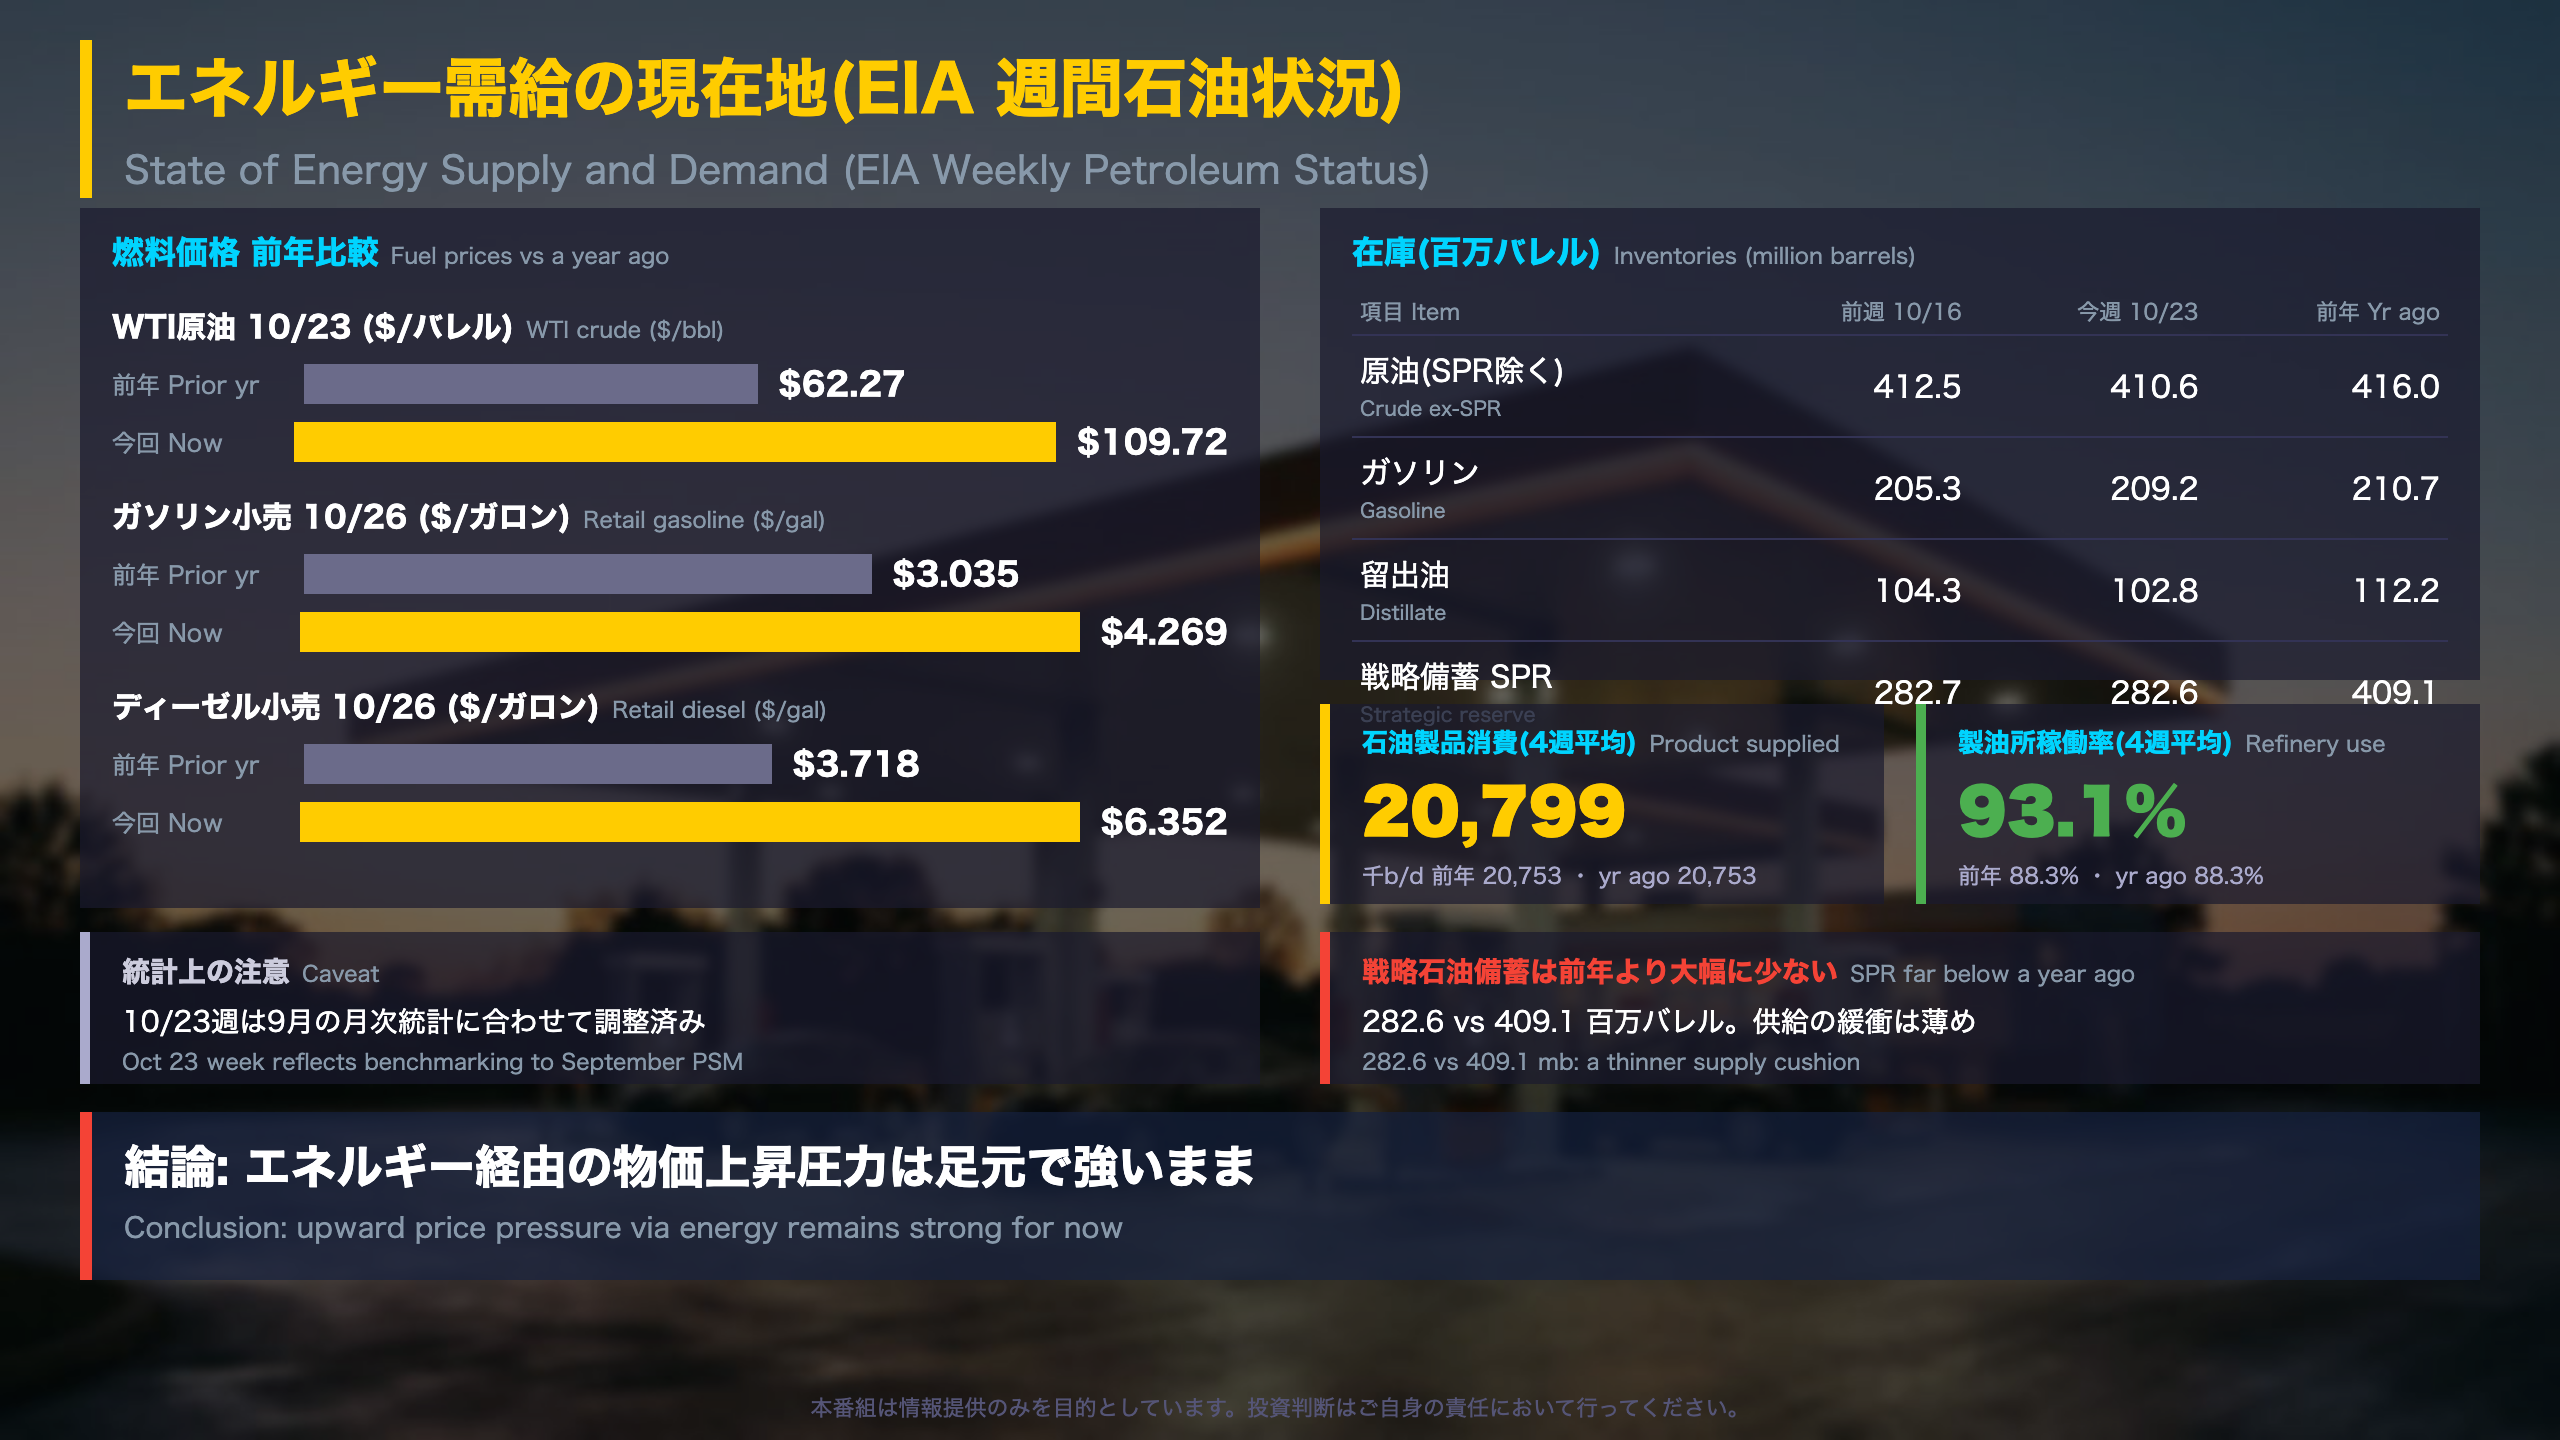
EIA Weekly Petroleum Status Report: Stocks, Demand and Prices
Reading the release
The EIA’s weekly report tracks US crude and product inventories, refinery runs, imports and “product supplied”, the standard proxy for consumption. Note that the highlights paragraph in the document refers to the week ending September 11; this note uses the October 23 tables. Those figures reflect benchmarking to the September Petroleum Supply Monthly (July data).
Inventories (million barrels)
| Item | Oct 16 | Oct 23 | Year ago |
|---|---|---|---|
| Commercial crude | 412.5 | 410.6 | 416.0 |
| Gasoline | 205.3 | 209.2 | 210.7 |
| Distillate | 104.3 | 102.8 | 112.2 |
| SPR | 282.7 | 282.6 | 409.1 |
Demand and prices
Four-week total product supplied is 20.8 million b/d, essentially flat year on year (20.75 million). Yet WTI is $109.72 vs $62.27, retail regular gasoline $4.269 vs $3.035 and on-highway diesel $6.352 vs $3.718. Refinery utilization is 93.1% vs 88.3% a year ago.
Two readings
Resilient demand: consumption has not fallen despite far higher prices. Thin buffers: distillate stocks are below last year and the SPR is about 126 million barrels smaller, so there is less cushion if supply is disrupted.
Inflation link
In the BLS CPI data used by our model, gasoline was up 34.2% and energy 20.4% year on year, so the energy channel is visible in headline inflation. This is a description of the data, not a forecast.
FRB流動性の現在地(H.4.1 バランスシート)
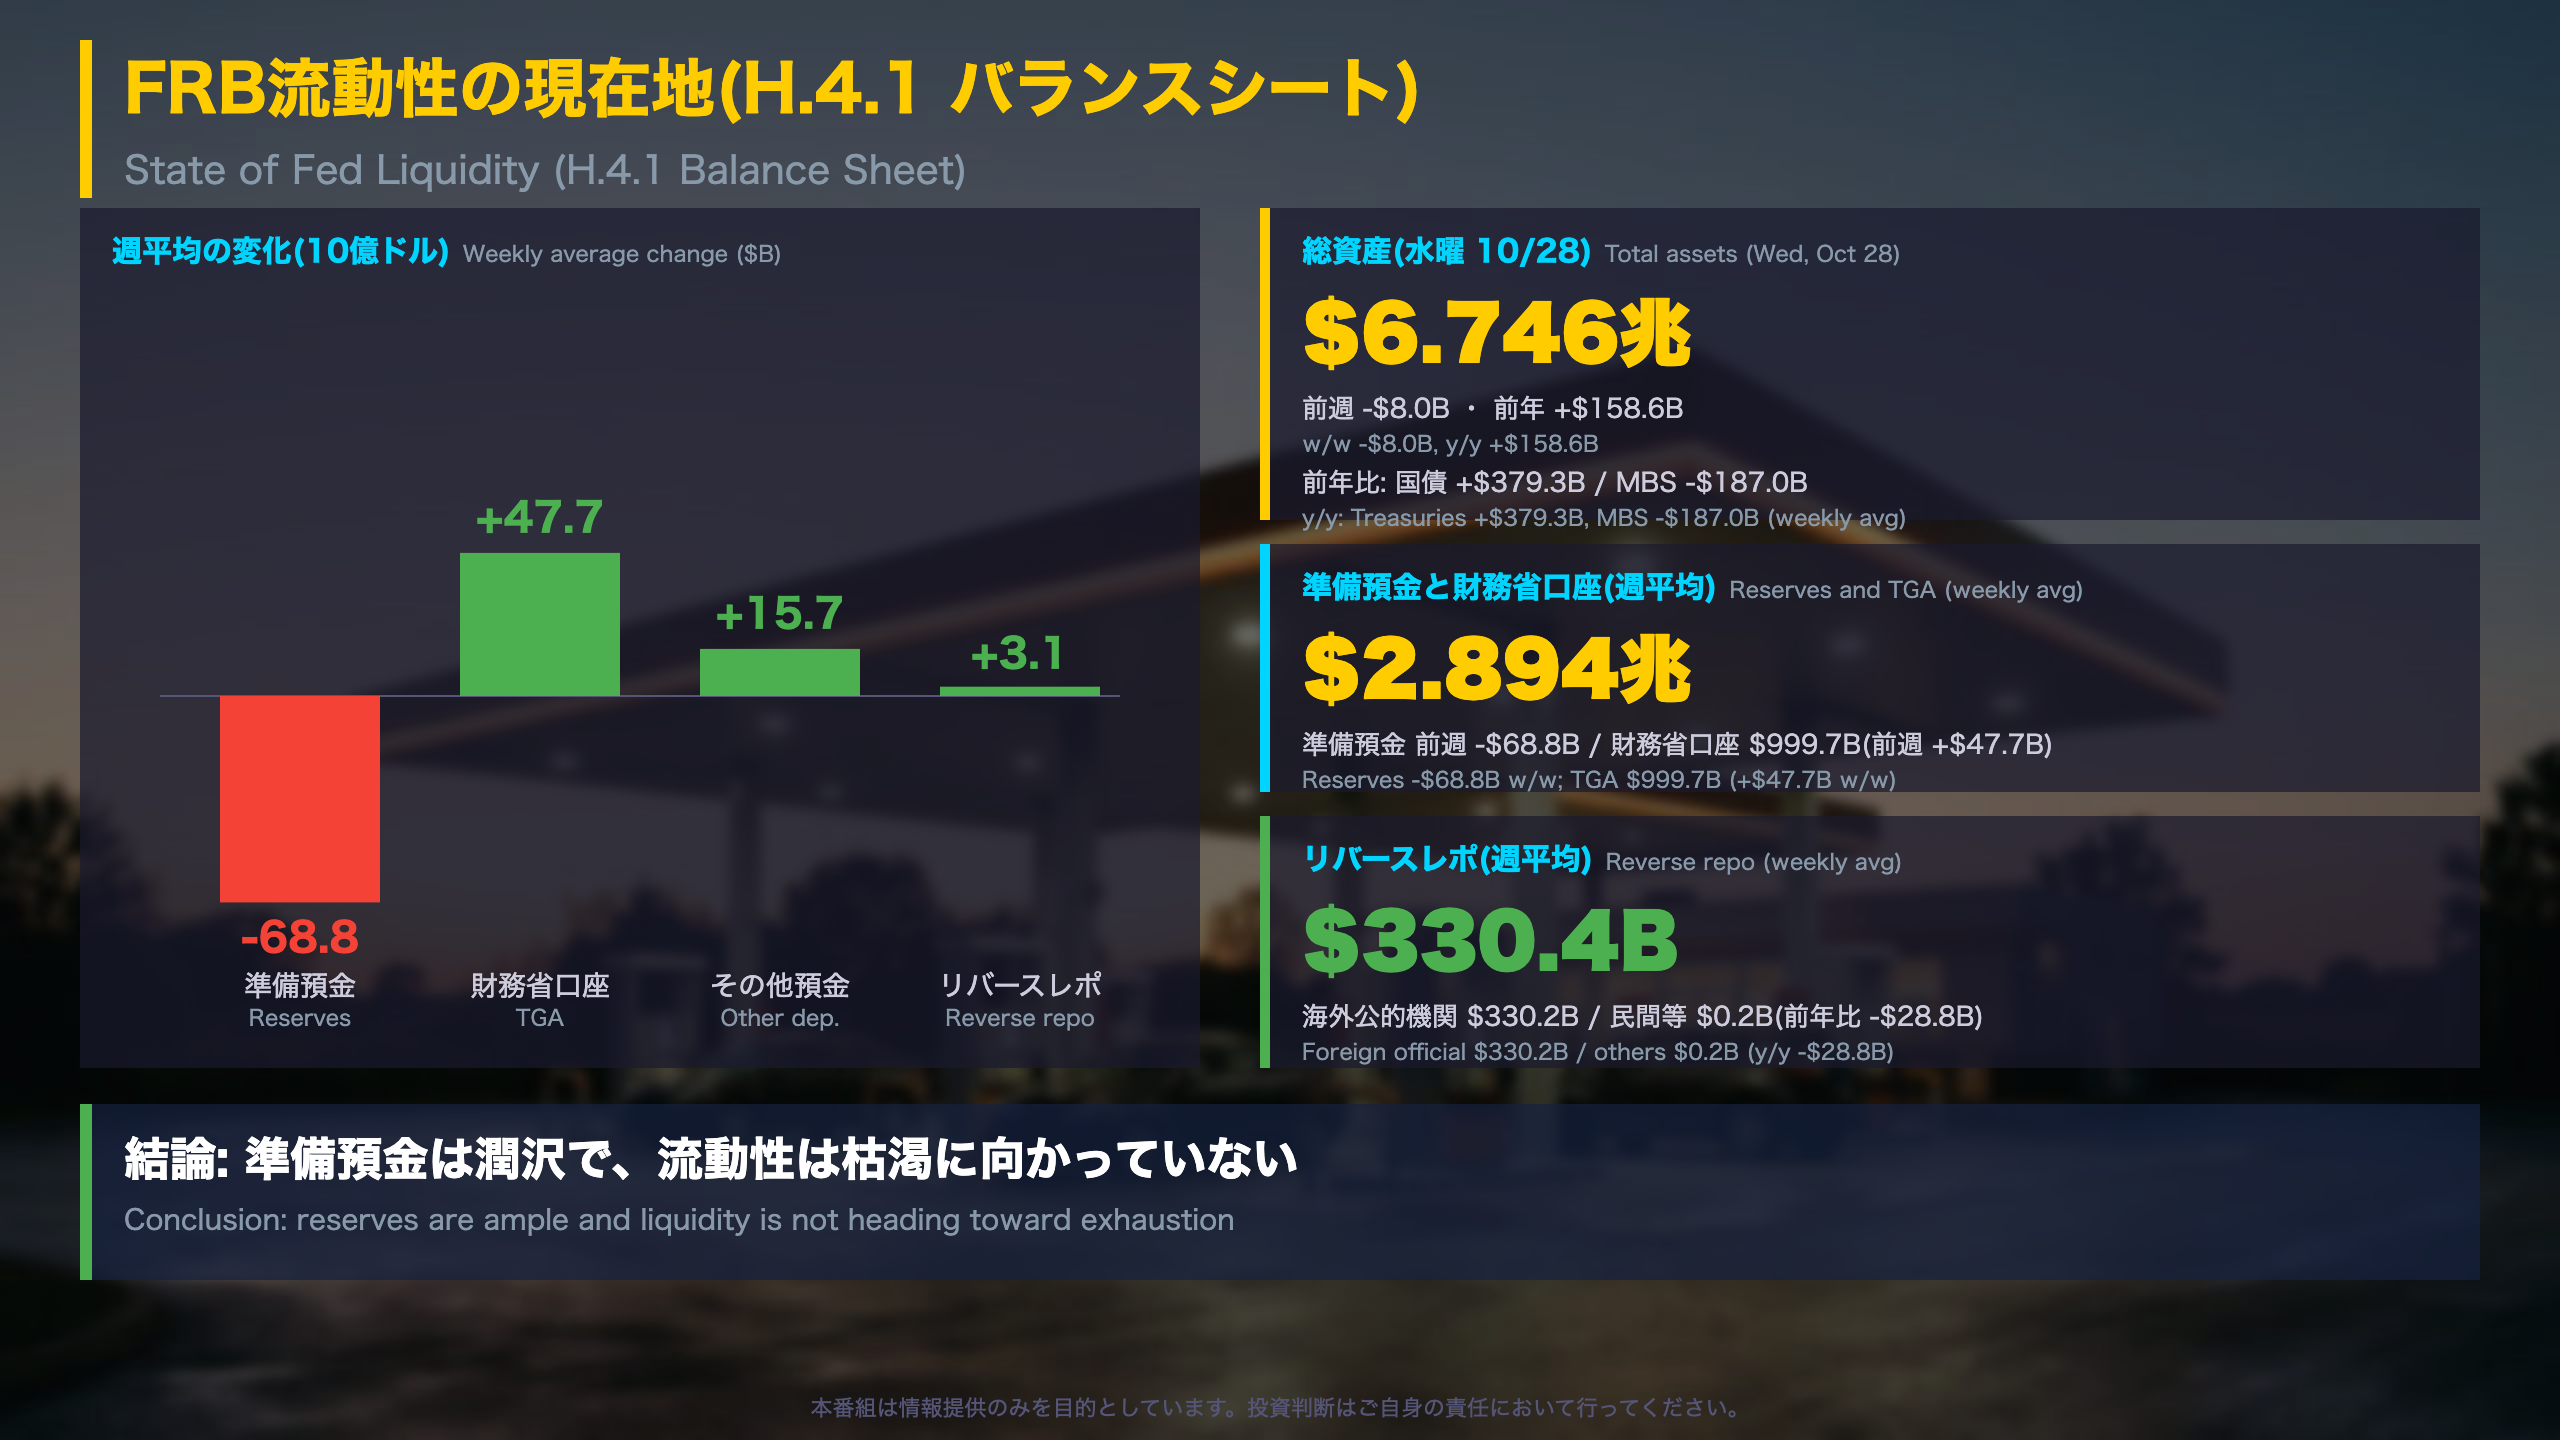
Fed H.4.1: What Sits Inside the Balance Sheet
What the release is
The H.4.1 is the Federal Reserve’s weekly statement of “Factors Affecting Reserve Balances”. Reserve balances are the deposits commercial banks hold at the Fed, the core of system liquidity. Unlike the ECB or BOJ, which publish similar weekly or daily statements, the H.4.1 also lays out the Treasury General Account (TGA), a key swing factor.
Asset side (weekly averages)
- Securities held outright: $6.468T (-$2.4B w/w; +$192.3B y/y)
- Treasuries: $4.576T (+$4.7B w/w), with bills up $375.5B y/y
- MBS: $1.890T, down $187.0B y/y
Bills are rising while MBS run off, so the portfolio is changing in composition rather than clearly shrinking.
Liability side
- Reserve balances: $2.894T (-$68.8B w/w)
- TGA: $999.7B (+$47.7B w/w)
- Reverse repo: $330.4B, of which foreign official accounts hold $330.2B and others just $0.2B
Independent reading
With the private overnight reverse repo pool nearly empty, there is little left to absorb TGA swings, so they now pass more directly into reserves. That is a description of the plumbing, not a call on markets. Separately, the table shows a deferred asset of $232.5B, meaning remittances to Treasury remain suspended.
What to watch
Whether the TGA climbs further above $1T and whether reserves hold near $2.9T.
ストラテジスト総括:3指標の連関と来週の注目

Strategist Wrap-Up: Linking the Three Indicators
Signal map
| Area | Direction | Evidence |
|---|---|---|
| Labor | Resilient | Claims 194,000; continued 1.70M (1.95M a year ago) |
| Energy | Price pressure | WTI $109.72 vs $62.27; retail gasoline $4.269 |
| Liquidity | Ample | Reserves $2.894T (weekly avg) |
The three do not point in exactly the same direction. Two are steady, and energy is the single pressure point.
How they connect
Low layoffs alongside costly energy imply that households are supported by jobs while fuel costs weigh more than a year ago. These releases do not measure purchasing power, so retail sales and CPI are the places to verify. For context, the BLS CPI figures in our model show gasoline +34.2% and energy +20.4% year on year.
Next-week checklist
- Weekly claims: do they stay near 200,000?
- The October payrolls report and CPI: how does the energy component evolve?
- Treasury account vs reserve balances: does the TGA build above $1T?
Risk scenarios
- Manufacturing layoffs, so far concentrated in a few states such as Michigan, broaden.
- High oil prices begin to dent demand, which is flat year on year for now.
Model note
Our weekly HMM has been in regime R0 for five weeks with a 99.6% probability of staying there, but the distance from the regime centroid has widened from 1.64 to 1.75. This is a statistical model output, not an official release, and is not a forecast.
Disclaimer: This article is for informational purposes only. All investment decisions are made solely at your own risk.