
This article was automatically generated by the NFC Market Live AI analysis system. (Updated: 2026-10-31 18:00 JST)
📄 Primary Source
米国労働省(DOL)— 新規失業保険申請件数
https://www.dol.gov/newsroom/releases/eta/eta20261029
米国エネルギー情報局(EIA)— 週間石油状況レポート
https://www.eia.gov/petroleum/supply/weekly/pdf/highlights.pdf
連邦準備制度理事会(FRB)— H.4.1 バランスシート
https://www.federalreserve.gov/releases/h41/current/h41.htm
📊 A one-stop walk through this week’s three US macro releases: labor, energy and liquidity.
💼 Initial jobless claims were 194,000 (prior week revised to 195,000), staying low; continued claims were 1,701,000, well below a year earlier.
🛢️ In the EIA report, WTI was $109.72 vs $62.27 a year ago. Crude stocks fell 1.9M barrels while gasoline stocks rose 3.9M.
🏦 Fed H.4.1: reserve balances of about $2.89T are above last year’s level, but fell last week as the Treasury General Account grew.
💡 Labor and liquidity look stable; energy is the lone headwind. We watch next week’s claims and reserves.
⚠️ The EIA report’s opening summary covers a September week, so we use the Oct 23 tables.
今週のアルティメット・サマリー
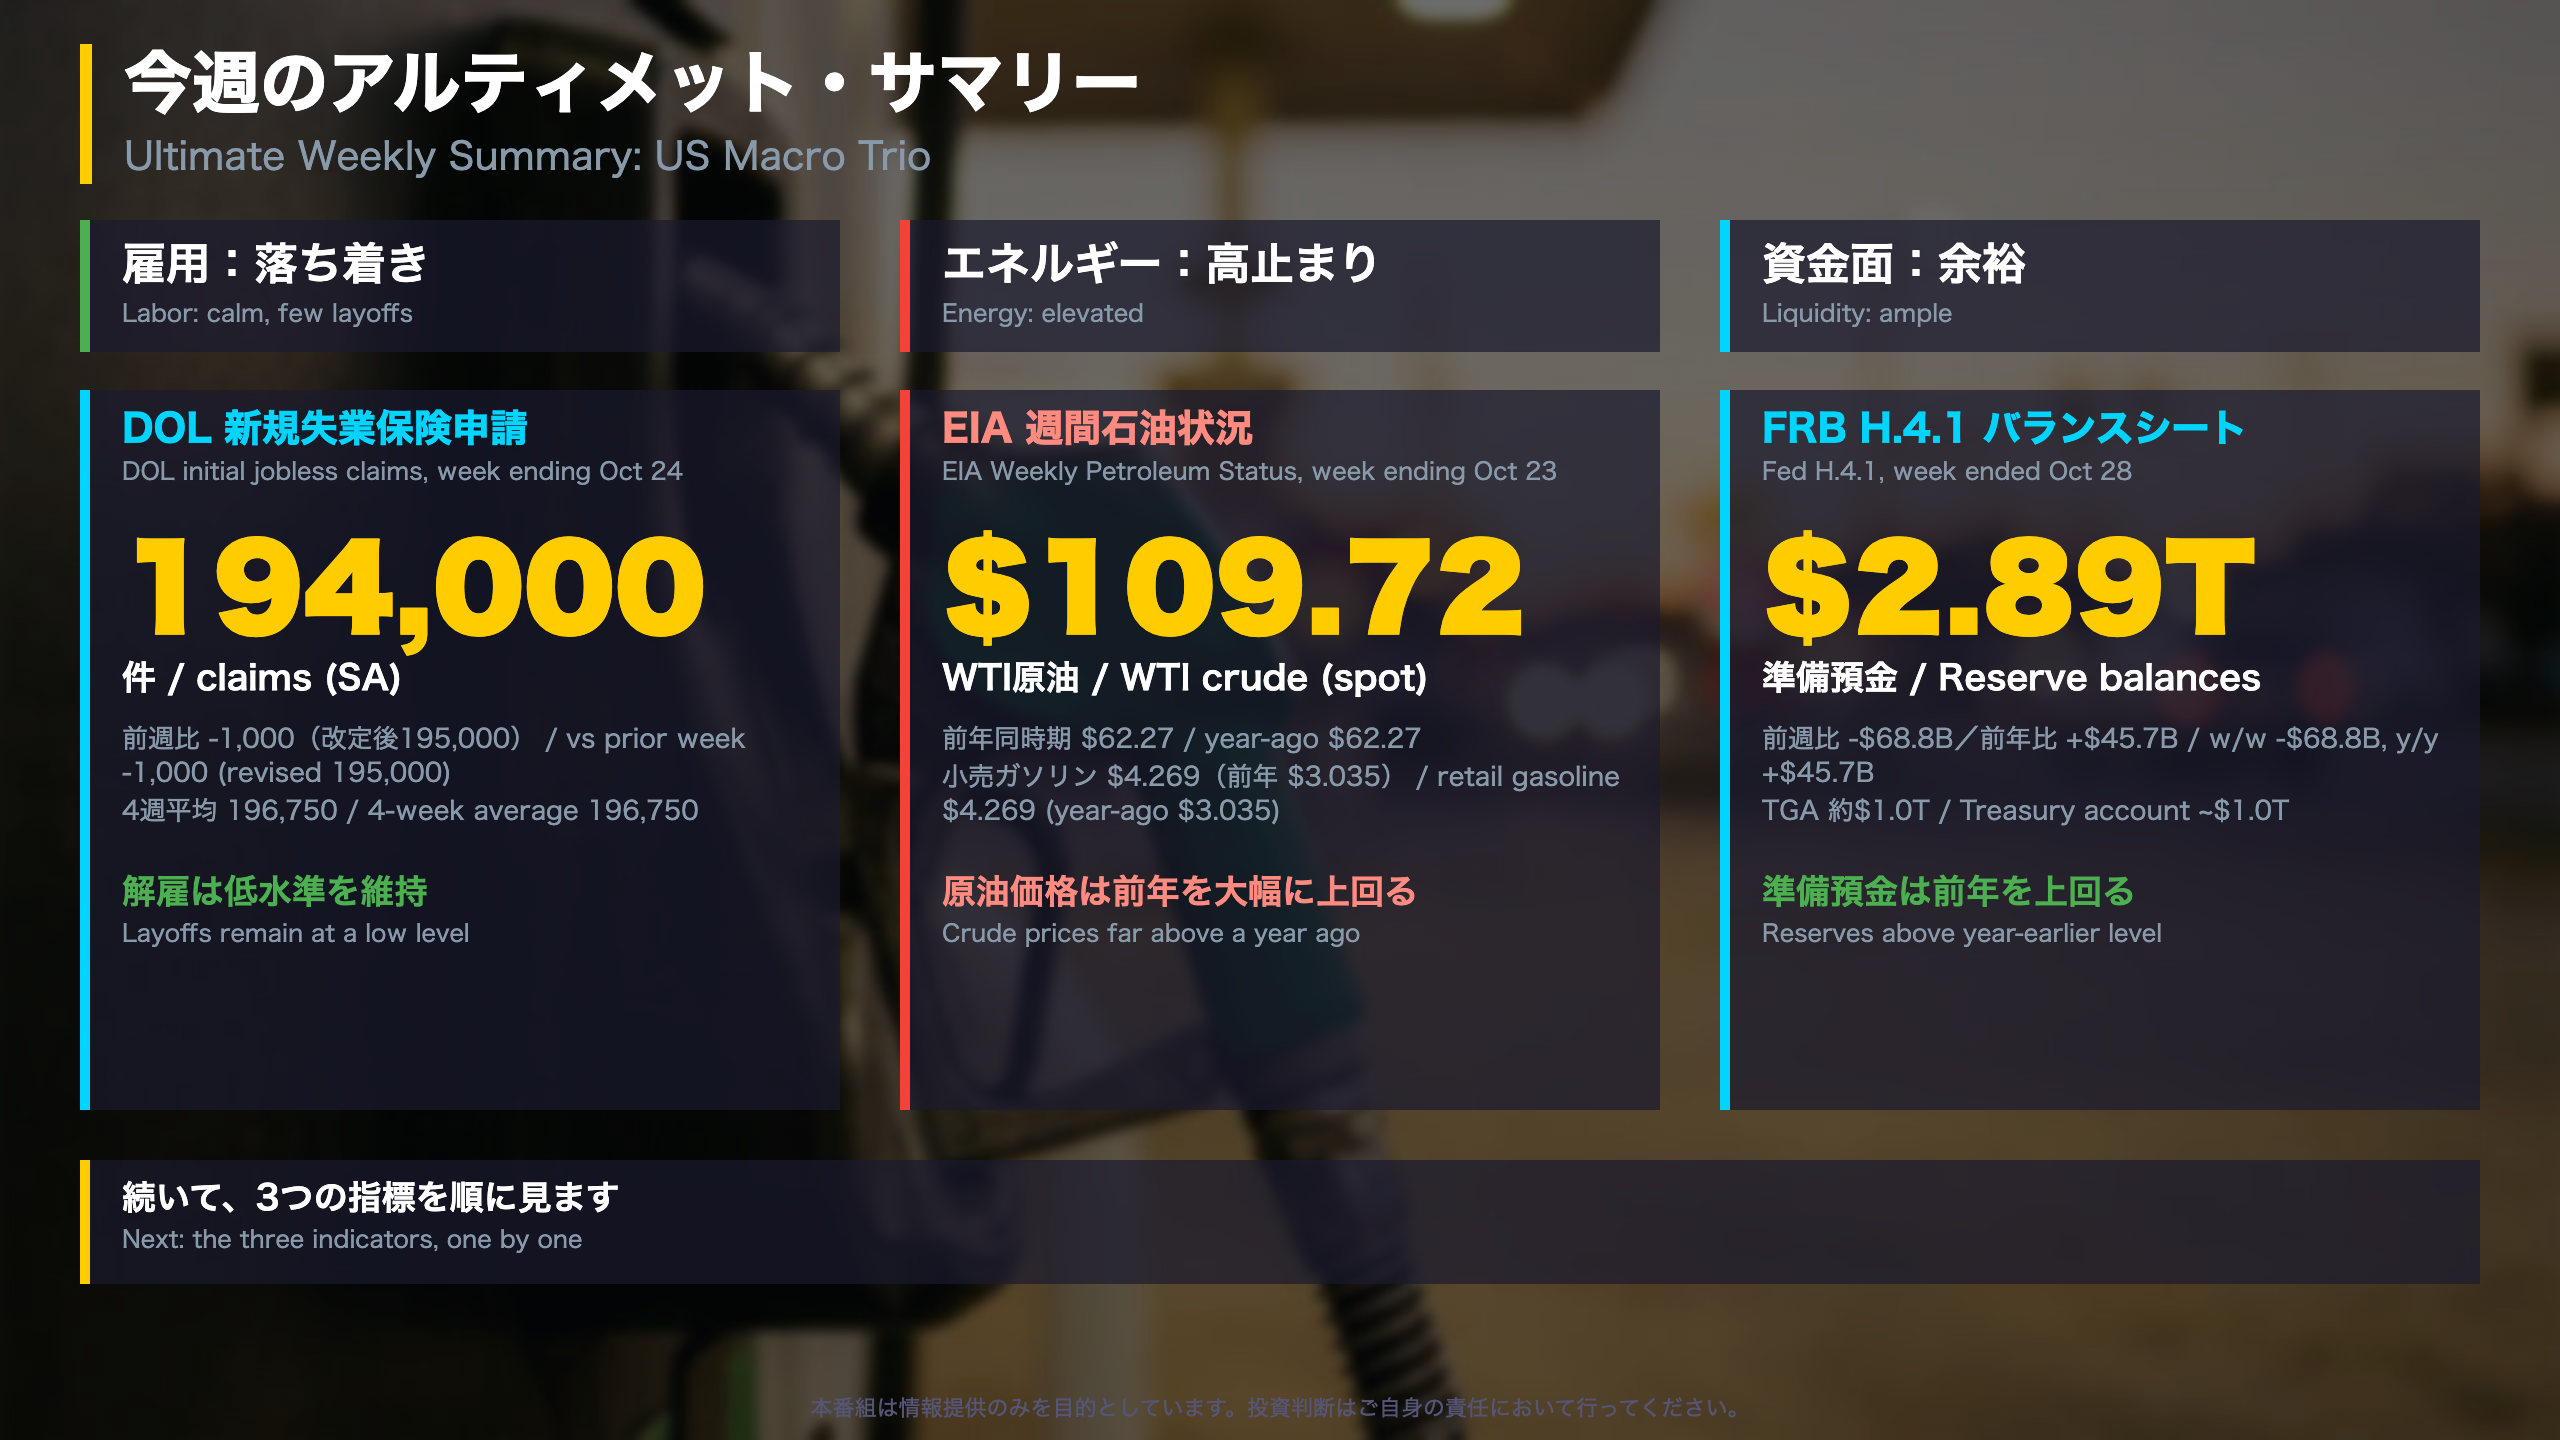
US Weekly Macro Trio: The Big Picture
Three releases frame this week: the Department of Labor (DOL) weekly jobless claims, the Energy Information Administration (EIA) weekly petroleum report, and the Federal Reserve’s H.4.1 balance sheet release.
- Labor: initial claims 194,000 (week ending Oct 24) vs 195,000 revised the prior week
- Energy: WTI spot $109.72 (Oct 23) vs $62.27 a year earlier
- Liquidity: reserve balances about $2.89 trillion (week ended Oct 28), above the year-earlier level
Why these three?
Claims are the most timely US layoff gauge; Japan, by contrast, publishes its jobs data monthly. EIA data is an early read on fuel costs that feed headline CPI. The H.4.1 shows how much cash sits in the banking system. The DOL itself notes that claims are ‘subject to some volatility’, so single weeks deserve caution.
Data caveat
The EIA report’s opening summary describes the week ending September 11 (WTI $101.27). We use the October 23 tables instead.
Regime model
Our weekly HMM has stayed in regime R0 for five straight weeks (99.8%), with a 99.4% chance of staying there next week. Outside the model’s inputs, the Treasury General Account is the notable outlier (Z-score 2.82).
労働市場の現在地(DOL詳細)
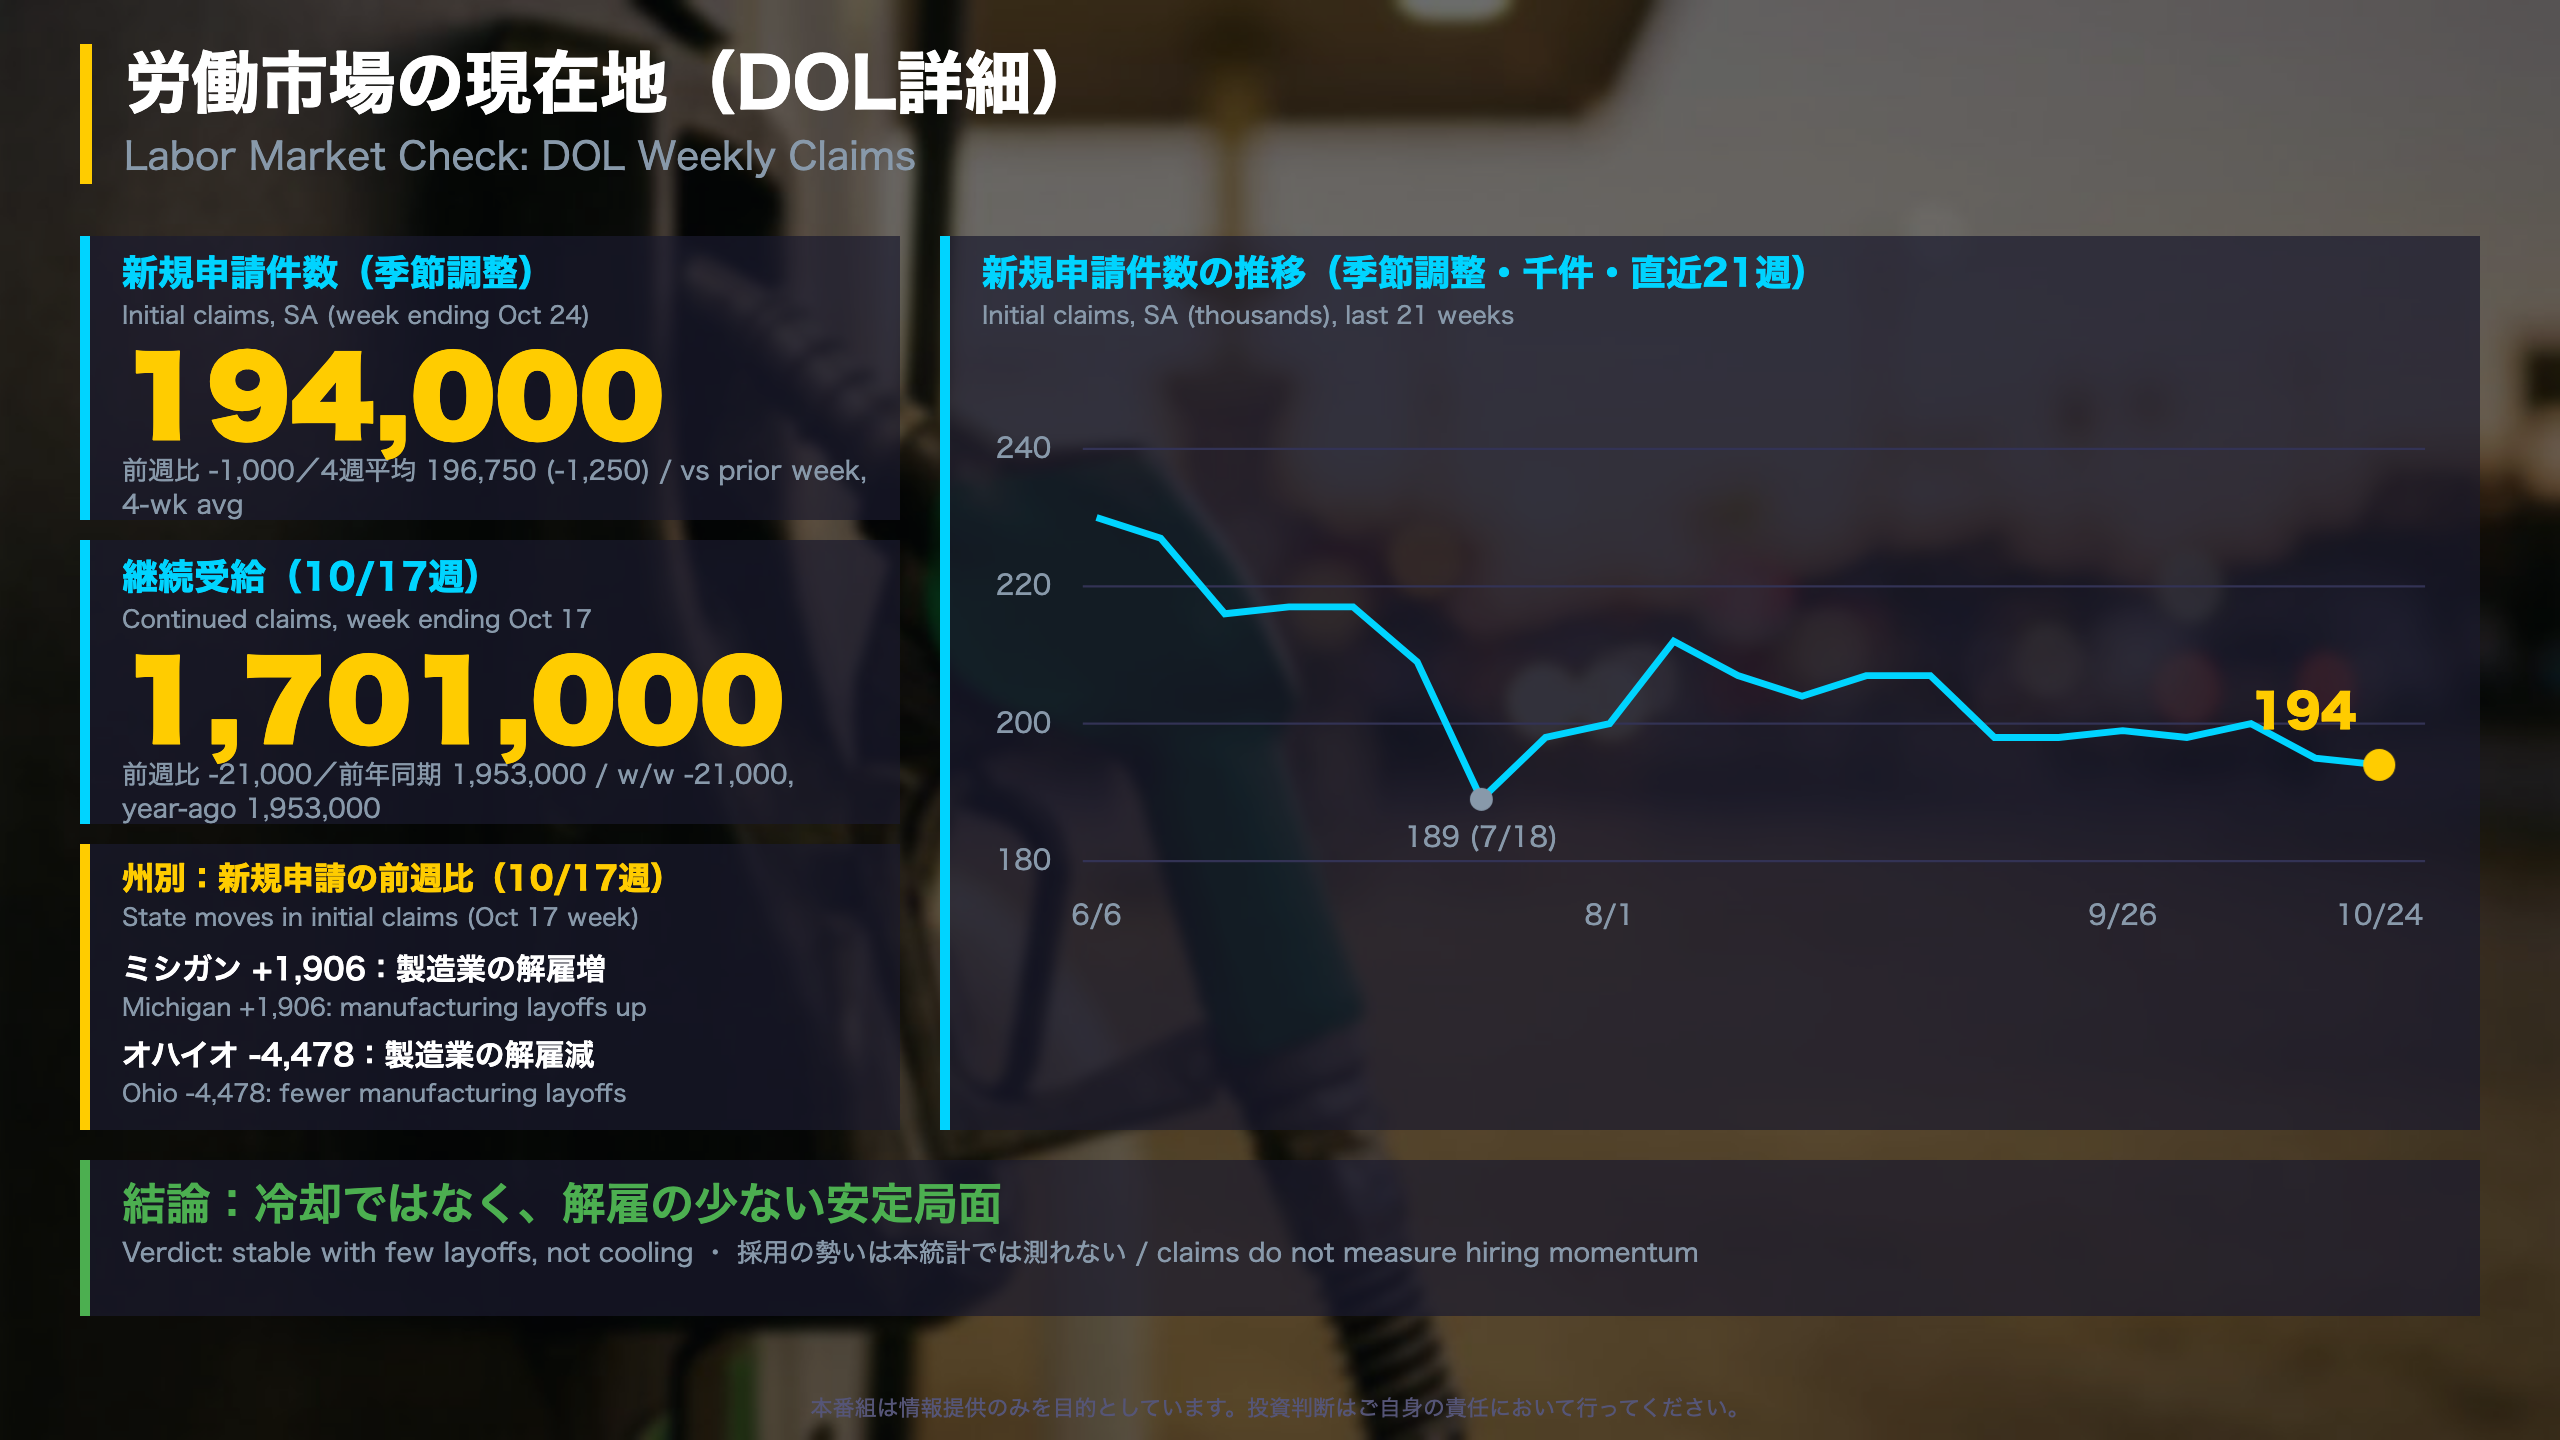
Labor Market: Beyond the Headline
What the DOL measures. Initial claims count new applications for state unemployment insurance and are a leading indicator; continued claims count people still receiving benefits and tend to confirm the cycle rather than lead it.
Context
- Initial claims (SA) of 194,000 sit near the low end of the past year’s range (189,000 on Jul 18 to 235,000 on Dec 6, 2025)
- The four-week average is 196,750 vs 226,750 a year ago
- Continued claims have hovered around 1.70-1.72 million since September, versus 1.95 million a year ago
- Insured unemployment rate: 1.1% (1.3% a year ago)
- Unadjusted claims rose 3.3% (178,851), close to the +3.5% the seasonal factors expected
Reading the states
Michigan reported more manufacturing layoffs (+1,906) while Ohio reported fewer (-4,478). The release prints Illinois’ insured unemployment rate as 13.1, an order of magnitude above other states, so we treat it as a likely typo and ignore it.
Two readings
Constructive: low layoffs and continued claims below last year point to resilience. Cautious: claims say little about hiring, and the labor force participation rate in our model data (61.8%) sits below its regime average (62.7%), which complicates supply-demand readings.
Unlike Japan’s monthly jobs-to-applicants ratio, this series is weekly and noisy, so the four-week average matters.
エネルギー需給の現在地(EIA詳細)
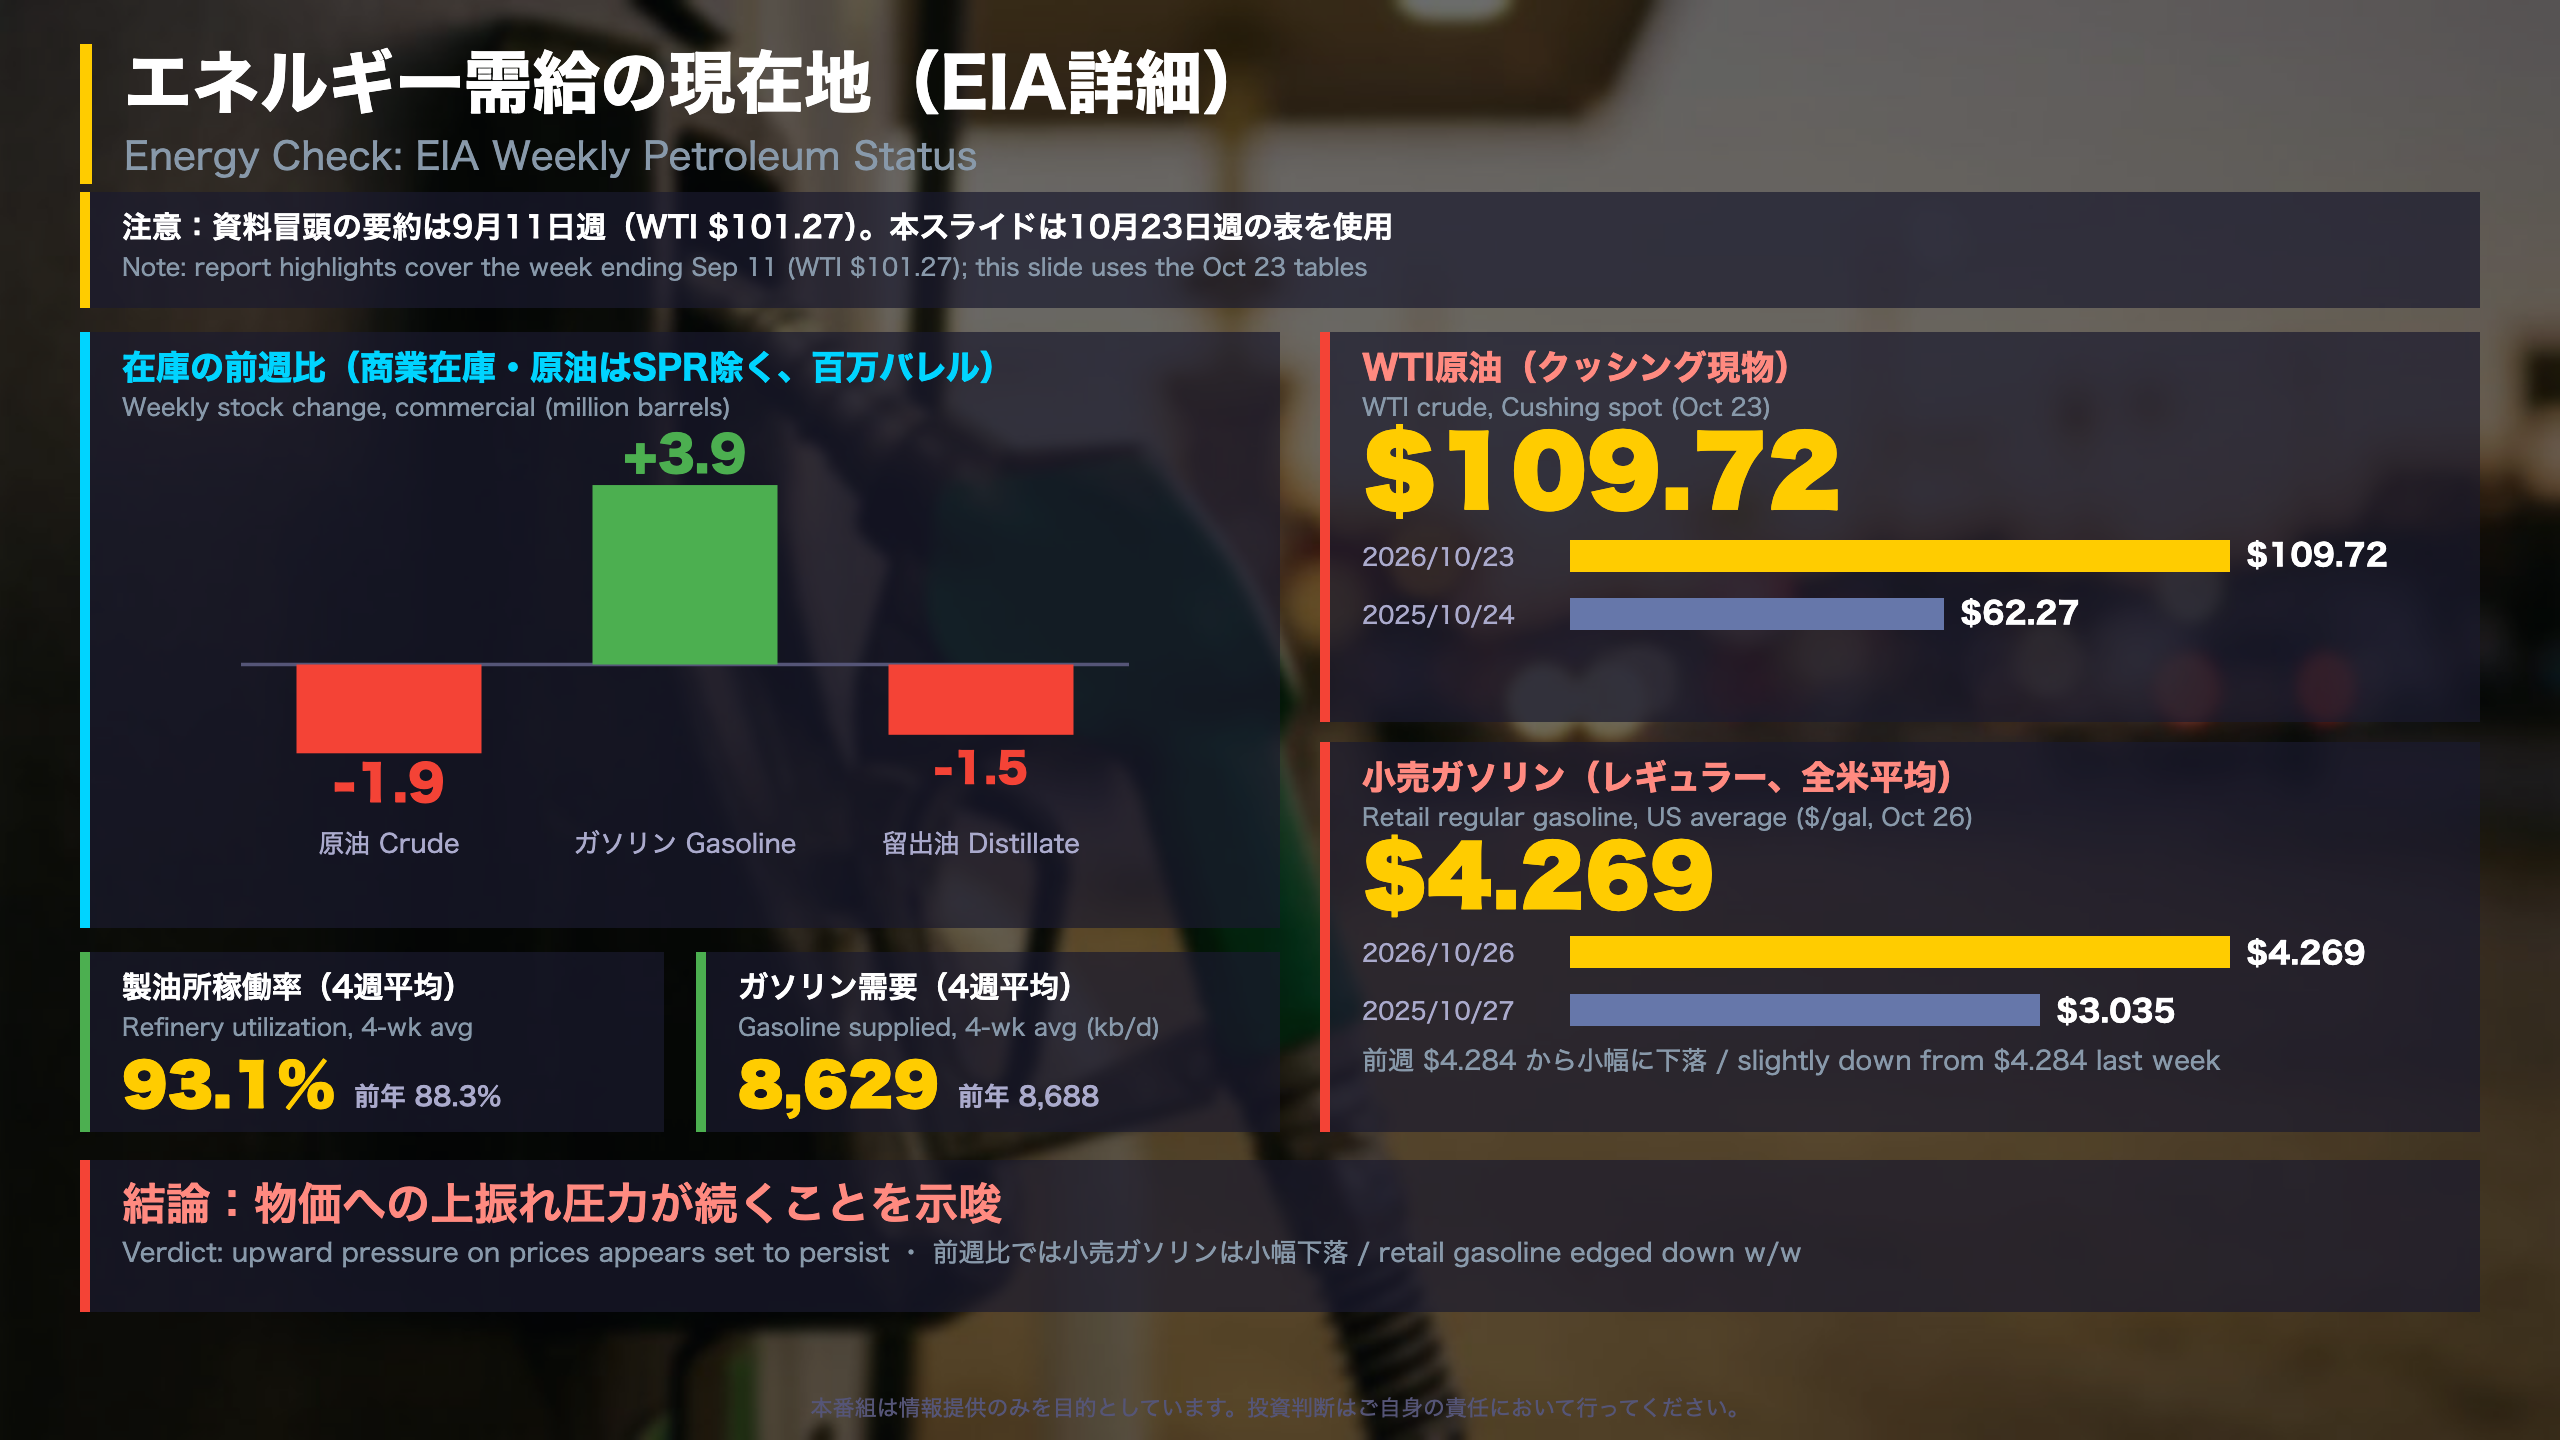
Energy: Stocks, Demand and Prices
About the report. The EIA Weekly Petroleum Status Report tracks US inventories, refinery activity and product demand. Fuel costs feed directly into headline CPI, which is why inflation watchers follow it.
Key tables (week ending Oct 23)
| Item (million bbl) | Oct 23 | Oct 16 | Year ago |
|---|---|---|---|
| Crude stocks ex-SPR | 410.6 | 412.5 | 416.0 |
| Gasoline stocks | 209.2 | 205.3 | 210.7 |
| Distillate stocks | 102.8 | 104.3 | 112.2 |
| SPR | 282.6 | 282.7 | 409.1 |
- Four-week refinery utilization 93.1% (88.3% a year ago)
- Four-week gasoline product supplied 8.63 mb/d vs 8.69 mb/d a year ago
- Retail regular gasoline $4.269 (prior week $4.284, year ago $3.035); retail diesel $6.352 (year ago $3.718)
Caveats
The report’s opening highlights are stale (week ending Sep 11: refinery utilization 96.8%, WTI $101.27). Data for the week ending Oct 23 also reflect benchmarking to the July data in the September Petroleum Supply Monthly. A five-year-average comparison is not provided for the latest week, so we use year-over-year.
Two readings
Supply side: high utilization and gasoline stocks near last year’s level suggest the system is functioning. Price side: WTI above $109 versus $62 a year ago and diesel near $6.35 keep cost pressure alive. Whether this reaches consumers depends on household finances, which these sources do not cover.
FRB流動性の現在地(H.4.1詳細)
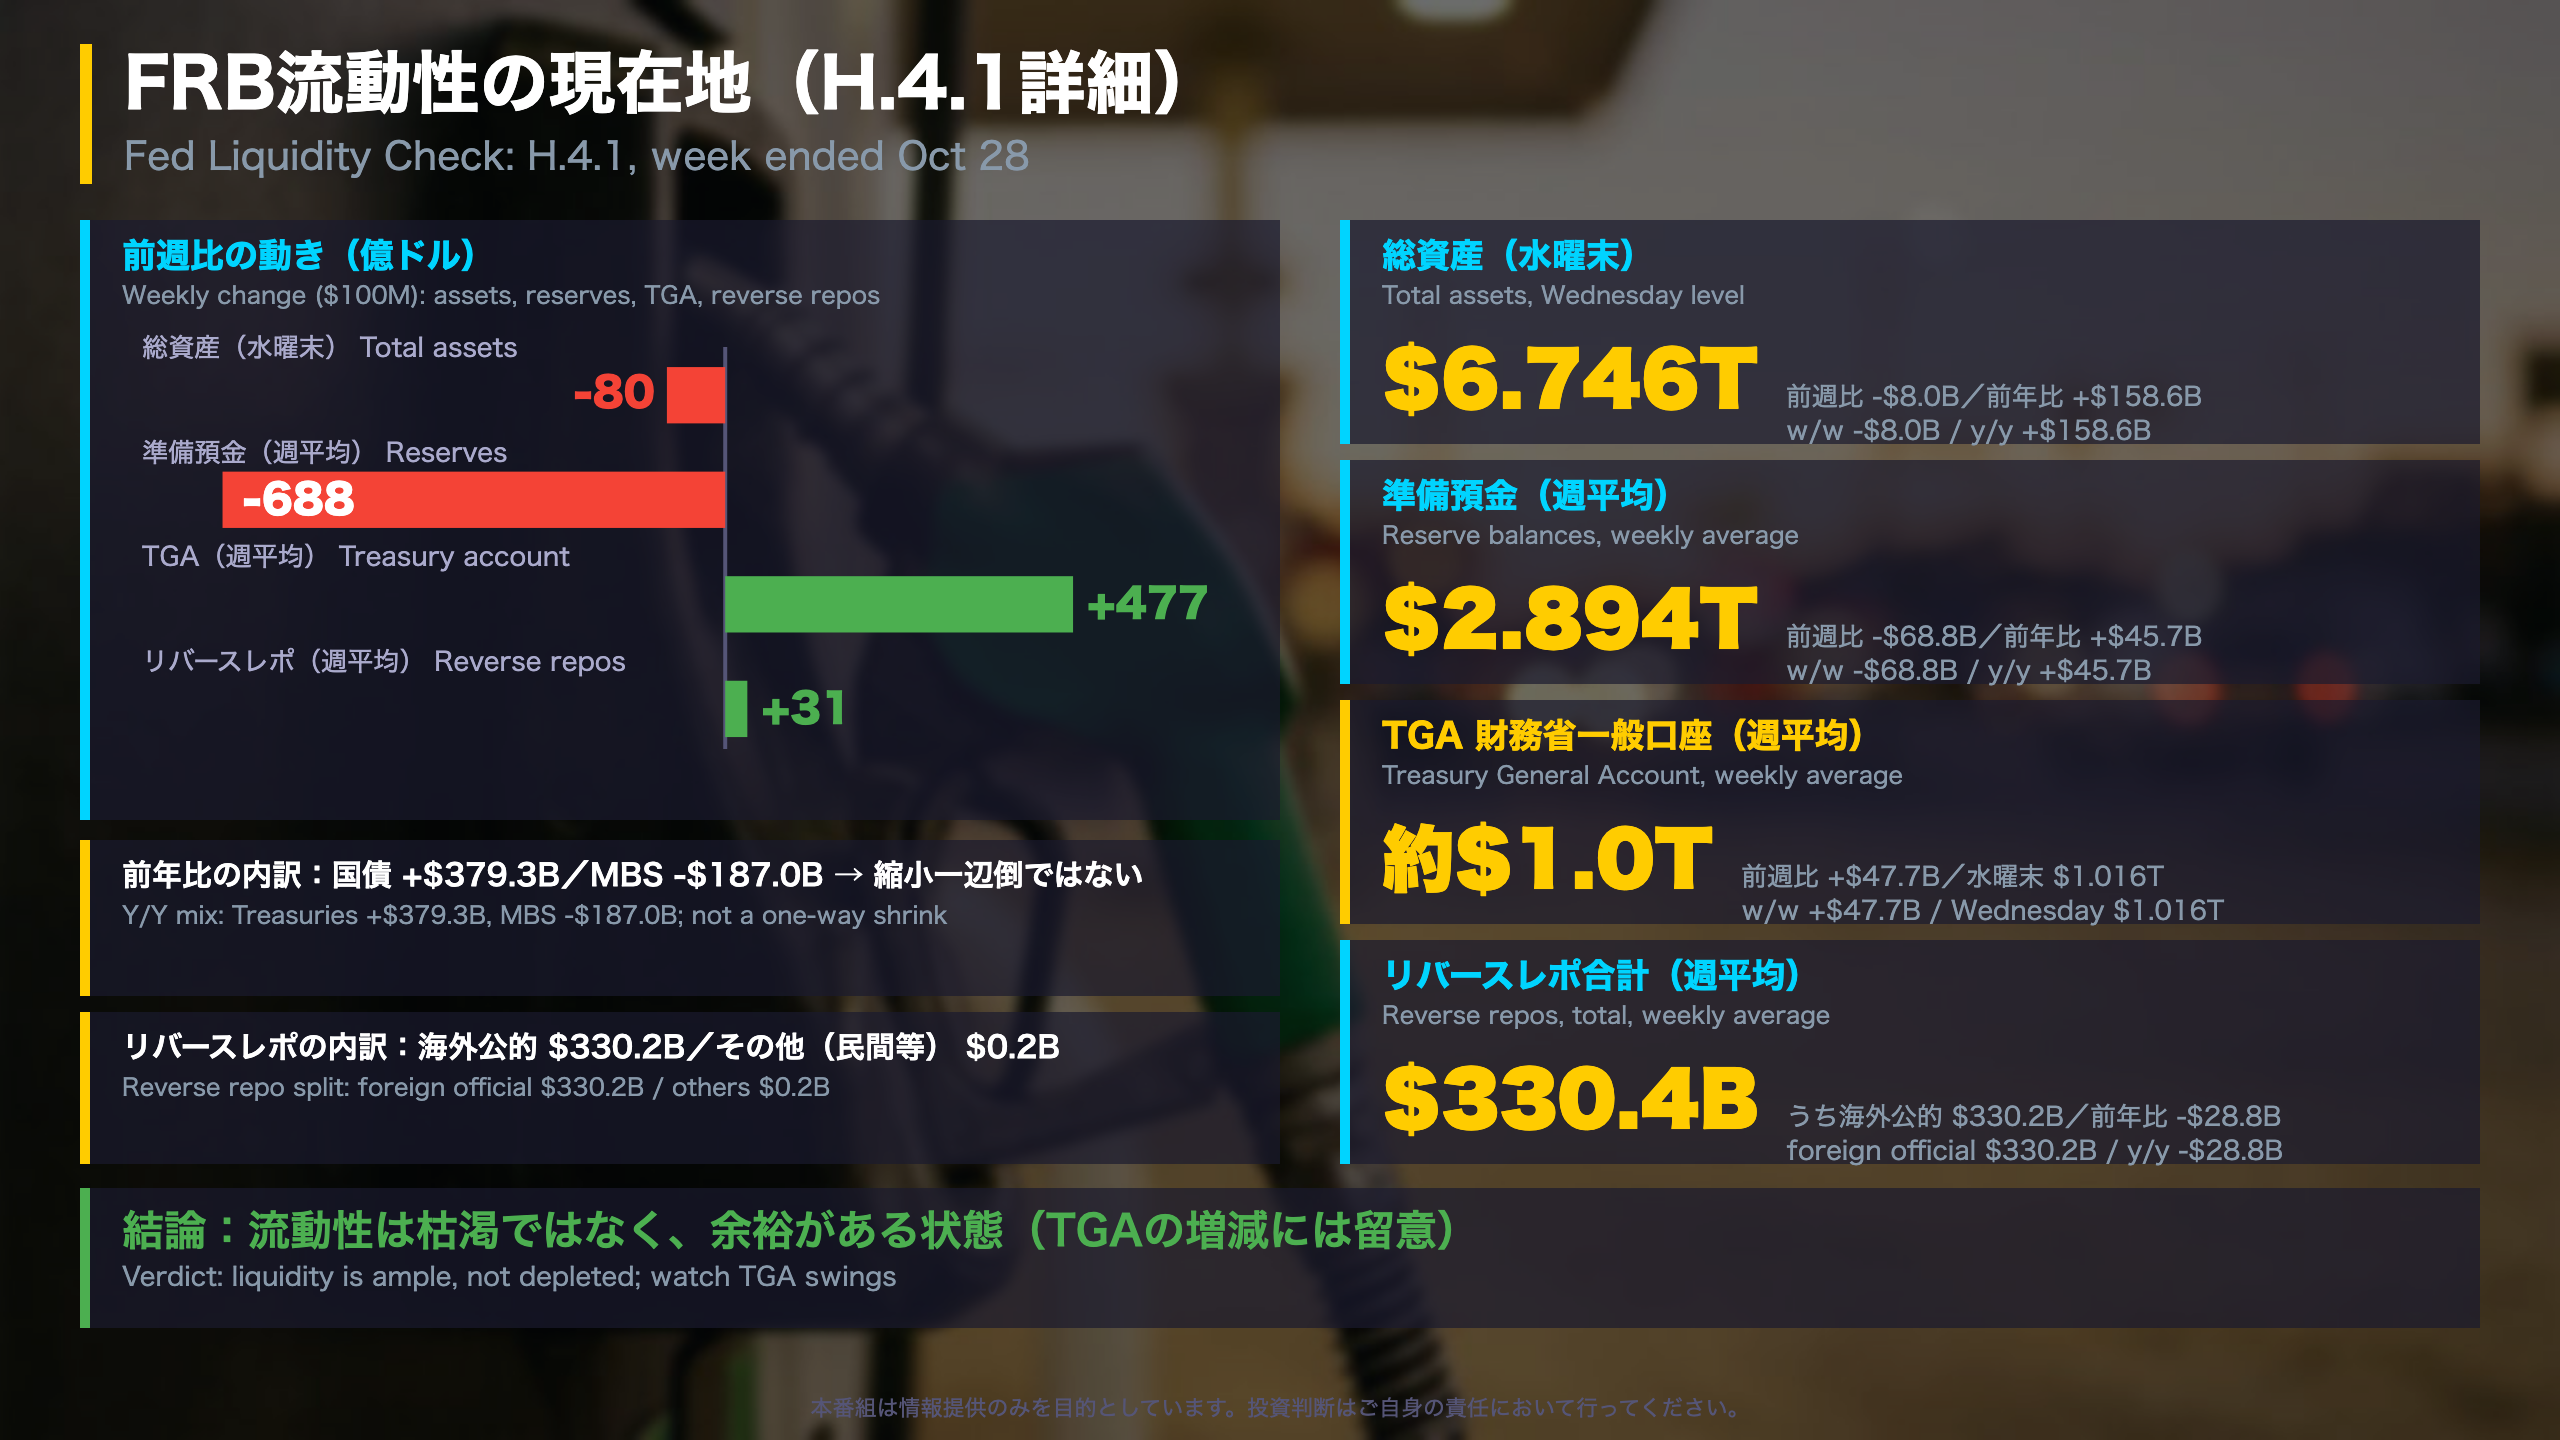
Fed Liquidity: Reading the H.4.1
What it is. The H.4.1 is the Fed’s weekly balance sheet. Reserve balances are the cash commercial banks hold at the Fed; the TGA is the Treasury’s checking account there; reverse repos are cash parked at the Fed by counterparties.
Assets (week average, $ millions)
| Item | Level | w/w | y/y |
|---|---|---|---|
| Reserve Bank credit | 6,705,765 | -1,096 | +165,201 |
| Treasuries | 4,575,959 | +4,711 | +379,320 |
| MBS | 1,890,182 | -7,083 | -187,005 |
Treasuries (bills especially) are far above last year while MBS keep running off. The release does not use the term QT; we describe only the holdings.
Liquidity
- Reserves 2,893,770 (w/w -68,837; y/y +45,749)
- TGA 999,727 (w/w +47,725); Wednesday level 1,015,632
- Reverse repos 330,384, of which foreign official 330,162 and others just 222
Two readings
Ample: reserves exceed last year’s level. Watch: with the domestic reverse-repo buffer near zero, TGA swings may pass straight into reserves. Our regime model flags the TGA as elevated (Z-score 2.82). A single week of reserve changes can reflect Treasury cash management, so multi-week trends matter.
ストラテジスト総括:3指標の連関と来週の注目シナリオ

Linking the Three Indicators
| Indicator | Signal | Basis |
|---|---|---|
| Labor | Stable, few layoffs | Claims and continued claims below a year ago |
| Energy | Elevated | WTI and retail fuel far above a year ago |
| Liquidity | Ample, watch TGA | Reserves above a year ago, but down w/w |
The signals are mixed rather than uniform: two stable, one headwind.
Two readings
- Constructive: steady employment gives households room to absorb fuel costs.
- Cautious: none of the three sources includes household income, savings or spending, so absorption cannot be judged from this data.
Checkpoints (all weekly)
- Do initial claims stay inside the past year’s 189,000-235,000 range?
- Do reserves recover from last week’s decline, and does the TGA stay near $1 trillion?
- Does the small weekly dip in retail gasoline ($4.284 to $4.269) continue?
Dates and outcomes for FOMC meetings or the monthly jobs report are not in these sources, so we do not discuss them. For rate- and currency-focused readers, the useful takeaway is the mix itself: labor resilience does not by itself settle how energy-driven inflation evolves.
Our regime model remains in R0 (99.8%), though the TGA (Z-score 2.82) is the outlier to monitor.
Disclaimer: This article is for informational purposes only. All investment decisions are made solely at your own risk.