
📺 Watch the Full Video Analysis
This article was automatically generated by the NFC Market Live AI analysis system. (Updated: 2026-10-30 09:59 JST)
📄 Primary Source
Reserve Bank of Australia
https://www.rba.gov.au/statistics/frequency/fin-agg/2026/fin-agg-0926.html
📊 A walk-through of the RBA’s September monetary aggregates (table D3).
Seasonally adjusted broad money rose 0.2% m/m and 6.1% y/y, so money is still expanding. But the last three months added only 0.6%, versus 1.8% in the three months before.
📈 M1 grew 0.6% m/m, its strongest month since June.
⚠️ The monetary base is down about 5% y/y, so private deposits may have driven the increase in broad money.
💡 Next check: whether the three-month pace re-accelerates in the October data. The source contains no RBA policy guidance.
The Ultimate Summary: 豪州マネーサプライ(9月分)
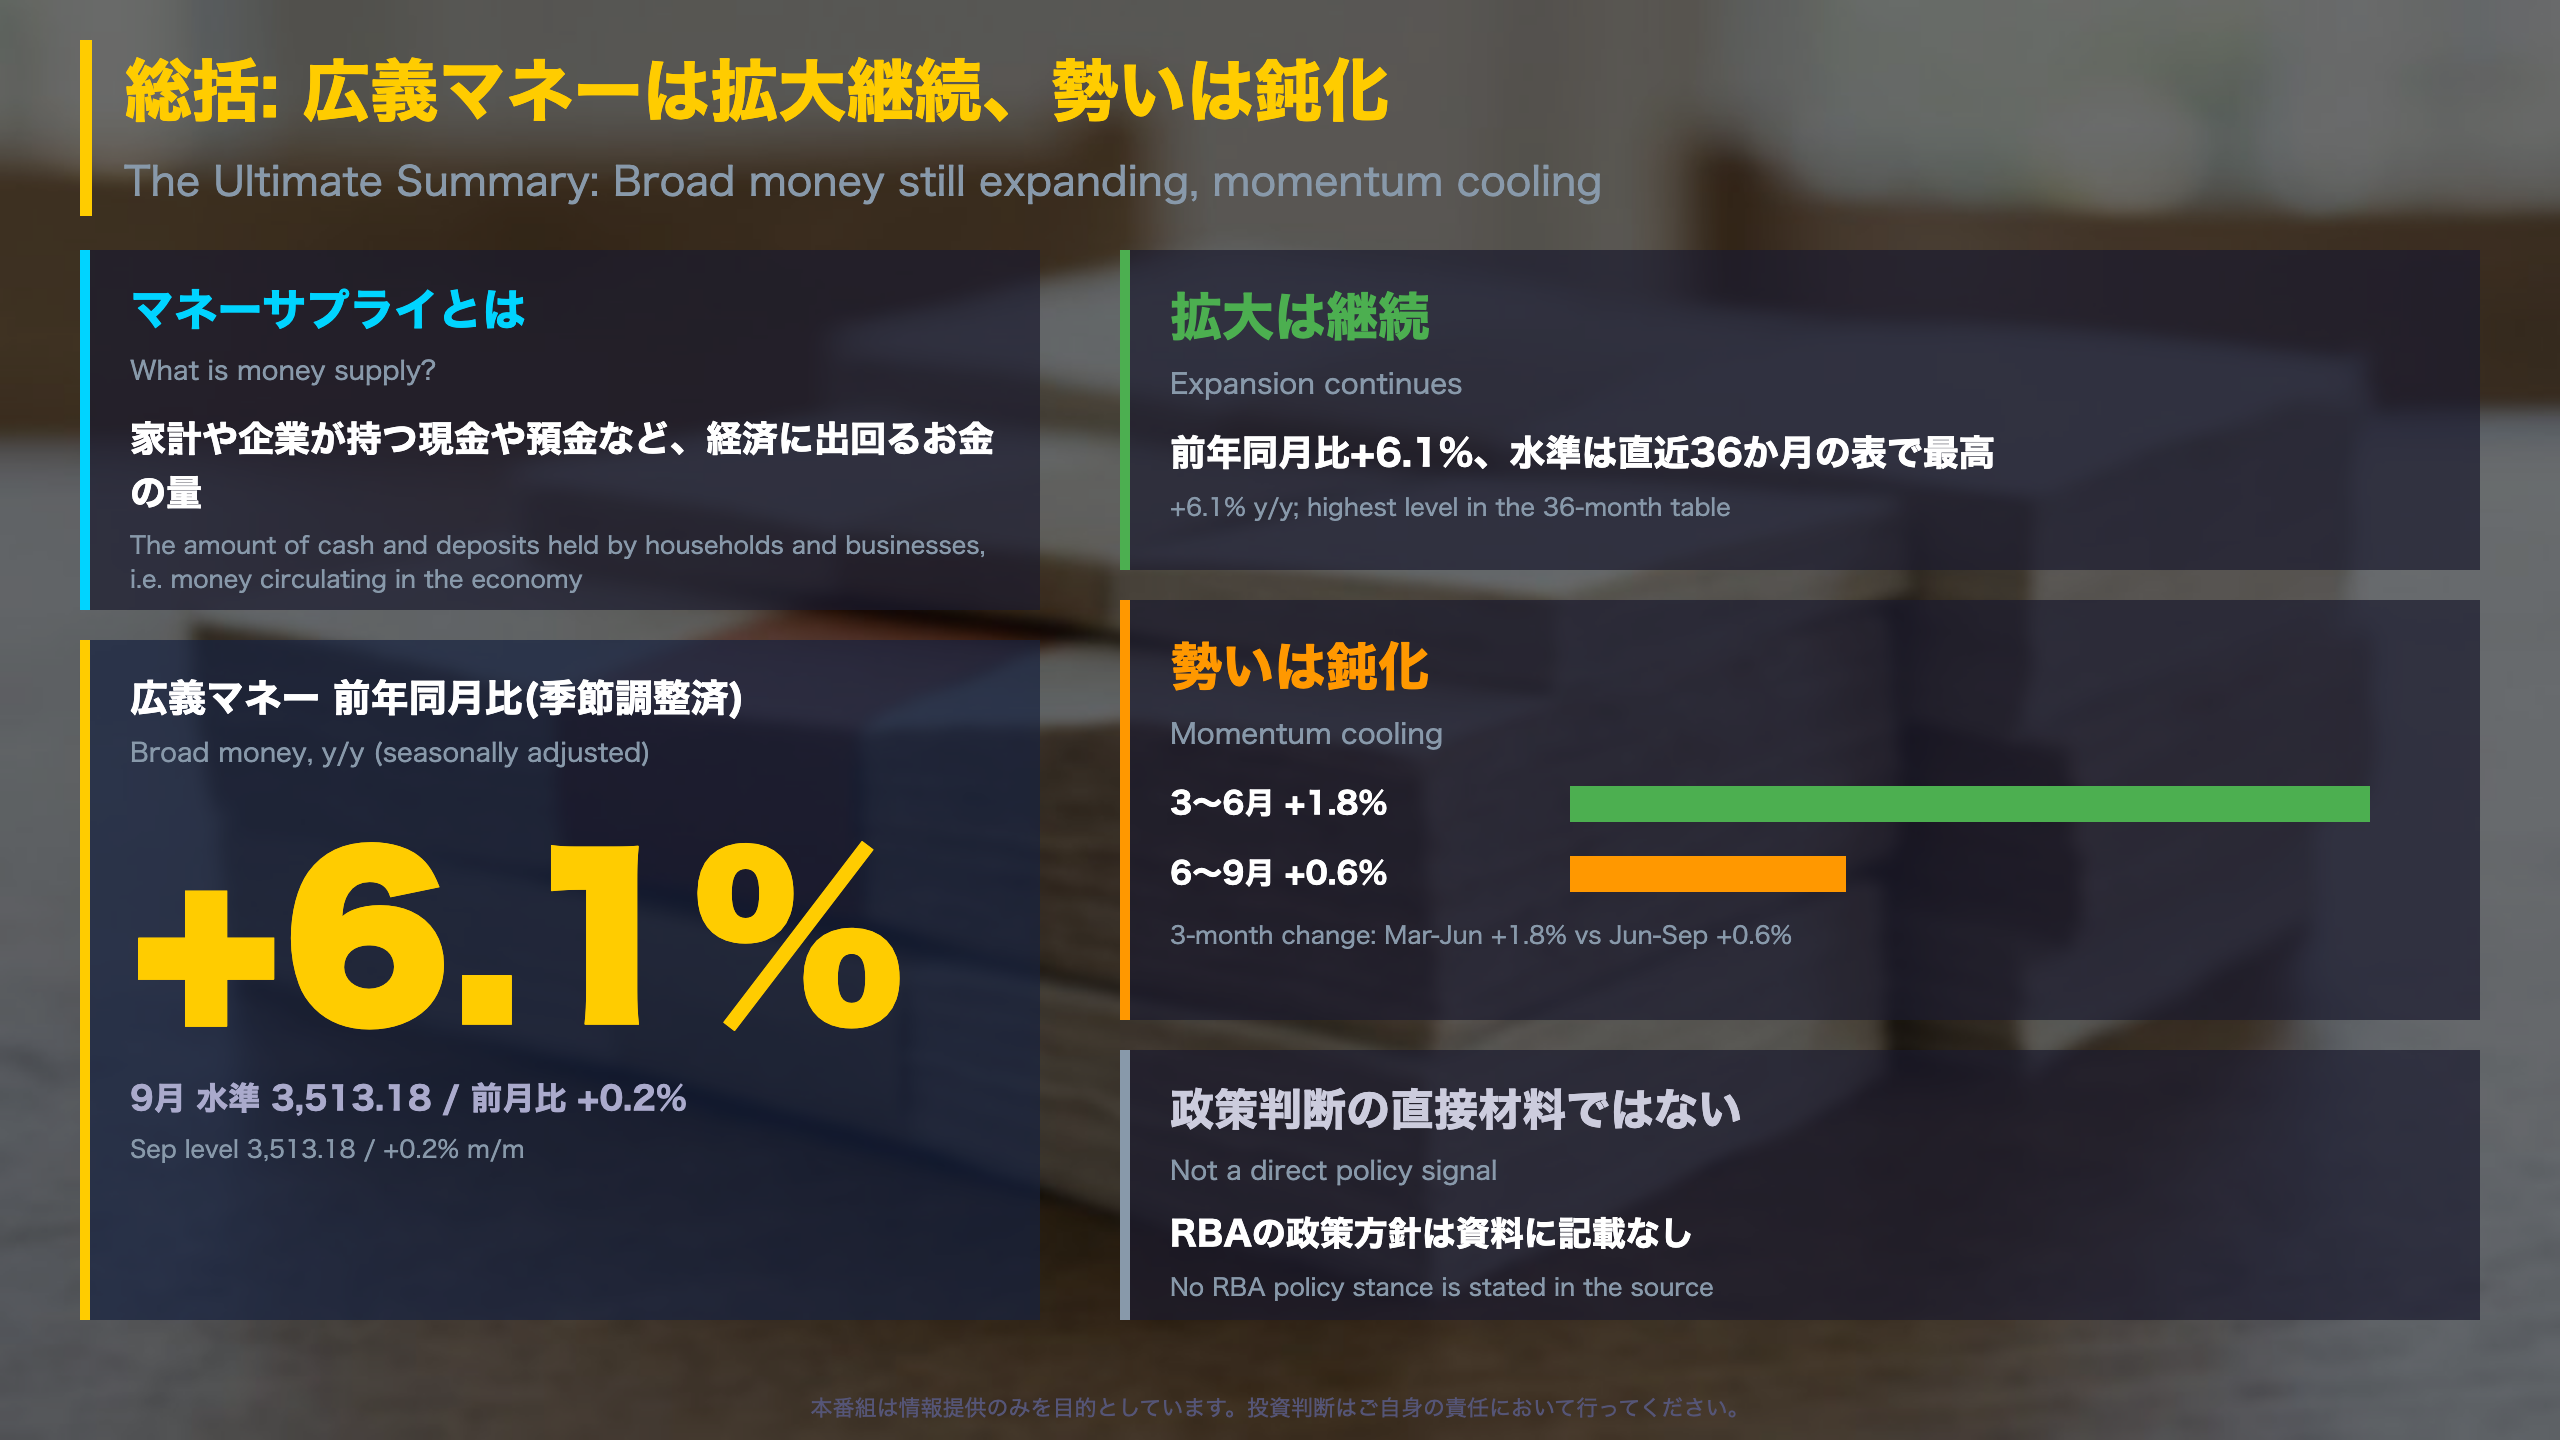
What this release is
The Reserve Bank of Australia (RBA) publishes monetary aggregates in statistical table D3. Broad money is the widest measure: M3 (cash plus bank deposits) plus net borrowing by non-bank financial institutions. It is comparable in spirit to US M2 from the Federal Reserve, though definitions differ.
Key numbers (seasonally adjusted, derived from the table levels)
- Broad money: 3,513.18 in September vs 3,506.85 in August (revised), +0.18% m/m and +6.12% y/y.
- M3: +0.17% m/m, +6.02% y/y. M1: +0.61% m/m, +6.40% y/y.
Why it matters
Money growth is a background gauge of liquidity. Annual growth near six percent is still solid, but the three-month change was +0.61% for June to September, versus +1.77% for March to June and +2.30% for the same window a year earlier.
Two readings
- Resilience: levels are the highest in the 36-month table, and M1 had its strongest month since June.
- Caution: broad money, M3 and M1 all show slower three-month momentum, so the cooling is not confined to one series.
Limits
This release is not a policy decision, and the source contains no RBA guidance or exchange-rate commentary. Seasonally adjusted figures are revised each month (August broad money was cut from 3,510.14 to 3,506.85). The next check is the October reading.
解説1: お金が増える勢いの変化
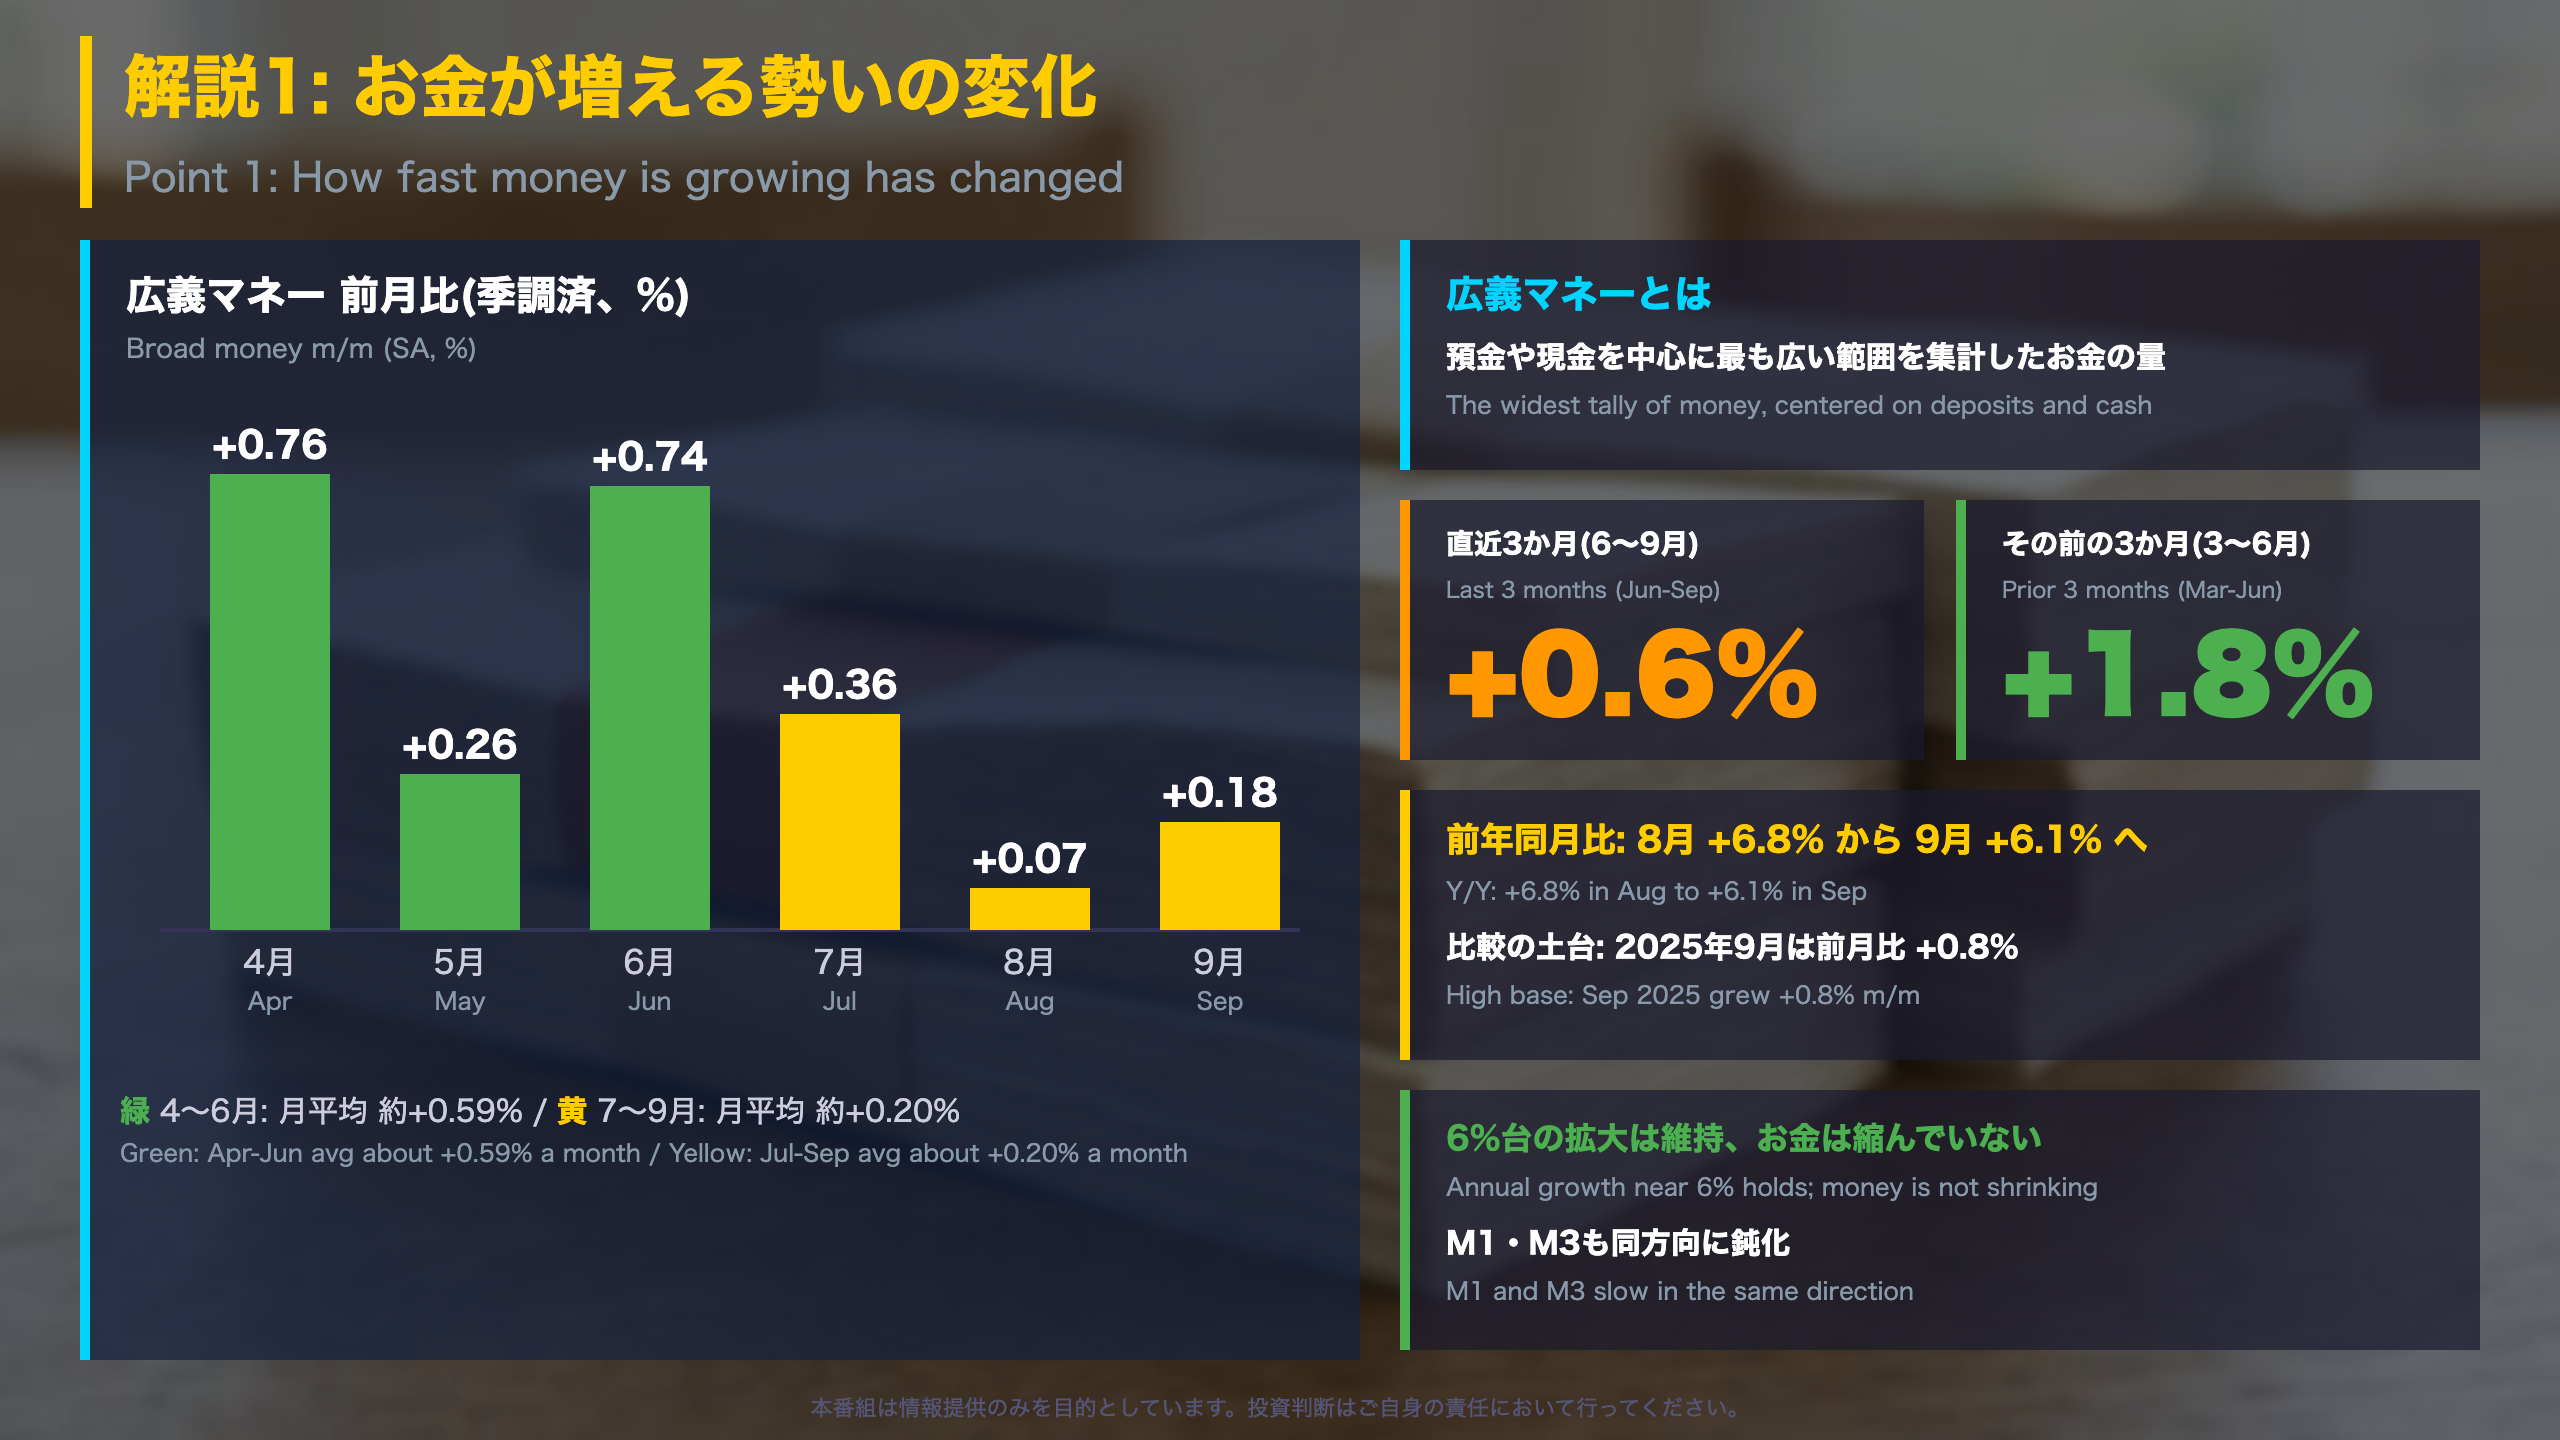
Momentum, month by month
Seasonally adjusted broad money (latest revised vintage) rose +0.76% in April, +0.26% in May, +0.74% in June, +0.36% in July, +0.07% in August and +0.18% in September. The April-June average is about +0.59% a month; July-September is about +0.20%.
Why the annual rate fell
Year-on-year growth eased from +6.81% in August to +6.12% in September. A high comparison base is one plausible contributor: monthly growth in July-September 2025 was +0.66%, +0.80% and +0.83%. The source does not state a cause, so this is an inference from the table.
Cross-checks
M3 grew +1.66% over March-June but +0.62% over June-September; M1 slowed from +1.36% to +0.86%. When three series point the same way, a single-month wobble is a weaker explanation.
Two readings
- Resilient: annual growth near 6% and the highest level in the 36-month table.
- Cooling: the latest three-month pace (+0.61%) is roughly a quarter of the same window a year earlier (+2.30%).
Context
The RBA publishes these aggregates in statistical table D3. They complement, rather than replace, inflation and labour data in judging financial conditions. Seasonal factors are re-estimated, so recent months can be revised.
解説2: お金の中身の変化
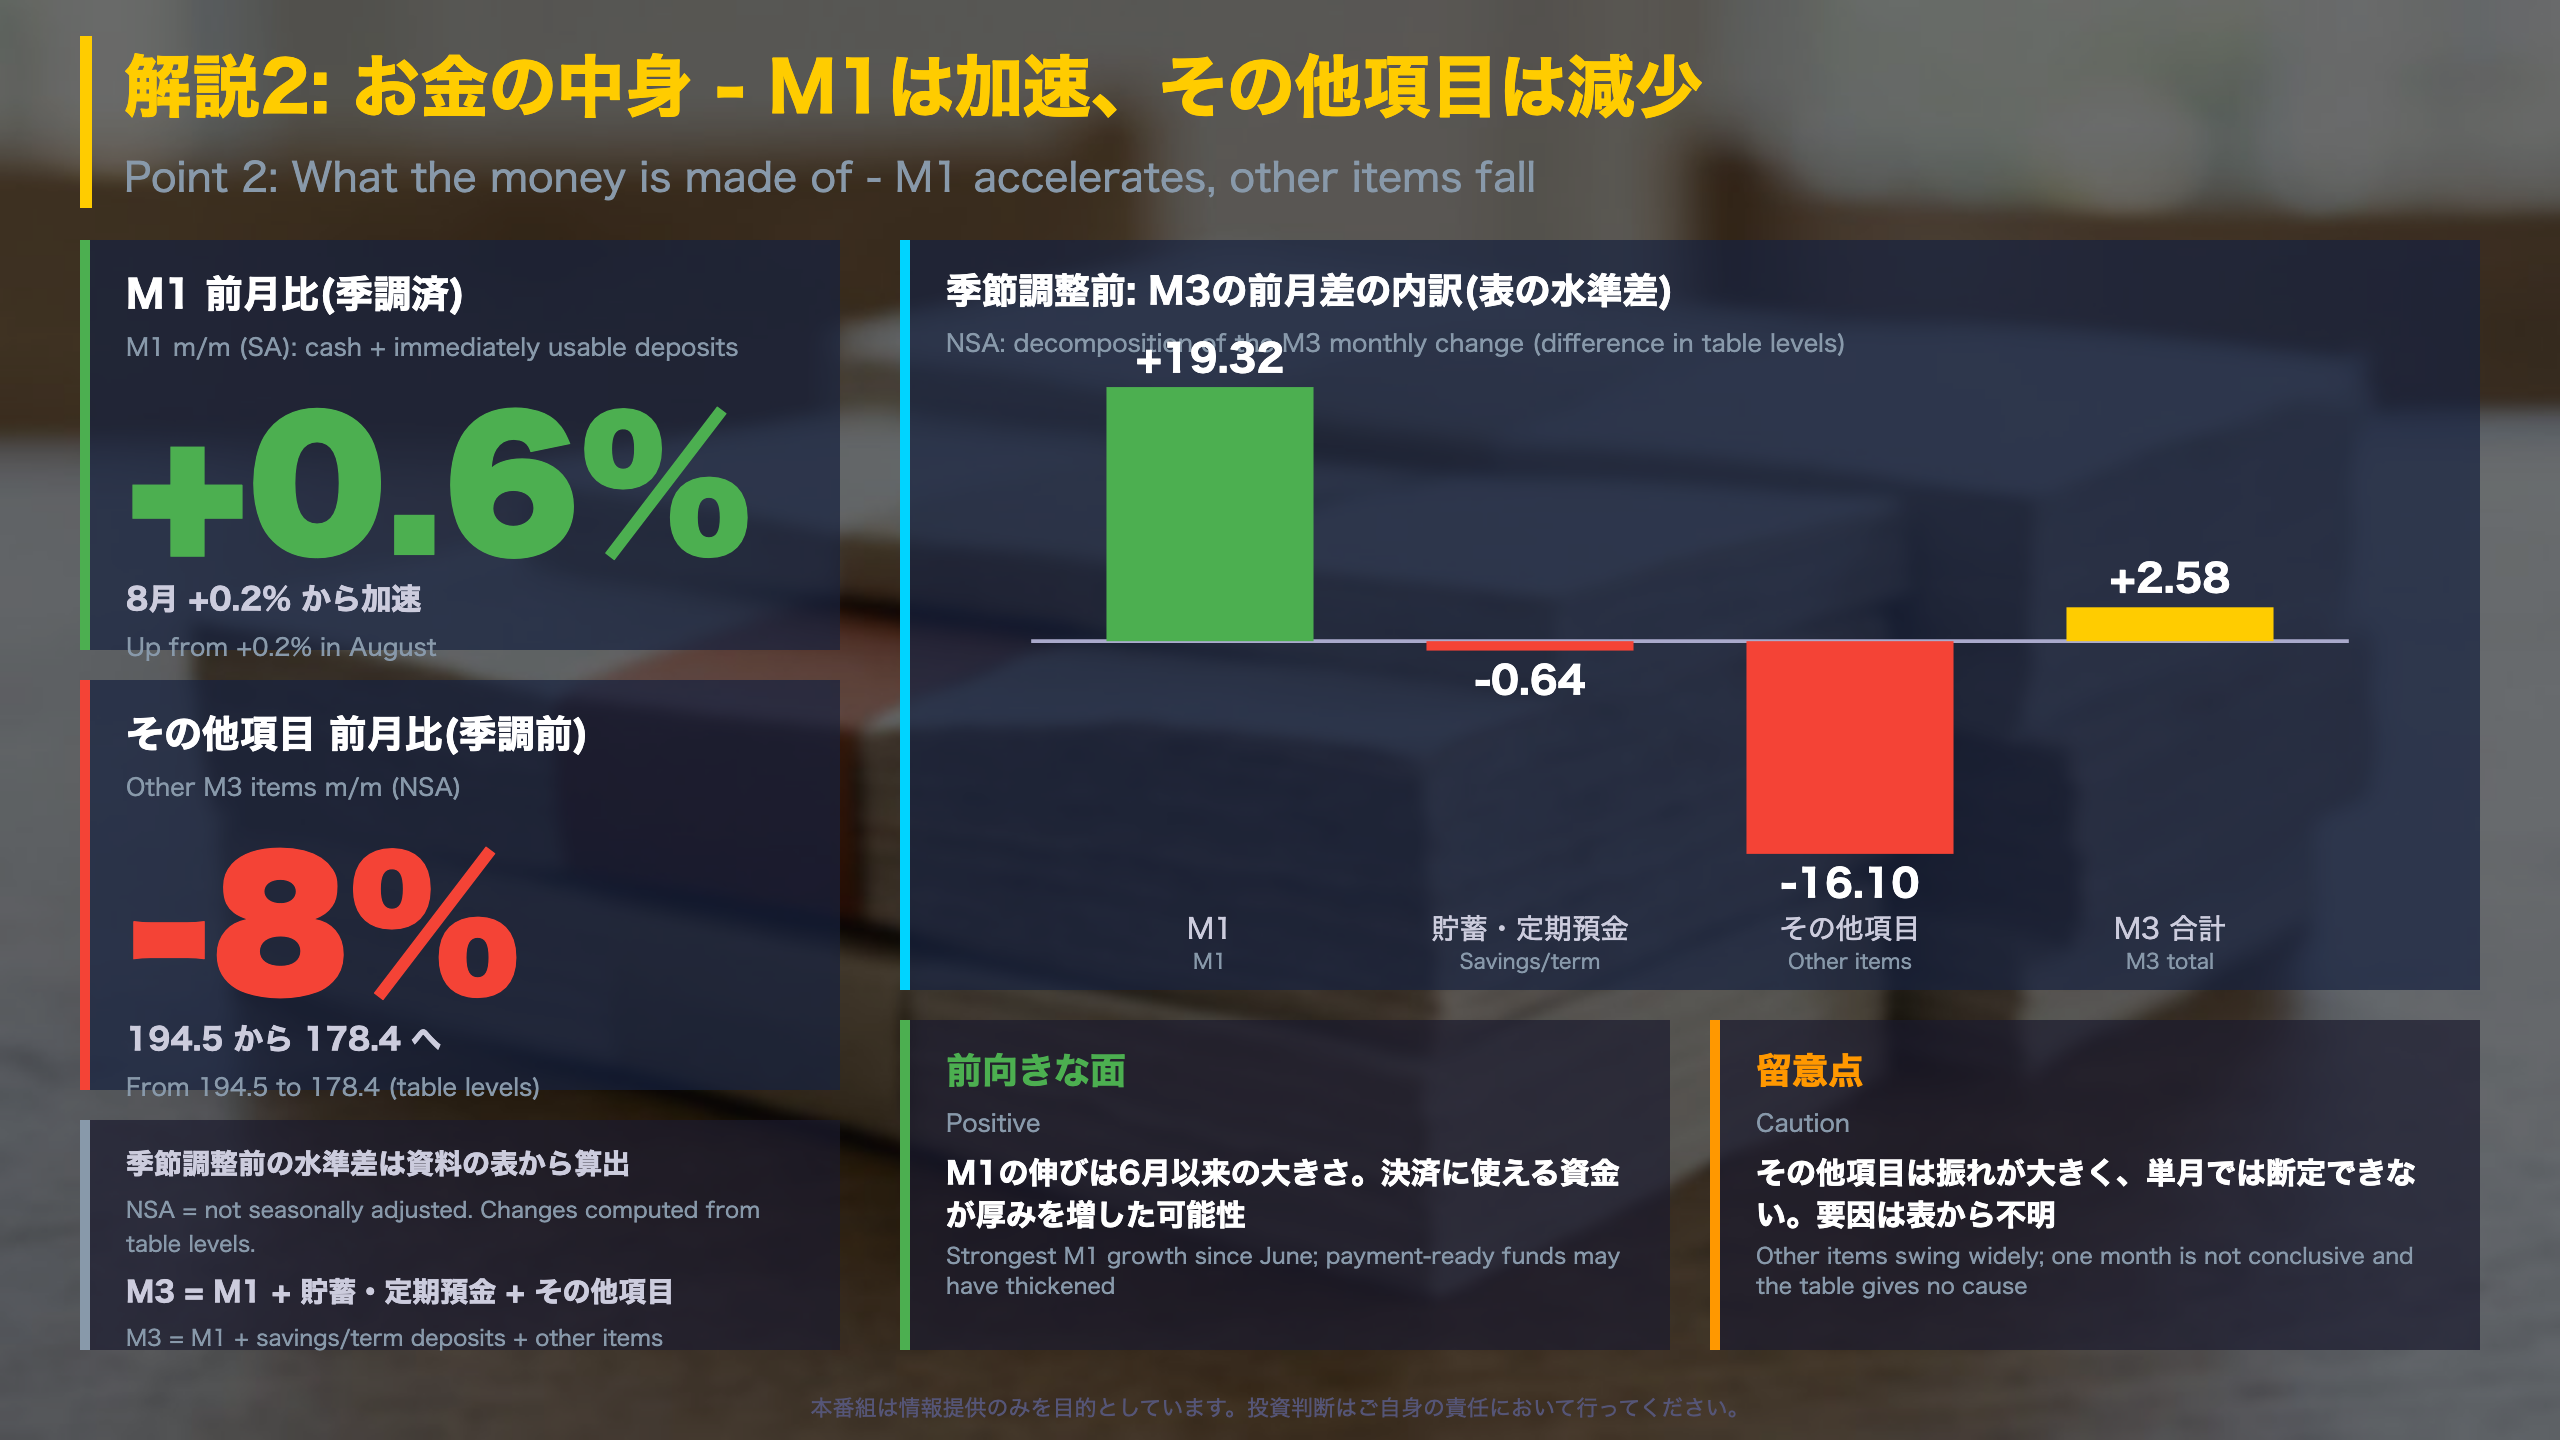
Reading the September composition
In the unadjusted table, M3 rose by 2.58 (3,498.37 vs 3,495.79 in August). The pieces were: M1 +19.32 (+0.96%), non-transaction deposits -0.64 (-0.05%) and the remaining items -16.10 (-8.3%). Those three add up to the M3 change.
What is M1?
M1 is currency plus deposits that can be spent immediately. Seasonally adjusted, M1 rose +0.61% in September after +0.17% in August, the strongest month since June (+0.69%). Transaction deposits rose +0.99% on the month and +6.49% on the year.
Why the remaining item matters
That category (series DMAODCD) ranged between about 168.6 and 198.0 over the last twelve months and stepped up from 179.3 in March to 197.9 in April. September’s level of 178.4 is back near March. Large swings like this make a single month hard to interpret.
Two readings
- Positive: payment-ready balances grew faster, which could point to thicker transactional liquidity.
- Cautious: the table gives no reason for the move, and one month does not establish a change in money flows.
Watch next
Whether M1 keeps growing at a pace like June and September, and whether the remaining item stays near current levels in the October data.
質疑で深める: 勢い・RBA・次の焦点
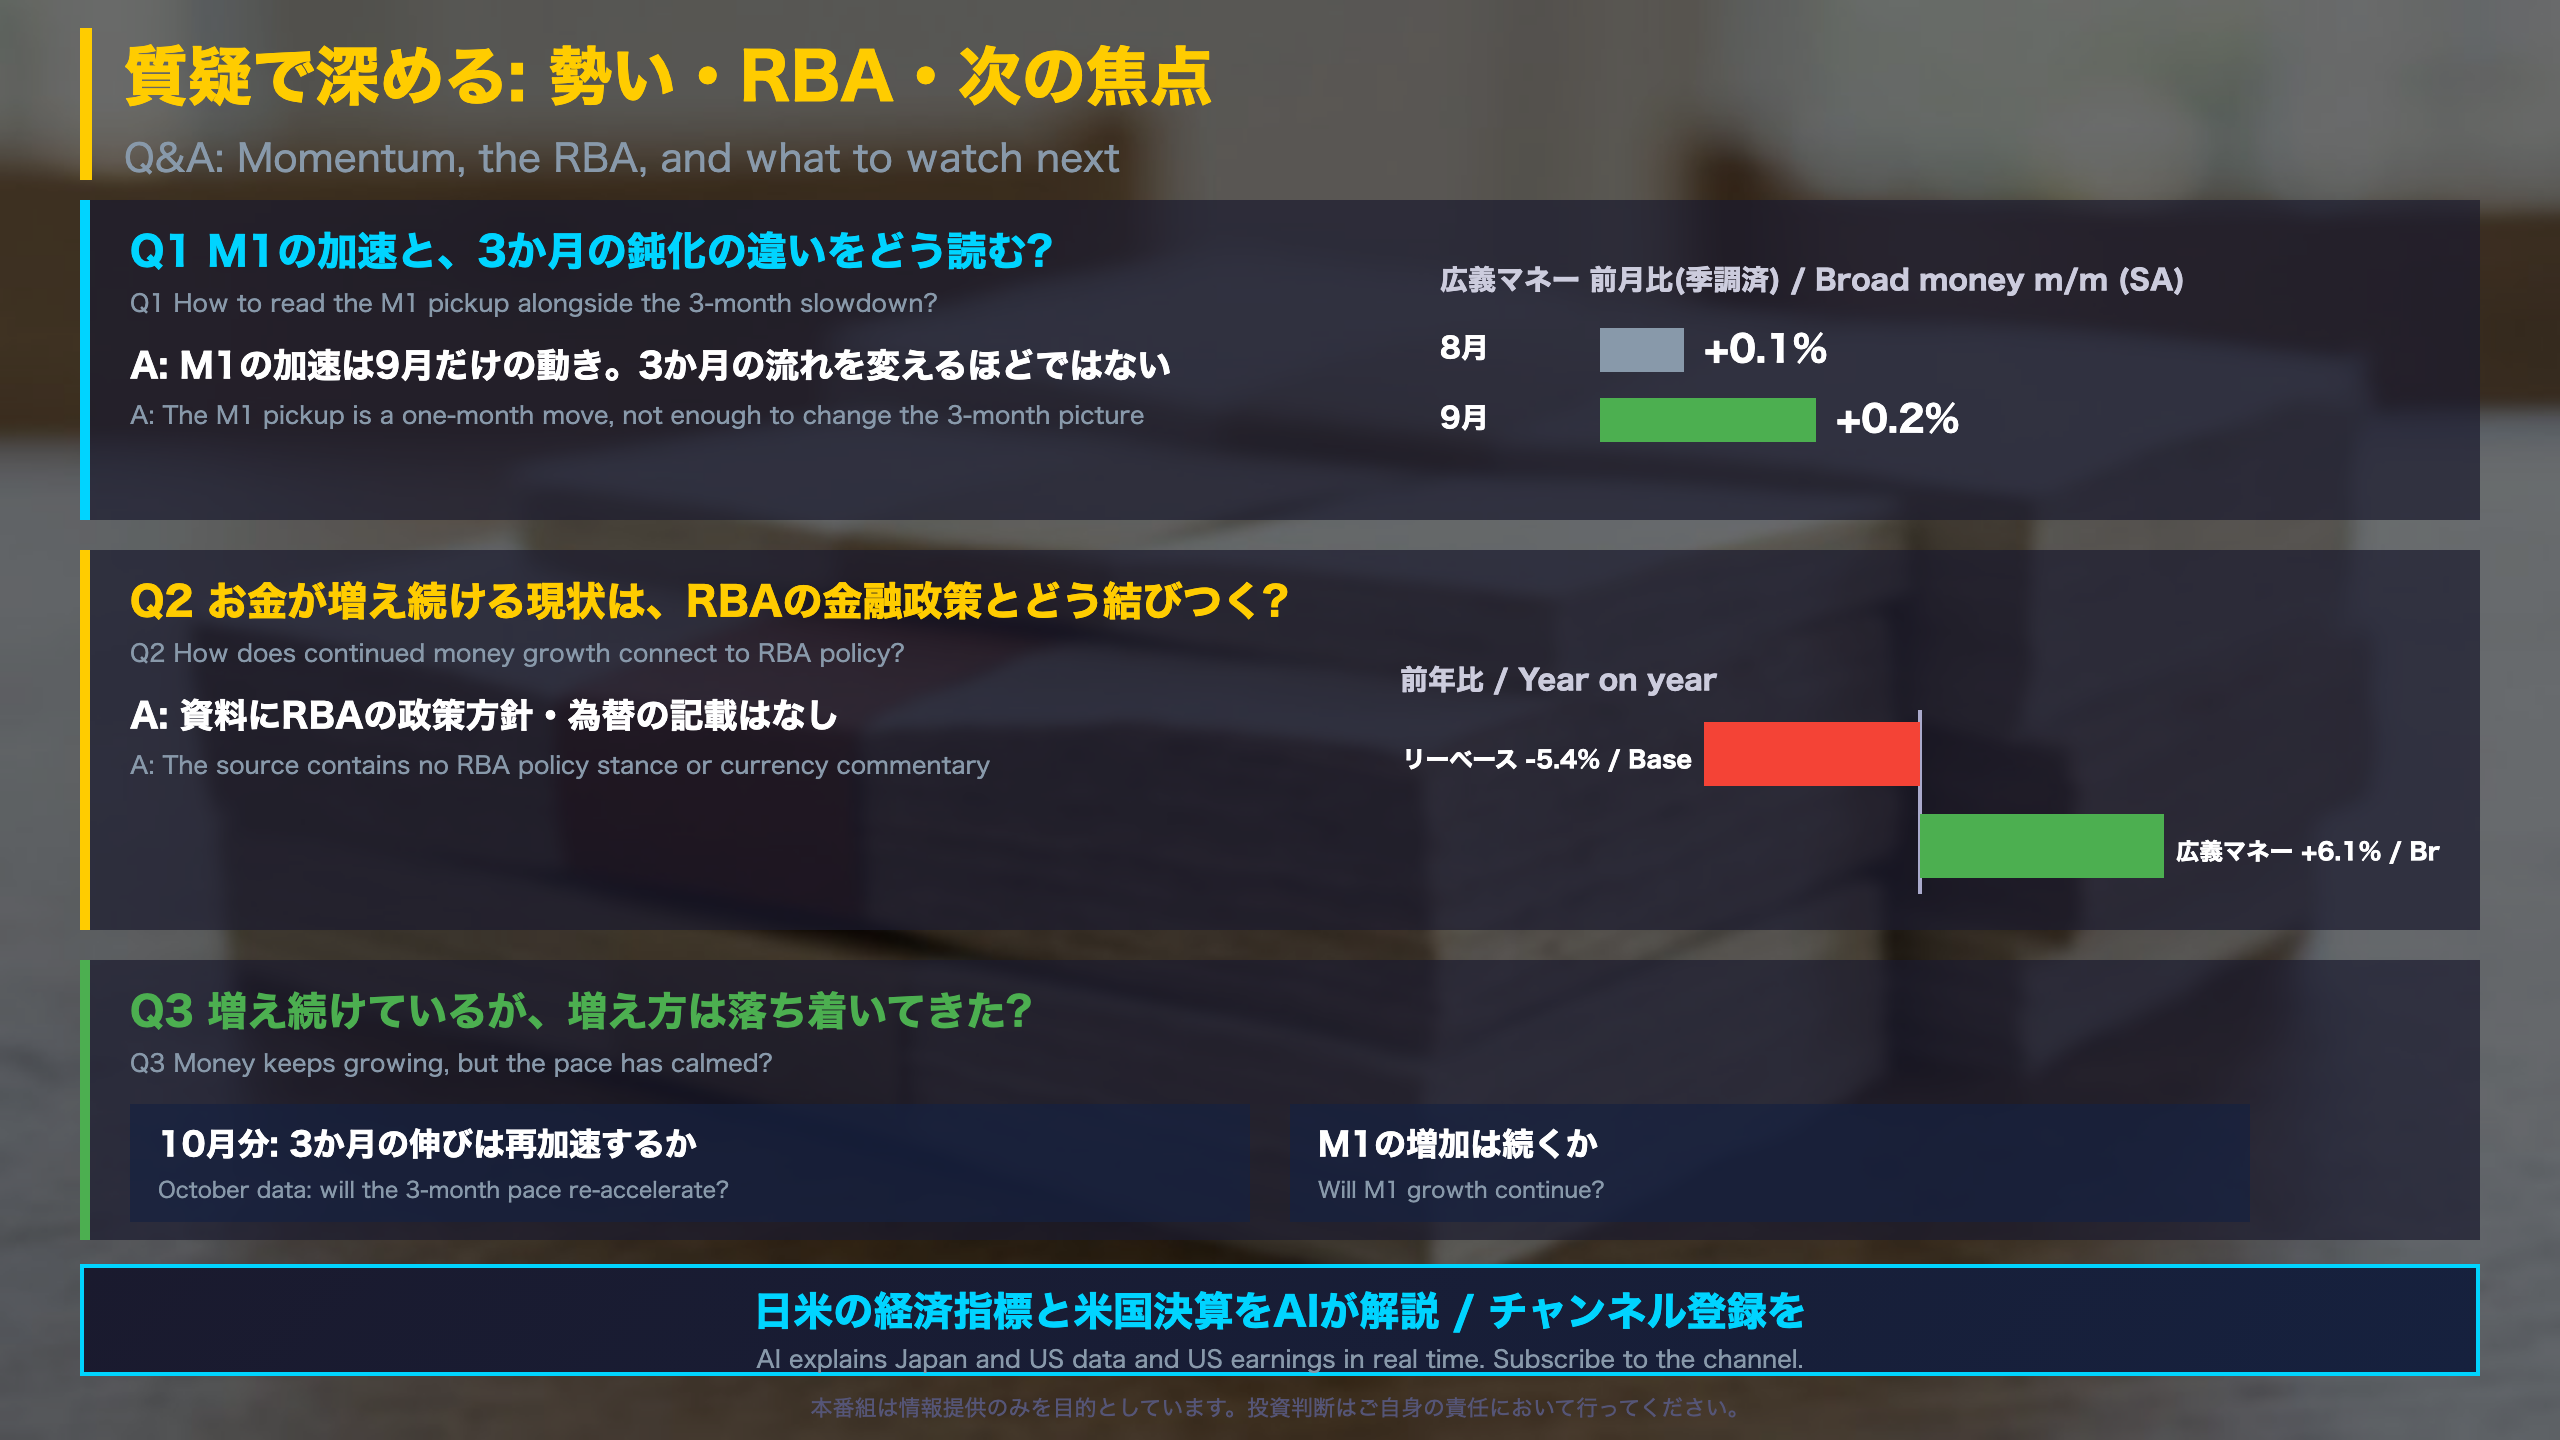
The monetary base versus broad money
The monetary base (series DMAMMB), the money the central bank supplies directly, was 292.13 in September, down from 304.92 in August (-4.2%) and from 308.77 a year earlier (-5.4%). In the table’s first month, September 2023, it was 479.16. Over those three years, unadjusted broad money rose about 20% (2,932.12 to 3,512.14) while the base fell about 39%.
What that suggests
Growth in broad money alongside a shrinking base is consistent with private-sector deposits, rather than central bank money, driving expansion. This is an inference; the source does not attribute causes. The base is also volatile month to month (278.1 in June, 308.0 in July), so one reading should not be over-interpreted.
RBA and the currency
The data release contains no RBA policy guidance and no currency commentary. Monetary aggregates are background indicators of liquidity; the RBA’s policy decisions draw on a much wider set of data. A comparable US series is M2 from the Federal Reserve’s H.6 release.
What to watch in the October data
Annual growth near 6% equals roughly 0.5% a month, or about 1.5% over three months. June-September came in at +0.61%. A move back toward that yardstick, and continued M1 strength, would be the data points to check. This is arithmetic, not a forecast.
Disclaimer: This article is for informational purposes only. All investment decisions are made solely at your own risk.