📺 Watch the Full Video Analysis
This article was automatically generated by the NFC Market Live AI analysis system. (Updated: 2026-10-30 05:24 JST)
📊 Amazon’s Q3 2026 results explained.
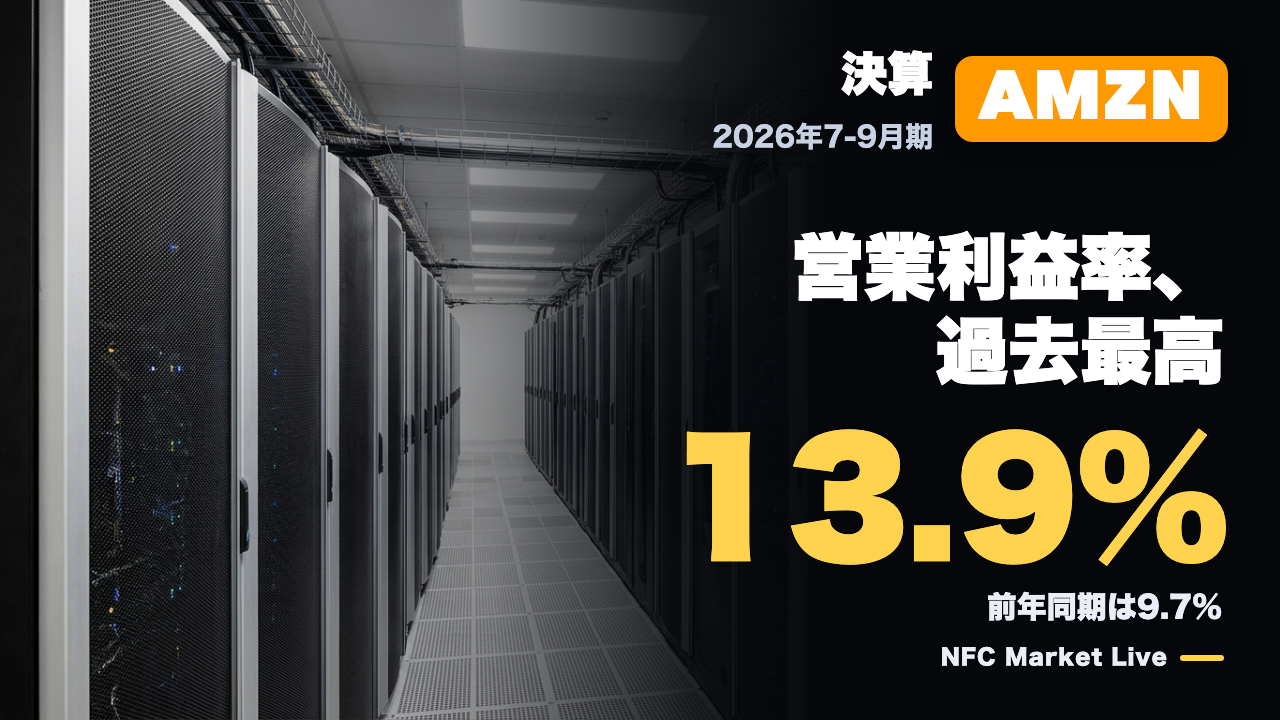
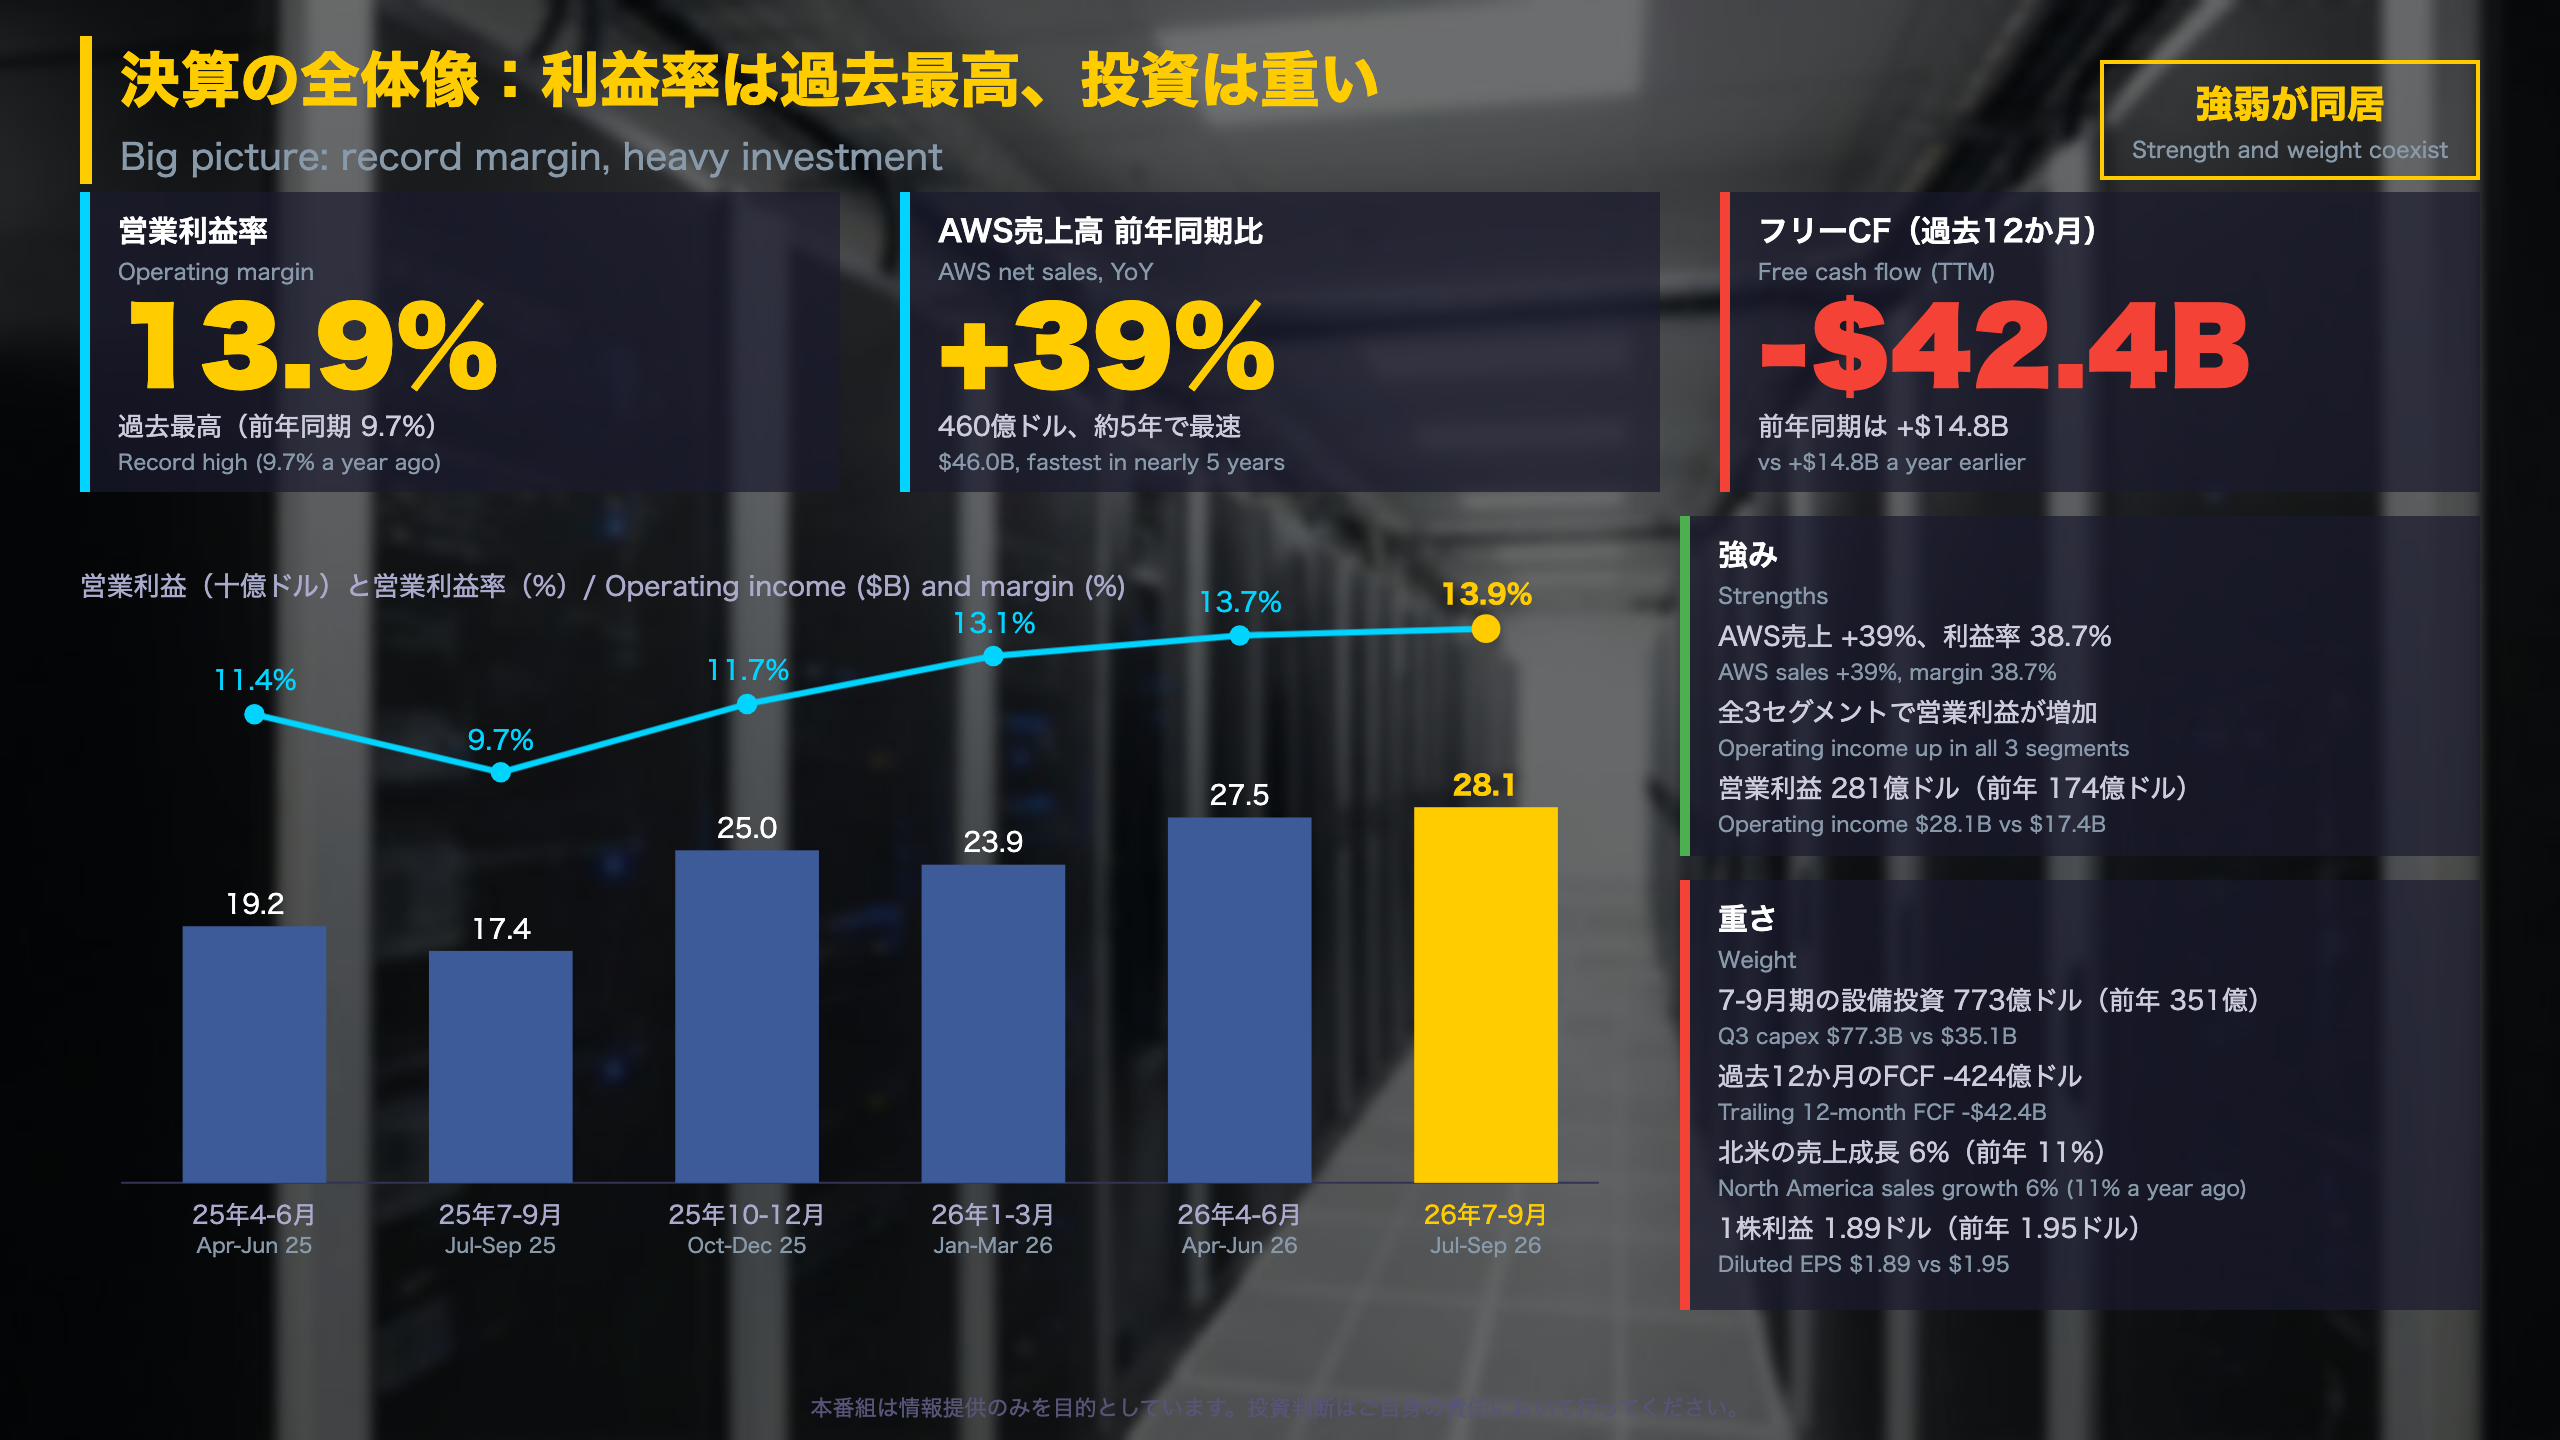
Net sales were $201.9B (+12% YoY) and the 13.9% operating margin is the highest the company has reported.
📈 AWS sales grew 39% to $46.0B, its fastest pace in nearly five years.
⚠️ Capital spending outran operating cash flow, so trailing-12-month free cash flow was an outflow of $42.4B.
💡 Diluted EPS was $1.89 vs $1.95, as last year’s quarter included gains on the Anthropic investment. Q4 guidance: net sales $240.0-247.0B, operating income $28.5-33.5B.
決算の全体像:利益率は過去最高、投資は重い
Amazon Q3 2026: the numbers behind the headline
This is Amazon’s 8-K earnings release (Exhibit 99.1), reported on a GAAP basis; the release does not provide an adjusted EPS figure. Net sales were $201.9B (+12%) and operating income was $28.1B versus $17.4B a year earlier. The 13.9% operating margin is the highest the company has reported, up from 13.7% last quarter and 9.7% a year ago.
Segment view
- North America: sales $112.9B (+6%), operating income $8.7B, margin 7.7% (4.5% a year ago)
- International: sales $43.1B (+5%, +8% ex-FX), operating income $1.6B, margin 3.7%
- AWS: sales $46.0B (+39%), operating income $17.8B, margin 38.7%
Why retail growth looks slower
Amazon notes that Prime Day moved to Q2 in most large countries this year, after falling entirely in Q3 in 2025. It says that excluding the shift, Q3 growth would have been about 400 basis points higher. Growth ex-FX slowed to 13% from 20% in Q2, so part of the deceleration is calendar-driven, though the size of that effect rests on the company’s own estimate.
Context for readers outside Japan
This channel covers Japanese and US macro data alongside major US earnings. Amazon’s consolidated margin is increasingly shaped by its cloud segment: AWS is 23% of sales but produced $17.8B of the $28.1B in operating income.
What to watch
The Q4 guidance, net sales of $240.0-247.0B and operating income of $28.5-33.5B, is the next checkpoint. The release does not state the date of the next earnings report.
解説1:AWSの加速
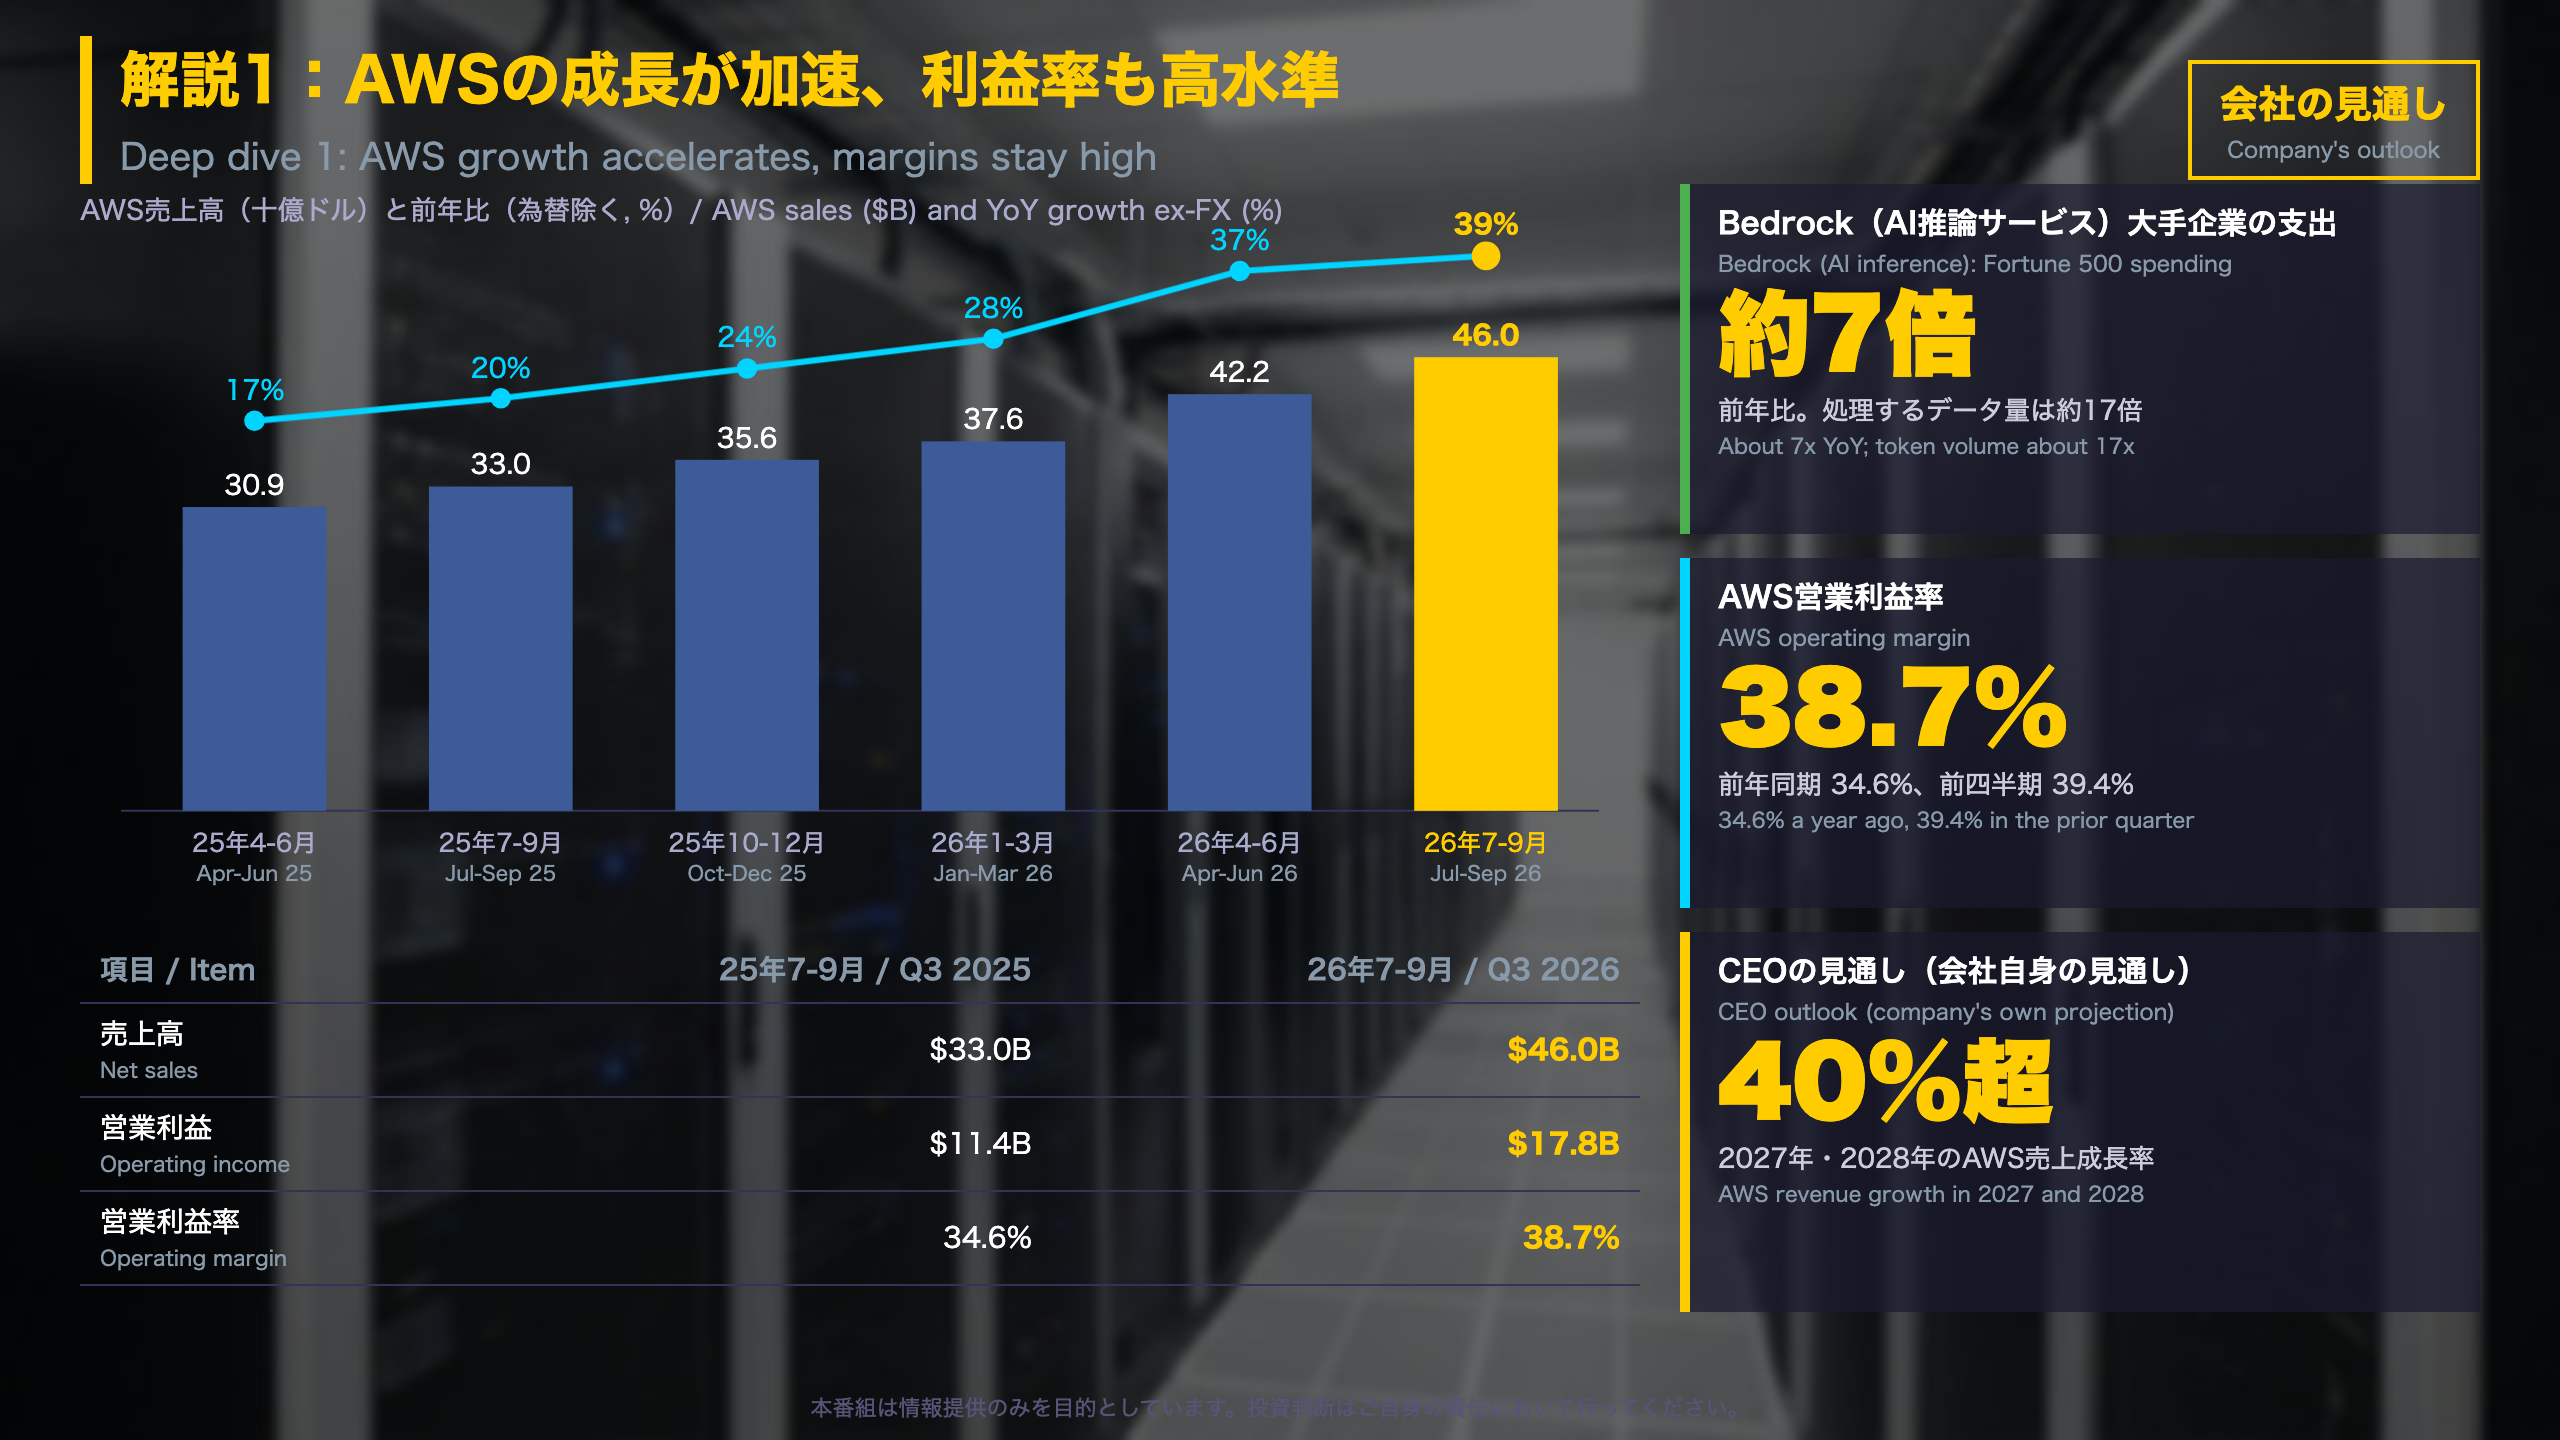
AWS in detail: acceleration with high margins
AWS is Amazon’s cloud segment and the profit engine of the group. Its sales growth ex-FX has risen every quarter shown in the release: 17%, 20%, 24%, 28%, 37% and now 39%, with sales of $46.0B. Operating margin was 38.7%, versus 34.6% a year earlier and 39.4% in Q2. Trailing-12-month AWS sales were $161.4B (+32%) and operating income was $61.0B (+39%).
What the company points to
- Bedrock (a managed service for running AI models): Fortune 500 spending up nearly 7x year over year, token volume up nearly 17x.
- AgentCore (infrastructure for AI agents): tens of thousands of customers; 2x more agents deployed in Q3 than in the prior three quarters combined.
- Lambda passed a $1B annualized revenue run rate.
- New agreements with Meta, NVIDIA, OpenAI, Oracle and others.
The CEO’s statement
Andy Jassy said the AWS investment is working, citing 39%+ growth and a $184B run rate, and projected growth of more than 40% in both 2027 and 2028. Treat this as management’s projection, not a reported result.
Reading it in context
US investors usually compare AWS with the cloud segments reported by other large technology firms; the release itself contains no such comparison, so none is made here. Within Amazon’s own numbers, the bull reading is that growth and margin are rising together. The cautious reading is that margin eased slightly from Q2 while capital intensity is rising sharply (see the cash flow slide).
Next checkpoints
Watch AWS growth versus the 39% base and the margin versus 38.7%, alongside the roughly $220B 2026 capex guidance.
解説2:稼ぐ現金を設備投資が上回る
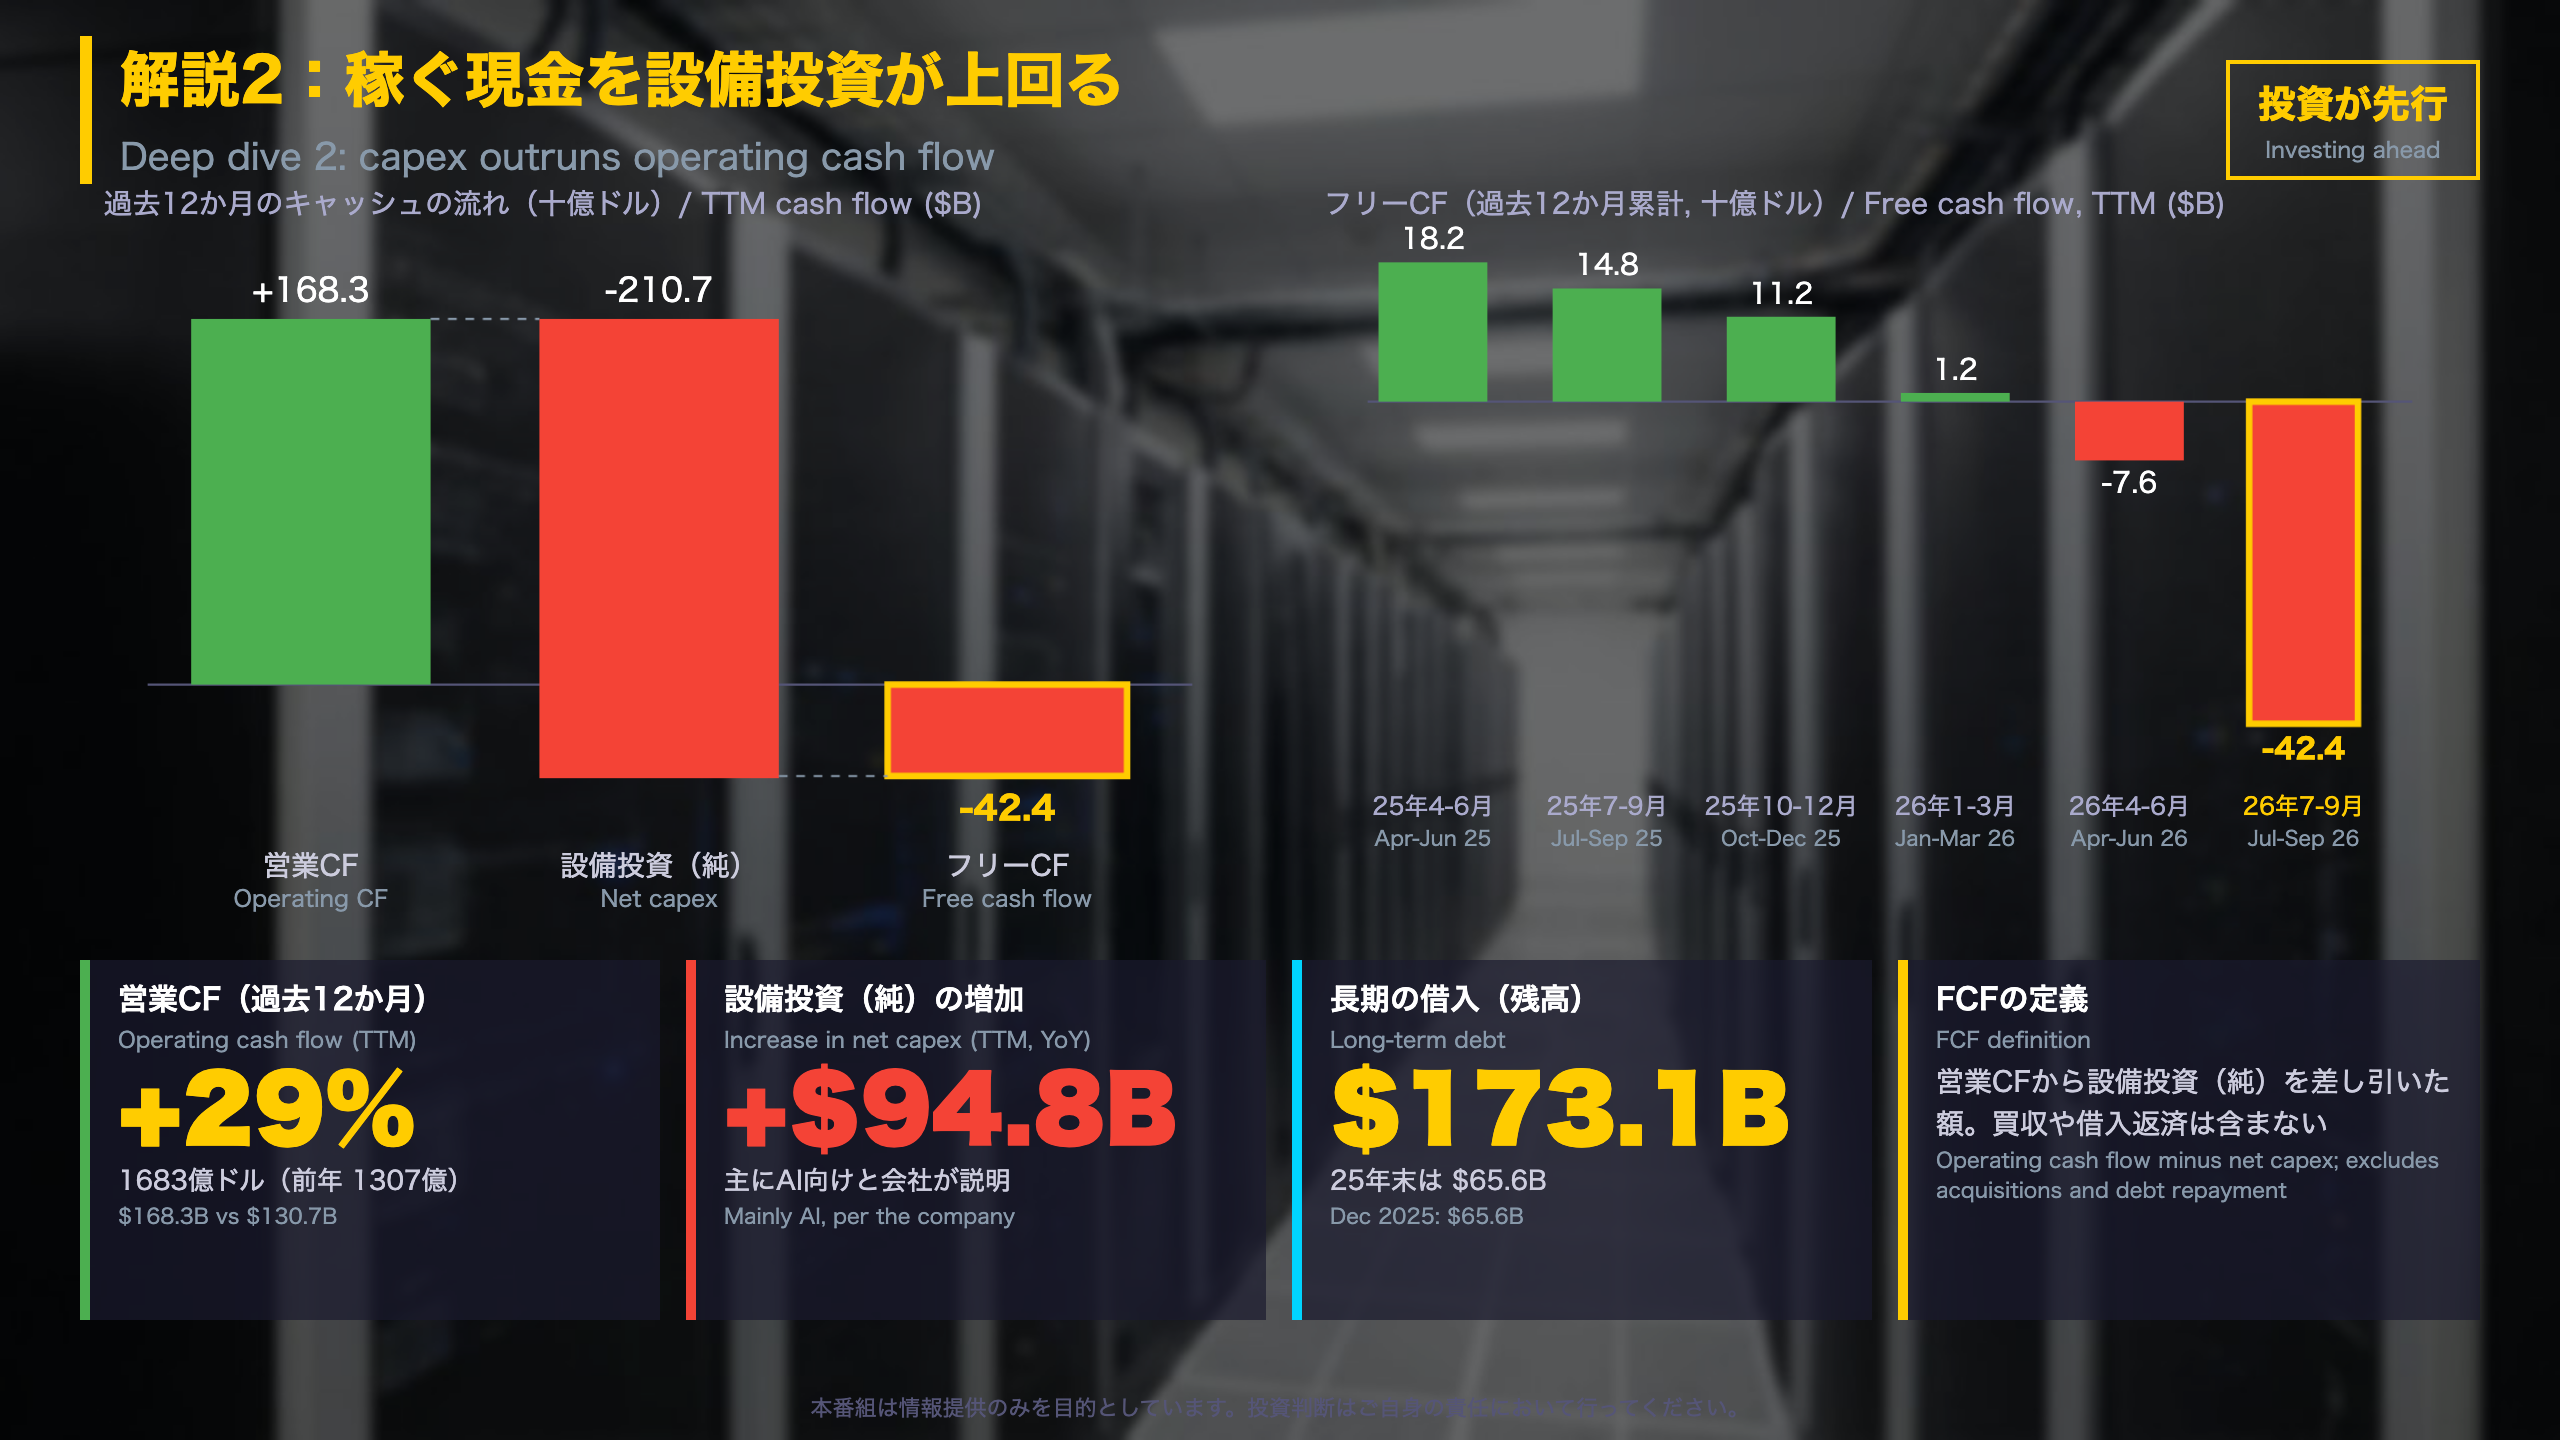
Cash flow: the cost side of the AI build-out
Amazon defines free cash flow (FCF) as operating cash flow minus purchases of property and equipment, net of proceeds from sales and incentives. On that basis, trailing-12-month FCF was -$42.4B versus +$14.8B a year earlier. Operating cash flow rose 29% to $168.3B, while net capex rose to $210.7B, an increase of $94.8B that the company ties mainly to AI.
| TTM ($B) | Q2 25 | Q3 25 | Q4 25 | Q1 26 | Q2 26 | Q3 26 |
|---|---|---|---|---|---|---|
| Operating cash flow | 121.1 | 130.7 | 139.5 | 148.5 | 161.4 | 168.3 |
| Net capex | 103.0 | 115.9 | 128.3 | 147.3 | 169.0 | 210.7 |
| Free cash flow | 18.2 | 14.8 | 11.2 | 1.2 | -7.6 | -42.4 |
Funding and balance sheet
In Q3 alone Amazon raised $48.1B of long-term debt (none a year earlier). Long-term debt stood at $173.1B at September 30 versus $65.6B at year-end 2025, while net property and equipment rose to $508.9B from $357.0B. Interest expense was $1.7B in the quarter versus $0.5B a year ago, and depreciation and amortization was $20.9B versus $16.8B.
How to read it
The constructive view is that operating cash generation is growing about 29% and the assets being built support AWS growth that is accelerating. The cautious view is that fixed costs, such as depreciation and interest, are rising with the asset base, and FCF excludes acquisitions and debt repayment, so it is not a full picture of cash available. Full-year 2026 capex is guided at about $220B.
Metrics to watch
TTM operating cash flow versus TTM net capex, and the pace at which AWS revenue absorbs the new capacity.
質疑:1株利益と今後の見通し
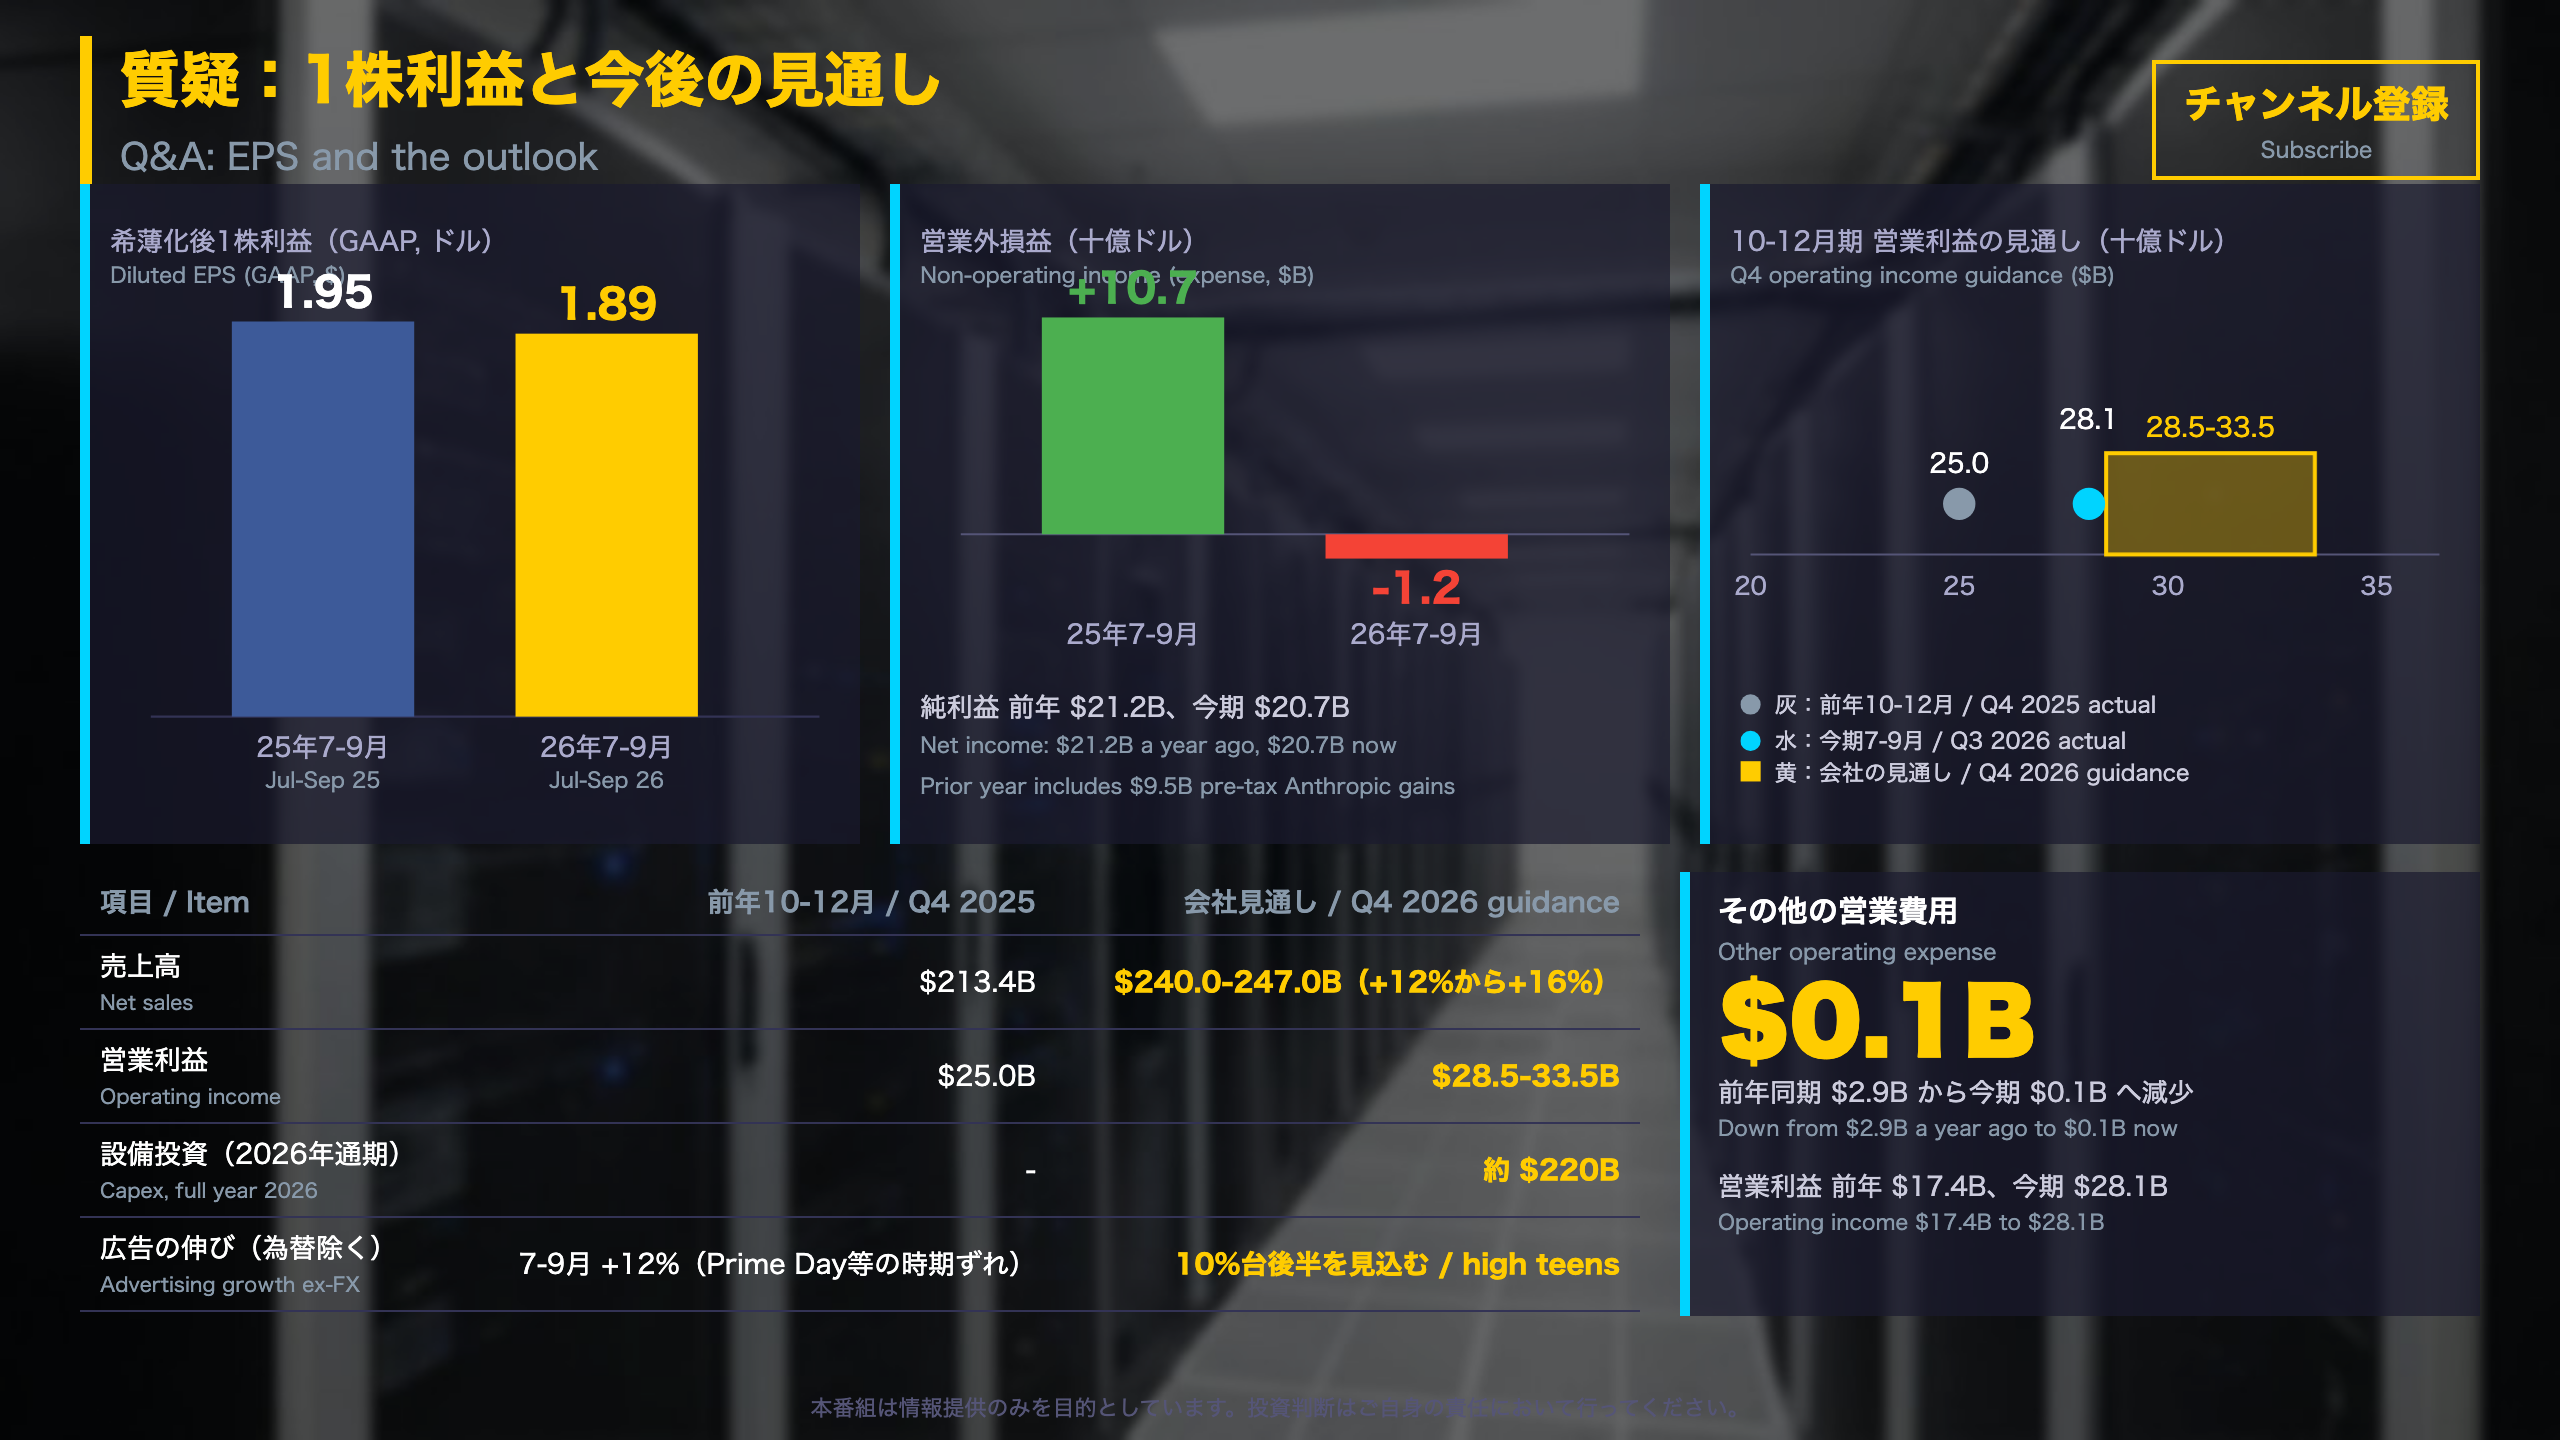
Decomposing the profit line
The release is GAAP only. Diluted EPS was $1.89 versus $1.95, and net income $20.7B versus $21.2B, even though operating income rose from $17.4B to $28.1B. The gap sits below the operating line:
| $B | Q3 2025 | Q3 2026 |
|---|---|---|
| Operating income | 17.4 | 28.1 |
| Non-operating income (expense) | +10.7 | -1.2 |
| Income taxes | 6.9 | 6.2 |
| Net income | 21.2 | 20.7 |
Amazon says Q3 2025 included $9.5B of pre-tax gains on its Anthropic investments in non-operating income. This quarter, interest expense rose to $1.7B from $0.5B, and non-operating items were a small net negative.
Quality of the operating beat
Other operating expense fell to $0.1B from $2.9B a year ago, so part of the operating income gain comes from a lower line item rather than from sales growth alone. The release does not explain what the year-ago expense consisted of.
Q4 guidance
- Net sales $240.0-247.0B (+12% to +16%, including about 60 bp of FX headwind)
- Operating income $28.5-33.5B versus $25.0B a year earlier
- Advertising growth to return to the high teens after 12% ex-FX in Q3, which Amazon links to Prime Day timing
- 2026 capex of about $220B
For investors outside Japan
This is a company-level earnings release rather than a Japanese statistic, so the usual institutions (BOJ, MOF) are not involved. The release states no EPS guidance and the next earnings date is not given. Watch whether Q4 operating income lands within the guided range and how much of any gain comes from underlying sales versus lower expense lines.
Disclaimer: This article is for informational purposes only. All investment decisions are made solely at your own risk.