📺 Watch the Full Video Analysis
This article was automatically generated by the NFC Market Live AI analysis system. (Updated: 2026-10-29 20:41 JST)
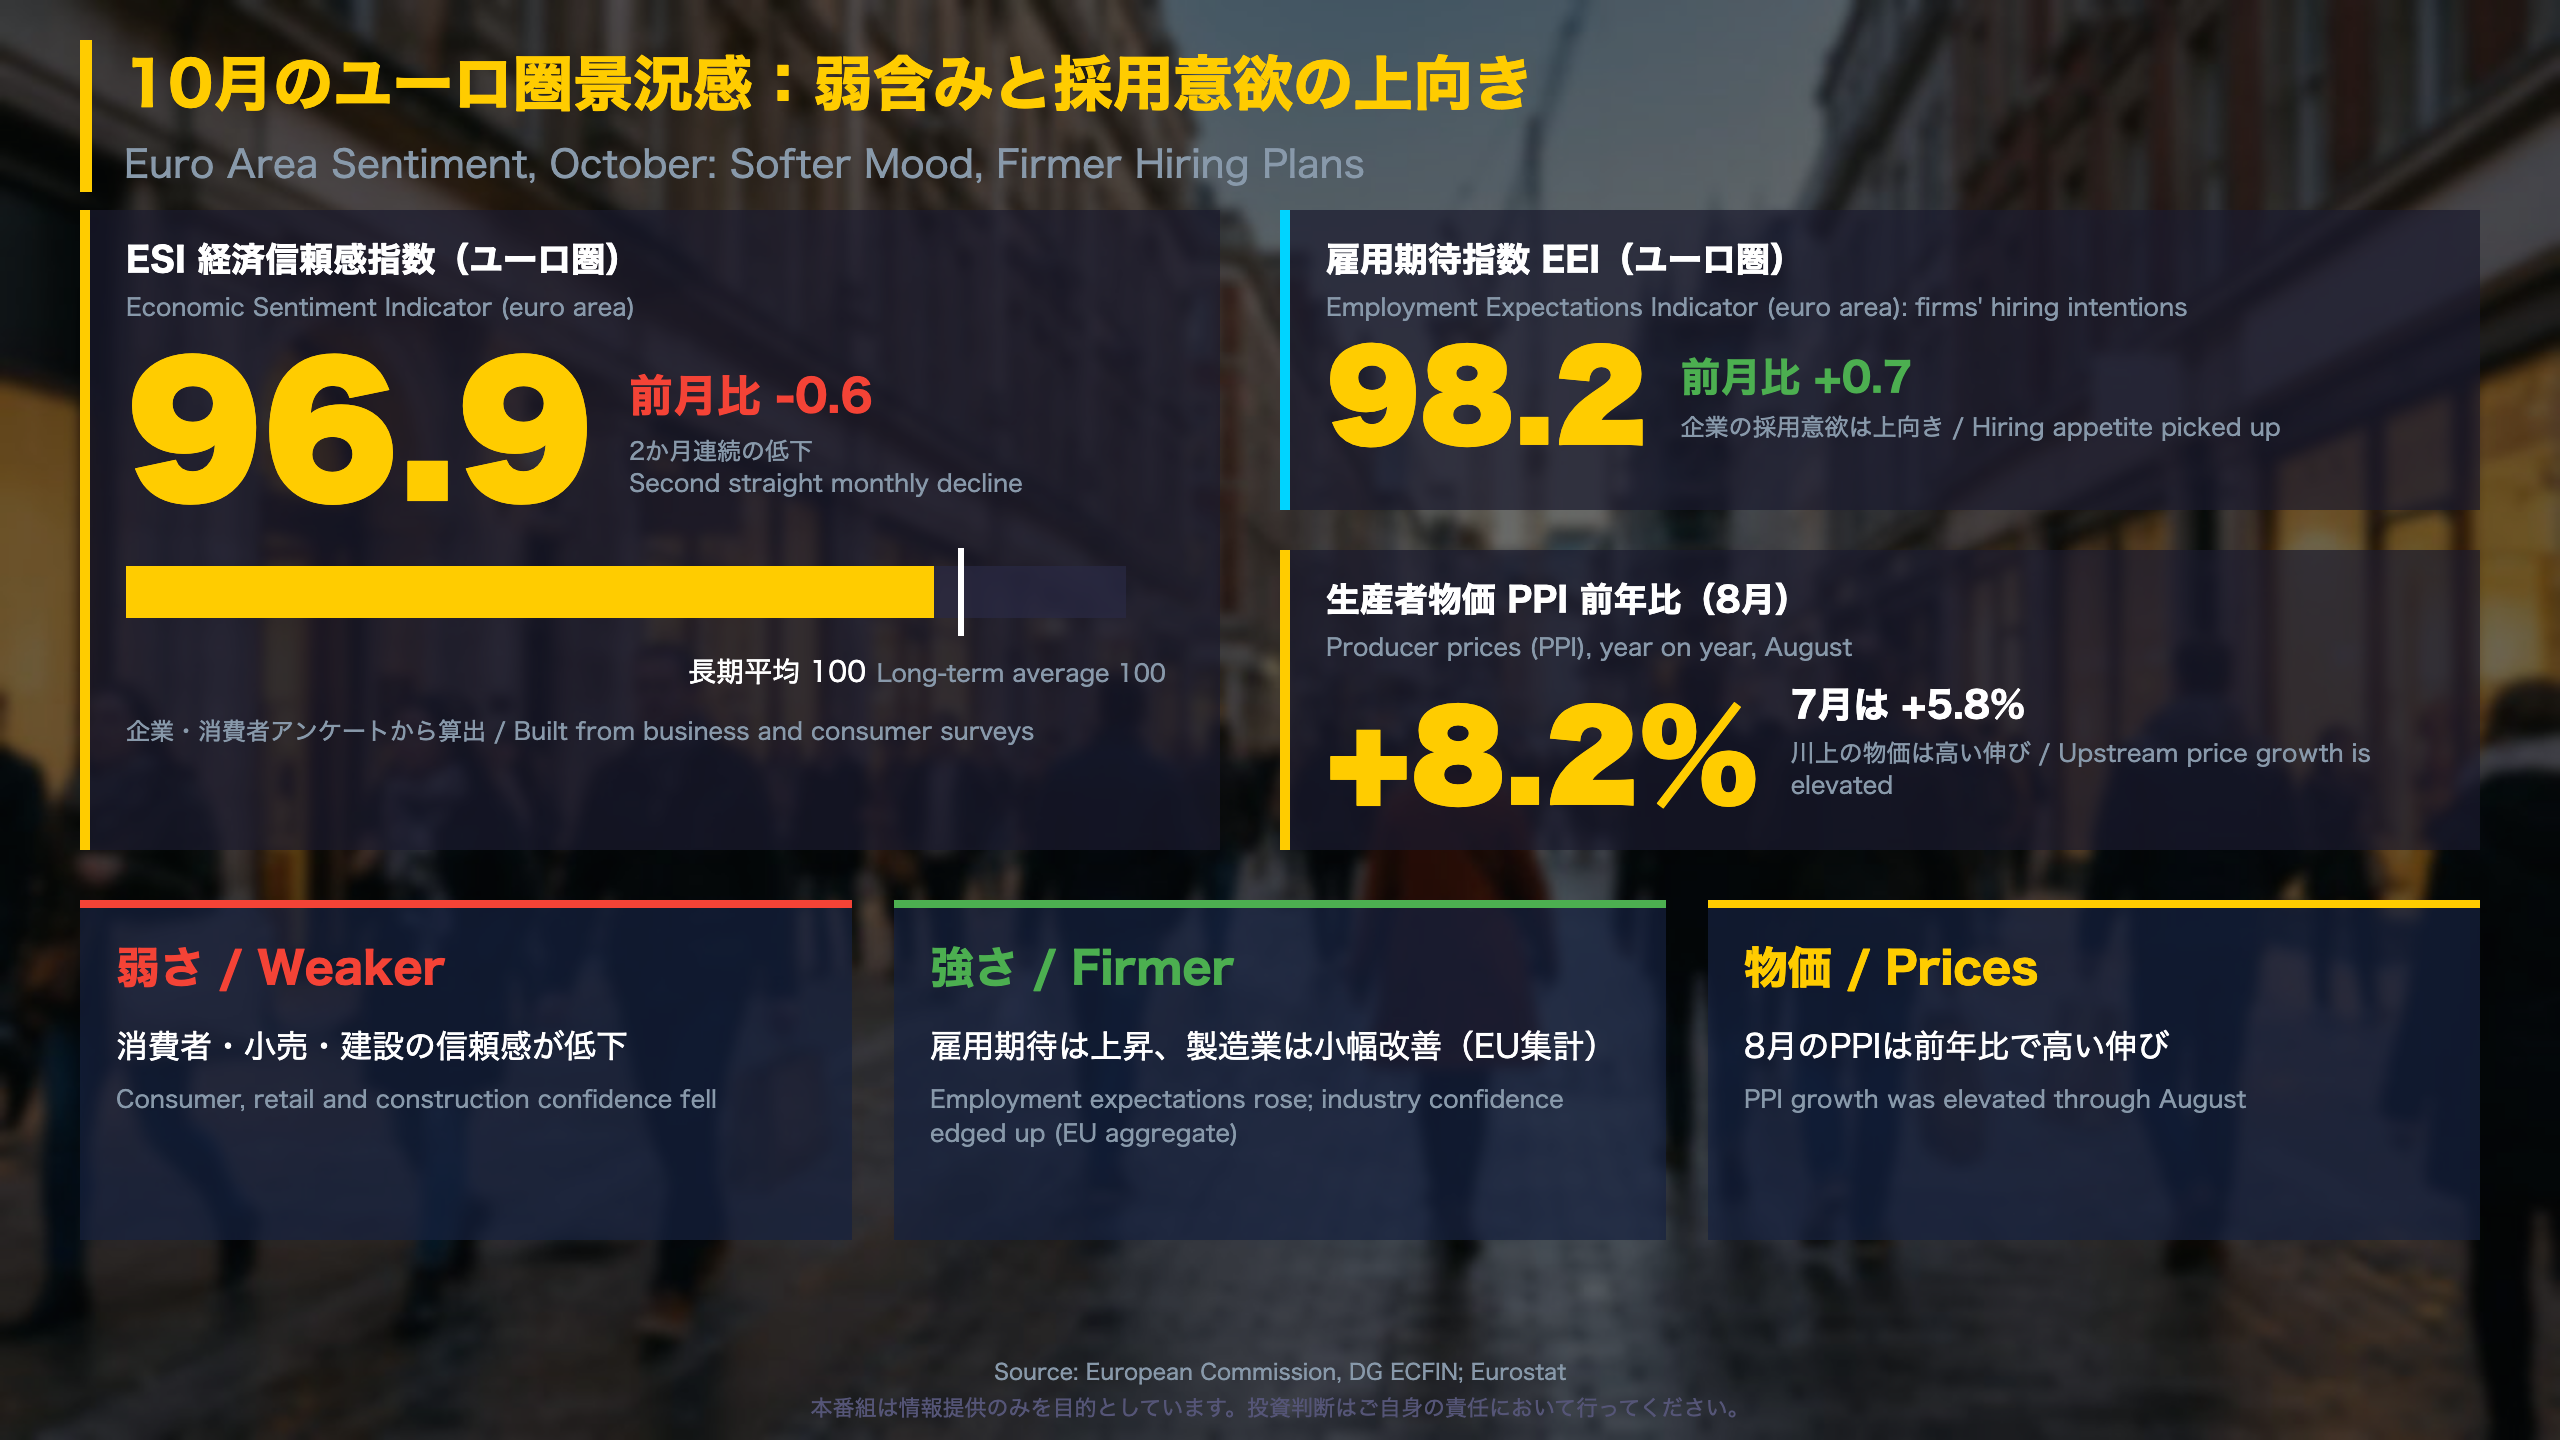
📊 The European Commission’s October survey showed the euro area Economic Sentiment Indicator falling 0.6 points to 96.9, a second straight decline.
📉 Consumer, retail and construction confidence weakened,
📈 while the Employment Expectations Indicator rose 0.7 points to 98.2.
💡 Eurostat data show August producer prices up 8.2% year on year, so activity and price pressure point in different directions.
⚠️ Industry confidence rose in the EU aggregate but fell in the Eurostat series, a discrepancy worth noting.
We cover both the strengths and the weaknesses of this release.
サマリー:景況感は弱含み、採用意欲は上向き
What the October ESI tells us
Who publishes this? The survey comes from the European Commission’s Directorate-General for Economic and Financial Affairs (DG ECFIN), harmonised across EU member states. Its headline gauge, the Economic Sentiment Indicator (ESI), blends confidence readings from industry, services, retail, construction and consumers, scaled so that the long-term average (2000-2025) equals 100. It is the euro area’s closest analogue to combining US business surveys such as the ISM with the University of Michigan consumer sentiment reading.
Key readings
- ESI: 96.9 in both the EU and euro area, down 0.6 points
- Employment Expectations Indicator: 98.2 (euro area, +0.7) and 98.9 (EU, +0.6)
- Country moves: Netherlands -3.4, Germany -0.7, Spain -0.5; Italy +0.8, Poland +0.2, France +0.1
Data caveats
September was revised after updated French business data and the re-inclusion of Italian consumer data, which carry a structural break between August and September 2026. Comparisons across the two releases should therefore be read with care.
Balance of evidence
The dip is small and hiring intentions rebounded, so this is not a collapse signal. But two straight declines keep the index drifting away from 100. For holders of euro assets, including EUR/JPY positions, the release is one input on growth momentum; it does not by itself settle the policy or currency path. The November survey is the next confirmation point.
深掘り1:弱さは家計に近い分野に集中
Sector breakdown: where the October weakness sits
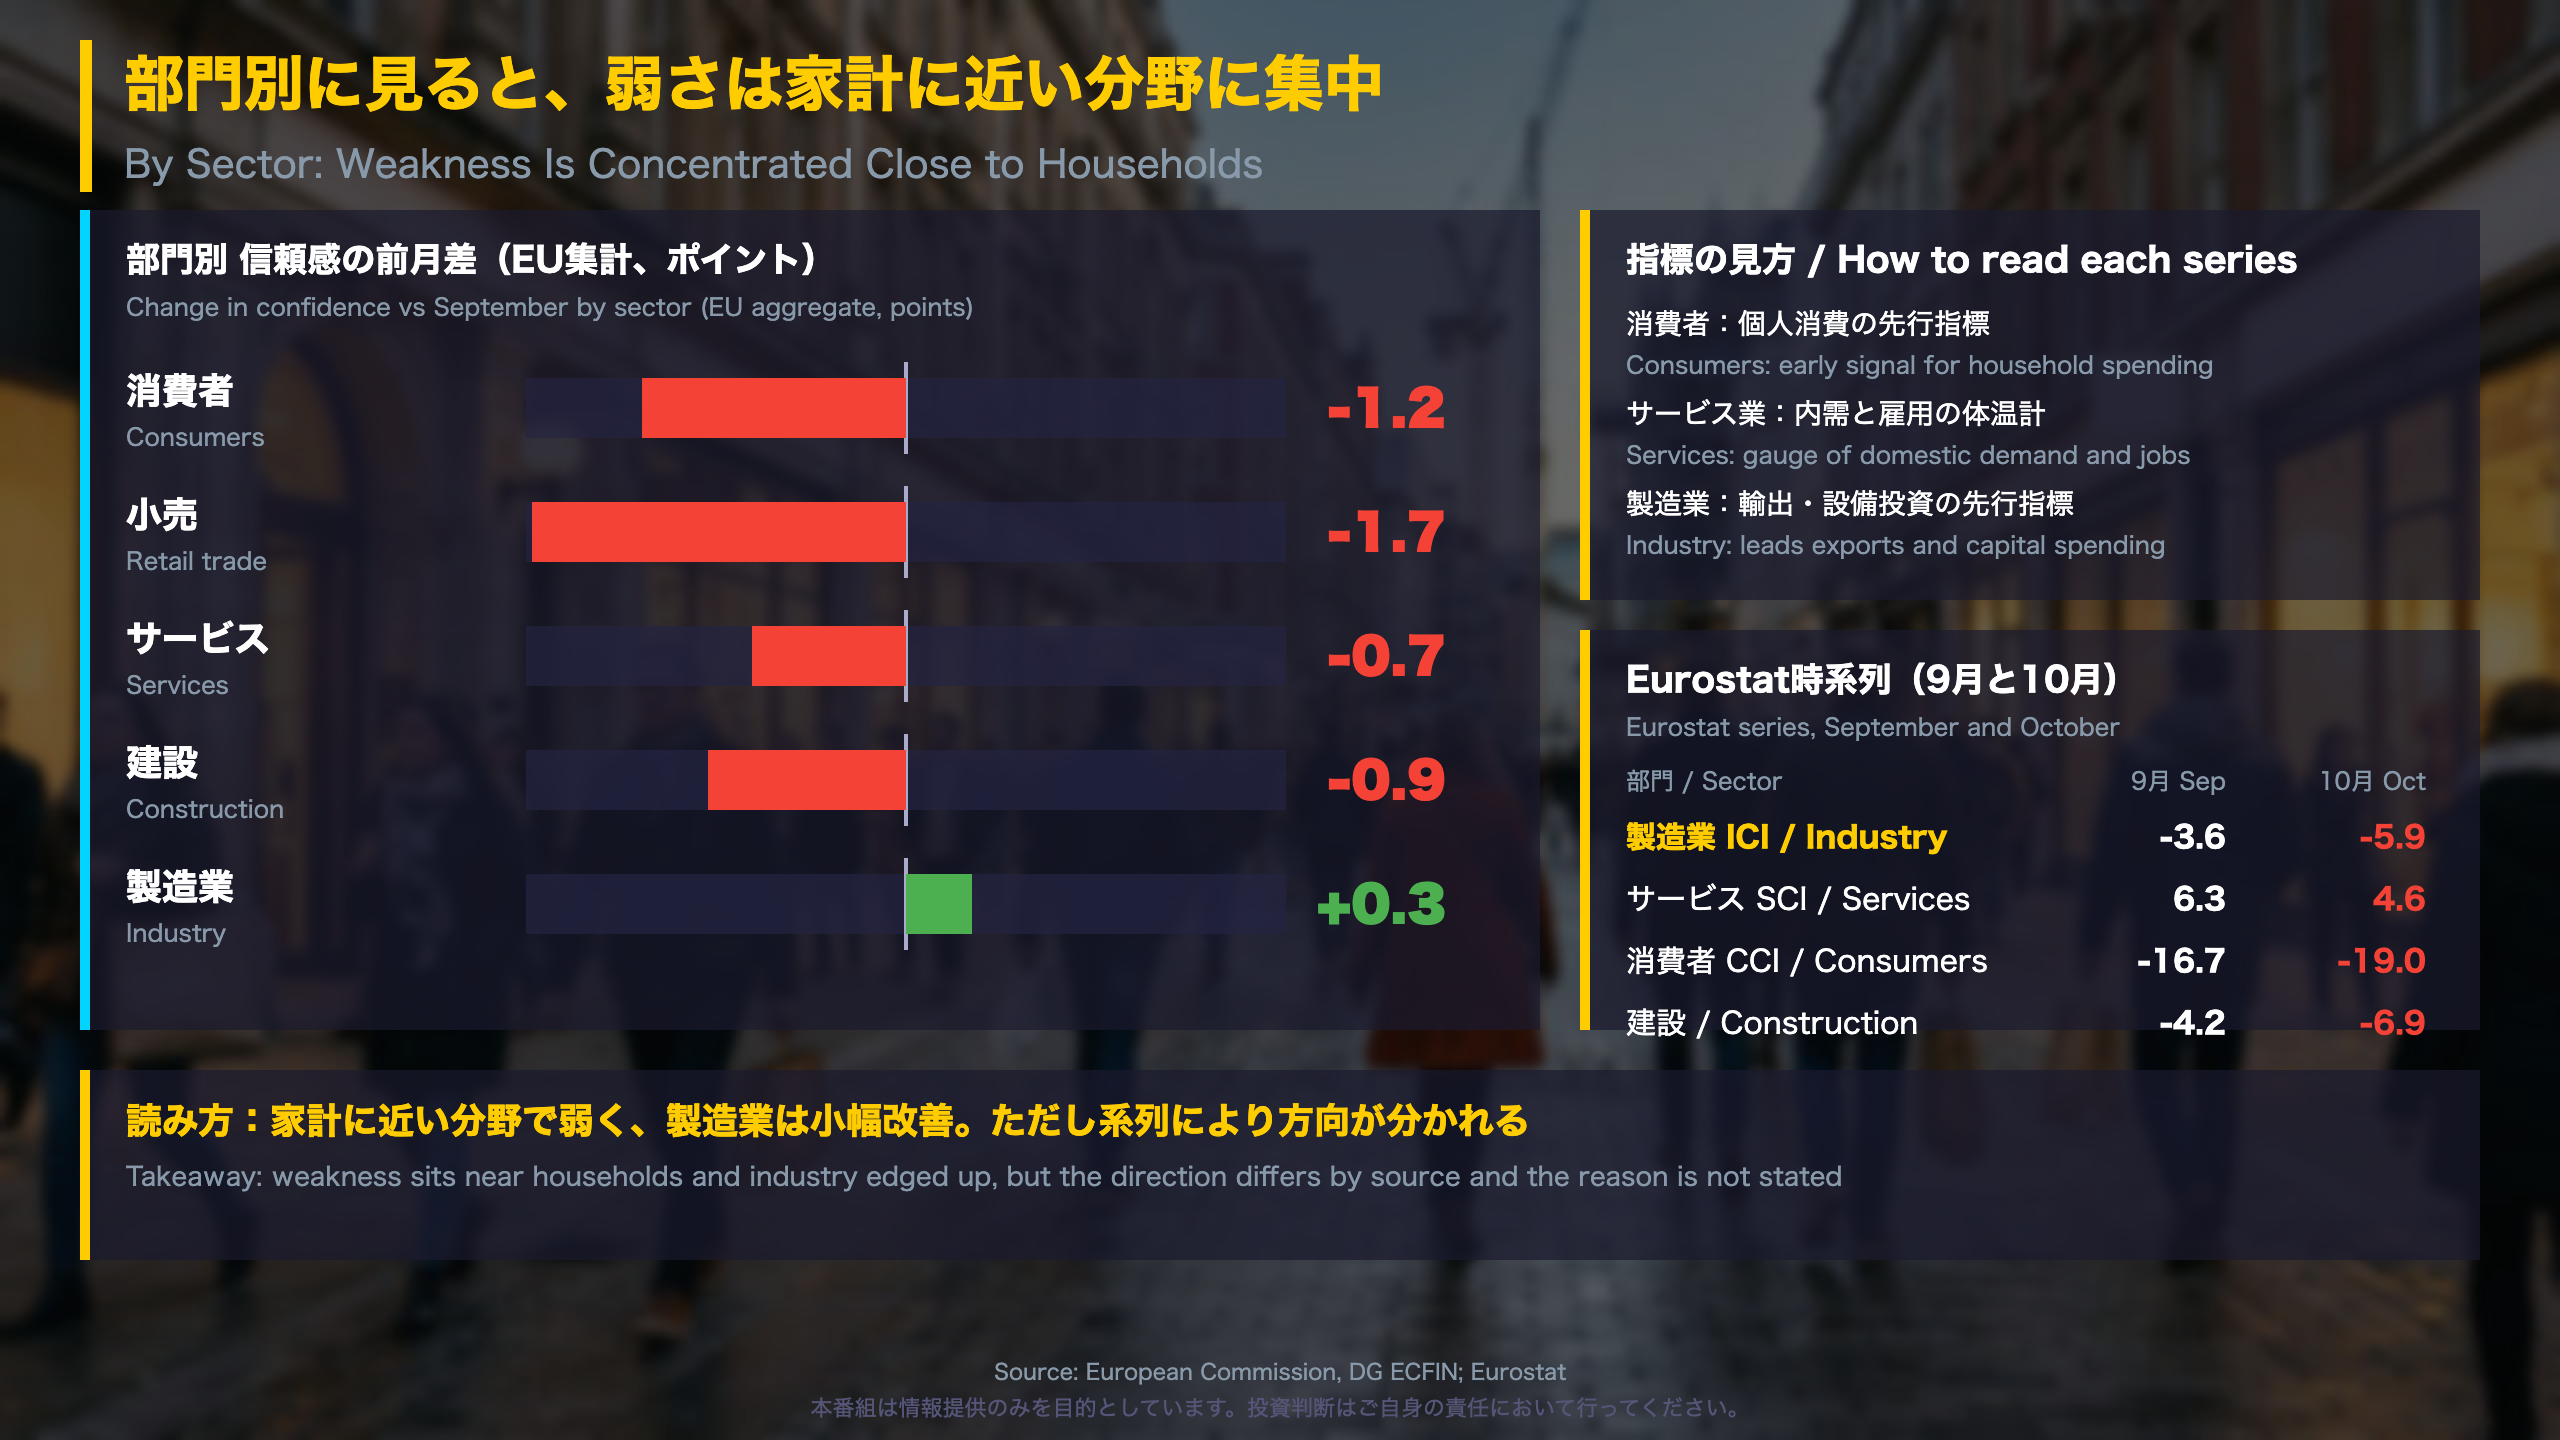
The European Commission’s EU aggregate shows a split picture. Industry edged up 0.3 on better assessments of finished-goods stocks, with recent production and export order books improving markedly. Services fell 0.7 as managers judged demand and the business situation over the past three months more negatively, although demand expectations for the next three months improved. Consumers fell 1.2 on a worse view of household finances and weaker intentions to make major purchases, while expectations for the national economy were largely unchanged. Retail (-1.7) and construction (-0.9) also fell.
Eurostat series, September versus October
| Sector | Sep | Oct |
|---|---|---|
| Industry (ICI) | -3.6 | -5.9 |
| Services (SCI) | 6.3 | 4.6 |
| Consumers (CCI) | -16.7 | -19.0 |
| Construction | -4.2 | -6.9 |
Confidence series are balance-type scores, so negative readings are common; direction and distance from past levels matter more than the sign.
A discrepancy worth flagging
Industry rose in the press release but fell in the Eurostat series. The source material does not explain the gap, which could reflect aggregation scope or revisions. Treat manufacturing signals cautiously.
Why it matters for euro holders
Services and household demand are central to euro area growth, while industry is more exposed to trade. Weakness near households alongside tentative industrial stabilisation is a mixed message, not a one-directional one. Compared with the US, where manufacturing and consumer surveys are published separately, the euro area ESI folds them into one composite, so sector detail is essential.
深掘り2:景気の勢いと川上物価の温度差
Producer prices: a temperature gap with sentiment
What is the PPI? Eurostat’s producer price index tracks the prices producers charge for industrial output. It sits upstream of consumer prices. The US PPI serves a similar purpose, though coverage and methodology differ, so levels should not be compared directly.
The path
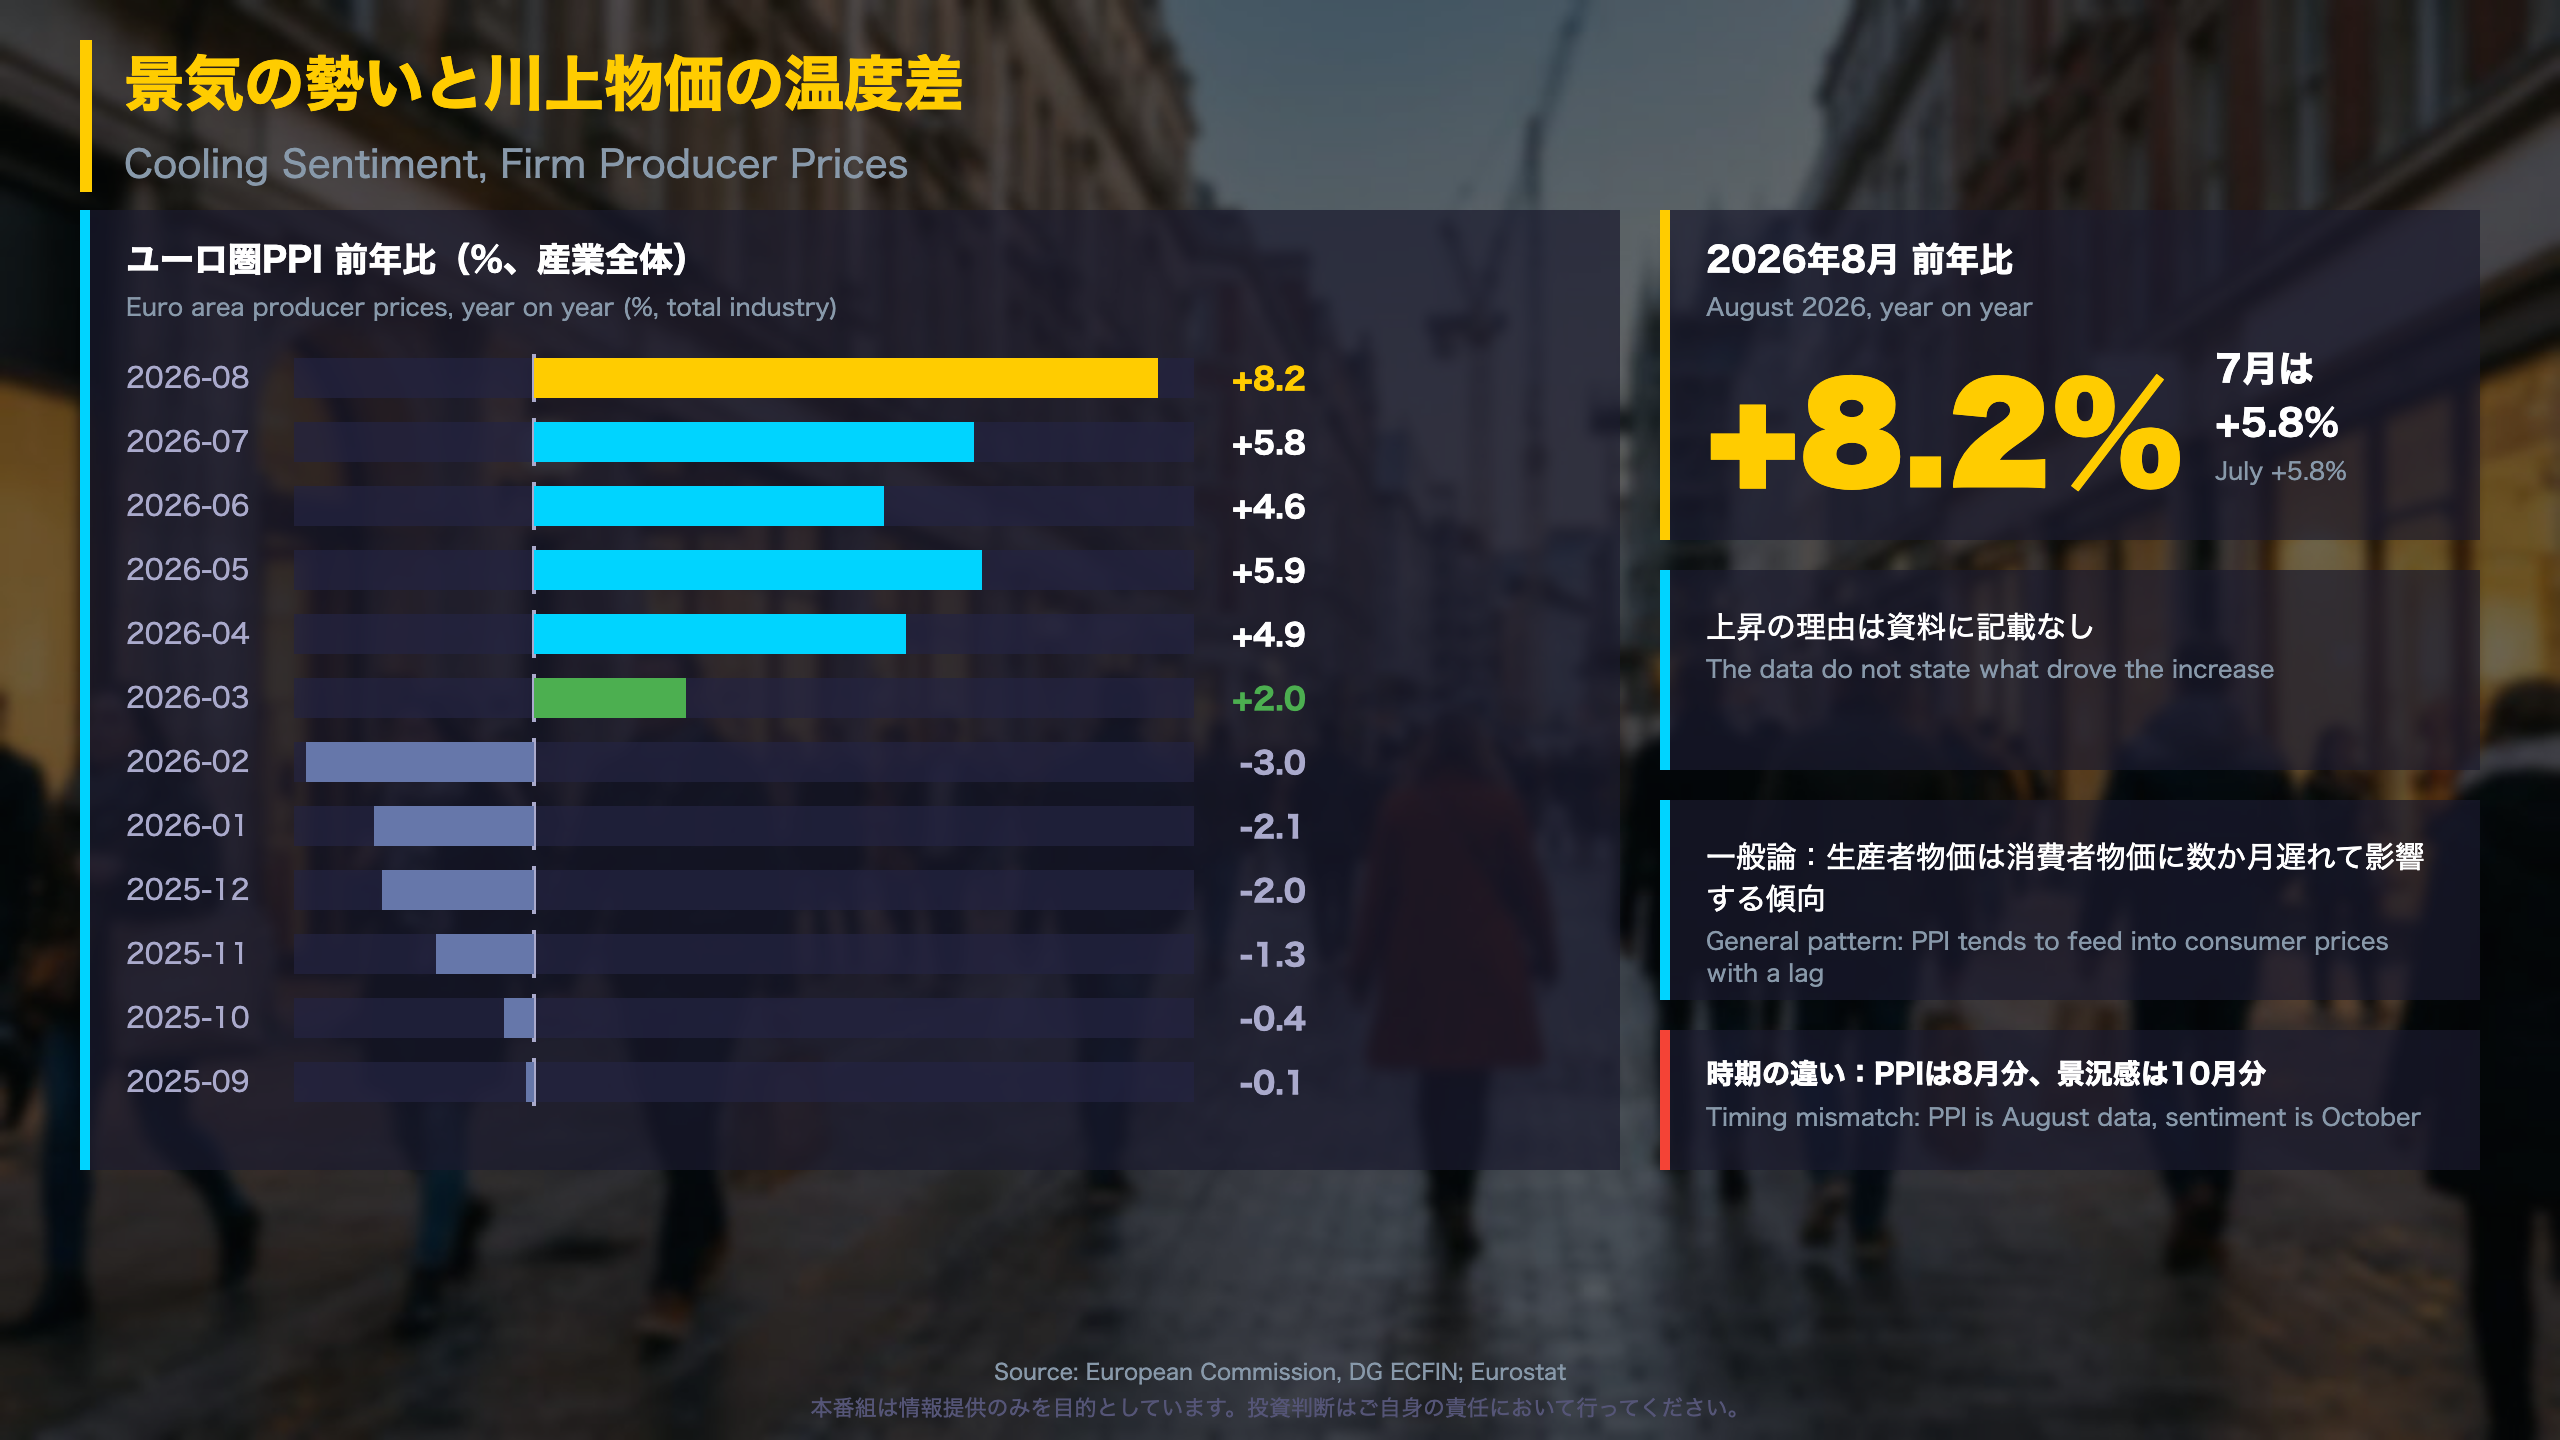
| Month | YoY % |
|---|---|
| Feb 2026 | -3.0 |
| Mar 2026 | +2.0 |
| May 2026 | +5.9 |
| Jun 2026 | +4.6 |
| Jul 2026 | +5.8 |
| Aug 2026 | +8.2 |
August is the highest reading among the twelve months provided (Sep 2025 to Aug 2026). The swing from -3.0 in February to +2.0 in March is the sharpest turn in the series. Year-on-year figures also depend on last year’s base, and the data provided give no breakdown by driver such as energy.
What the Commission says
The survey release notes that managers’ selling price expectations increased, though the text is truncated in our source, so further detail is not available.
Two readings
- Pipeline pressure: producer prices are often watched as a lead indicator for consumer inflation, so a high and rising rate warrants attention.
- Demand constraint: weak consumer confidence could limit how much firms pass on, but this release cannot confirm it.
Why it matters
Central banks, including the ECB, weigh growth and inflation signals together, and the contrast between cooling sentiment and firm producer prices is a reason to watch both. For EUR/JPY holders, this release provides facts rather than a policy signal. September PPI, normally published in early November, is the next check.
質疑:雇用期待と消費者の気持ちをどう読むか
Employment expectations and consumer mood: extra context
What lies behind the hiring indicator
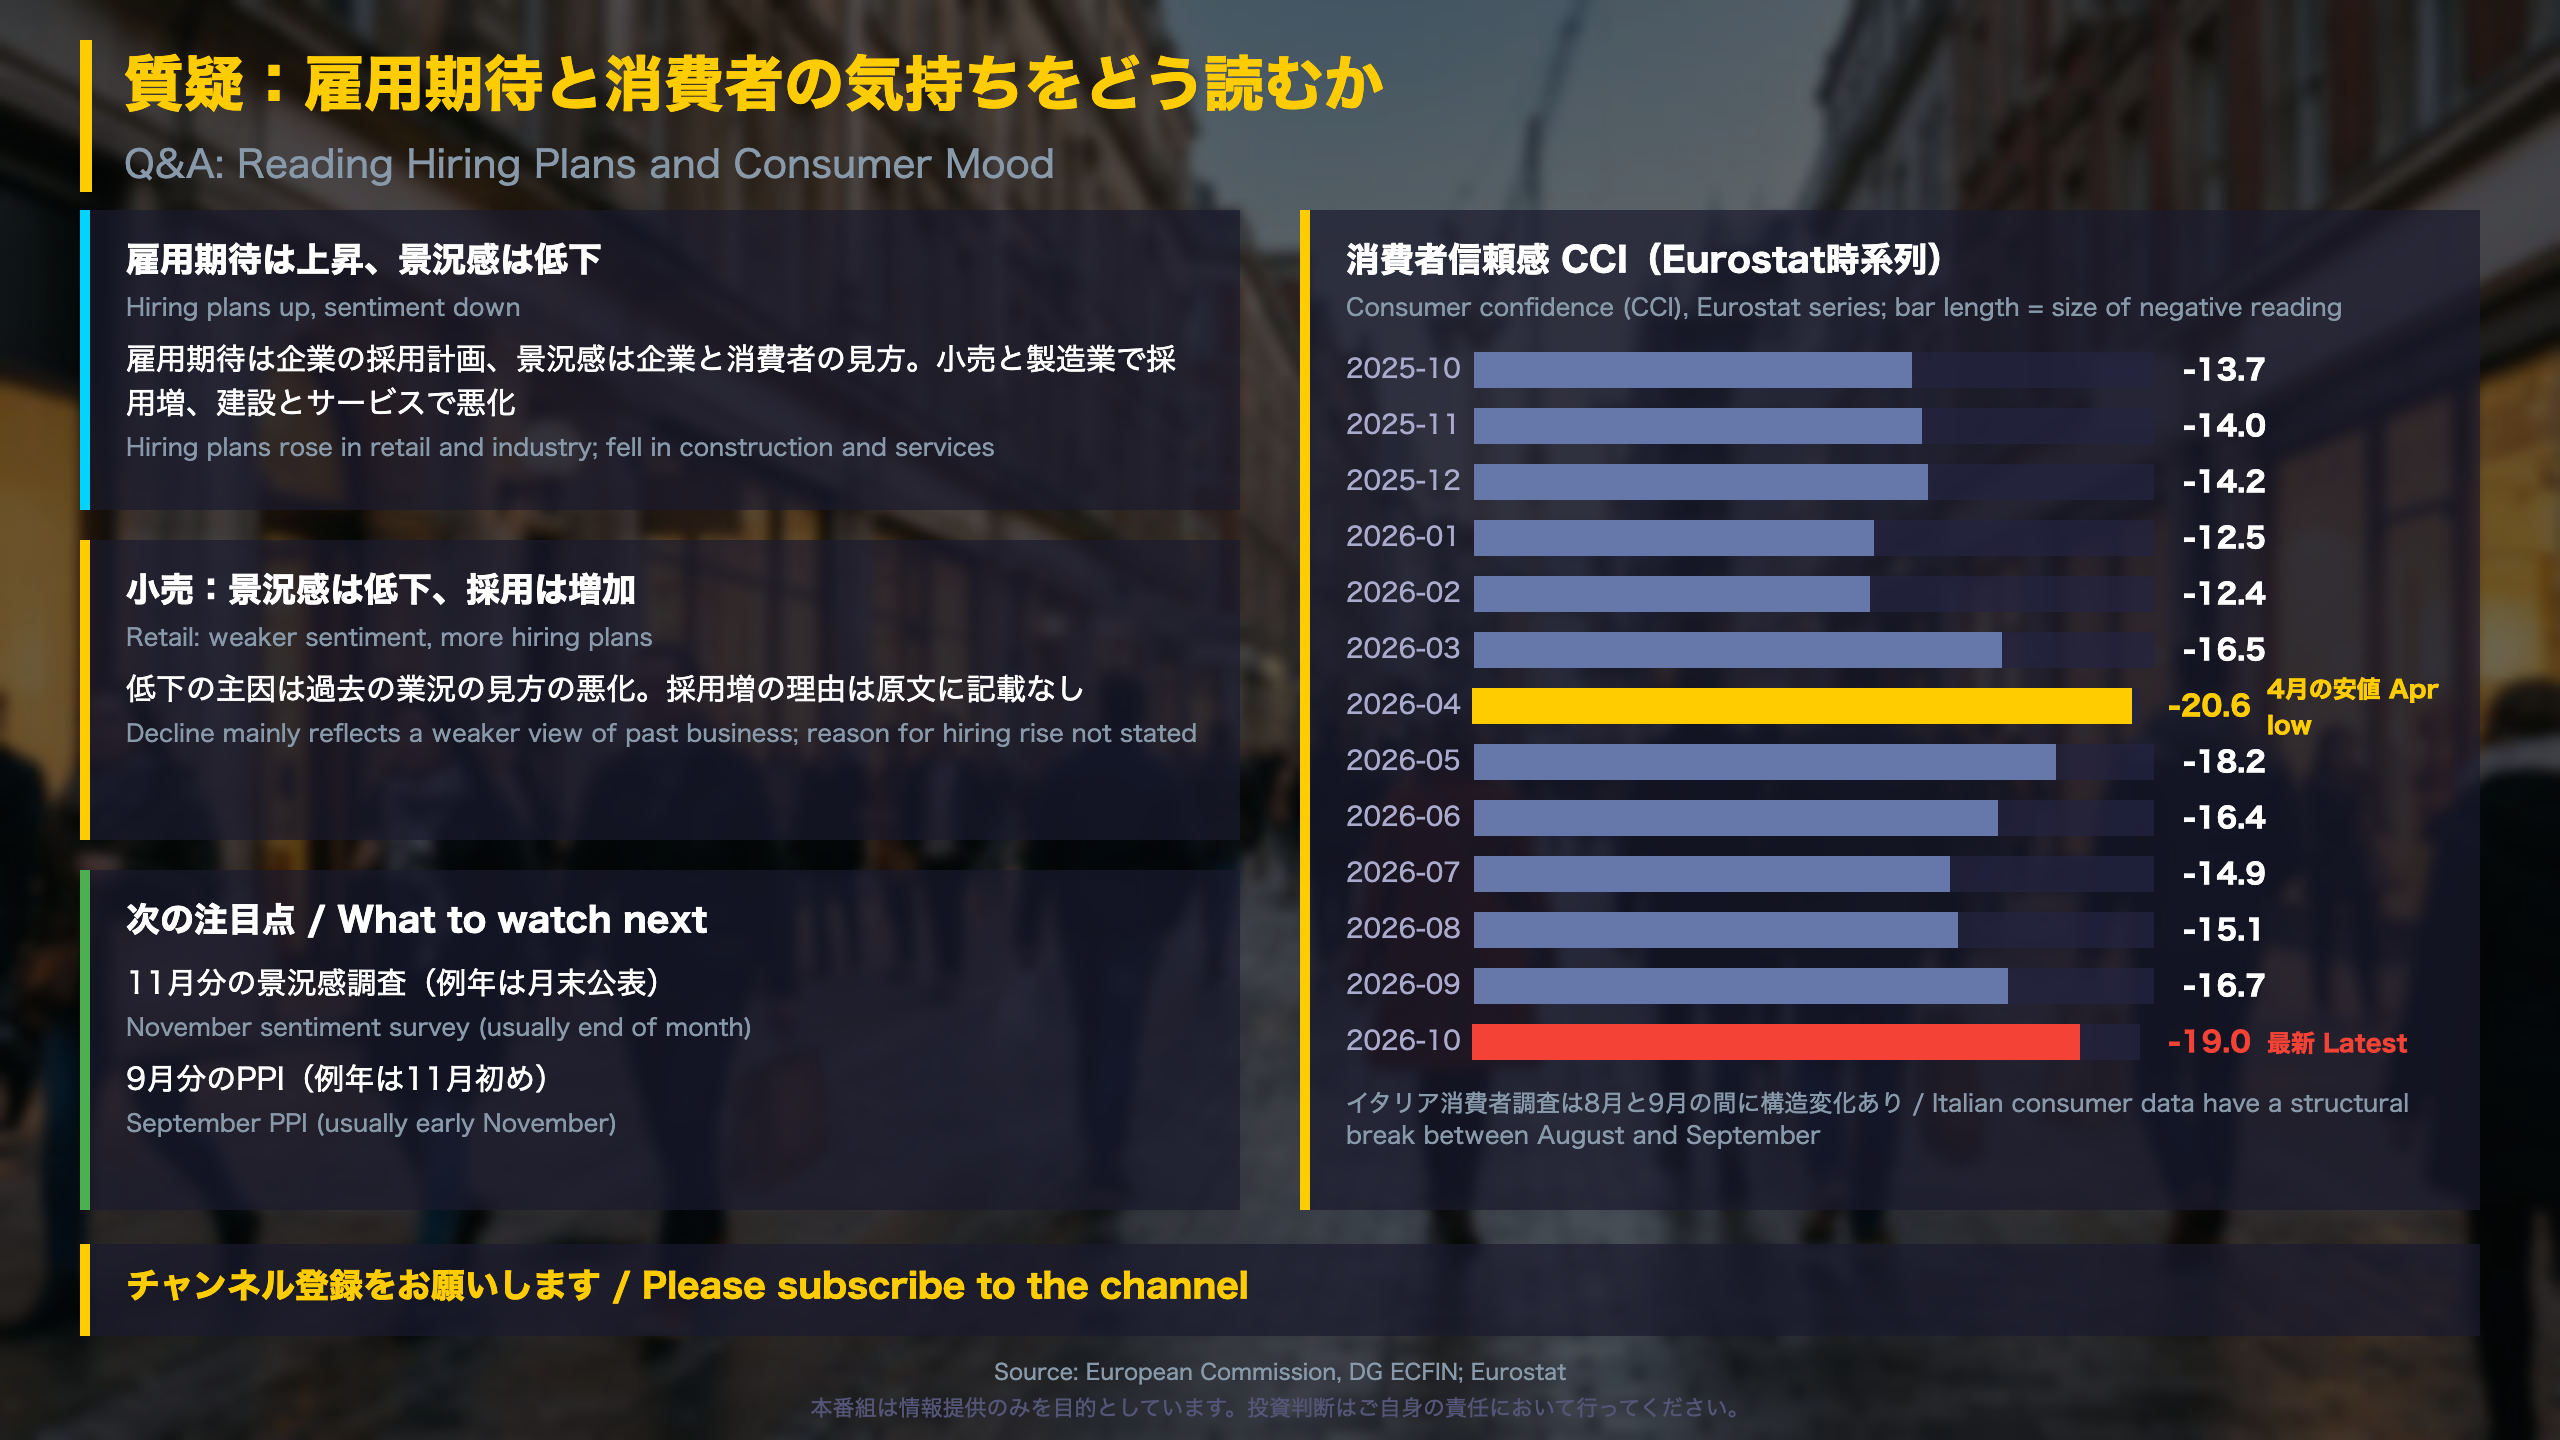
The Employment Expectations Indicator (EEI) rests on managers’ hiring plans. In the EU, plans rose significantly in retail and industry and deteriorated in services and especially construction. Consumers’ unemployment expectations, which are outside the headline indicator, were broadly stable. The EU Labour Hoarding Indicator stood at 9.0 (-0.1), below its long-term average of 9.6. The headline EEI is 98.2 in the euro area, still under the 100 benchmark.
Consumer confidence path (Eurostat series)
| Month | CCI |
|---|---|
| Feb 2026 | -12.4 |
| Mar 2026 | -16.5 |
| Apr 2026 | -20.6 |
| Jul 2026 | -14.9 |
| Aug 2026 | -15.1 |
| Sep 2026 | -16.7 |
| Oct 2026 | -19.0 |
Consumer confidence fell sharply into April, recovered through July, and has weakened again since August. October is the second-lowest reading in the thirteen months shown.
Balanced view
Resilience: hiring plans rebounded and consumers’ view of the national economy was largely unchanged.
Fragility: household finances and big-ticket purchase intentions worsened, which is visible in retail sentiment.
Checkpoints
- ESI relative to 100
- Whether the CCI falls below April’s -20.6
- Whether PPI holds near 8%
Note the structural break in Italian consumer data between August and September. For investors in euro assets, including EUR/JPY positions, a Japan-versus-euro-area policy contrast is a common theme, but this release says nothing about either central bank. The November survey and September PPI are the next facts to check.
Disclaimer: This article is for informational purposes only. All investment decisions are made solely at your own risk.