📺 Watch the Full Video Analysis
This article was automatically generated by the NFC Market Live AI analysis system. (Updated: 2026-10-26 14:15 JST)
📄 Primary Source
内閣府経済社会総合研究所
https://www.esri.cao.go.jp/jp/stat/di/202608psummary.pdf
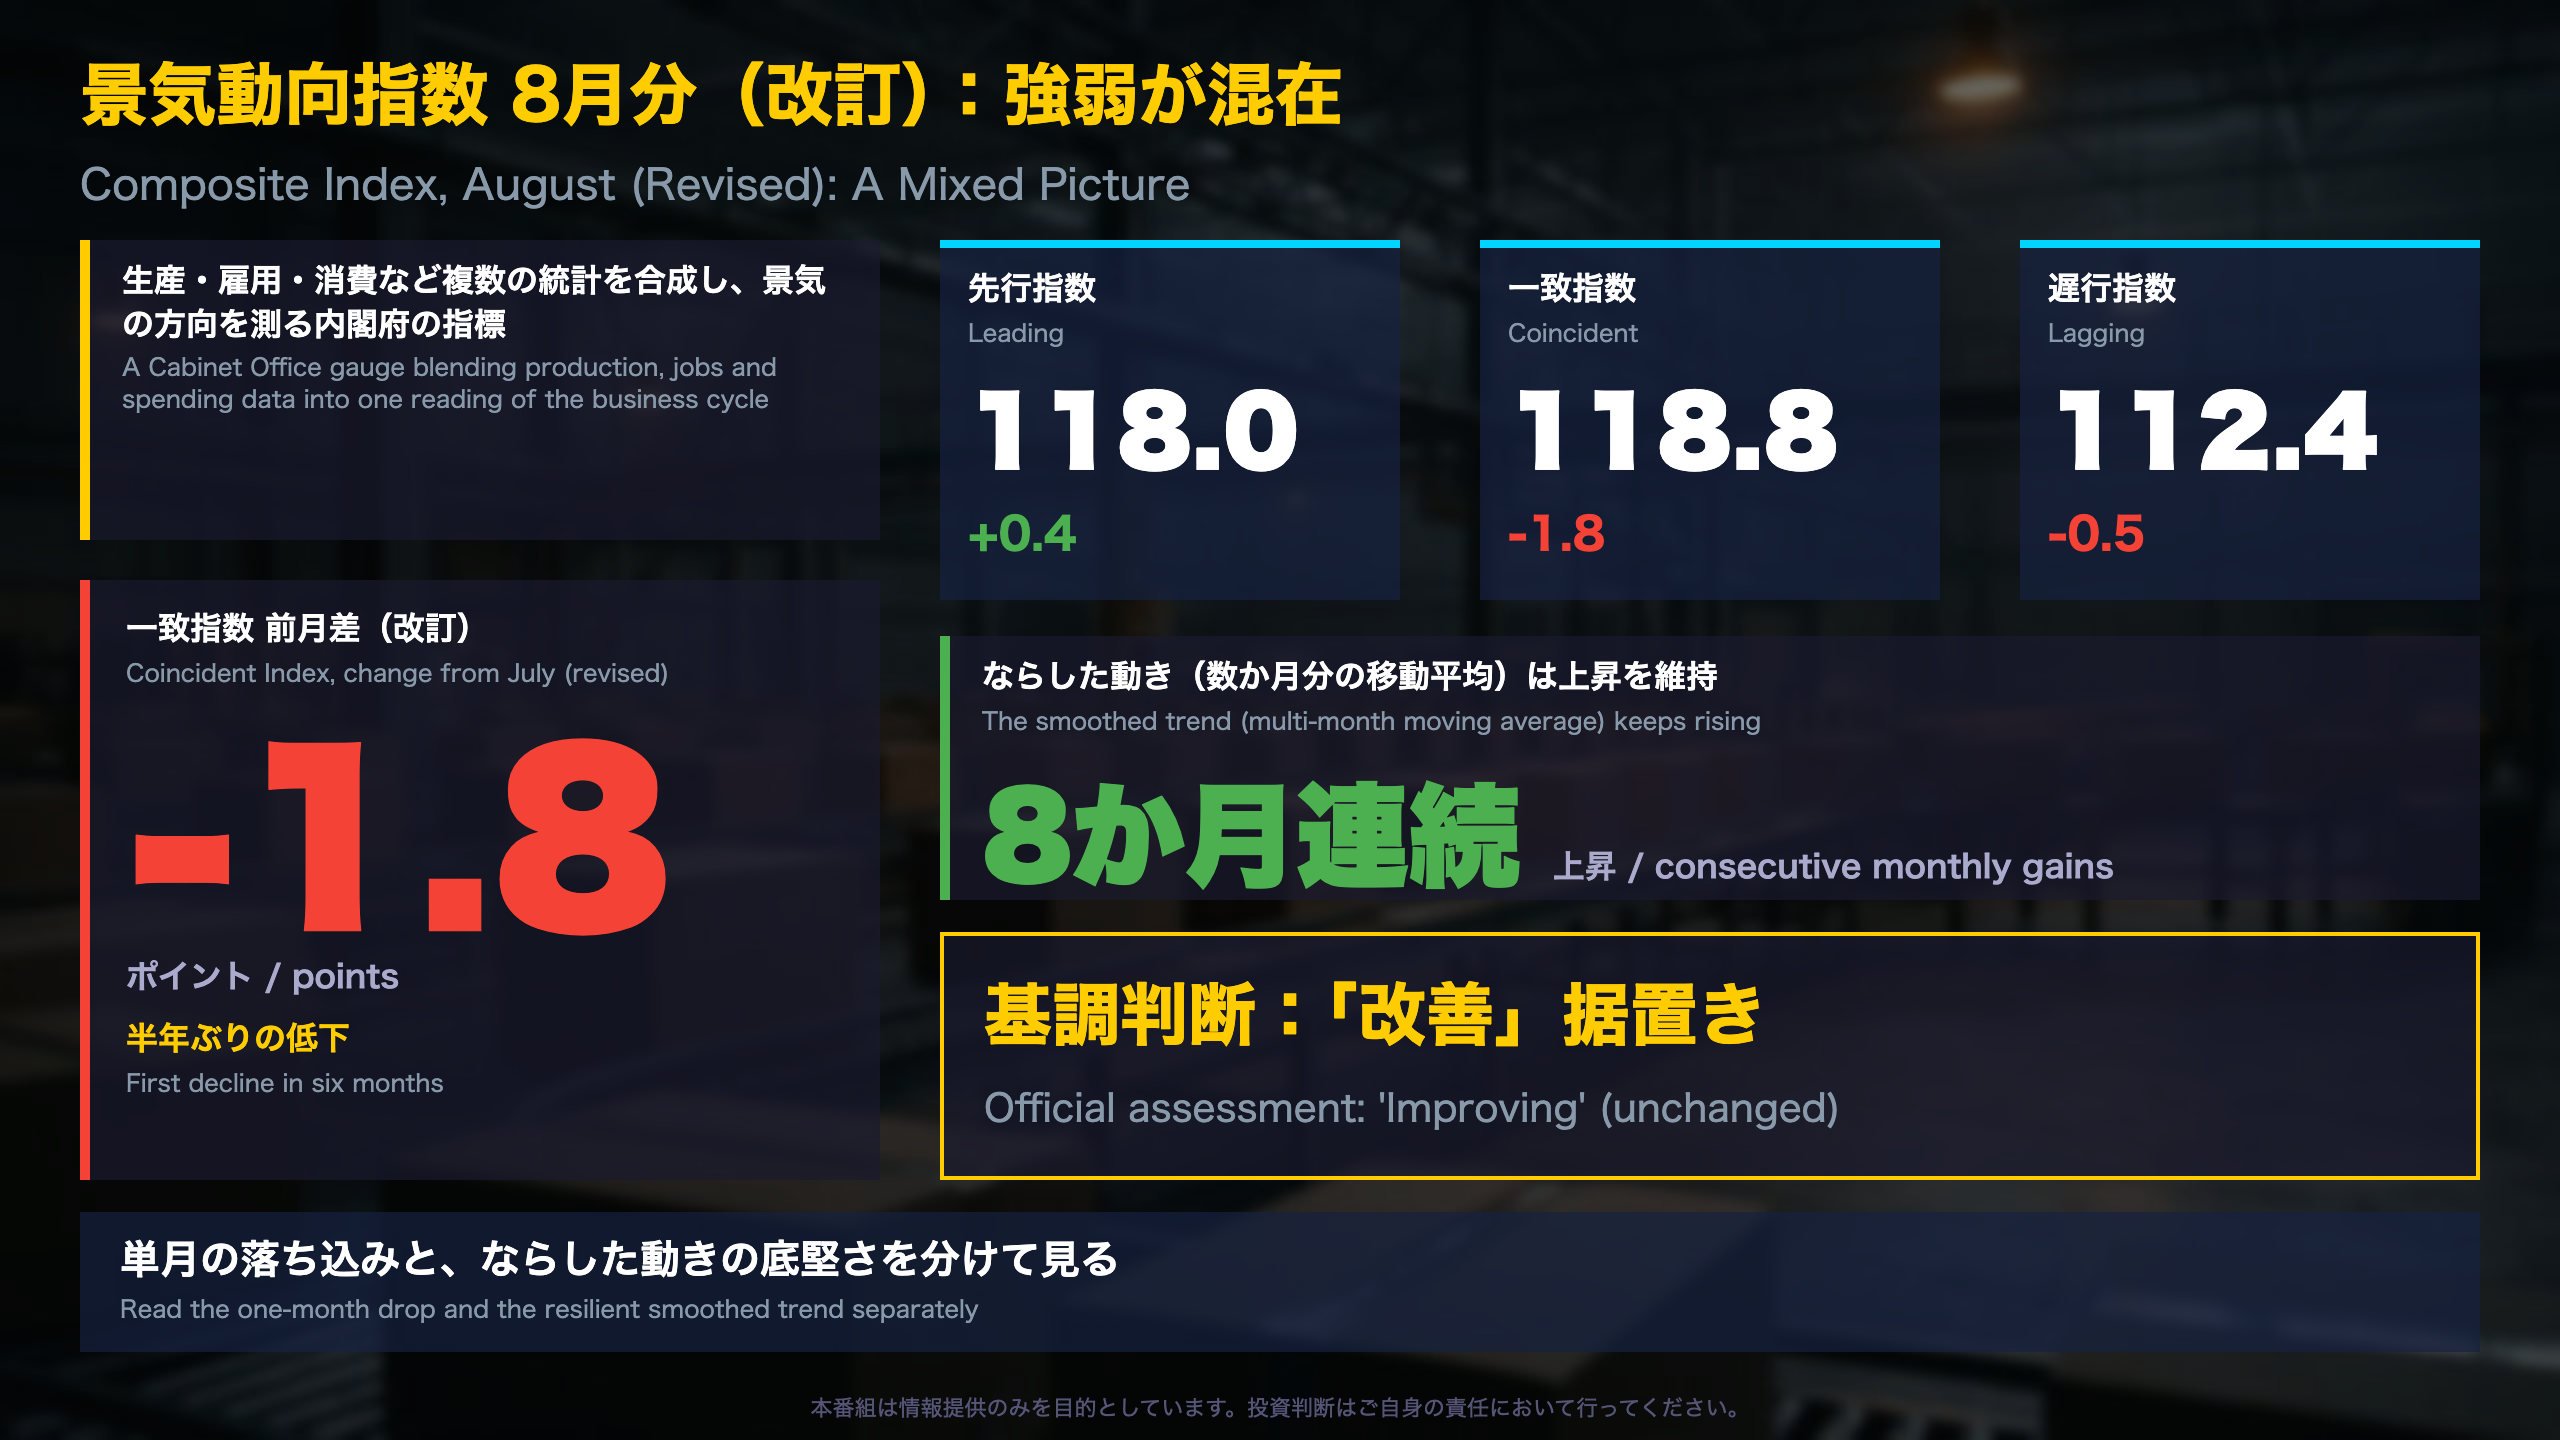
📊 Japan’s Cabinet Office revised its August Composite Index on Oct 26. The coincident index fell 1.8 points to 118.8, its first decline in six months.
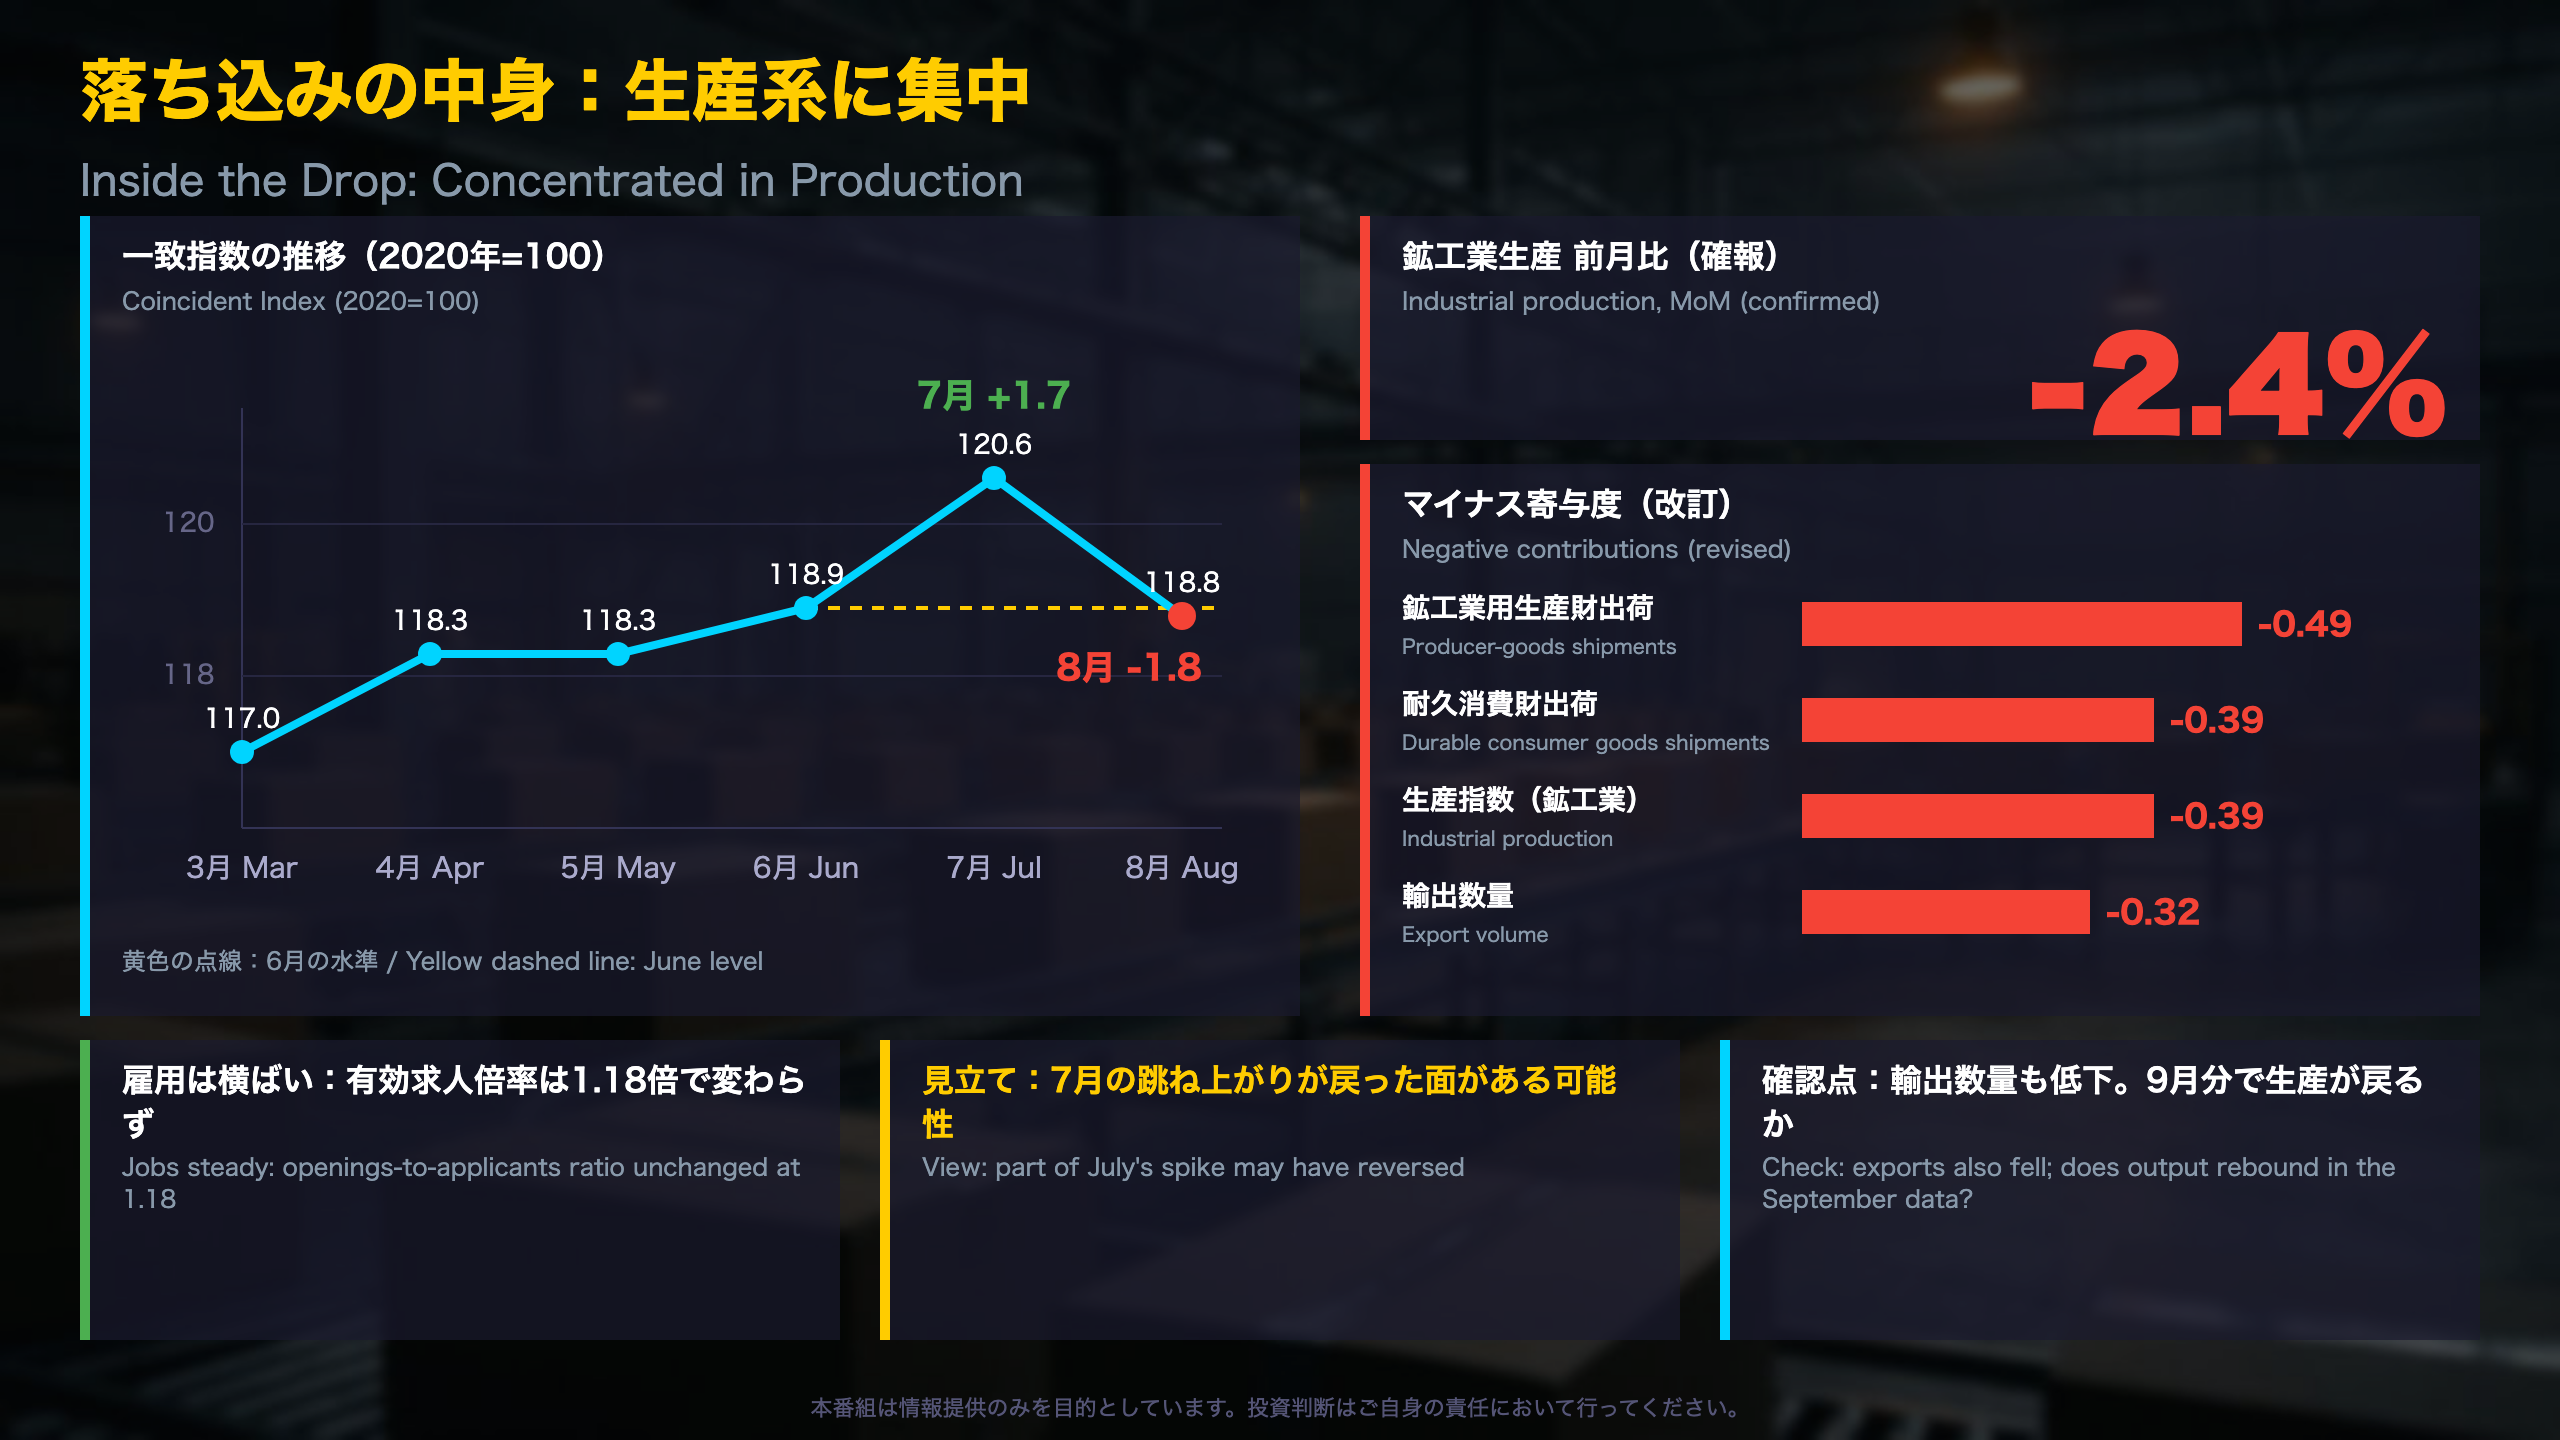
📉 Production-related series such as producer-goods and durable-goods shipments drove the drop, which may partly reverse July’s 1.7-point jump.
📈 Yet the leading index rose 0.4 to 118.0, the smoothed coincident trend has risen for eight straight months, and the assessment stays at ‘improving’.
💡 We separate the one-month drop from the underlying trend.
⚠️ Next: September data due Nov 9. Watch production, exports and the leading index.
サマリー:一致指数は半年ぶり低下、基調判断は「改善」据置き
Japan’s Composite Index: August Snapshot (Revised)
The Composite Index (CI) is compiled by the Cabinet Office’s Economic and Social Research Institute. It merges production, employment, sales and other series into leading, coincident and lagging indexes (2020 = 100). It is comparable in spirit to the Conference Board’s leading and coincident indexes in the US, but Japan’s version attaches an official, rule-based verdict to the moving averages.
Key readings (revised, released Oct 26, 2026)
- Coincident: 118.8, down 1.8 from July (flash: 118.7, down 1.9)
- Leading: 118.0, up 0.4 (second straight rise)
- Lagging: 112.4, down 0.5 (flash: 112.1, down 0.9)
- Assessment: ‘Improving’ (unchanged)
Why a one-month drop does not move the verdict
The Cabinet Office treats the monthly change as noisy, so the assessment relies mainly on the 3- and 7-month backward moving averages. Both rose again (+0.16 and +0.12), extending runs of eight straight months. Because the July reading had jumped 1.7 points, August’s decline brought the index back to roughly its June level (118.9).
What to watch
The September release is due Nov 9. The key questions are whether industrial output rebounds and whether the smoothed gains, now narrowing, stay positive. This is a data explainer, not investment advice.
解説1:落ち込みの中身は生産系に集中
Inside the August Drop: A Production-Led Pullback
The coincident index combines ten equally weighted series. The 1.8-point decline (revised) came mostly from manufacturing and trade-related data compiled by METI, Japan’s Ministry of Economy, Trade and Industry.
| Series | MoM (confirmed) | Contribution (flash → revised) |
|---|---|---|
| Producer-goods shipments | -4.2% | -0.64 → -0.49 |
| Industrial production | -2.4% | -0.32 → -0.39 |
| Durable consumer goods shipments | -4.9% | -0.44 → -0.39 |
| Export volume | -2.7% | -0.35 → -0.32 |
The offsetting side
- Retail sales were +2.9% y/y and wholesale sales +8.0% y/y, still solid though slower than July (+3.7% and +8.9%).
- The job openings-to-applicants ratio held at 1.18.
- Operating profits (a quarterly series) add a +0.13 trend-based contribution.
Two readings
Payback view: after July’s 1.7-point surge the index is simply back near June’s 118.9.
Cautious view: industrial production was revised down from 102.6 to 101.9 between the flash and confirmed data, so the weakness is a bit larger than first reported.
For comparison, US industrial production and ISM data are the nearest analogues; Japan’s index bundles such data with labor and sales series in one composite. This is a factual explainer, not investment advice.
解説2:先行指数は前向き、ただし足元の勢いは緩む
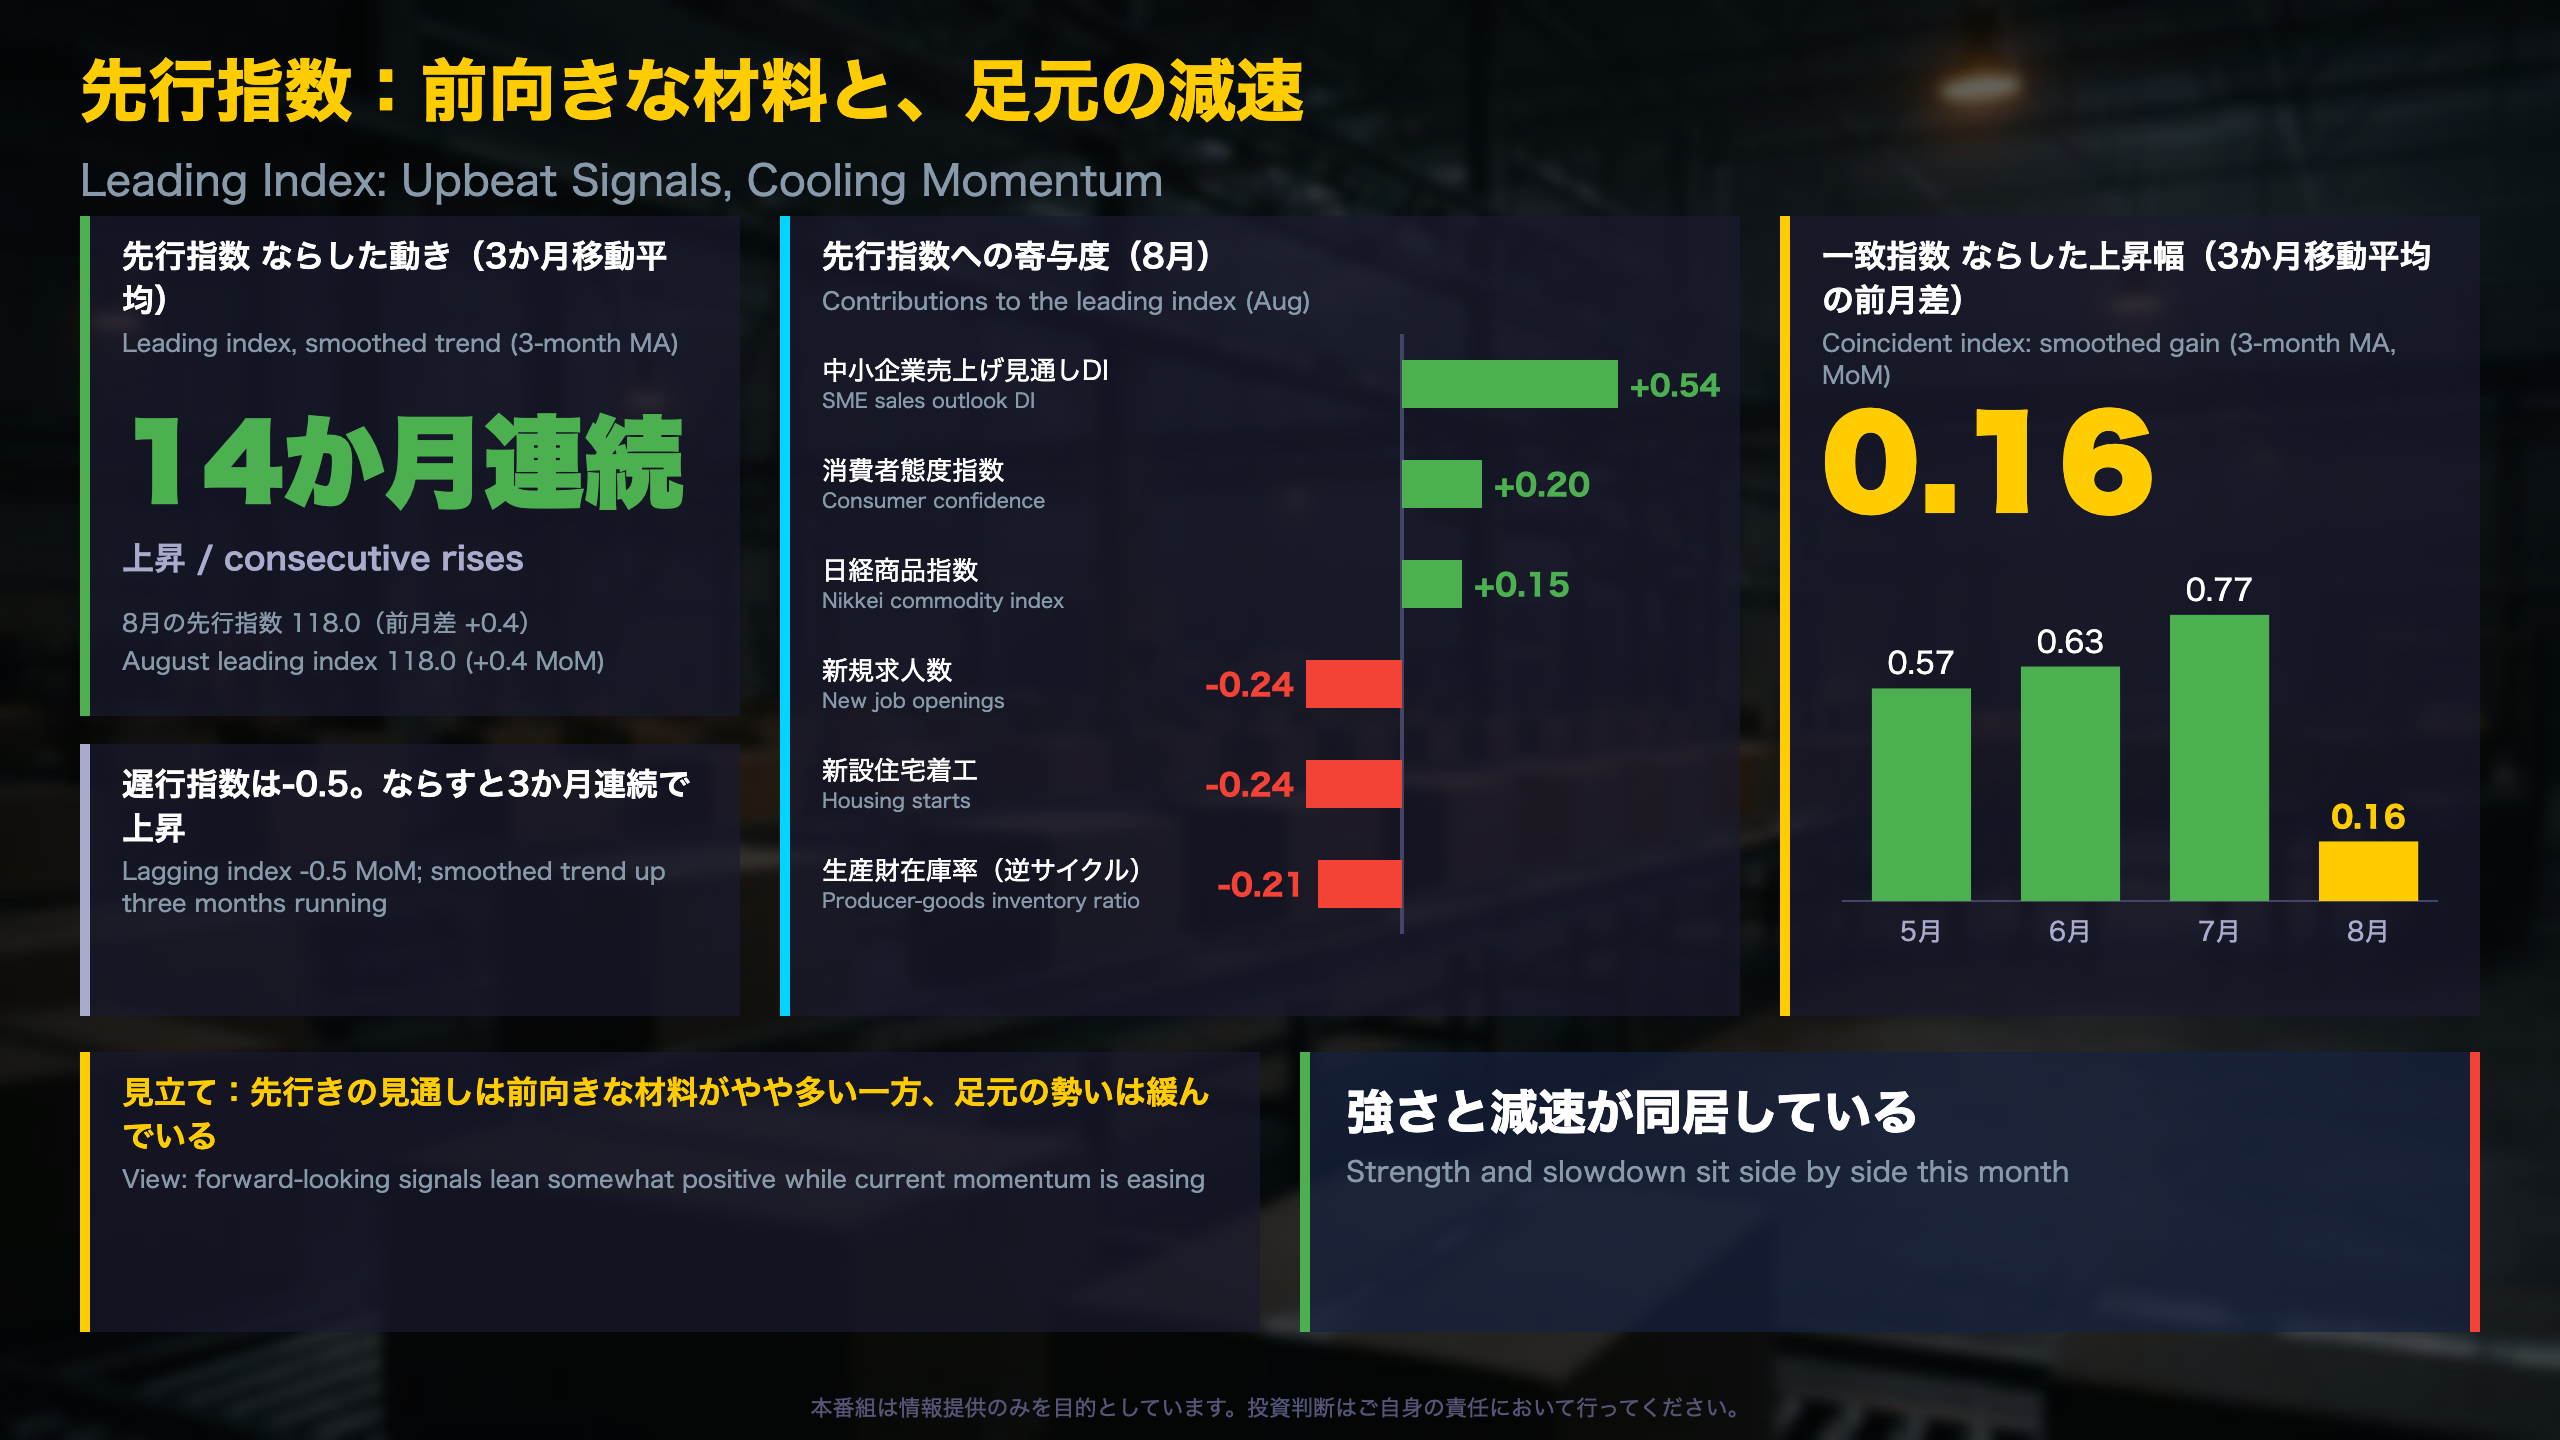
Leading Index: Forward-Looking Signals Remain Constructive
The leading index uses 11 series meant to move ahead of the cycle, such as new job openings, housing starts, machinery orders, stock prices and sentiment surveys. The US Conference Board’s LEI draws on similar inputs, including building permits and equity prices.
August level: 118.0 (+0.4). From 115.5 in March it has risen steadily; the 3-month moving average (117.3, +0.60) has risen 14 straight months and the 7-month average (116.2, +0.78) 12 straight months.
Contributions to the August change
| Component | Contribution |
|---|---|
| SME sales outlook DI (-0.7 → 6.6) | +0.54 |
| Consumer confidence (34.9 → 35.5) | +0.20 |
| Nikkei commodity index | +0.15 |
| New job openings | -0.24 |
| Housing starts | -0.24 |
| Producer-goods inventory ratio (inverse) | -0.21 |
Lagging index
The lagging index was 112.4, down 0.5, but its 3-month average rose 0.40, the third straight gain.
Reading the mix
Sentiment-type components did much of the lifting, and such surveys can be more volatile than hard data; the SME outlook DI, for instance, swung by 7.3 points in one month. That argues for watching whether hard data such as orders and openings follow. Meanwhile the smoothed gain in the coincident index narrowed from +0.77 in July to +0.16 in August. This is a factual explainer, not investment advice.
質疑:基調判断はなぜ「改善」のままか
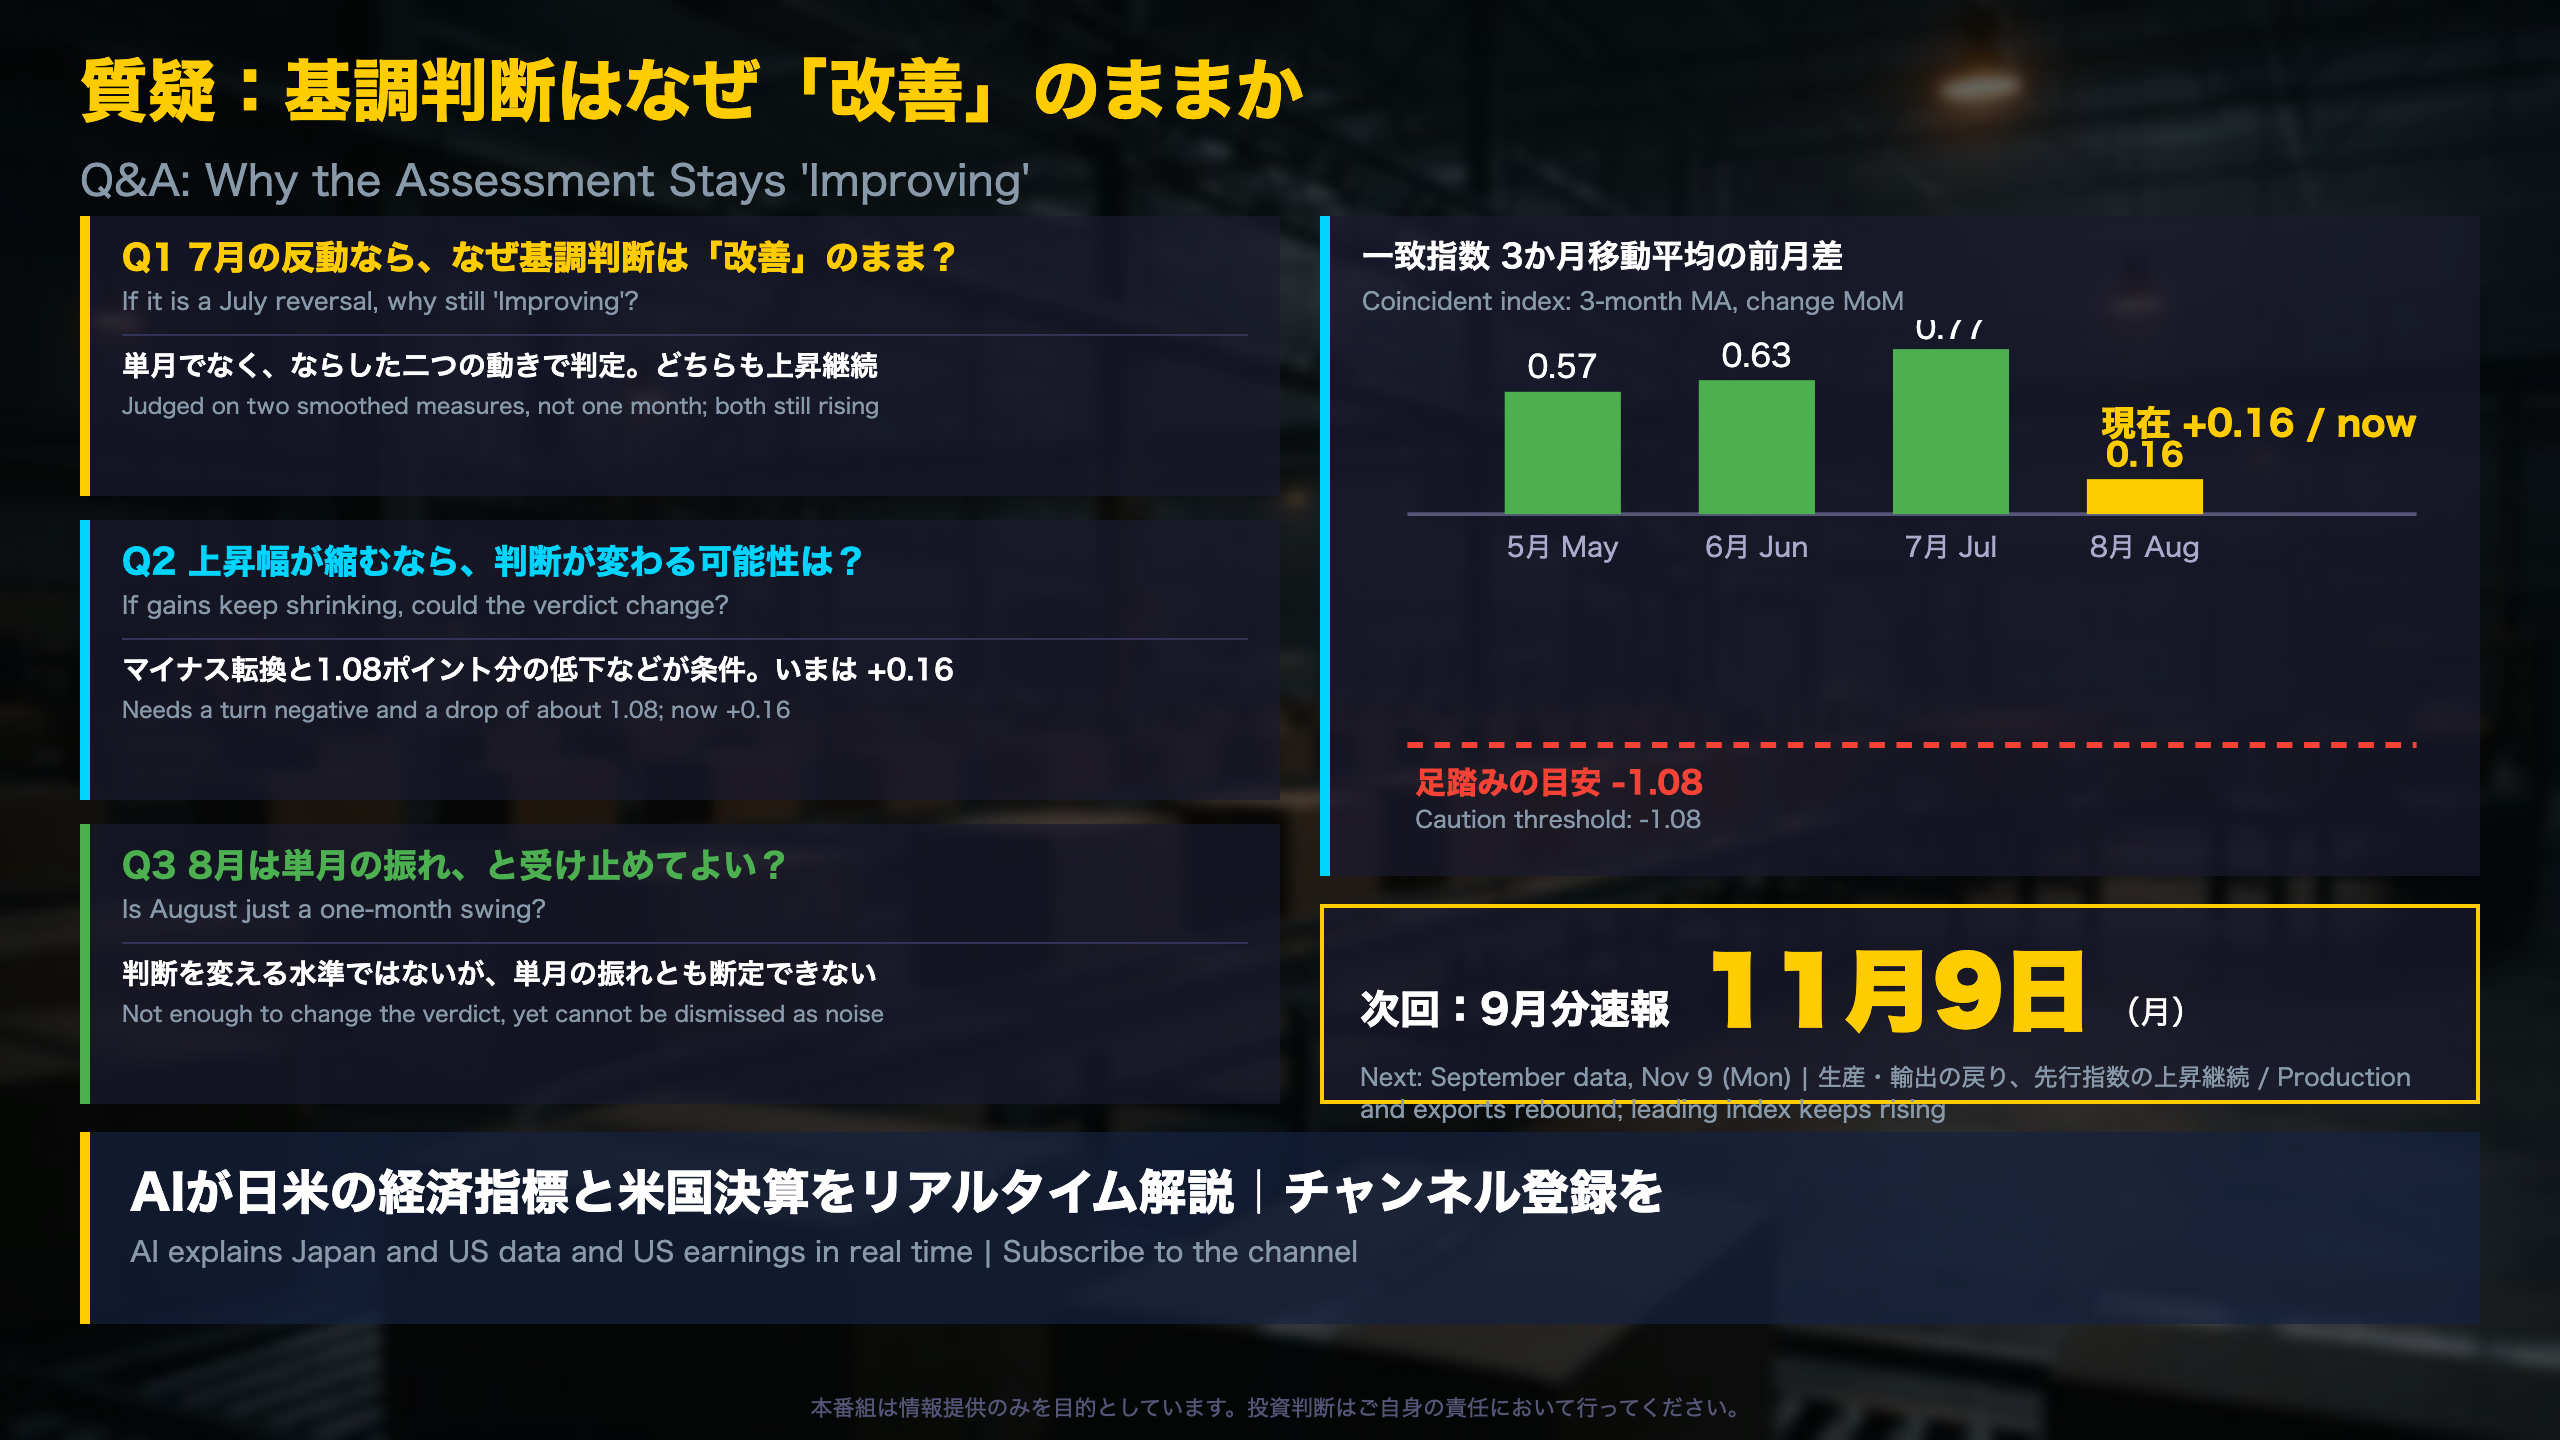
How the Cabinet Office Reaches Its Verdict
Japan’s CI assessment is mechanical. The monthly change is considered too noisy, so the rules lean on the 3- and 7-month backward moving averages.
| Assessment | Core condition (summary) |
|---|---|
| Improving | 3-month MA rising, generally for 3+ months; current-month change positive |
| Pausing | 3-month MA turns negative by at least 1 SD (cumulative over 1-3 months); current month negative |
| Deterioration | 3-month MA falling for 3+ months; current month negative |
If none of the conditions is met, the previous assessment is carried over. Historical standard deviations (1985-2025) are 1.08 for the 3-month MA and 0.83 for the 7-month MA.
Where August stands
3-month MA change: +0.57 (May), +0.63 (June), +0.77 (July), +0.16 (August). 7-month: +0.36, +0.56, +0.85, +0.12. August’s monthly change was negative, so the sign condition for ‘Improving’ appears not to be met, but the ‘Pausing’ trigger is nowhere close, which fits the official ‘unchanged’ label.
Watch list for Nov 9
September data: a rebound in production and exports, and whether the smoothed gains stay positive. Readings can differ between optimists and skeptics; this is a factual explainer, not advice.
Disclaimer: This article is for informational purposes only. All investment decisions are made solely at your own risk.