
📺 Watch the Full Video Analysis
This article was automatically generated by the NFC Market Live AI analysis system. (Updated: 2026-10-23 23:12 JST)
📄 Primary Source
University of Michigan
http://www.sca.isr.umich.edu/
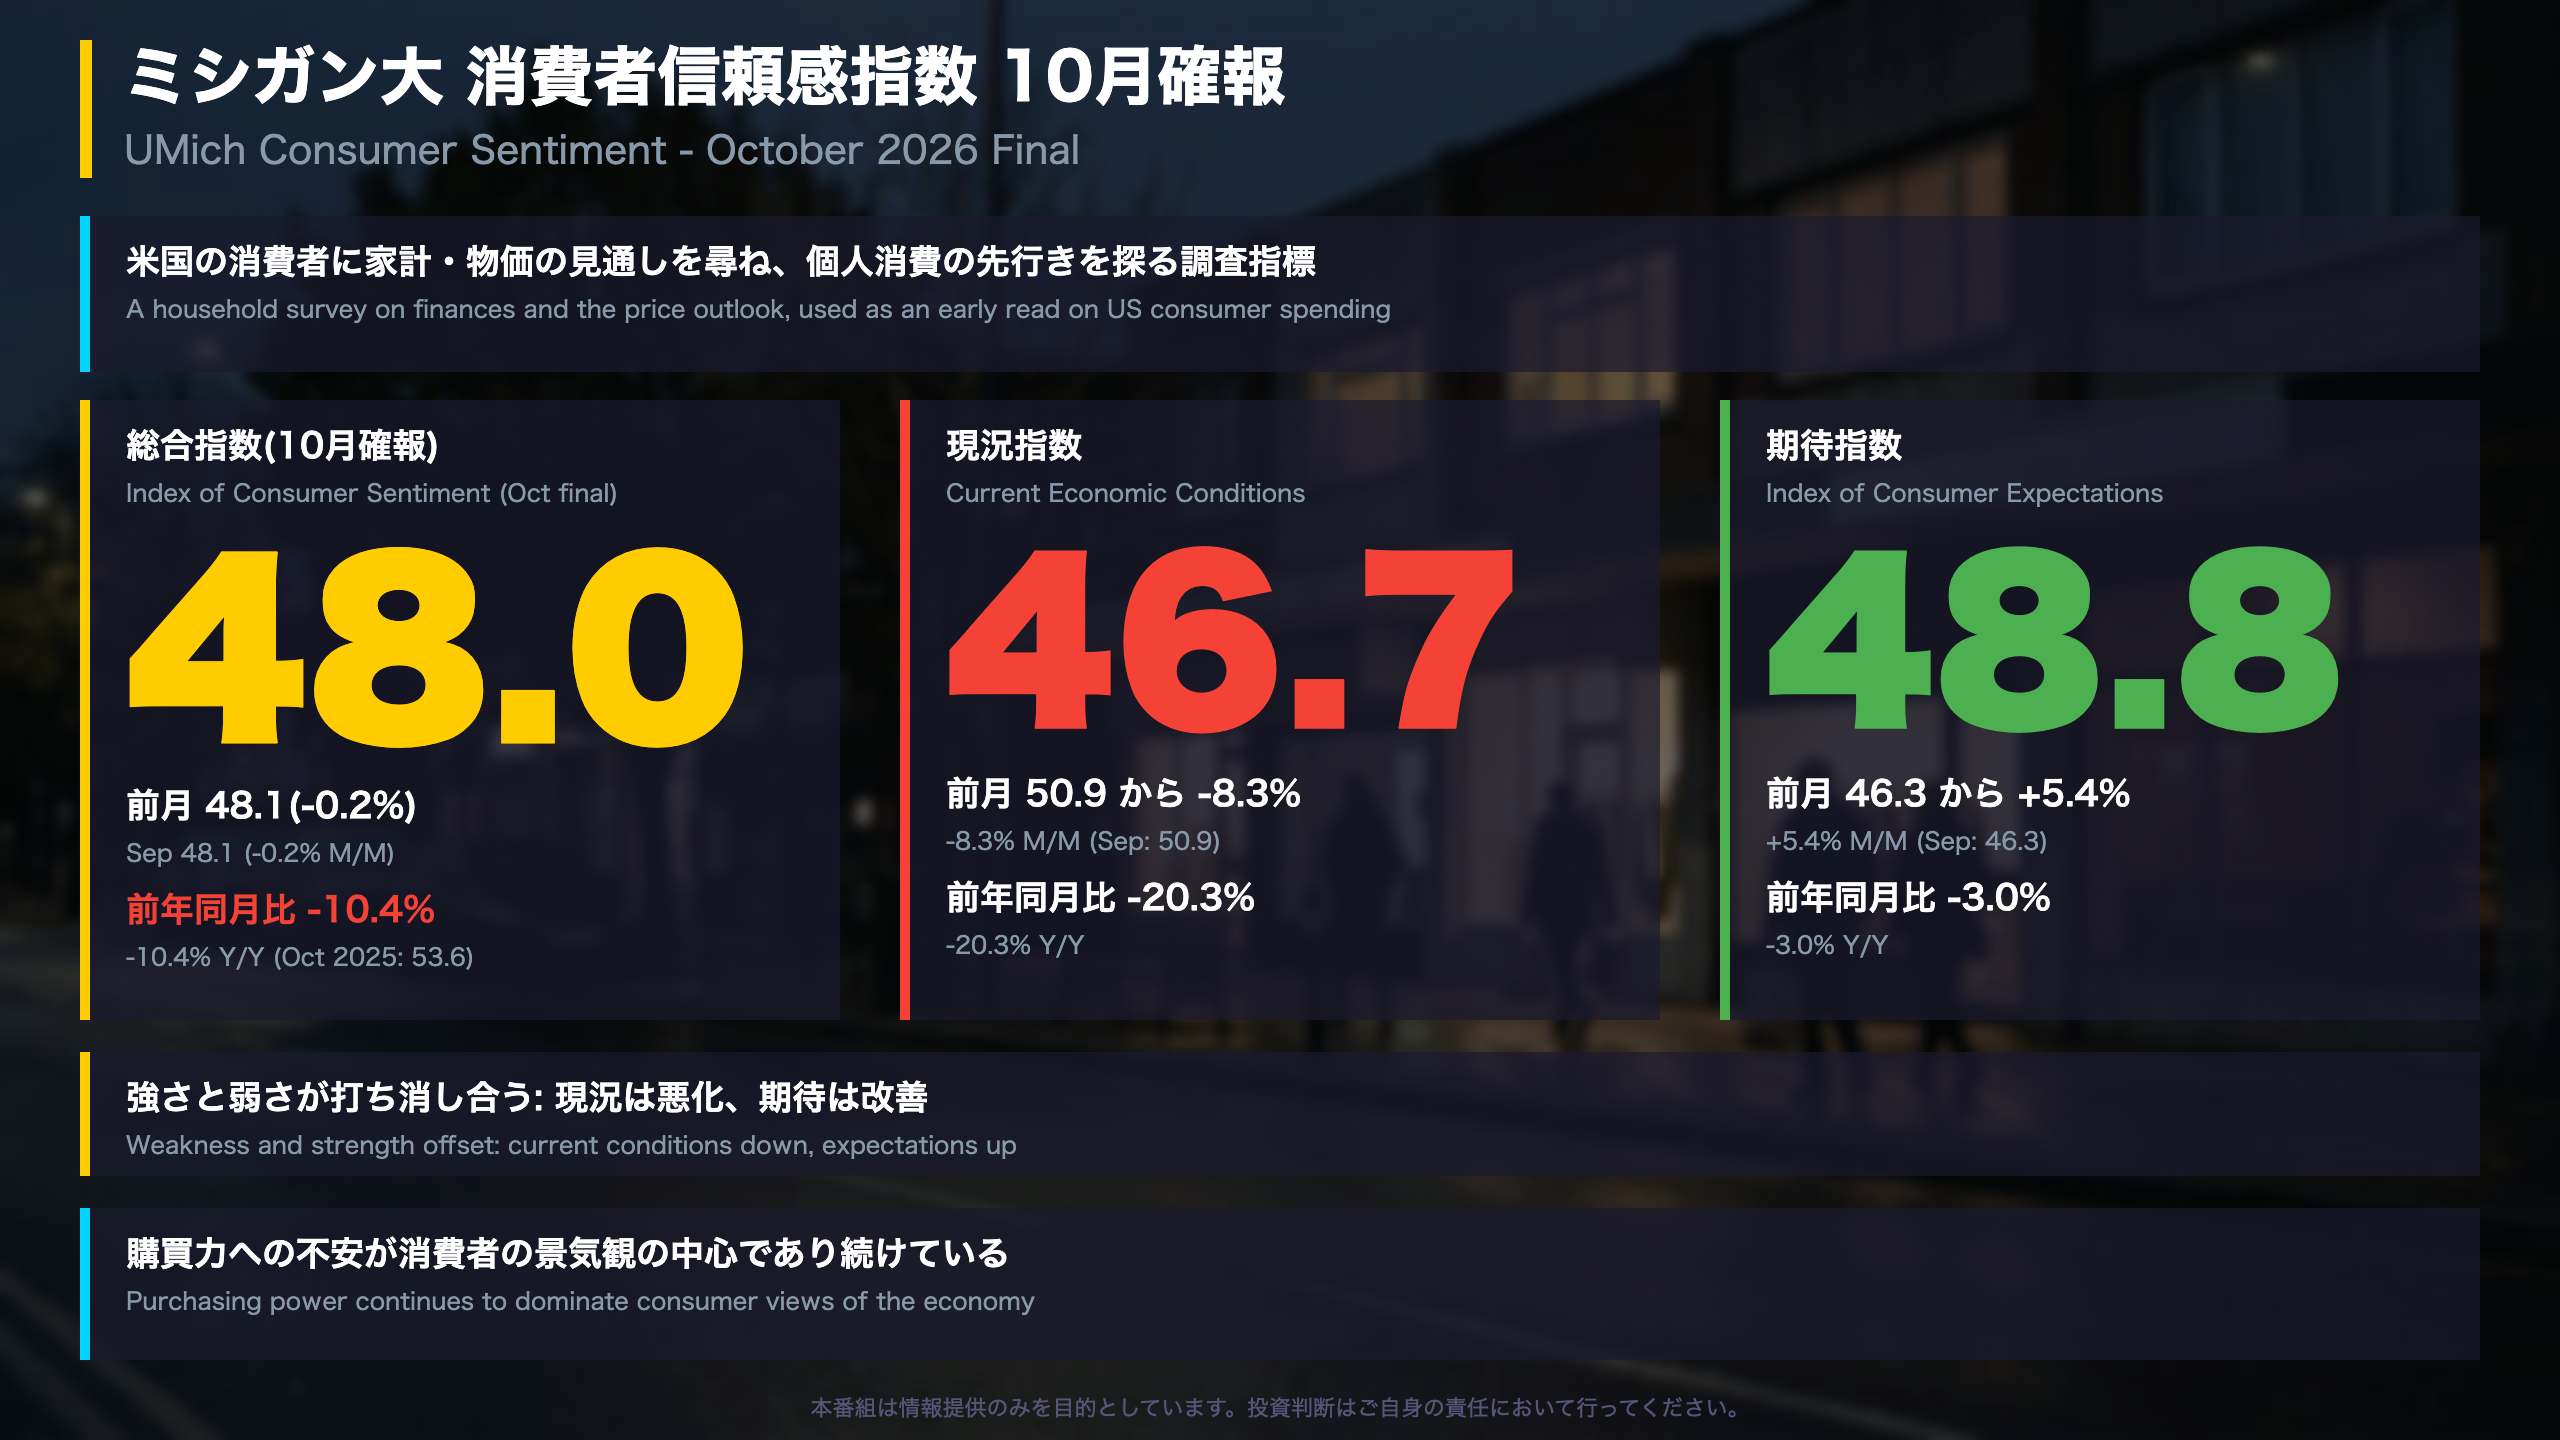
📊 The University of Michigan’s October final consumer sentiment index was 48.0, essentially flat from September’s 48.1.
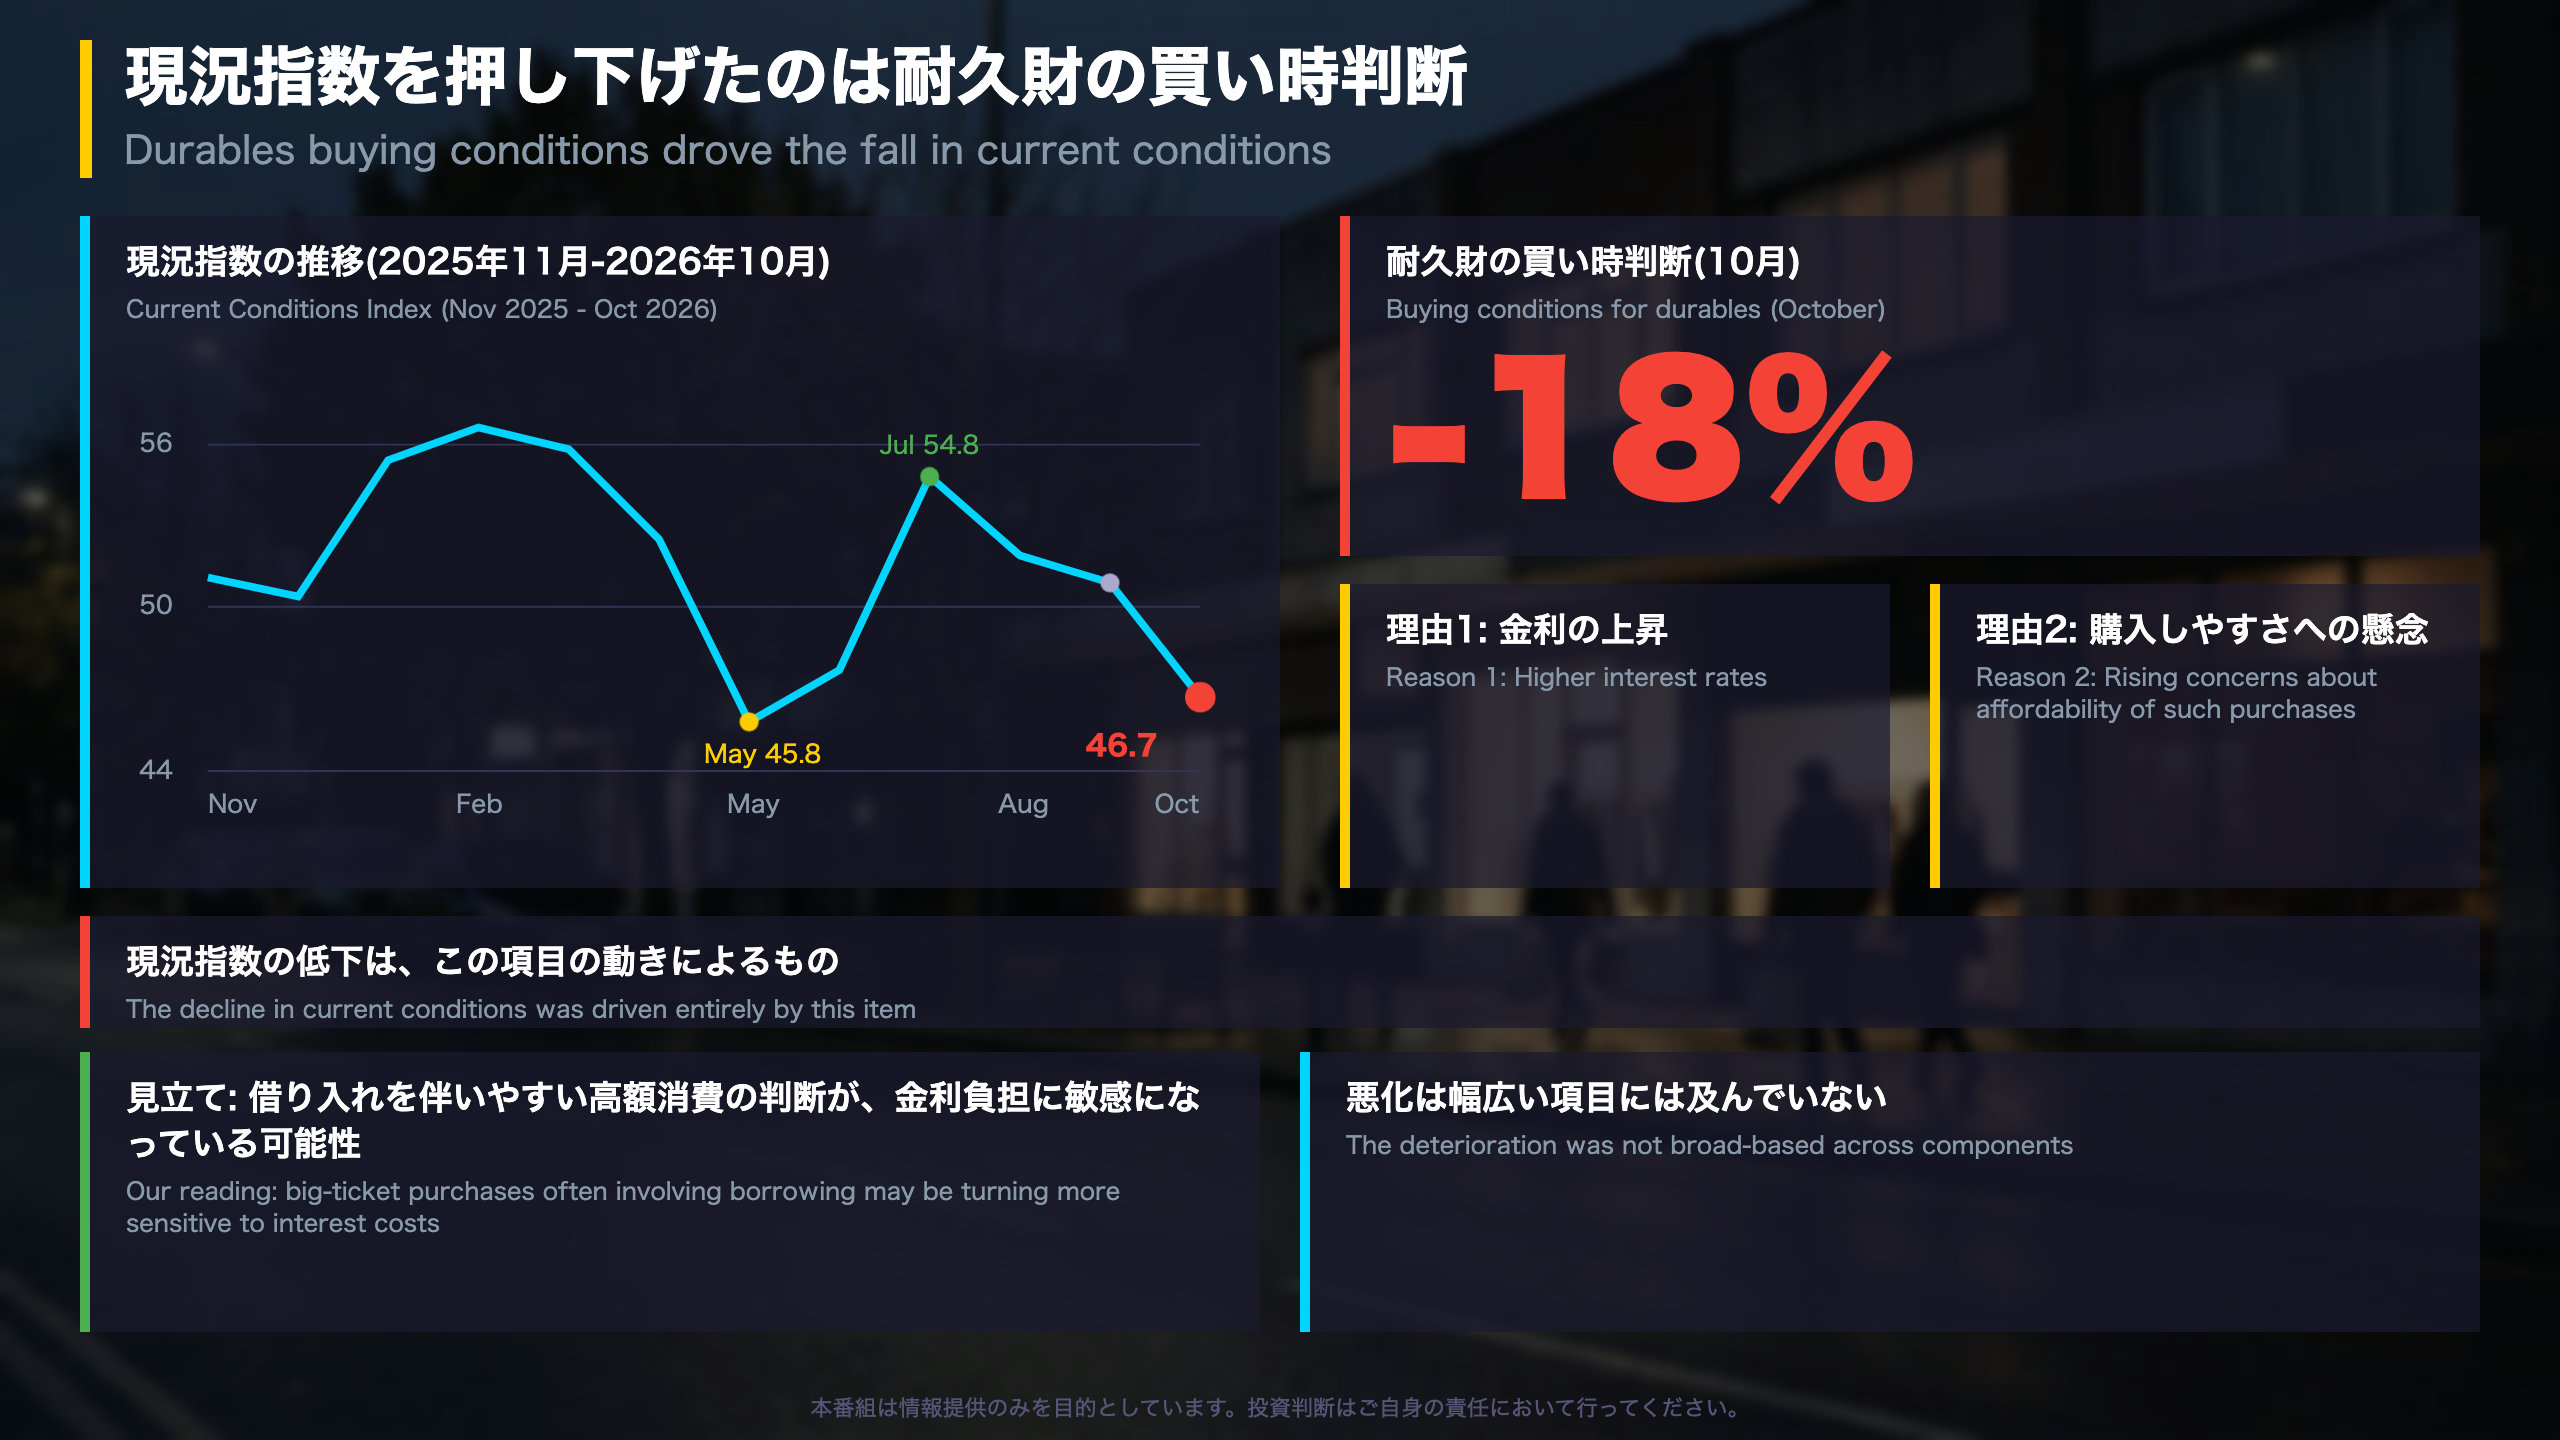
📉 Current conditions fell to 46.7 (from 50.9), driven by a plunge in durables buying conditions.
📈 Expectations rose to 48.8 (from 46.3), and the year-ahead business outlook improved.
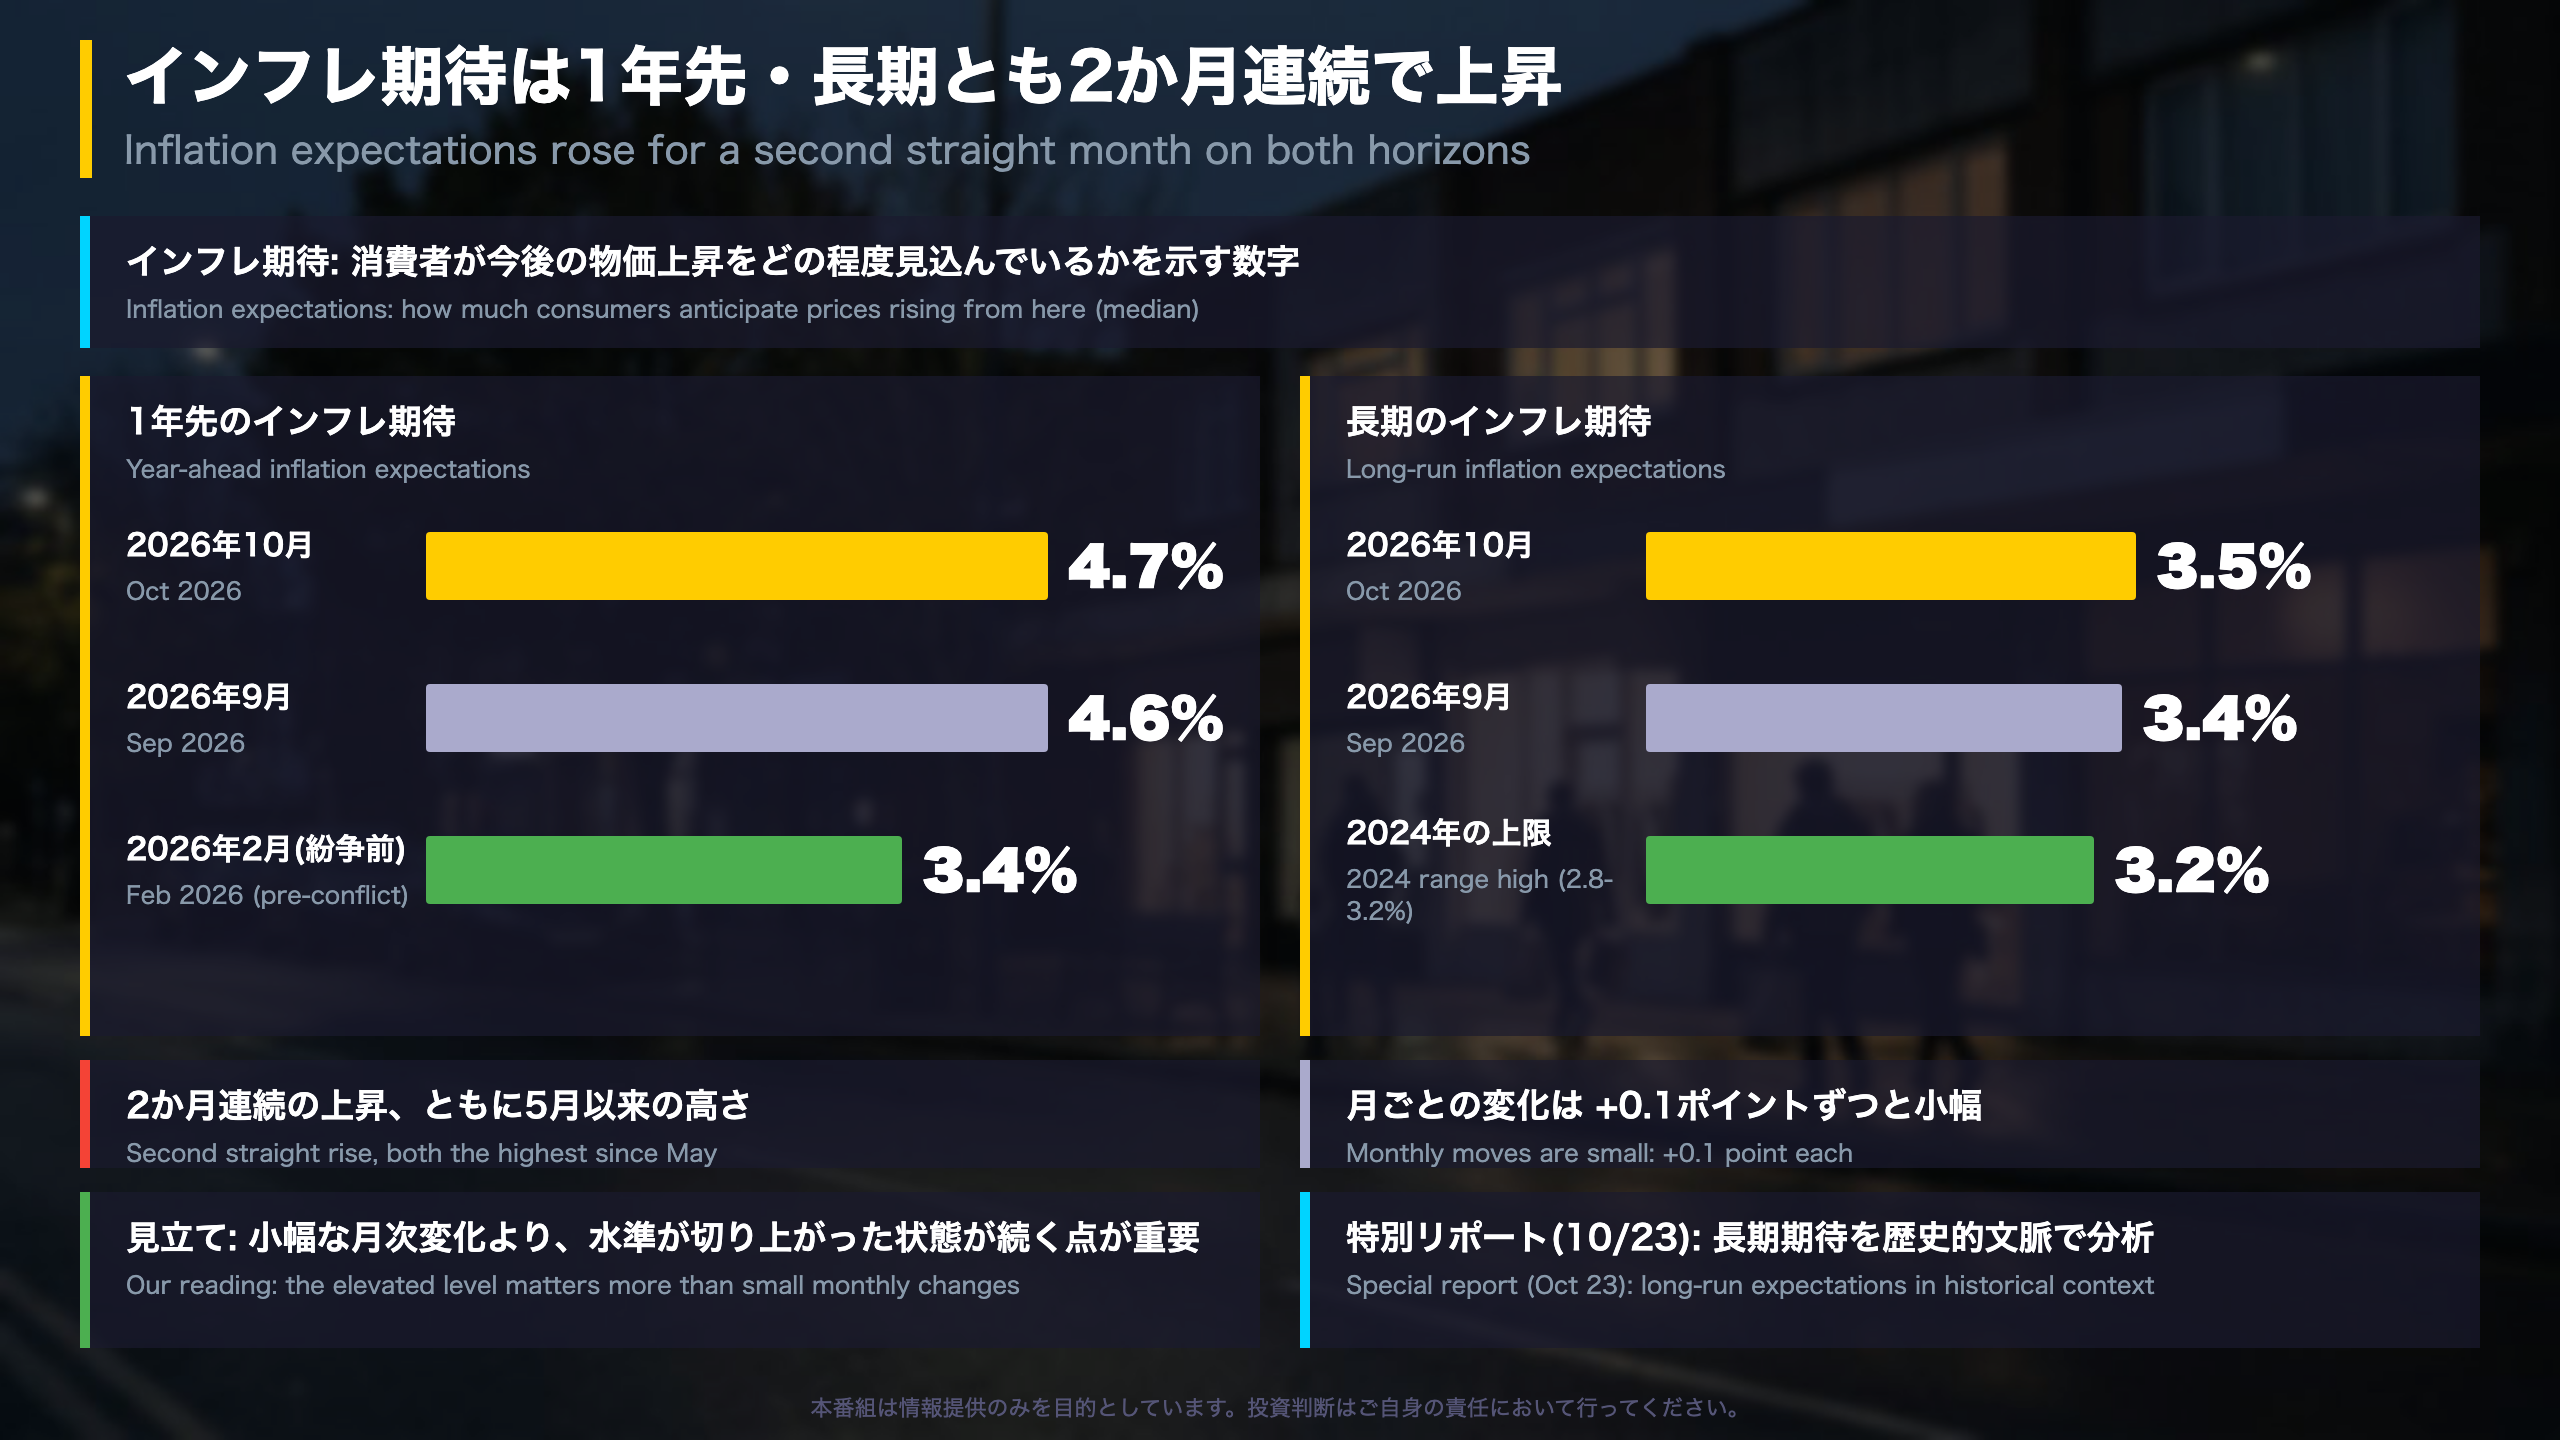
⚠️ Year-ahead inflation expectations rose to 4.7% and long-run to 3.5%, both up for a second month and the highest since May.
💡 Next: preliminary November data on Nov 6 at 10am ET.
サマリー: 横ばいの裏で、現況は悪化・期待は改善
What happened in the October final
The University of Michigan Surveys of Consumers is one of the most widely followed US household surveys. It is distinct from the Conference Board’s Consumer Confidence Index, which is the other headline measure of US consumer mood. The October final composite came in at 48.0, versus 48.1 in September. Director Joanne Hsu summarized it as “a scant one-tenth of an index point below September.”
The two sub-indexes moved in opposite directions
- Current Economic Conditions: 46.7 (Sep 50.9), down 8.3% m/m and 20.3% y/y
- Index of Consumer Expectations: 48.8 (Sep 46.3), up 5.4% m/m and down 3.0% y/y
In September current conditions were above expectations; in October the order reversed.
Historical context
The composite is the lowest since May 2026 (44.8), well below the July 2026 high of 55.2. It is about 15% below February’s 56.6, the last reading before the Iran conflict cited in the release, and 10.4% below October 2025.
Balanced reading
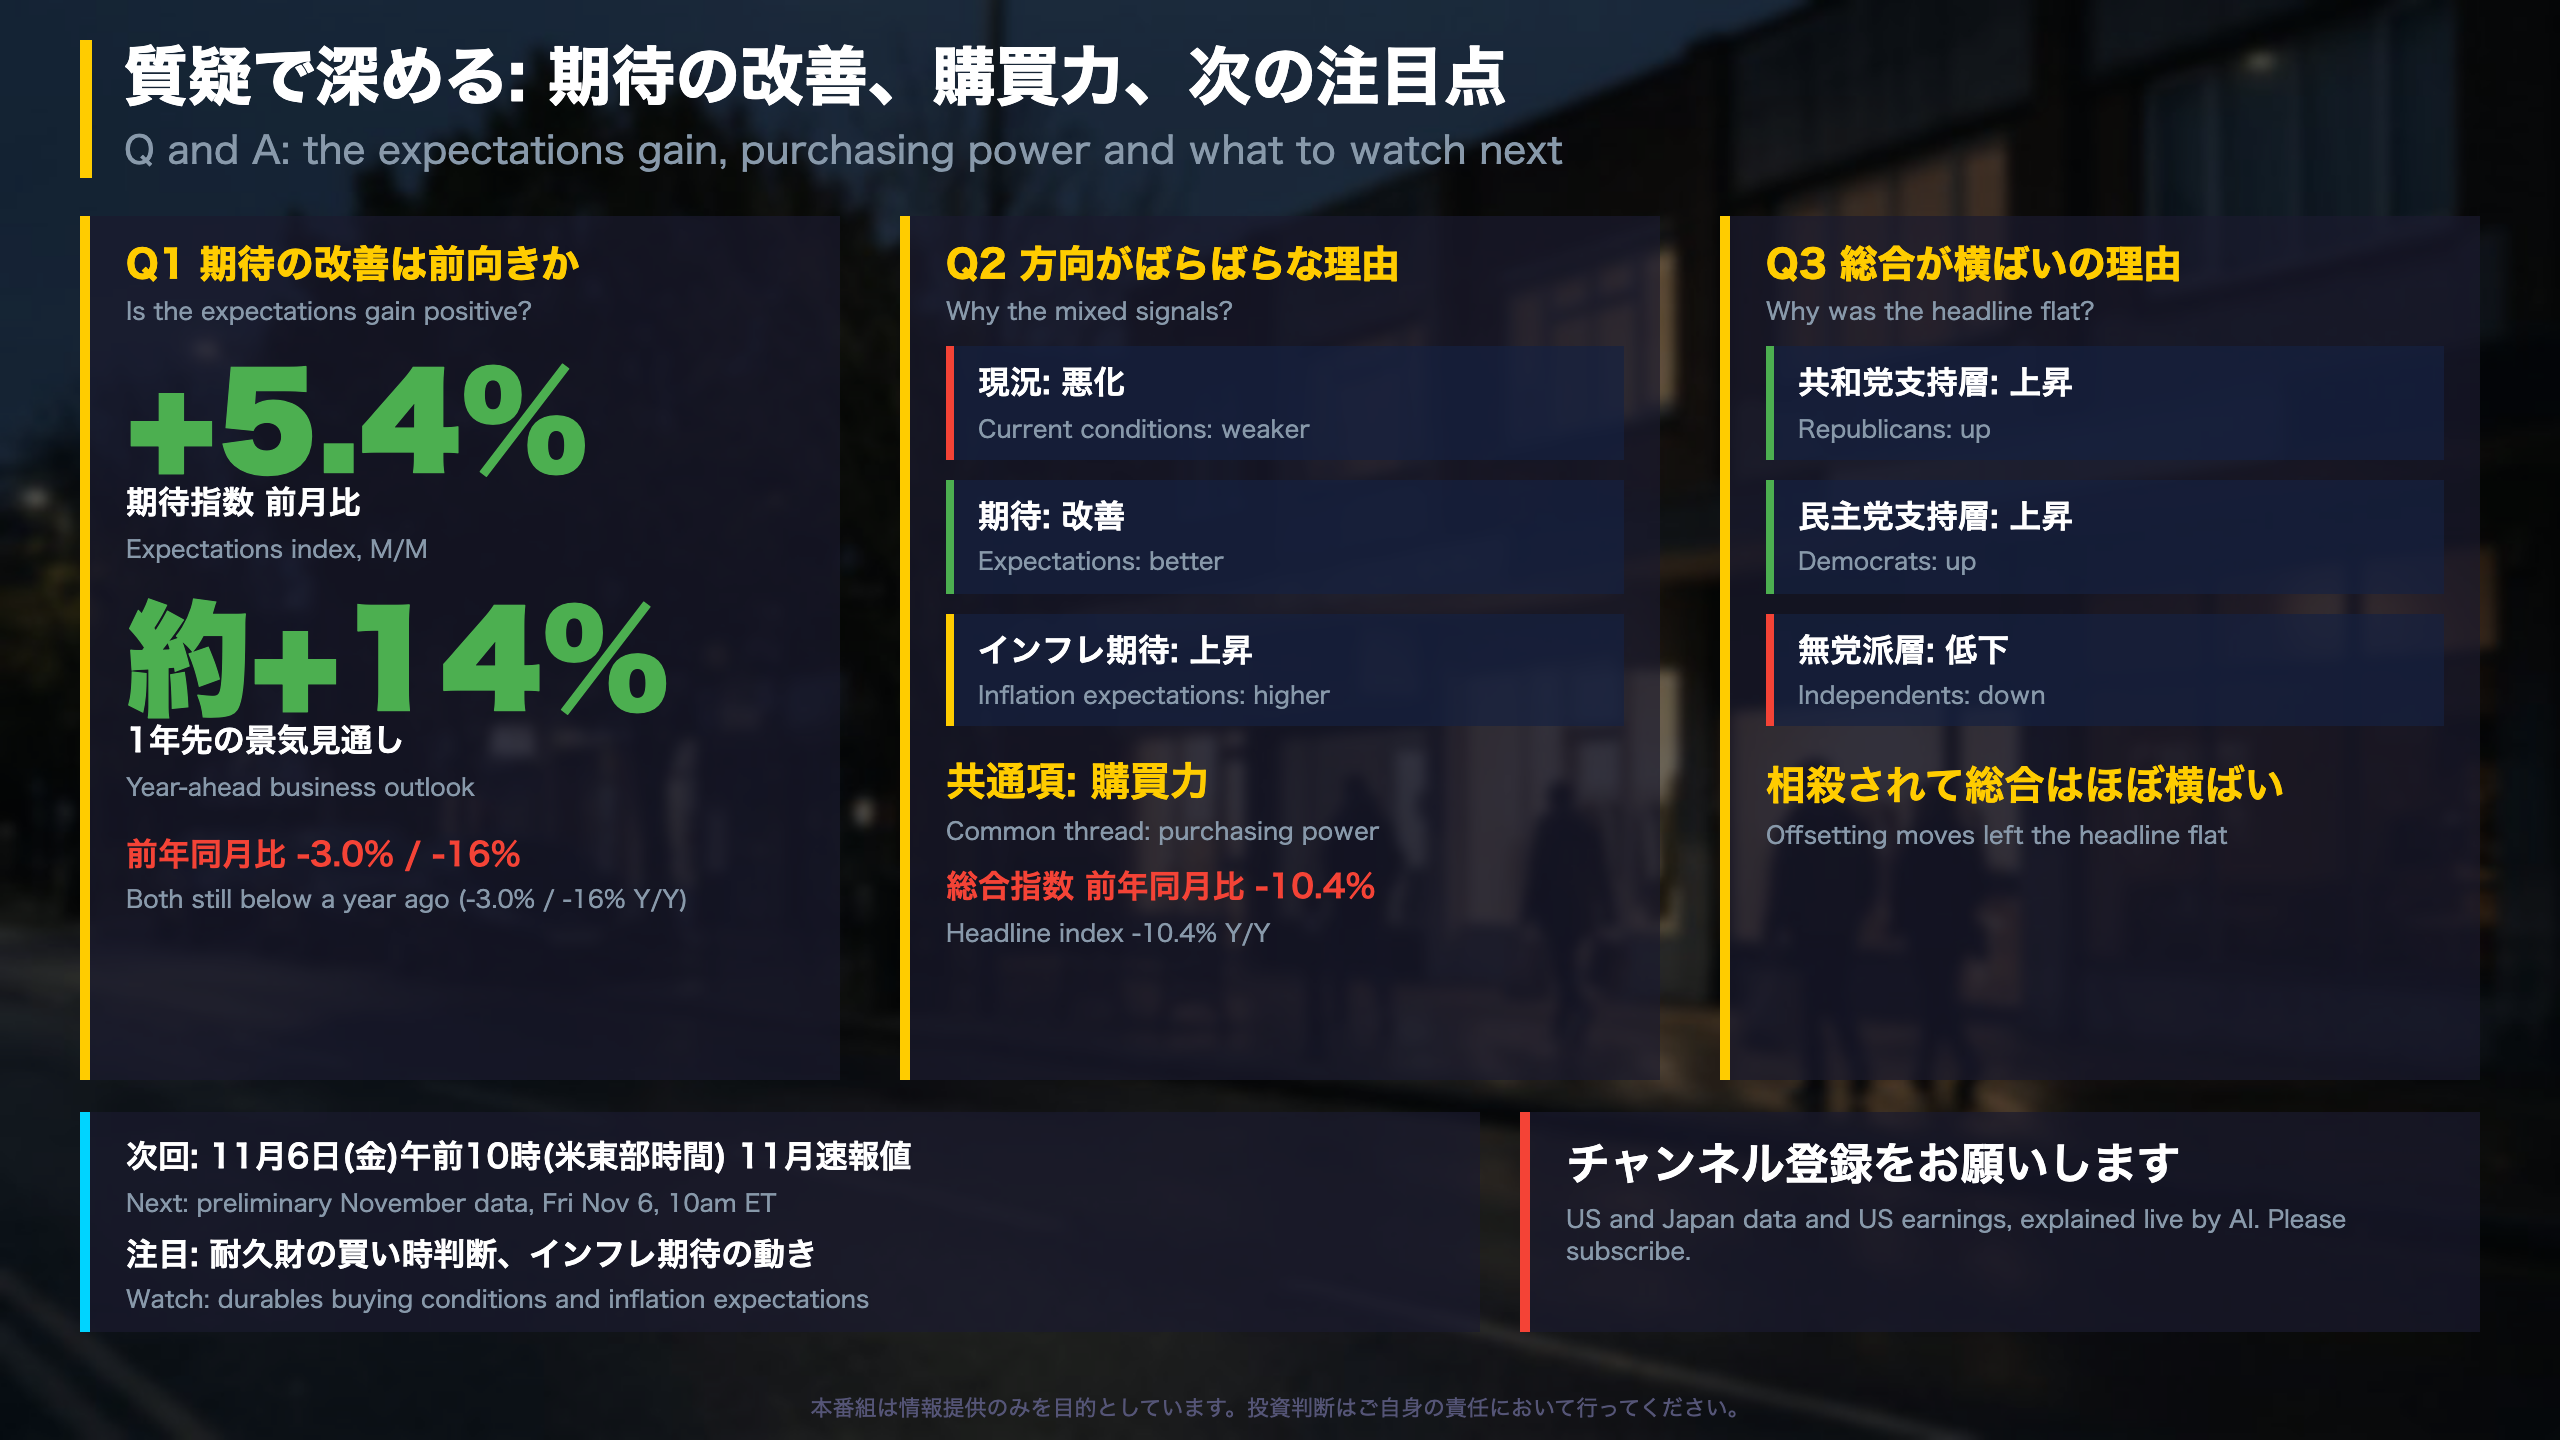
- Resilience: expectations improved and the year-ahead business conditions measure rose about 14%.
- Fragility: current conditions fell to a five-month low and durables buying conditions plunged.
This is a single-month reading, so it should not be treated as a confirmed trend. The release itself stresses that purchasing power continues to dominate consumer views.
What comes next
Preliminary November data are due Friday, November 6, 2026 at 10am ET.
深掘り1: 現況指数を押し下げた耐久財の買い時判断
Current conditions: a one-item story
The Index of Current Economic Conditions captures how households rate their present finances and buying climate. It fell to 46.7 in October from 50.9, a drop of 8.3% on the month and 20.3% versus October 2025.
Time-series context
- Feb 2026: 56.6
- May 2026: 45.8 (recent trough)
- Jul 2026: 54.8 (recent high)
- Sep 2026: 50.9
- Oct 2026: 46.7, the lowest since May
What the Michigan team says
Director Joanne Hsu states that the decline “was driven entirely by buying conditions for durables, which plunged 18% on the basis of higher interest rates and rising concerns about the affordability of such purchases.” Durables are big-ticket items such as vehicles and appliances, which are often financed.
Reading it in balance
- Cautious view: rate sensitivity in big-ticket purchasing appears to be rising.
- Mitigating view: the weakness is narrow; the release does not point to broad deterioration in other components. Year-ahead business conditions improved about 14%, though they remain 16% below last October.
International comparison
The Conference Board’s confidence index also splits current conditions from expectations, but the Michigan survey leans more on household finances and buying conditions, which is why interest-rate and affordability themes show up so clearly here.
One month of data is not a trend. The November 6 preliminary reading will show whether durables buying conditions stabilize.
深掘り2: 2か月連続で上昇したインフレ期待
Inflation expectations in context
The survey asks households how fast they expect prices to rise over the next year and over the next five to ten years; the figures quoted here are medians. The Federal Reserve and investors watch the long-run measure as one gauge of whether expectations remain anchored. Japan’s BOJ tracks similar household surveys, but the Michigan series is among the most frequently cited in the US.
Latest readings
| Date | 1-year | Long-run |
|---|---|---|
| Apr 2025 | 6.5% | 4.4% |
| Oct 2025 | 4.6% | 3.9% |
| Feb 2026 | 3.4% | 3.3% |
| May 2026 | 4.8% | 3.9% |
| Sep 2026 | 4.6% | 3.4% |
| Oct 2026 | 4.7% | 3.5% |
The release says both horizons “increased for the second straight month to their highest readings since May.”
Two ways to read it
- Cautionary: the one-year figure is well above February and every 2024 reading; the long-run figure sits above its 2024 range of 2.8% to 3.2%.
- Tempering: October’s moves were about 0.1 point each, the one-year figure is far below the 2025 peak, and the long-run figure is below October 2025’s 3.9%.
The accompanying special report, “Risks of Entrenchment,” provides longer historical context for long-run expectations. The next data point is the November 6 preliminary release.
質疑で深める: 先行きの期待と購買力、次の注目点
Politics, purchasing power and what to watch
The release notes that “increases in sentiment among Republicans and Democrats were balanced by declines among independents,” which is why the composite barely moved. The release gives no partisan figures, so we do not quote any. The Michigan survey has long reported partisan splits, and a separate special report this year examined sentiment and partisanship.
Key numbers at a glance
| Item | Oct 2026 | Sep 2026 | Oct 2025 |
|---|---|---|---|
| Composite | 48.0 | 48.1 | 53.6 |
| Current | 46.7 | 50.9 | 58.6 |
| Expectations | 48.8 | 46.3 | 50.3 |
| 1-yr inflation exp. | 4.7% | 4.6% | 4.6% |
| Long-run inflation exp. | 3.5% | 3.4% | 3.9% |
Balanced takeaways
- Resilience: expectations and the year-ahead business outlook (up about 14%) improved.
- Risk: current conditions are at a five-month low, and both inflation expectation measures rose for a second month.
- Context: the composite is about 15% below February’s pre-conflict level and 10.4% below a year ago.
Why the survey matters
Unlike hard data such as retail sales, this is a survey of attitudes. It is a soft-data signal, best read alongside spending and inflation figures rather than on its own.
Next release
Preliminary November data arrive Friday, November 6, 2026 at 10am ET. The items to track are the durables buying assessment and the one-year and long-run inflation expectations.
Disclaimer: This article is for informational purposes only. All investment decisions are made solely at your own risk.