📺 Watch the Full Video Analysis
This article was automatically generated by the NFC Market Live AI analysis system. (Updated: 2026-10-23 08:48 JST)
📄 Primary Source
総務省統計局
https://www.stat.go.jp/data/cpi/sokuhou/tsuki/pdf/zenkoku.pdf
📊 Japan’s September national CPI (final, Oct 23) set against Tokyo’s Oct 2 flash.
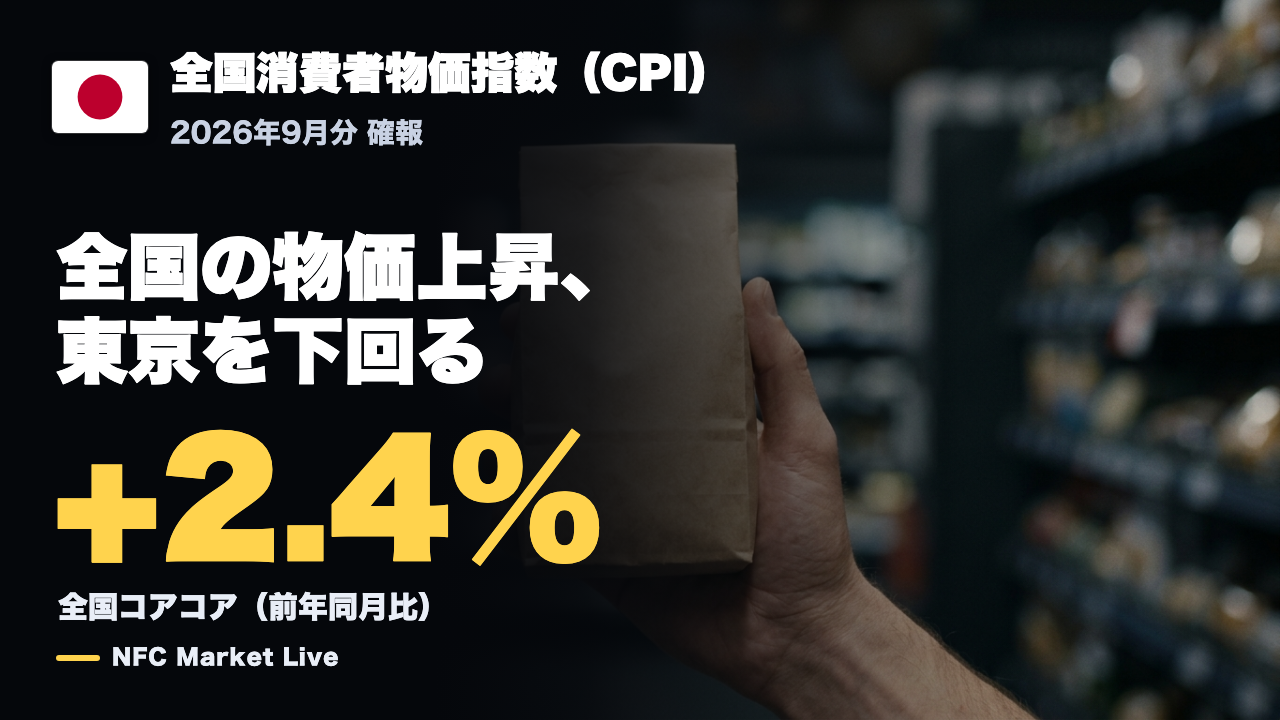
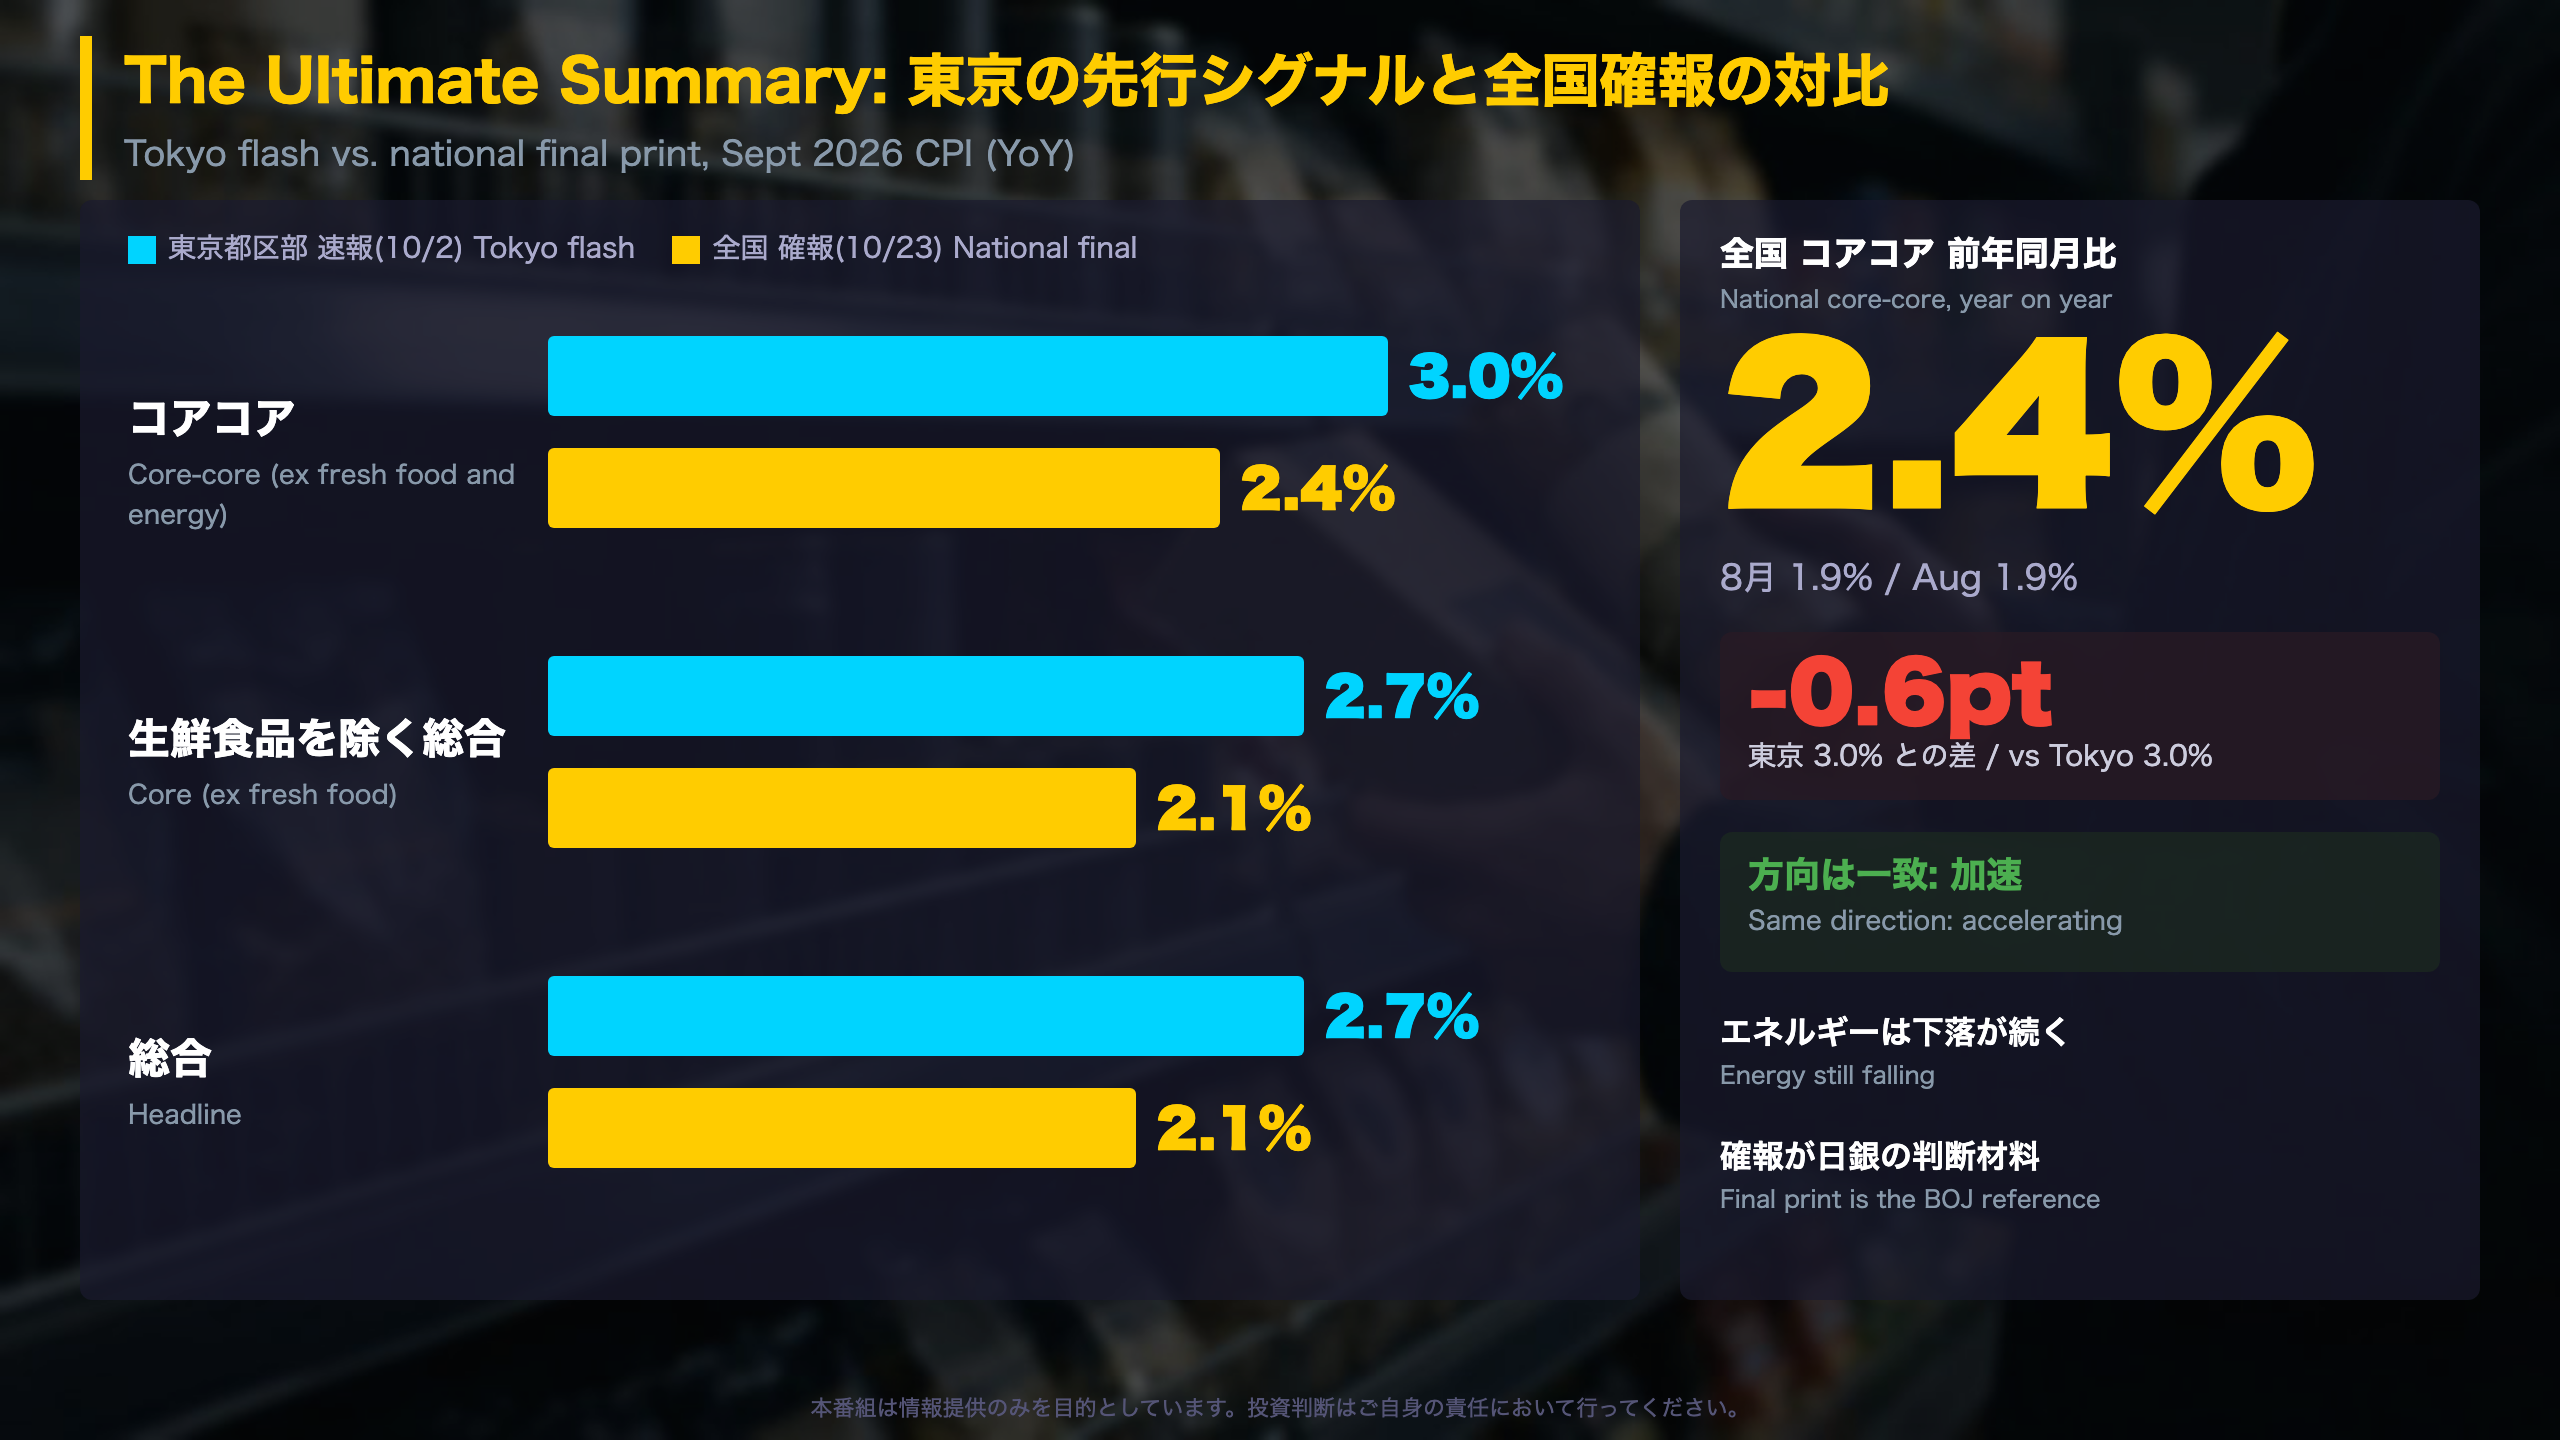
📈 Core-core inflation (ex fresh food and energy) rose 2.4% y/y, up from 1.9% in August but below Tokyo’s 3.0%.
💡 Tokyo was lifted by water and childcare fees; nationally, gains spread across food, lodging and durables.
⚠️ Energy stayed below year-earlier levels, and this is one month of data. Next: Tokyo Oct flash (Oct 30), national Oct CPI (Nov 20).
The Ultimate Summary: 東京の先行シグナルと全国確報の対比
Tokyo’s flash vs. the national final
What was released: On October 23, Japan’s Ministry of Internal Affairs and Communications (MIC) published final national CPI for September 2026 (2025 = 100). On October 2 it had released the Tokyo 23-ward flash, a mid-month early read that investors watch ahead of the national data.
| YoY | Tokyo flash | National final | National Aug |
|---|---|---|---|
| Headline | 2.7% | 2.1% | 1.9% |
| Ex fresh food (Japan’s core) | 2.7% | 2.1% | 1.7% |
| Ex fresh food and energy (core-core) | 3.0% | 2.4% | 1.9% |
Reading the definitions
Japan’s headline core measure excludes only fresh food. Core-core also strips out energy, which makes it the closest analogue to US core CPI, although, unlike the US measure, it still includes non-fresh food.
Why the national print matters
The national series is the scorecard the Bank of Japan (BOJ) refers to when judging policy; the Tokyo flash is a leading but narrower sample. Seasonally adjusted month-on-month gains were 0.4% for the headline and 0.5% for both core and core-core, the largest readings for the two core measures in the release’s 13-month table.
Balance of the picture
Broad-based pressure (food, lodging, durables, water) coexists with falling energy prices. This is explanation of released data, not a forecast.
What to watch
Tokyo’s October flash on October 30 and national October CPI on November 20.
東京と全国の差の正体
Decomposing the Tokyo-national gap
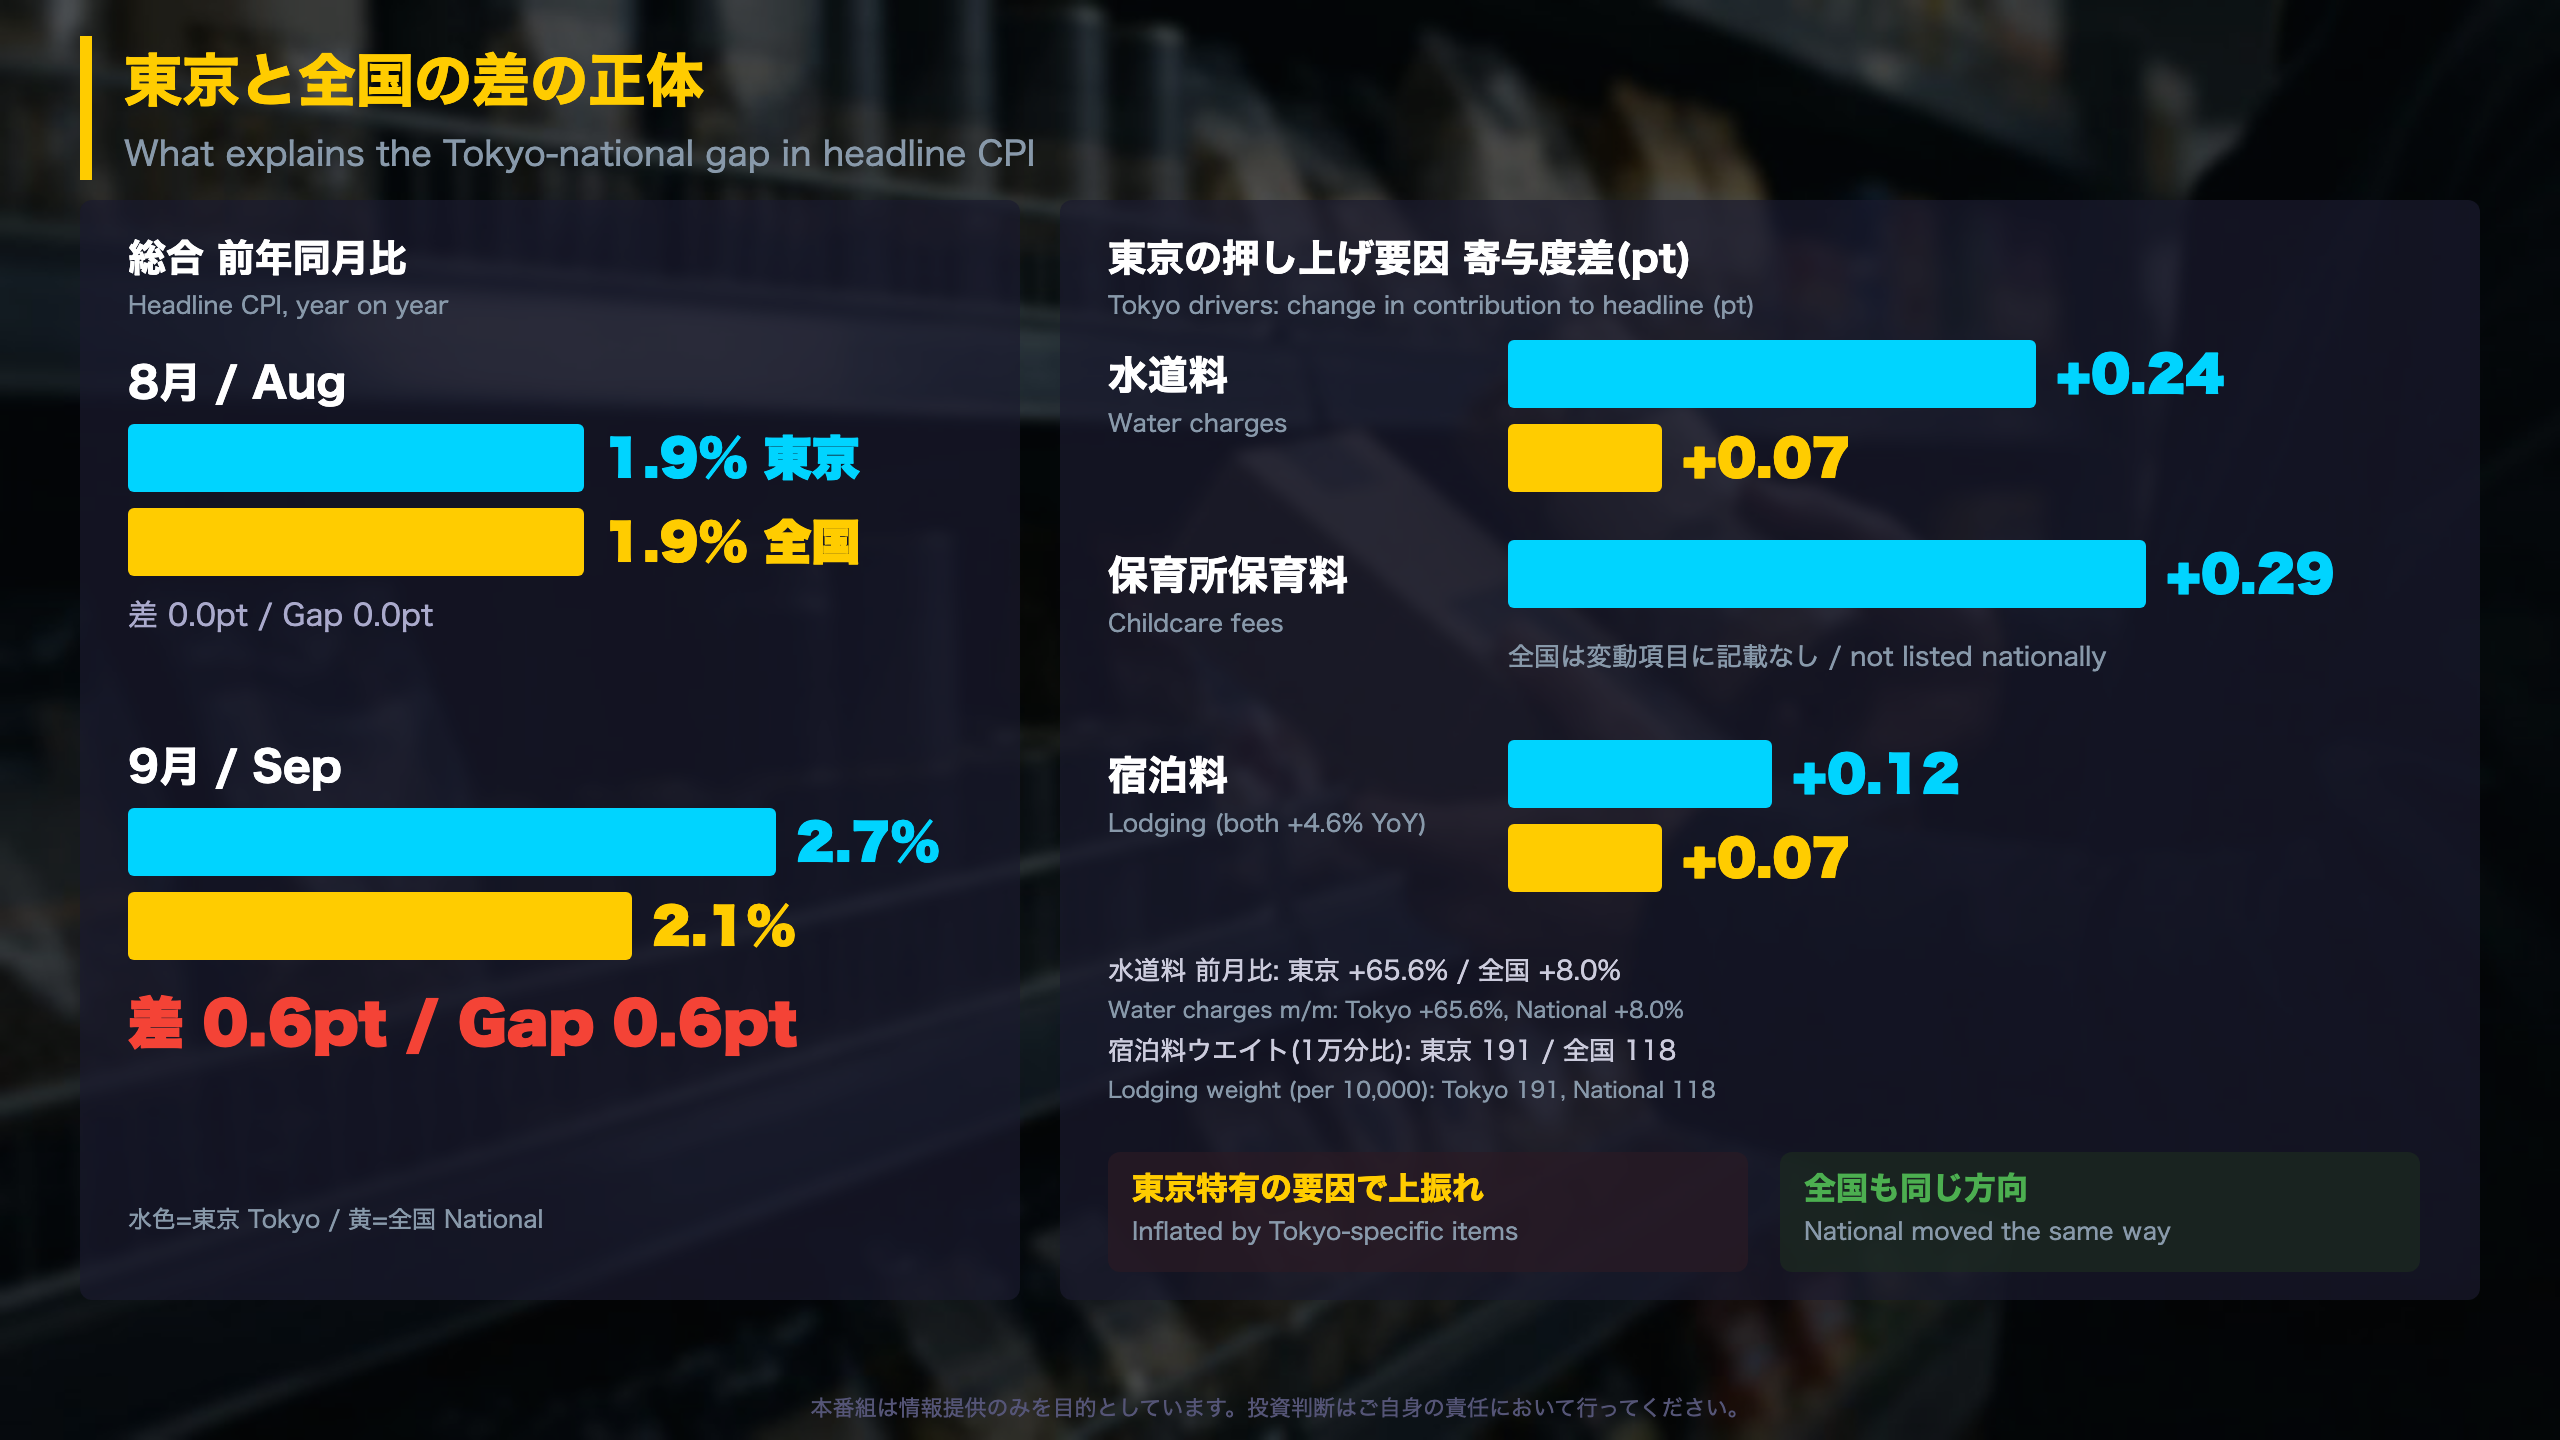
In August, headline CPI was 1.9% both in Tokyo’s 23 wards and nationwide. In September the Tokyo flash printed 2.7% against 2.1% nationally, a 0.6-point gap. The Statistics Bureau of Japan, part of the MIC, compiles both series on the same 2025 = 100 base, which makes them directly comparable.
What Tokyo’s report highlights
Water charges widened the headline gain by 0.24 points; childcare fees widened it by 0.29 points.
| Item | Tokyo (change in contribution) | National |
|---|---|---|
| Water charges | +0.24pt | +0.07pt |
| Childcare fees | +0.29pt | not listed |
| Lodging | +0.12pt | +0.07pt |
Tokyo water charges rose 65.6% month on month versus 8.0% nationally. Lodging was up 4.6% year on year in both, but Tokyo’s weight is 191 per 10,000 versus 118 nationally, so the same price move counts for more in Tokyo.
Historical context
From January to August the Tokyo-minus-national headline gap ranged from -0.2 to +0.3 points; September’s +0.6 is outside that band. Caveat: Tokyo’s September number is a mid-month flash, and the final Tokyo figure is not in the source document.
Independent read
This is similar to how US regional readings can diverge from the national CPI on local items such as utilities. The national data moved the same way, so the signal was directionally right but overstated in size.
全国の基調は確かに加速
The national detail: broad support, lingering drags
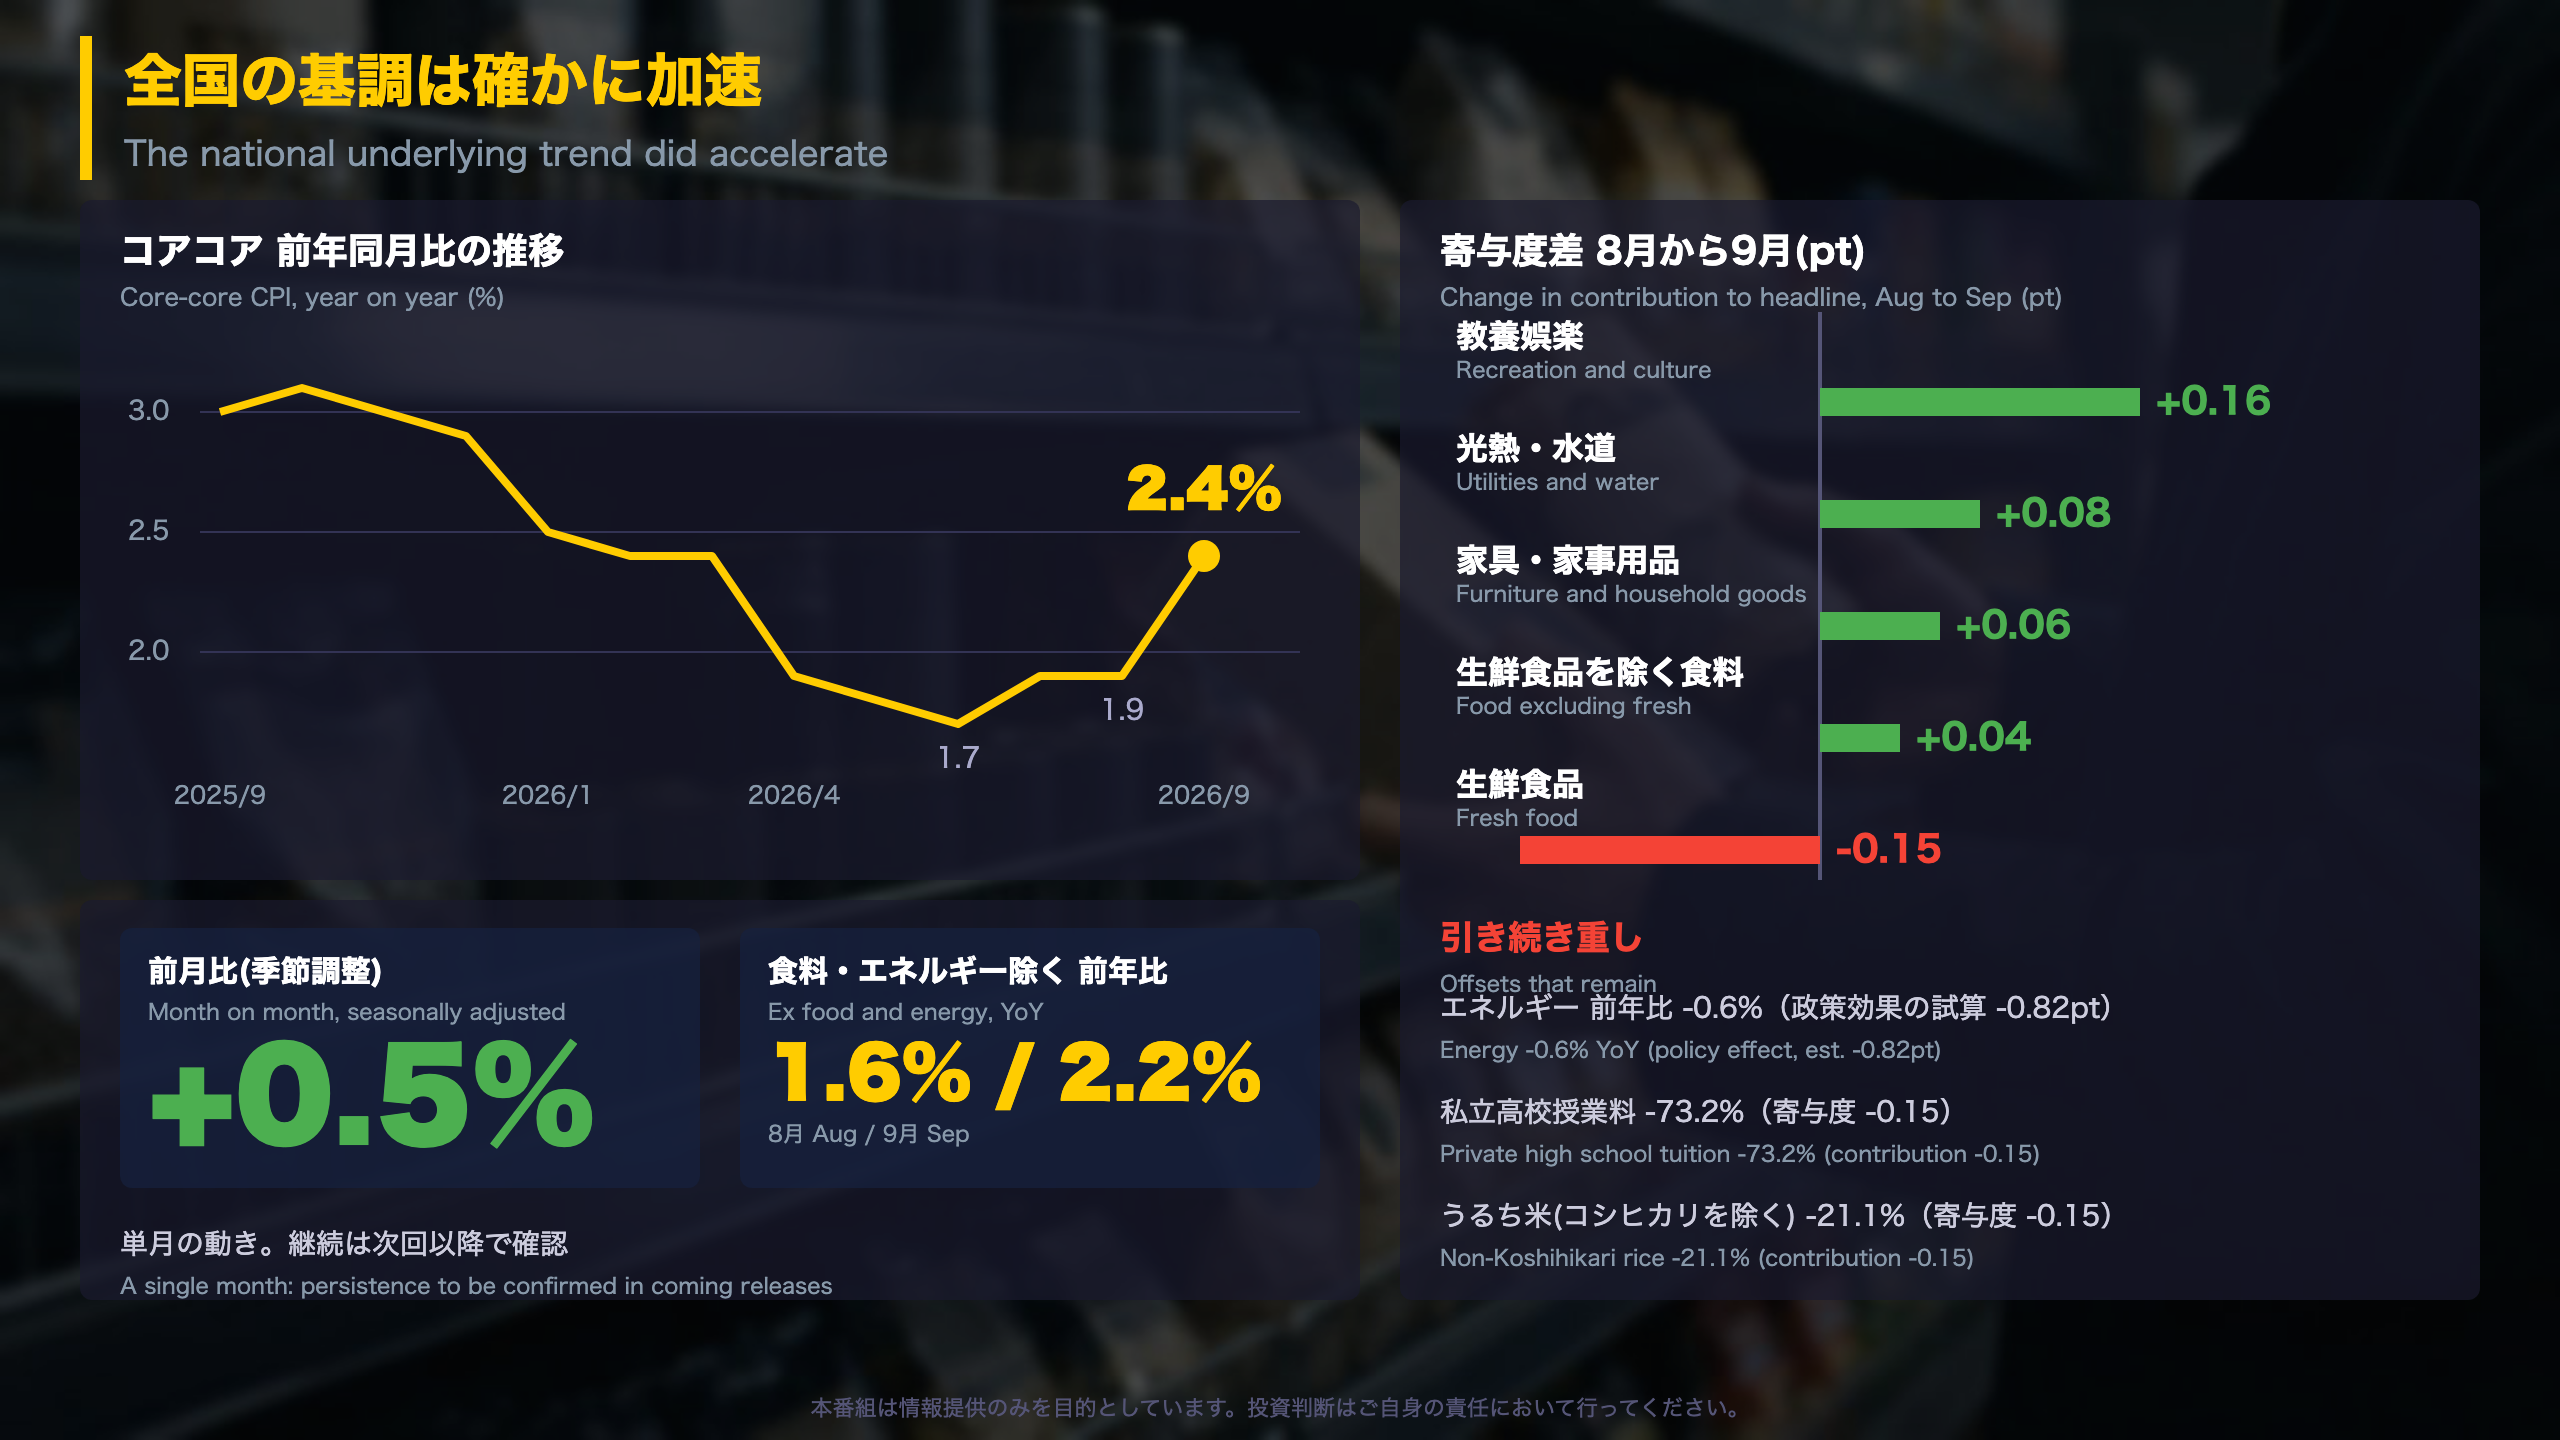
Change in contribution to headline CPI, Aug to Sep (points)
| Category | Change |
|---|---|
| Recreation and culture | +0.16 |
| Utilities and water | +0.08 |
| Furniture and household goods | +0.06 |
| Food excl. fresh | +0.04 |
| Fresh food | -0.15 |
Food excluding fresh items remains the largest single contributor to headline inflation at 0.69 points. Japan’s CPI uses a 2025 base year and publishes contributions that sum to the headline rate, which makes this kind of attribution transparent.
Quote from the release
The core (ex fresh food) year-on-year gain widened by 0.4 points, from 1.7% in August to 2.1% in September.
The offsets
Energy is down 0.6% year on year (electricity -2.4%, gasoline -2.6%). The Statistics Bureau’s own estimate puts the effect of the gasoline provisional-tax abolition and related policies at -0.82 points on energy (-0.62 in August). Private high school tuition (-73.2%) and non-Koshihikari rice (-21.1%) each subtract 0.15 points.
International comparison and caveats
Unlike US core CPI, Japan’s core-core still includes non-fresh food, so rice and food moves feed directly into it. The 0.5% seasonally adjusted monthly gain is the largest in the table, but it is a single month; core-core was 1.7-1.9% from April to August. Persistence is the question for the October and November releases.
質疑で深める
Q&A background: how reliable is the Tokyo flash?
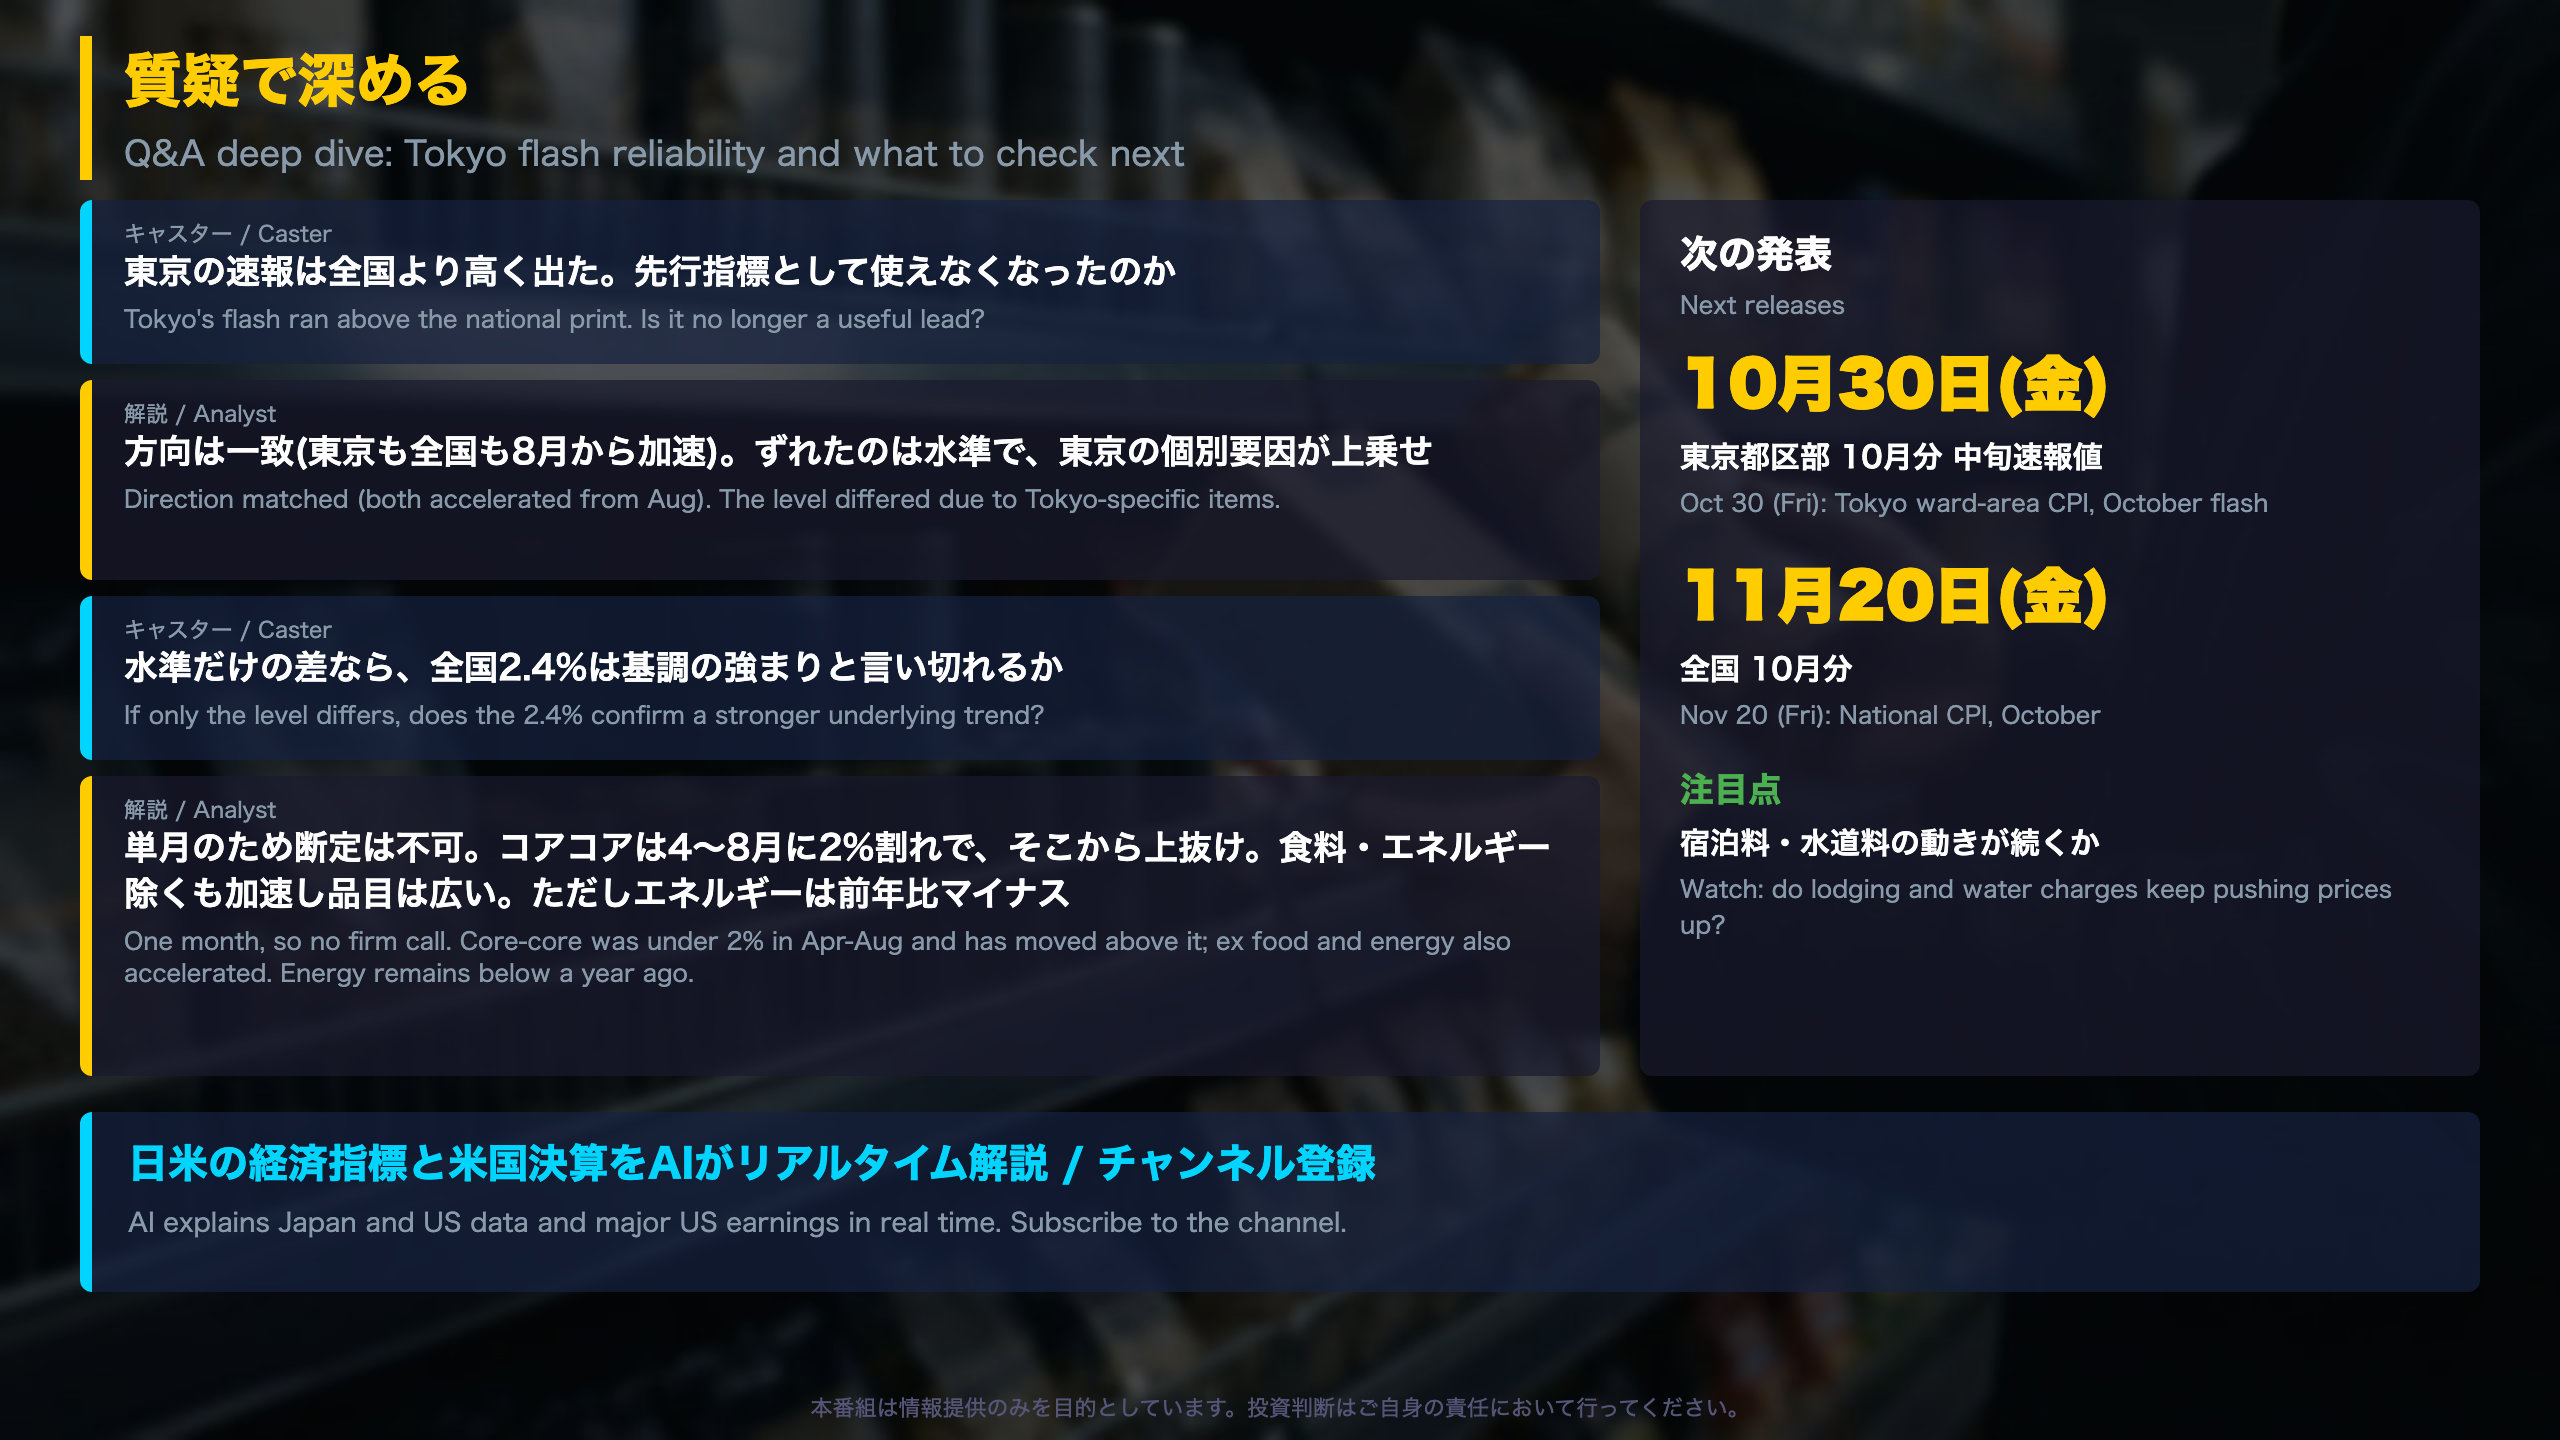
Tokyo’s 23-ward CPI is published mid-month ahead of the national series, which is why traders treat it as the early signal for Japan’s inflation trend. Here is how the two headline series compared this year.
| Month | Tokyo | National | Gap |
|---|---|---|---|
| Jan | 1.6 | 1.5 | +0.1 |
| Feb | 1.6 | 1.3 | +0.3 |
| Mar | 1.5 | 1.5 | 0.0 |
| Apr | 1.4 | 1.4 | 0.0 |
| May | 1.3 | 1.5 | -0.2 |
| Jun | 1.6 | 1.6 | 0.0 |
| Jul | 1.8 | 1.9 | -0.1 |
| Aug | 1.9 | 1.9 | 0.0 |
| Sep (Tokyo = flash) | 2.7 | 2.1 | +0.6 |
From January to August the gap stayed within -0.2 to +0.3 points, so September’s +0.6 is an outlier driven by Tokyo-specific items. Tokyo’s core-core flash was 3.0% (Aug 2.0%) versus 2.4% (Aug 1.9%) nationally.
Why direction matters more than level
Both readings accelerated from August, so as a directional signal Tokyo worked; as a level signal it overshot. The Bank of Japan’s reference is the national series, so the final print is the scorecard.
Next checkpoints
Tokyo October flash on October 30 and national October CPI on November 20. Watch lodging, water charges and energy. This is a reading of released data, not a forecast of policy or markets.
Disclaimer: This article is for informational purposes only. All investment decisions are made solely at your own risk.