📺 Watch the Full Video Analysis
This article was automatically generated by the NFC Market Live AI analysis system. (Updated: 2026-10-15 21:46 JST)
📄 Primary Source
U.S. Census Bureau
https://www.census.gov/retail/marts/www/marts_current.pdf
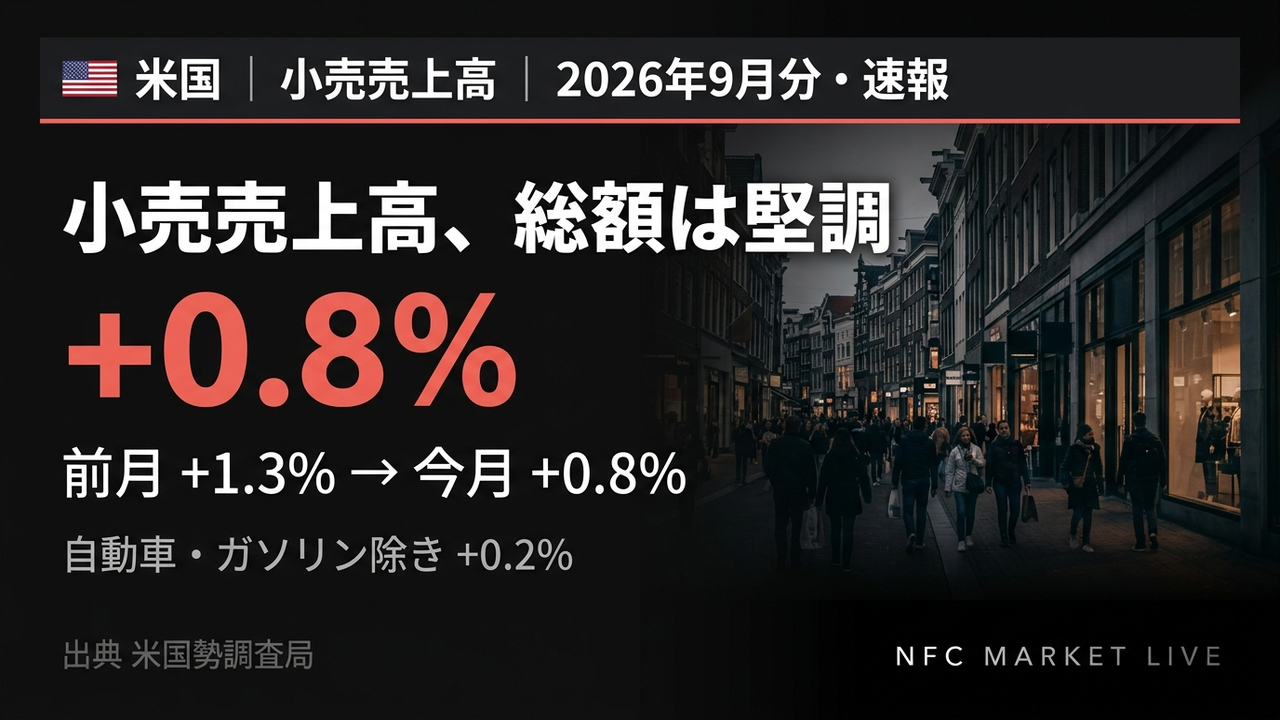
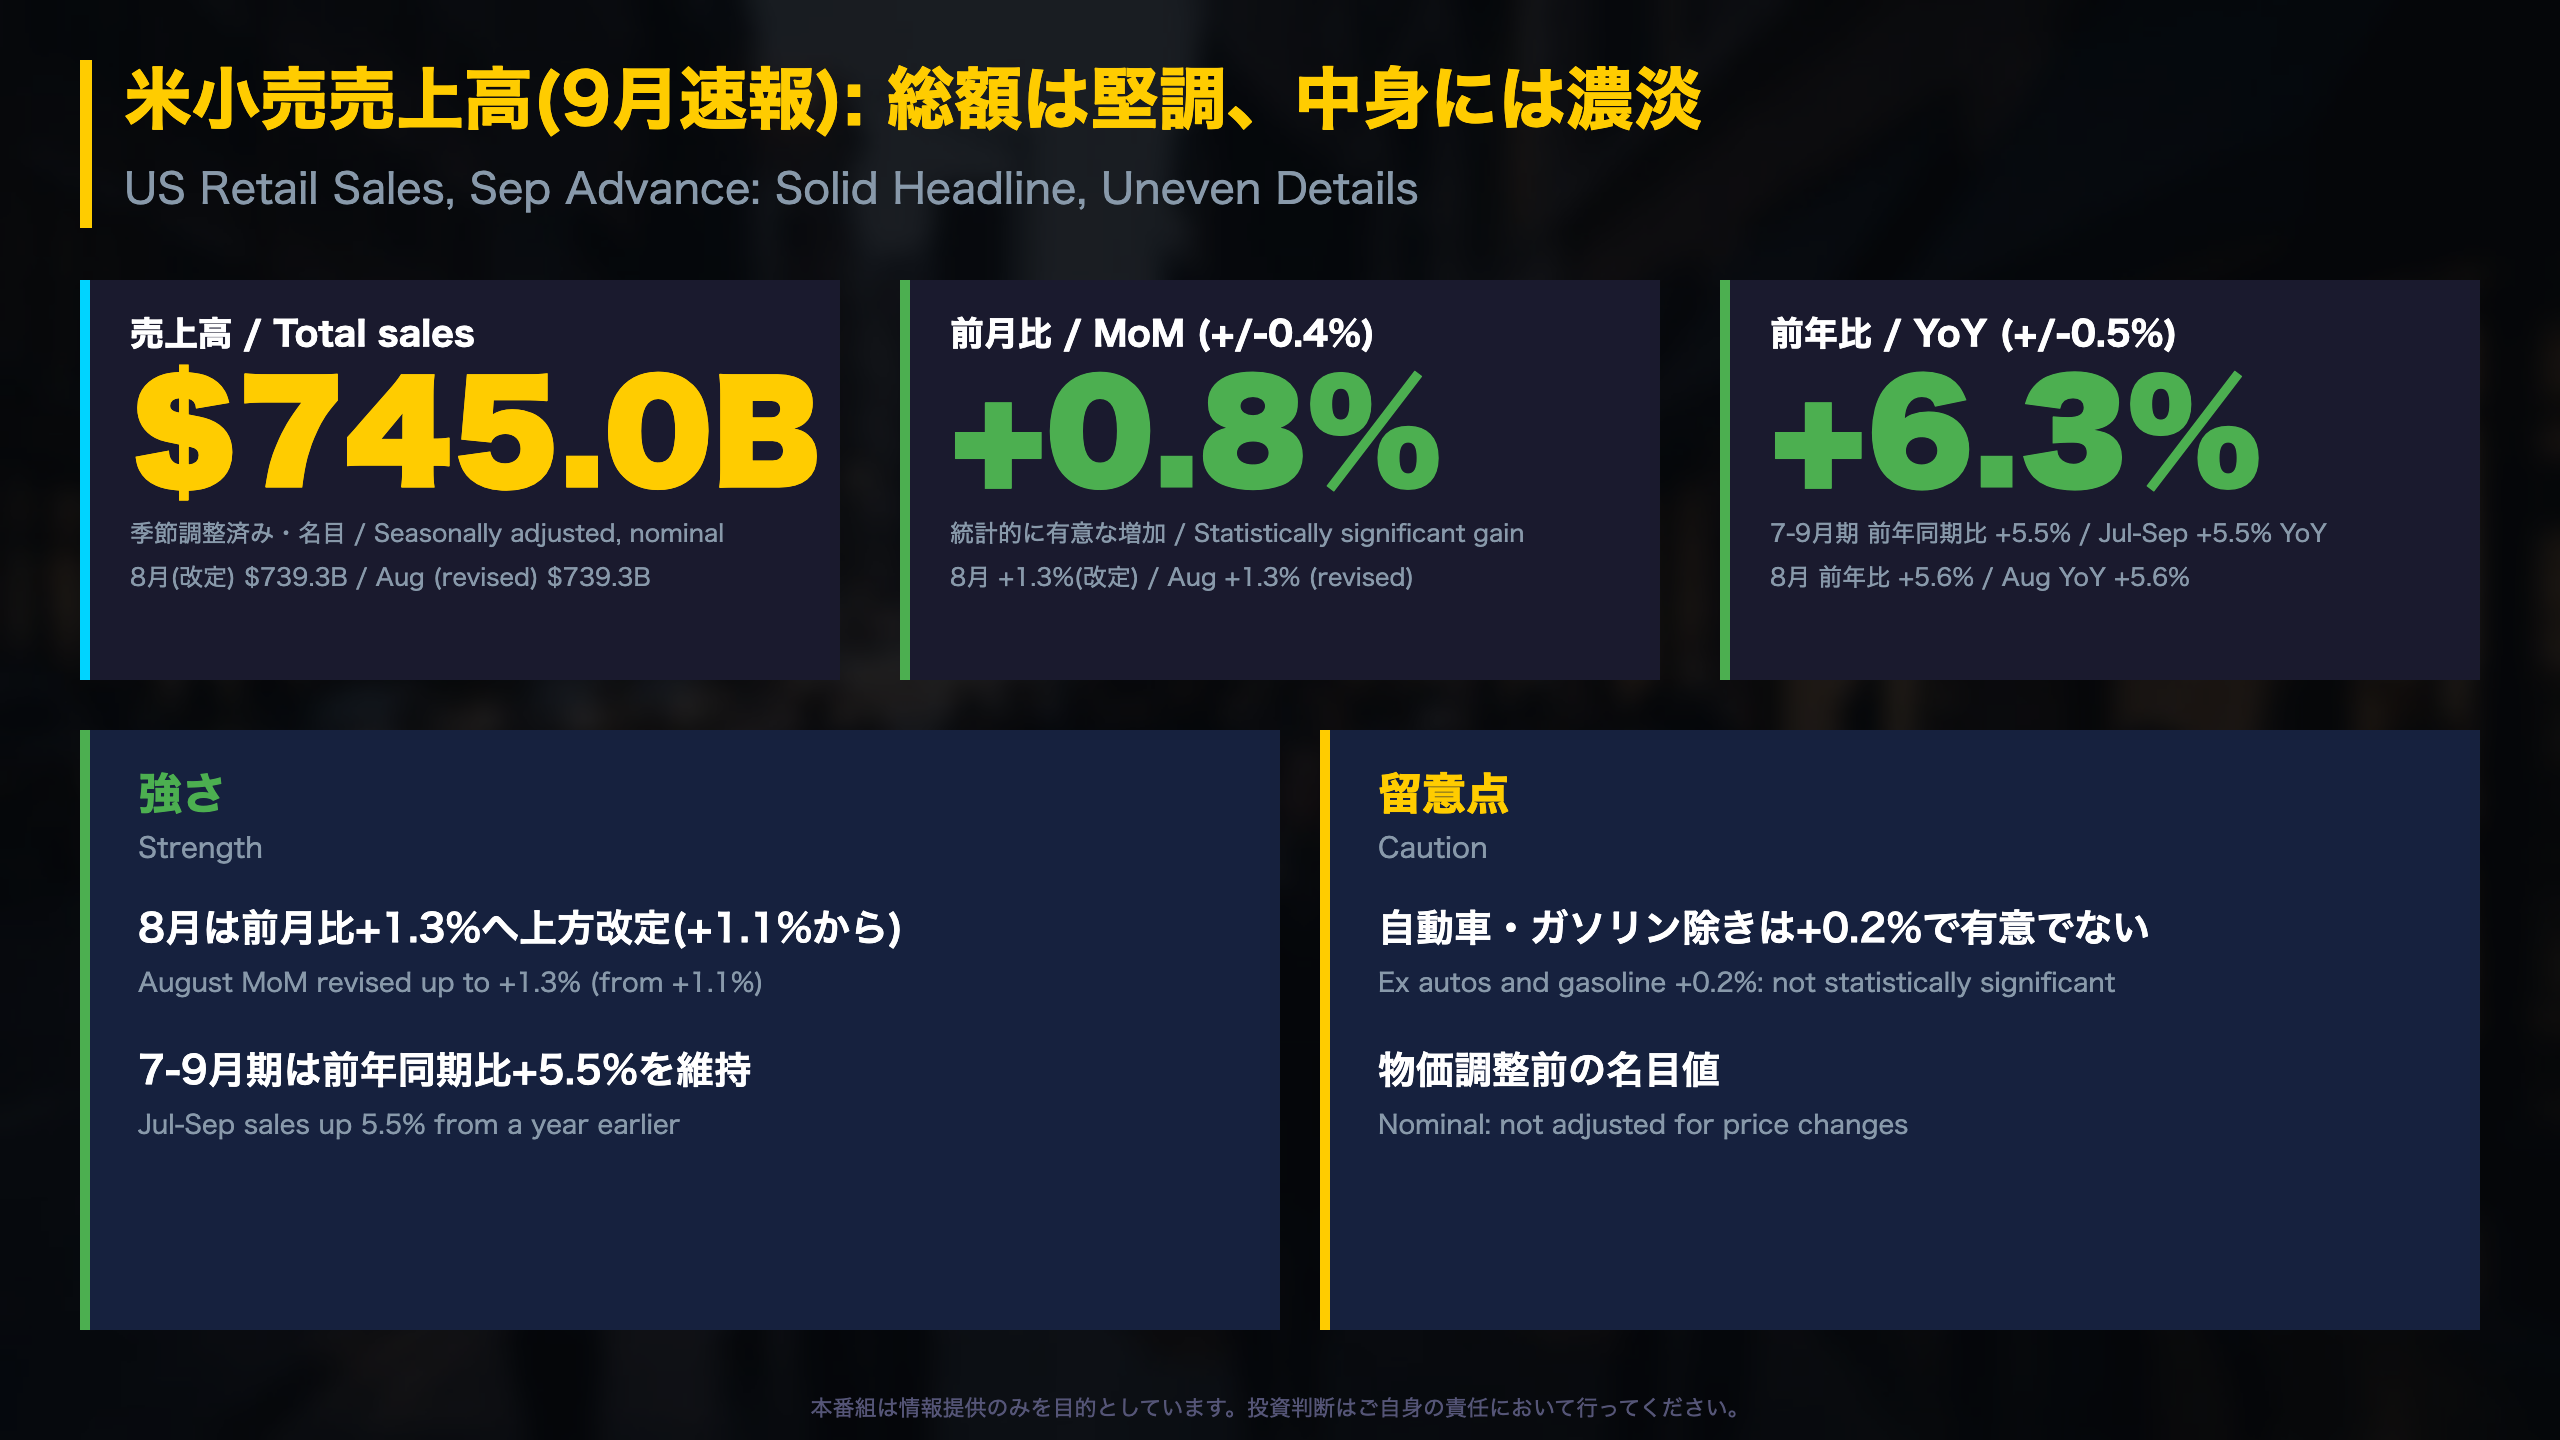
📊 The U.S. Census Bureau’s advance estimate for September retail and food services sales was $745.0 billion, up 0.8% m/m and 6.3% y/y.
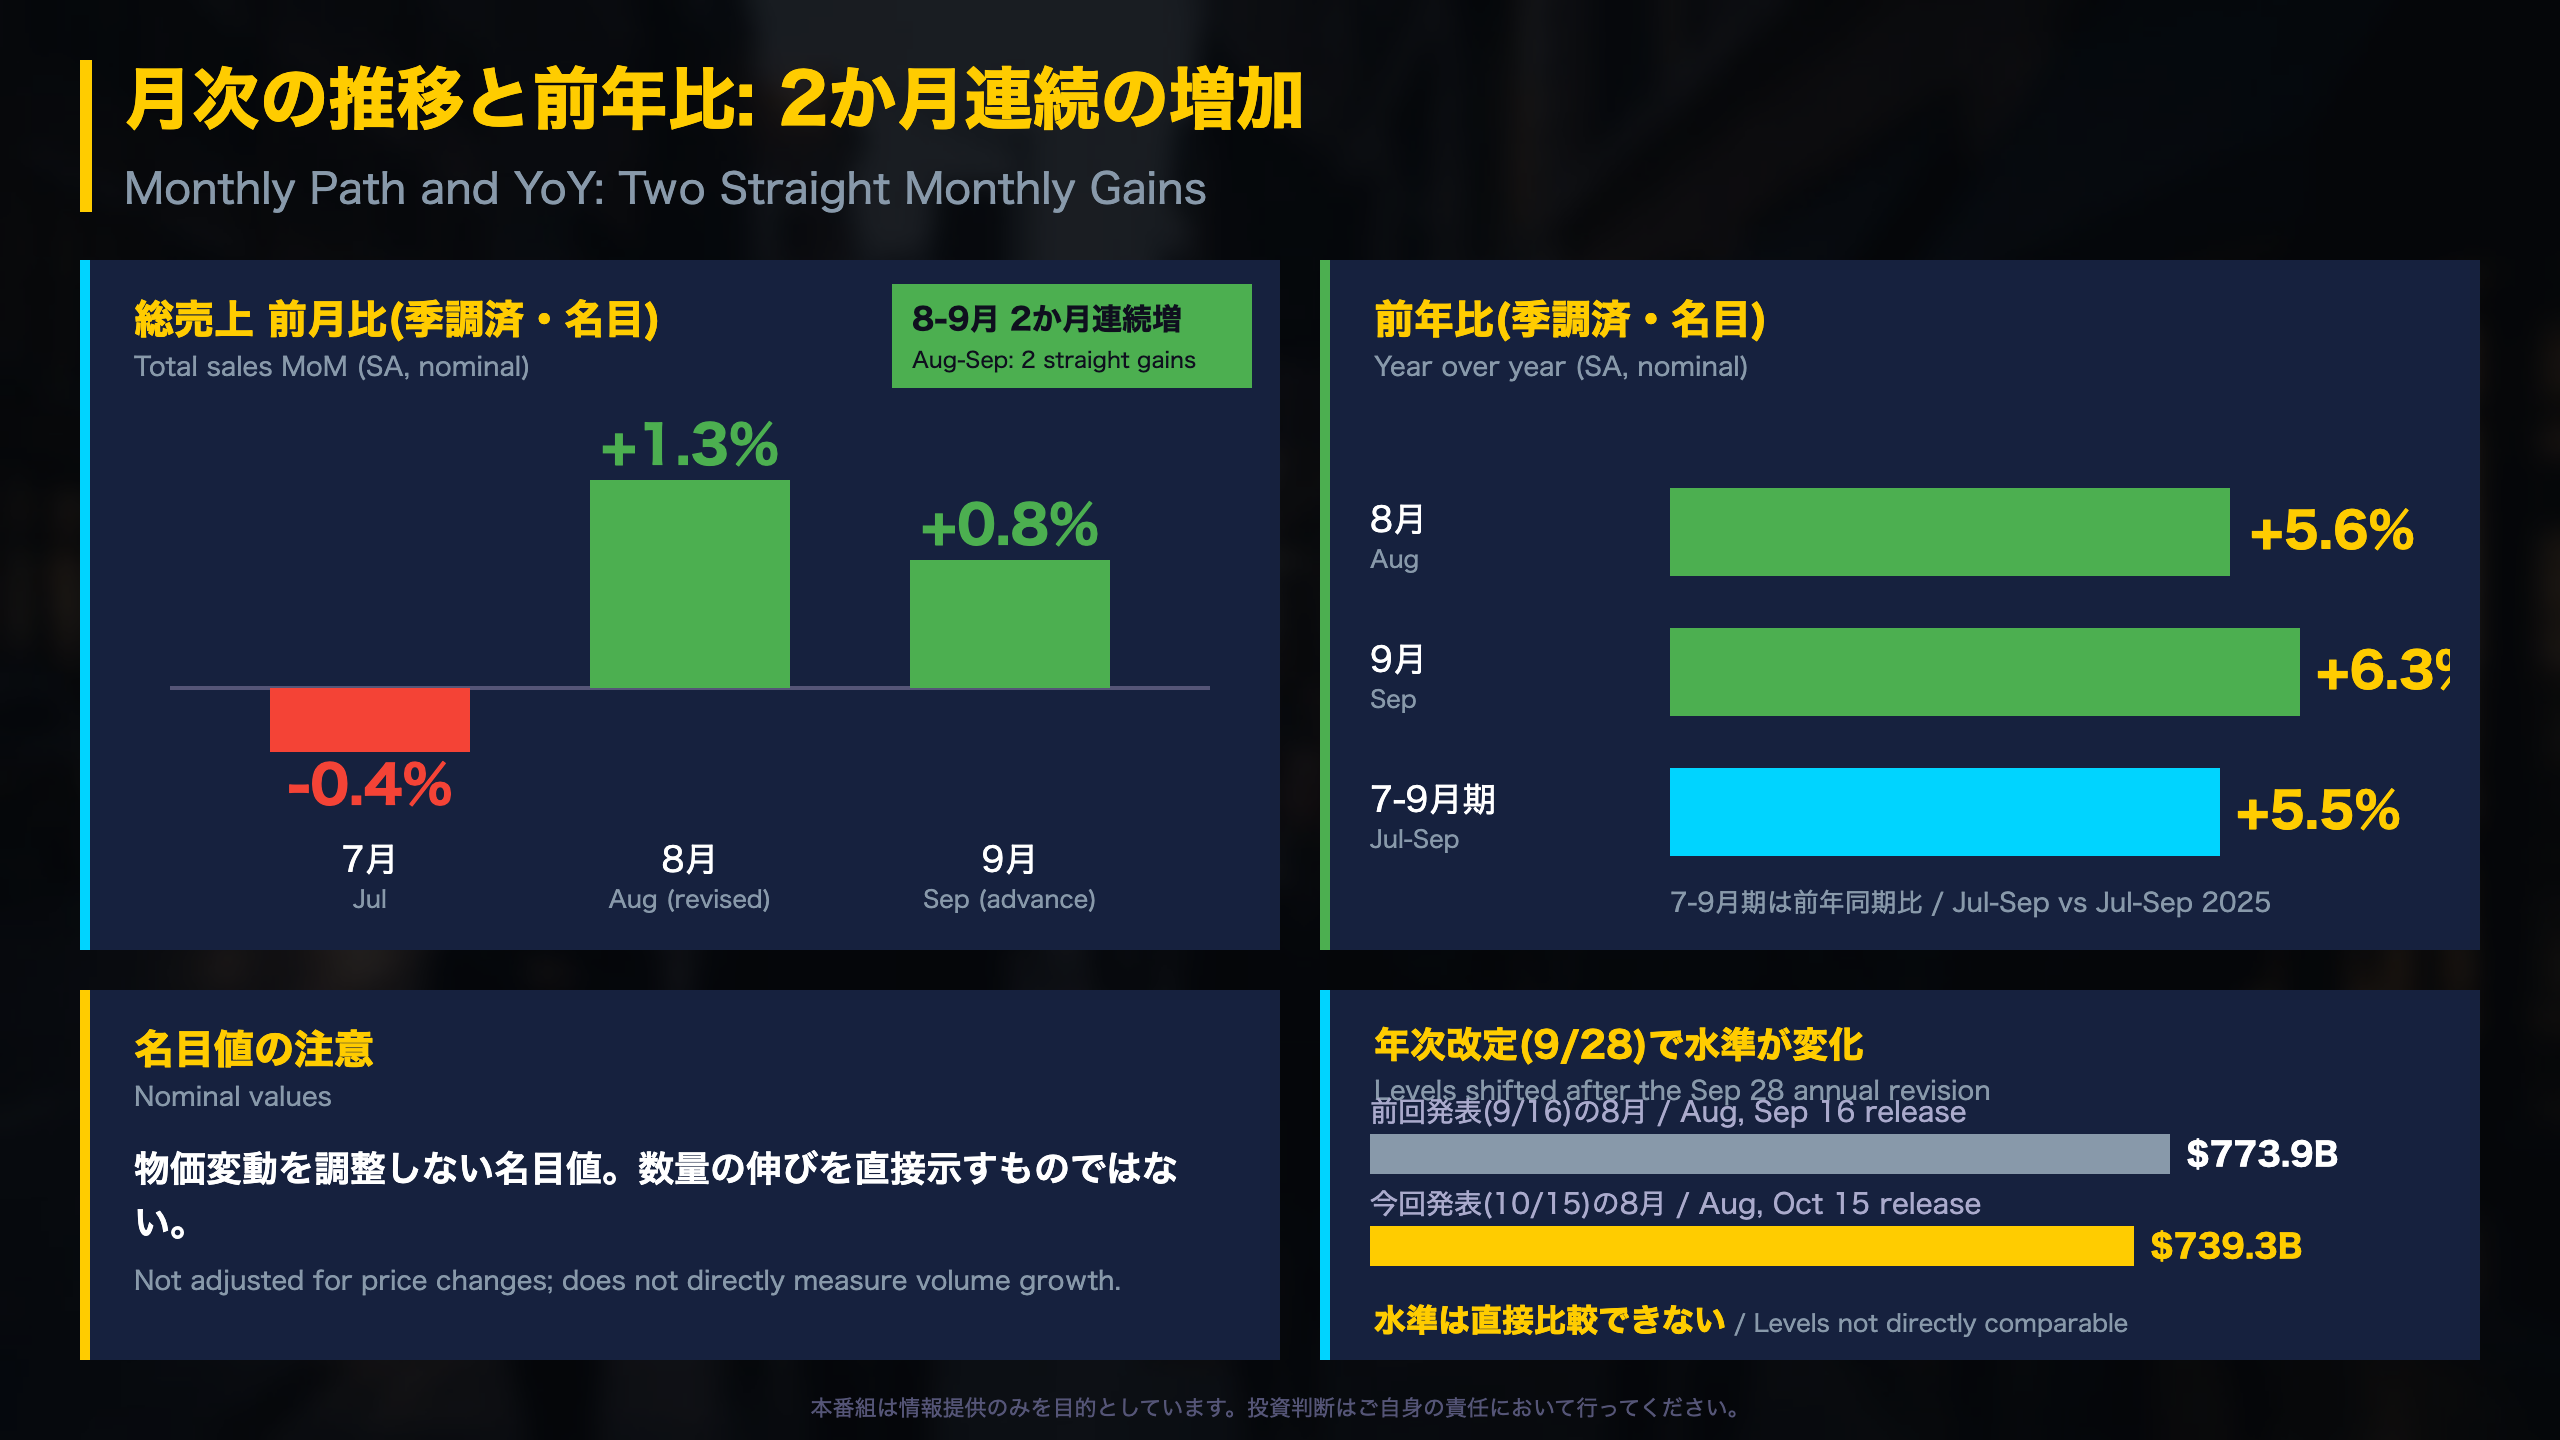
📈 August was revised up to +1.3% m/m, and July-September sales rose 5.5% from a year earlier.
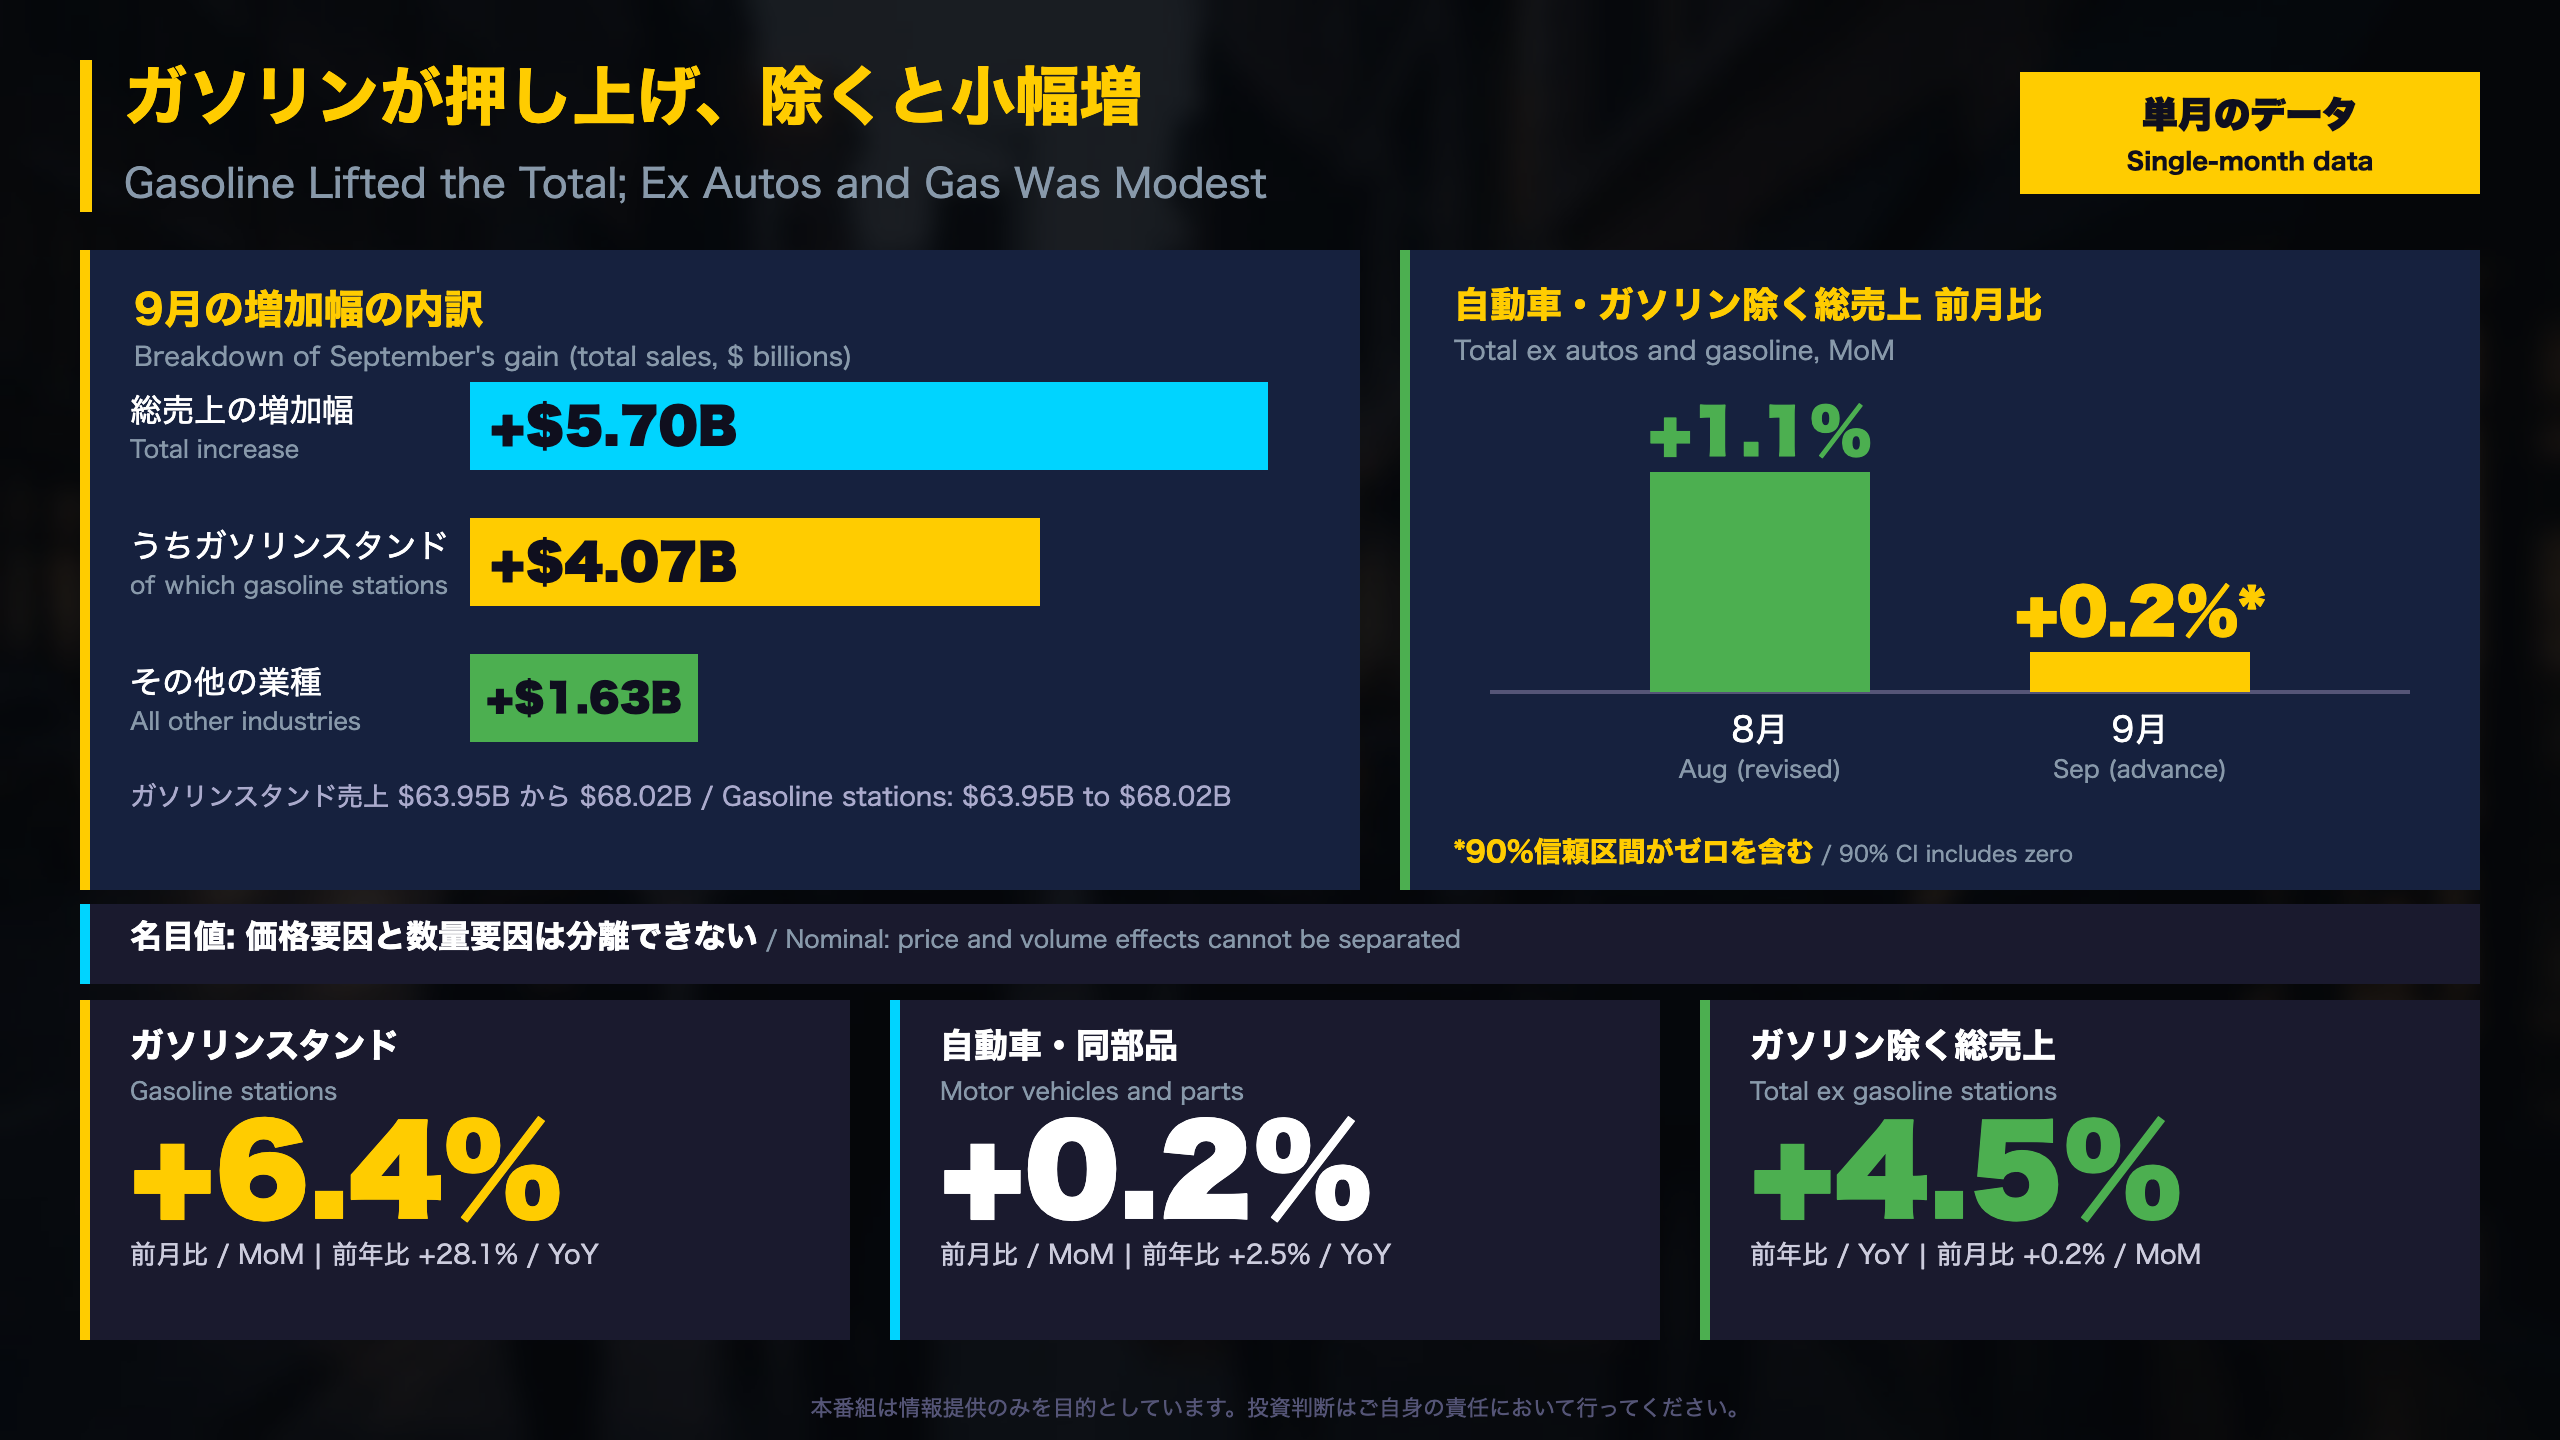
⚠️ Excluding autos and gasoline, sales rose only 0.2%, which is not statistically significant, while gasoline stations jumped 6.4% m/m. All figures are nominal.
💡 We unpack industry strengths and weaknesses, survey limits, and the level shift from the September 28 annual revision.
🗓 Next release (October data): November 17.
The Ultimate Summary: 総額は堅調、中身には濃淡
What this release is
The Advance Monthly Retail Trade Survey is the U.S. Census Bureau’s first estimate of monthly sales at retail stores, restaurants and bars. It samples roughly 4,800 firms and weights the results to represent over three million businesses. Figures are seasonally adjusted but not adjusted for inflation, so they mix price and volume effects.
September at a glance
- Total sales: $745.0 billion, +0.8% m/m (margin of error +/-0.4 pts), +6.3% y/y
- August revised to +1.3% m/m (from +1.1%)
- July-September: +5.5% from a year earlier
- Excluding autos and gasoline: +0.2%, statistically indistinguishable from zero
The Census Bureau states: ‘If the interval contains 0, then one does not have sufficient evidence to conclude at the 90 percent confidence level that the change is different from zero.’
How to read it
The headline is a statistically significant gain, and the three-month year-over-year rate is solid. The narrower measure excluding autos and gasoline is much softer for the month, so the strength is not evenly spread. Retail sales covers goods and food service; it is one input among many on consumer activity, and this release contains no information about Fed policy, the dollar or equities. The next report (October data) arrives on November 17, 2026.
月次の推移と前年比: 2か月連続の増加
Why the revision history matters
Advance estimates rest on a small sample and are revised in later releases, and once a year the whole series is re-benchmarked. On September 28, 2026 the Bureau published an annual revision using results from the 2023 and 2024 Annual Integrated Economic Survey.
| Item | Sept 16 release | Oct 15 release |
|---|---|---|
| August sales | $773.9 bn | $739.3 bn |
| August y/y | +6.0% | +5.6% |
| Latest 3-month y/y | +6.0% (Jun-Aug) | +5.5% (Jul-Sep) |
The roughly $34.6 billion gap in the August level most likely reflects the re-benchmarking rather than a change in spending, though the release does not itemize the cause.
Month-to-month path in the latest release
July -0.4%, August +1.3%, September +0.8%. The direction of the July and August moves matches the earlier release (-0.5% and +1.2%), so the revision changed magnitude, not sign.
What we can and cannot compare
Because the two releases sit on different benchmarks, treating +6.0% versus +5.5% as a slowdown would be unsafe. Within the October release, the like-for-like comparison is 5.6% (August) versus 6.3% (September) y/y, both nominal. As a general matter, nominal series can rise with prices alone; this report contains no price data to test that.
ガソリンが押し上げ、除くと小幅増
Gasoline stations: the outlier line
Gasoline stations posted +6.4% m/m and +28.1% y/y in September, following +4.0% m/m in August. Sales were $68.02 billion versus $63.95 billion, and the line is about 9% of total sales. Of the roughly $5.7 billion total increase, about $4.1 billion came from this line (simple arithmetic on Table 1).
| Measure | m/m | y/y |
|---|---|---|
| Total | +0.8% | +6.3% |
| Ex autos & parts | +0.9% | +7.2% |
| Ex gasoline | +0.2% | +4.5% |
| Ex autos & gasoline | +0.2% (not significant) | +5.0% |
Two ways to read it
- Constructive: even without gasoline, sales are up 4.5% y/y, and ex autos and gasoline up 5.0% y/y, so the year-over-year picture is not narrowly based.
- Cautious: the ex autos and gasoline m/m series ran -0.1%, +1.1%, +0.2% for July-September, and the July and September readings are not statistically different from zero. Two consecutive significant moves in one direction are absent, so the trend call stays open.
Scope note
As a general matter, fuel station revenue moves with pump prices as well as gallons sold, and this nominal release cannot split the two. Nothing in the report speaks to Fed policy, FX or equity markets; those questions need other data.
業種別の強弱と統計の限界
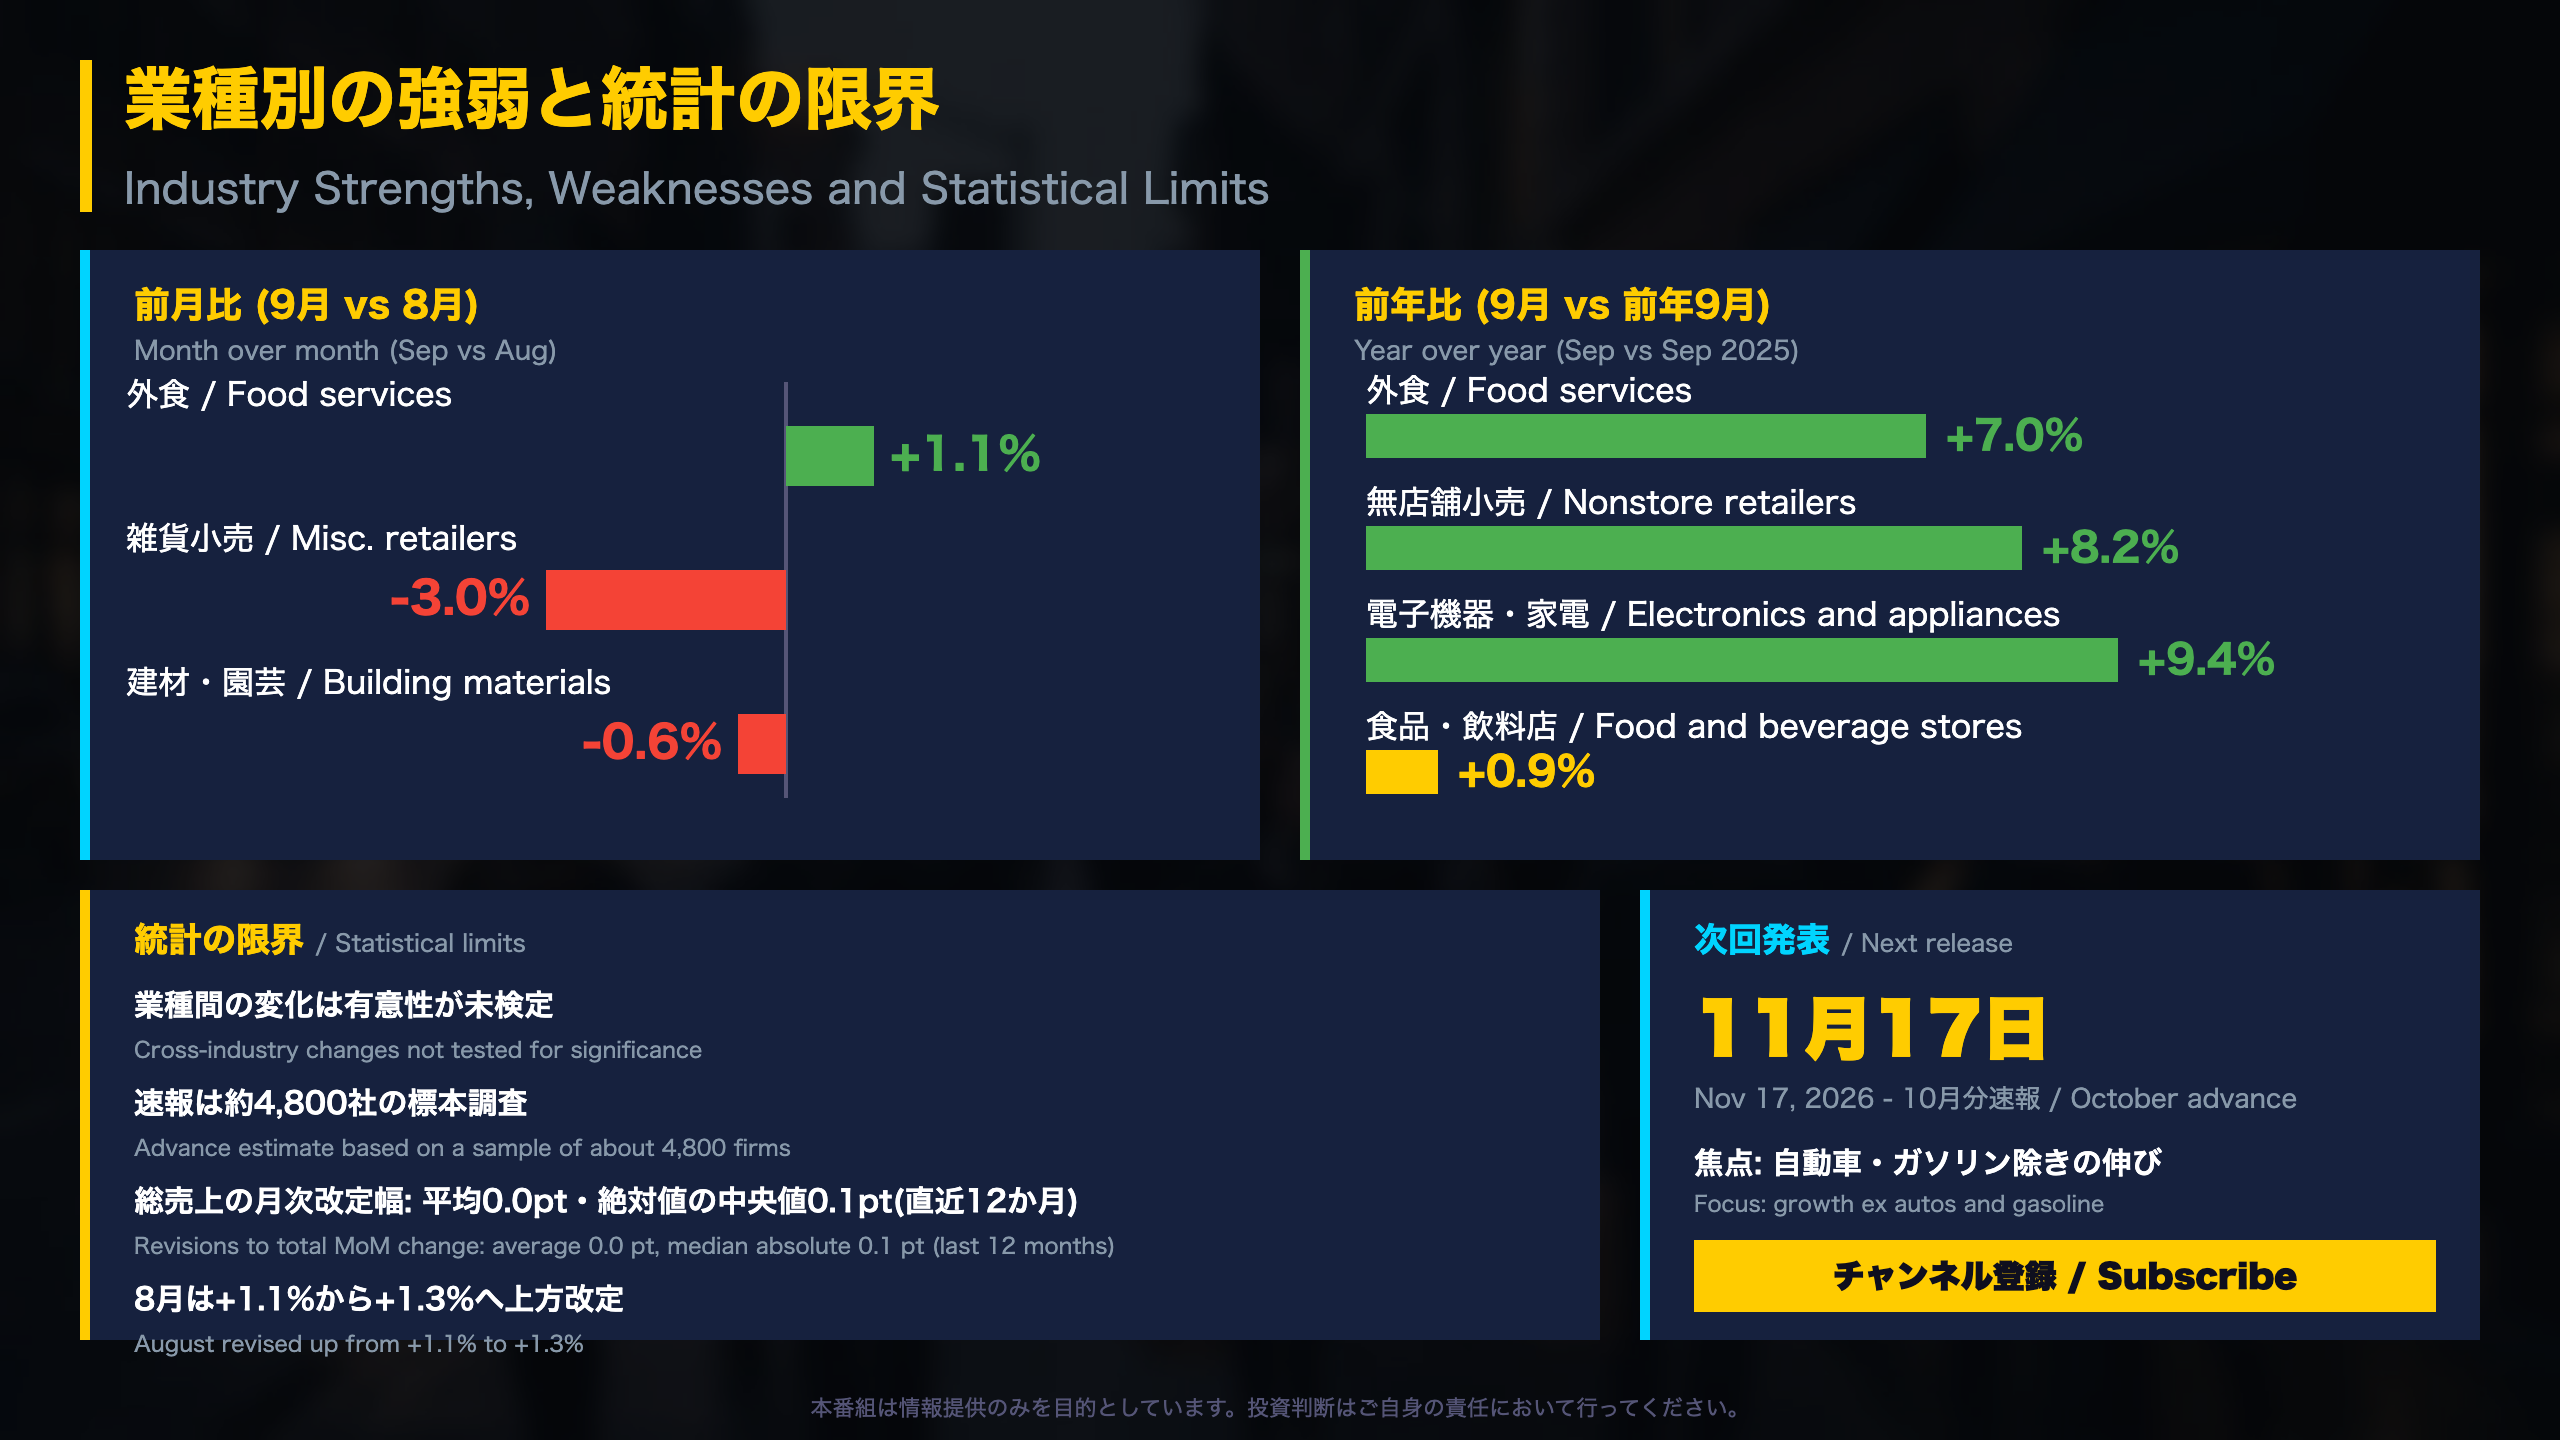
Industry detail
| Industry | m/m | y/y |
|---|---|---|
| Food services | +1.1% | +7.0% |
| Nonstore retailers | +0.3% | +8.2% |
| Electronics & appliances | +0.6% | +9.4% |
| Building materials | -0.6% | +4.5% |
| Miscellaneous retailers | -3.0% | +10.9% |
| Food & beverage stores | +0.4% | +0.9% |
| Health & personal care | +0.7% | -1.2% |
The Census Bureau notes that comparisons across industries have not been tested for significance.
Reading the mix
The y/y column shows breadth in restaurants, online and catalog sellers and electronics, with grocery-type stores and pharmacies lagging. Miscellaneous retailers show a month-to-month swing (-3.0%) alongside a +10.9% annual rate, a reminder that one month rarely defines a category. Some detailed lines are not published in the advance report (marked with an asterisk) or fail publication standards (marked S).
Reliability
The advance estimate uses a link-relative method and does not impute most nonrespondents. Over the past 12 months, revisions to the total month-to-month change averaged 0.0 points, with a median absolute revision of 0.1 points; August itself moved from +1.1% to +1.3% in this release.
What to watch
The October report is due November 17, 2026. The series to follow is growth excluding autos and gasoline, where September’s +0.2% was not statistically significant.
Disclaimer: This article is for informational purposes only. All investment decisions are made solely at your own risk.