
📺 Watch the Full Video Analysis
This article was automatically generated by the NFC Market Live AI analysis system. (Updated: 2026-09-16 21:41 JST)
📄 Primary Source
U.S. Census Bureau
https://www.census.gov/retail/marts/www/marts_current.pdf
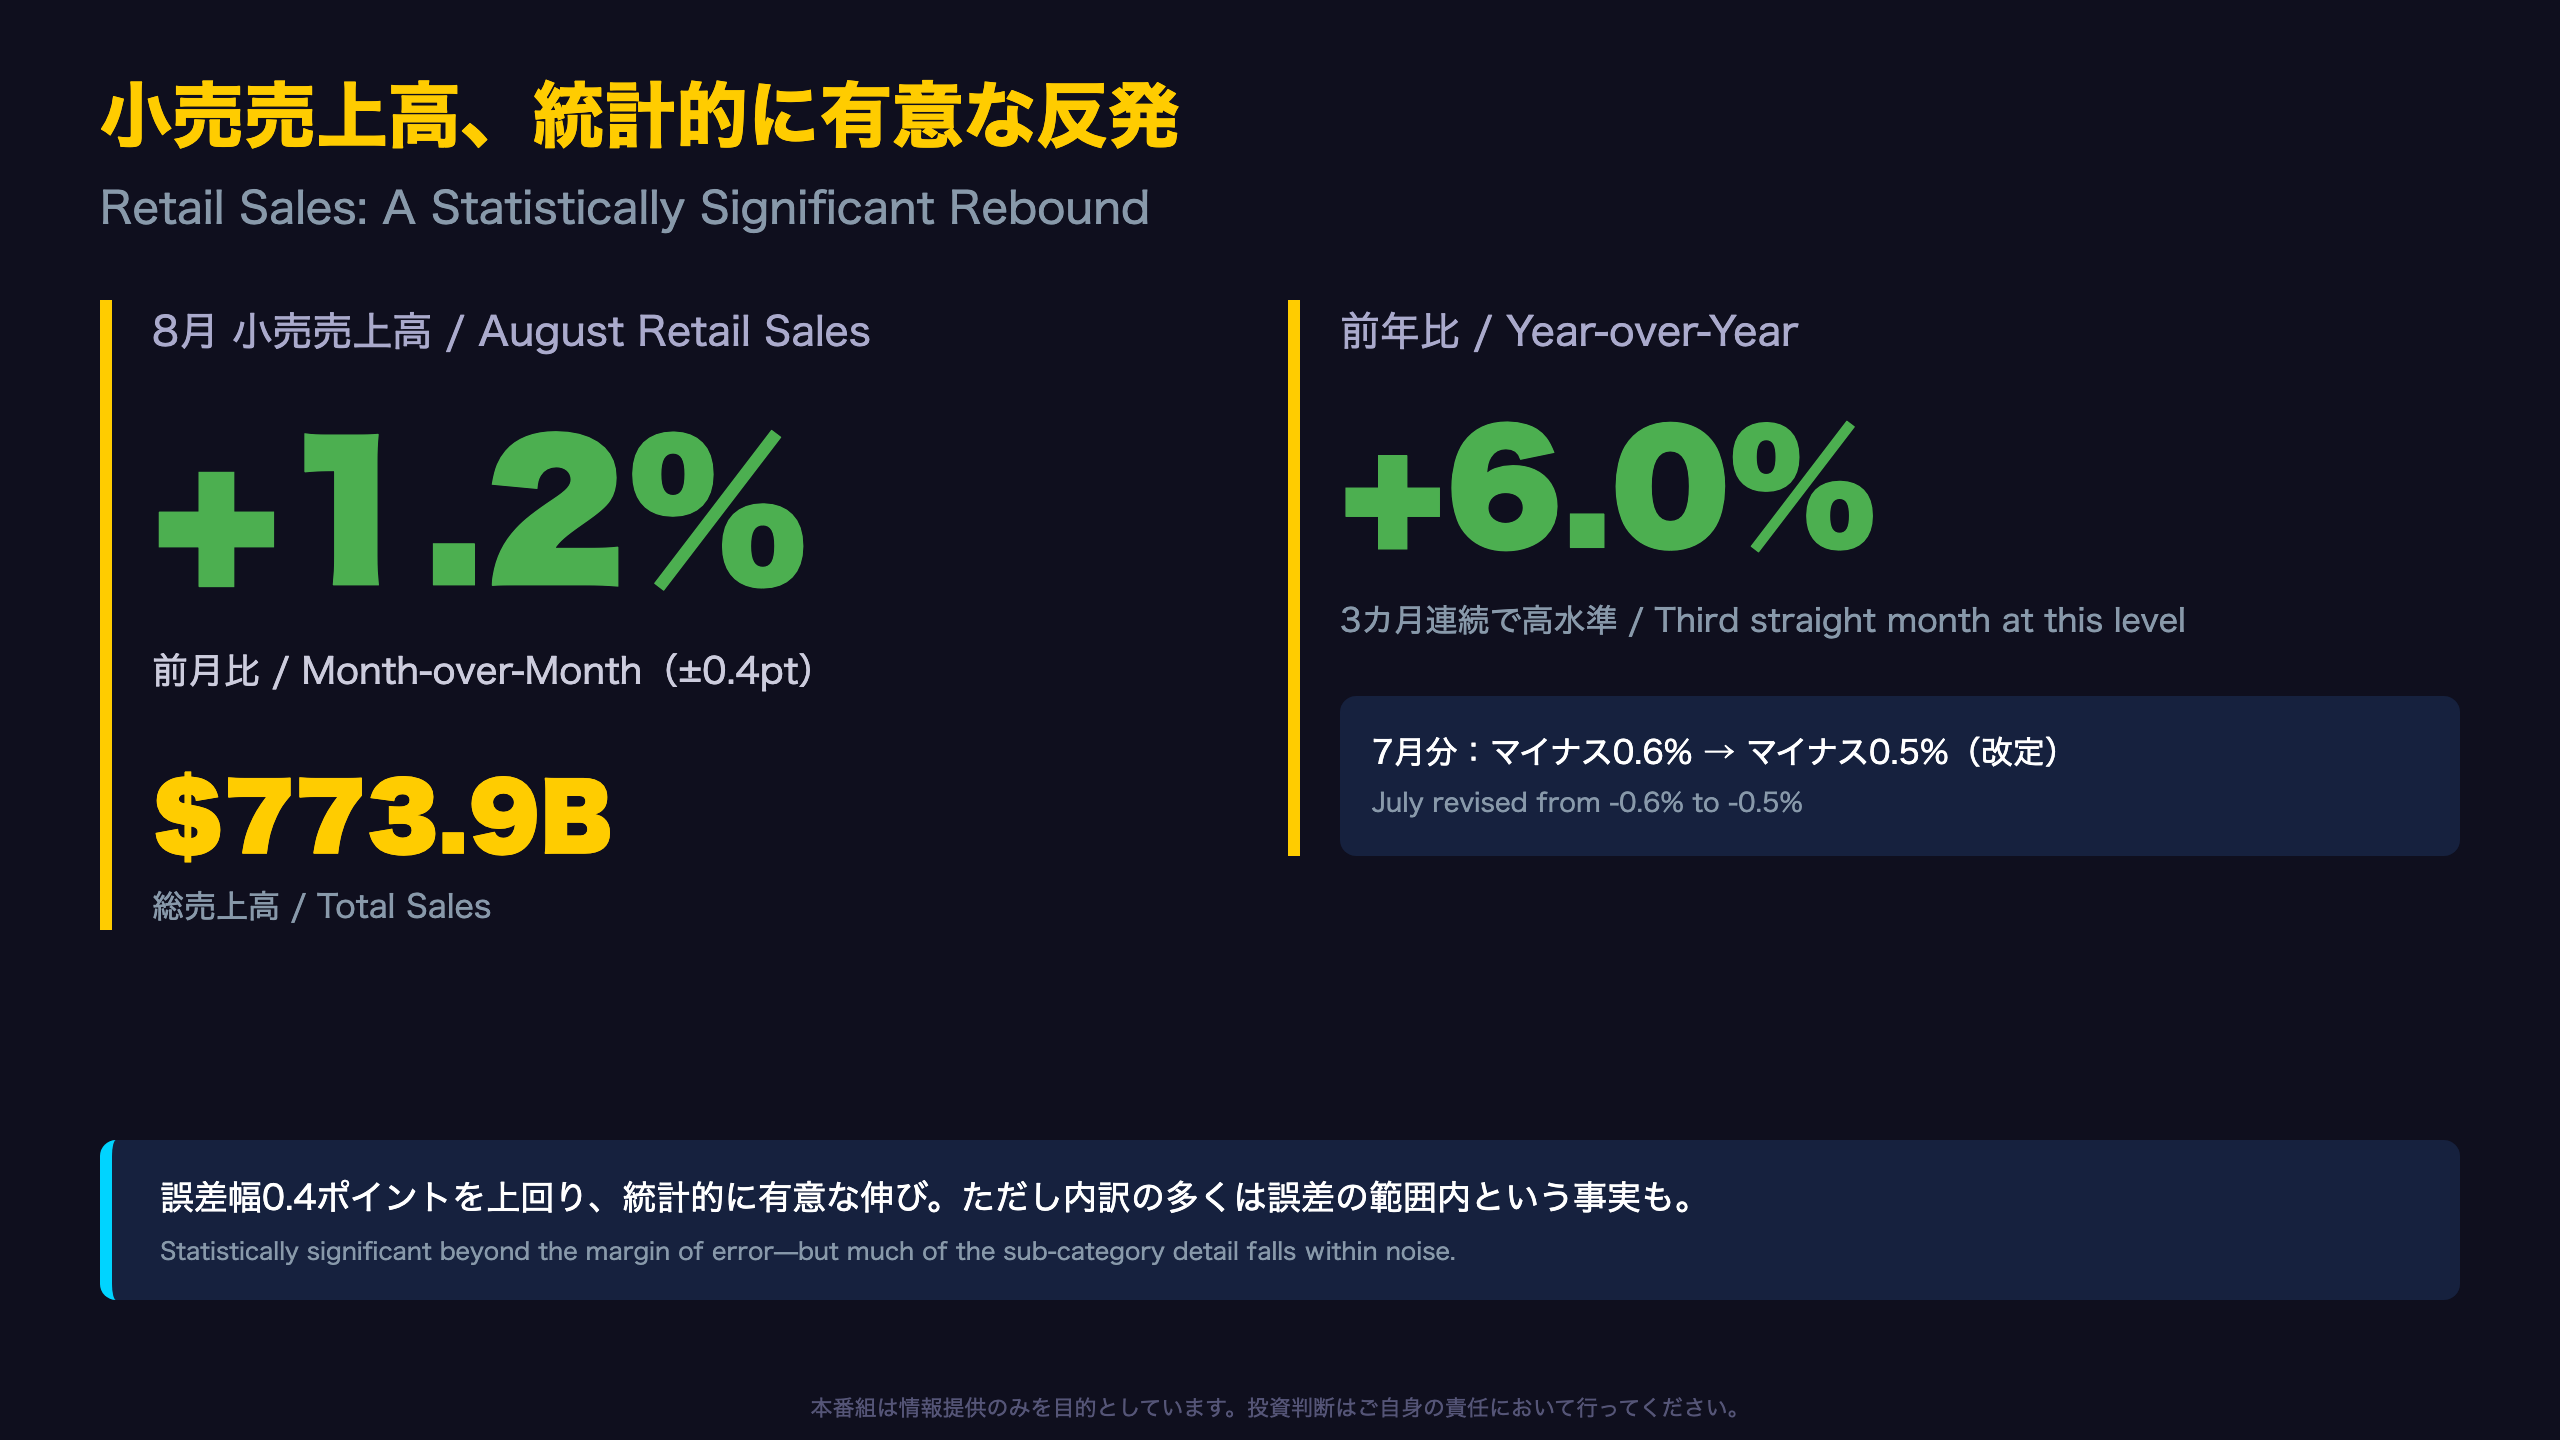
The US Census Bureau’s August retail sales report showed a statistically significant 1.2% month-over-month gain and 6.0% year-over-year growth, beating the survey’s margin of error. 📊
Core sales (ex-autos and gas) also rose a significant 1.2%, while e-commerce (nonstore retailers) surged 9.9% YoY — signs of genuine underlying resilience. 💡
But many of the headline-grabbing categories — electronics, food services, misc retailers — actually fall within statistical noise. Auto sales grew just 2.1% YoY, department stores fell 0.8% MoM, and grocery sales were nearly flat at 0.5% YoY. ⚠️
We break down what’s real signal and what’s just sampling noise in this month’s data. 📉
小売売上高、統計的に有意な反発 / Retail Sales: A Statistically Significant Rebound
What the Headline Number Really Says
The US Census Bureau, a federal statistical agency, released its Advance Monthly Retail Trade Survey on September 16, 2026, covering August. The agency reported total retail and food services sales of $773.9 billion, up 1.2% month-over-month (±0.4 percentage points) and up 6.0% year-over-year (±0.5 points). Because the confidence interval does not include zero, this is a genuine, statistically confirmed acceleration—not noise.
Context for International Readers
Unlike the University of Michigan consumer sentiment survey or the Bureau of Labor Statistics’ CPI, the Census Bureau’s retail sales report is a nominal, not inflation-adjusted measure of consumer spending drawn from a sample of roughly 4,800 retail and food-service firms. This is comparable in spirit to the UK’s ONS Retail Sales Index or the Eurozone’s retail trade volume index, though those are typically deflated for price changes while the US series is not.
A Modest Deceleration in the 3-Month Trend
The rolling 3-month year-over-year growth rate (June–August) came in at 6.0%, down slightly from 6.3% in the prior 3-month window (May–July). This difference sits within the ±0.5% margin of error, so it cannot yet be called a trend reversal.
Revision Watch
July’s month-over-month change was revised from -0.6% to -0.5%, with the confidence interval tightening from ±0.4% to ±0.2%—a sign of improving data reliability as more complete survey responses come in.
Market Implications
For USD and US equity markets, a statistically significant upside beat in a closely watched consumer spending gauge is generally supportive of near-term growth narratives, though traders should note the report is unadjusted for prices, complicating comparisons with real GDP consumption components. The next release (September data) arrives October 15, alongside a benchmark revision on September 28 tied to the 2023-2024 Annual Integrated Economic Survey.
一進一退の3カ月 ー 反発の背景 / Three Volatile Months Behind the Rebound
Tracking Three Months of Zigzag
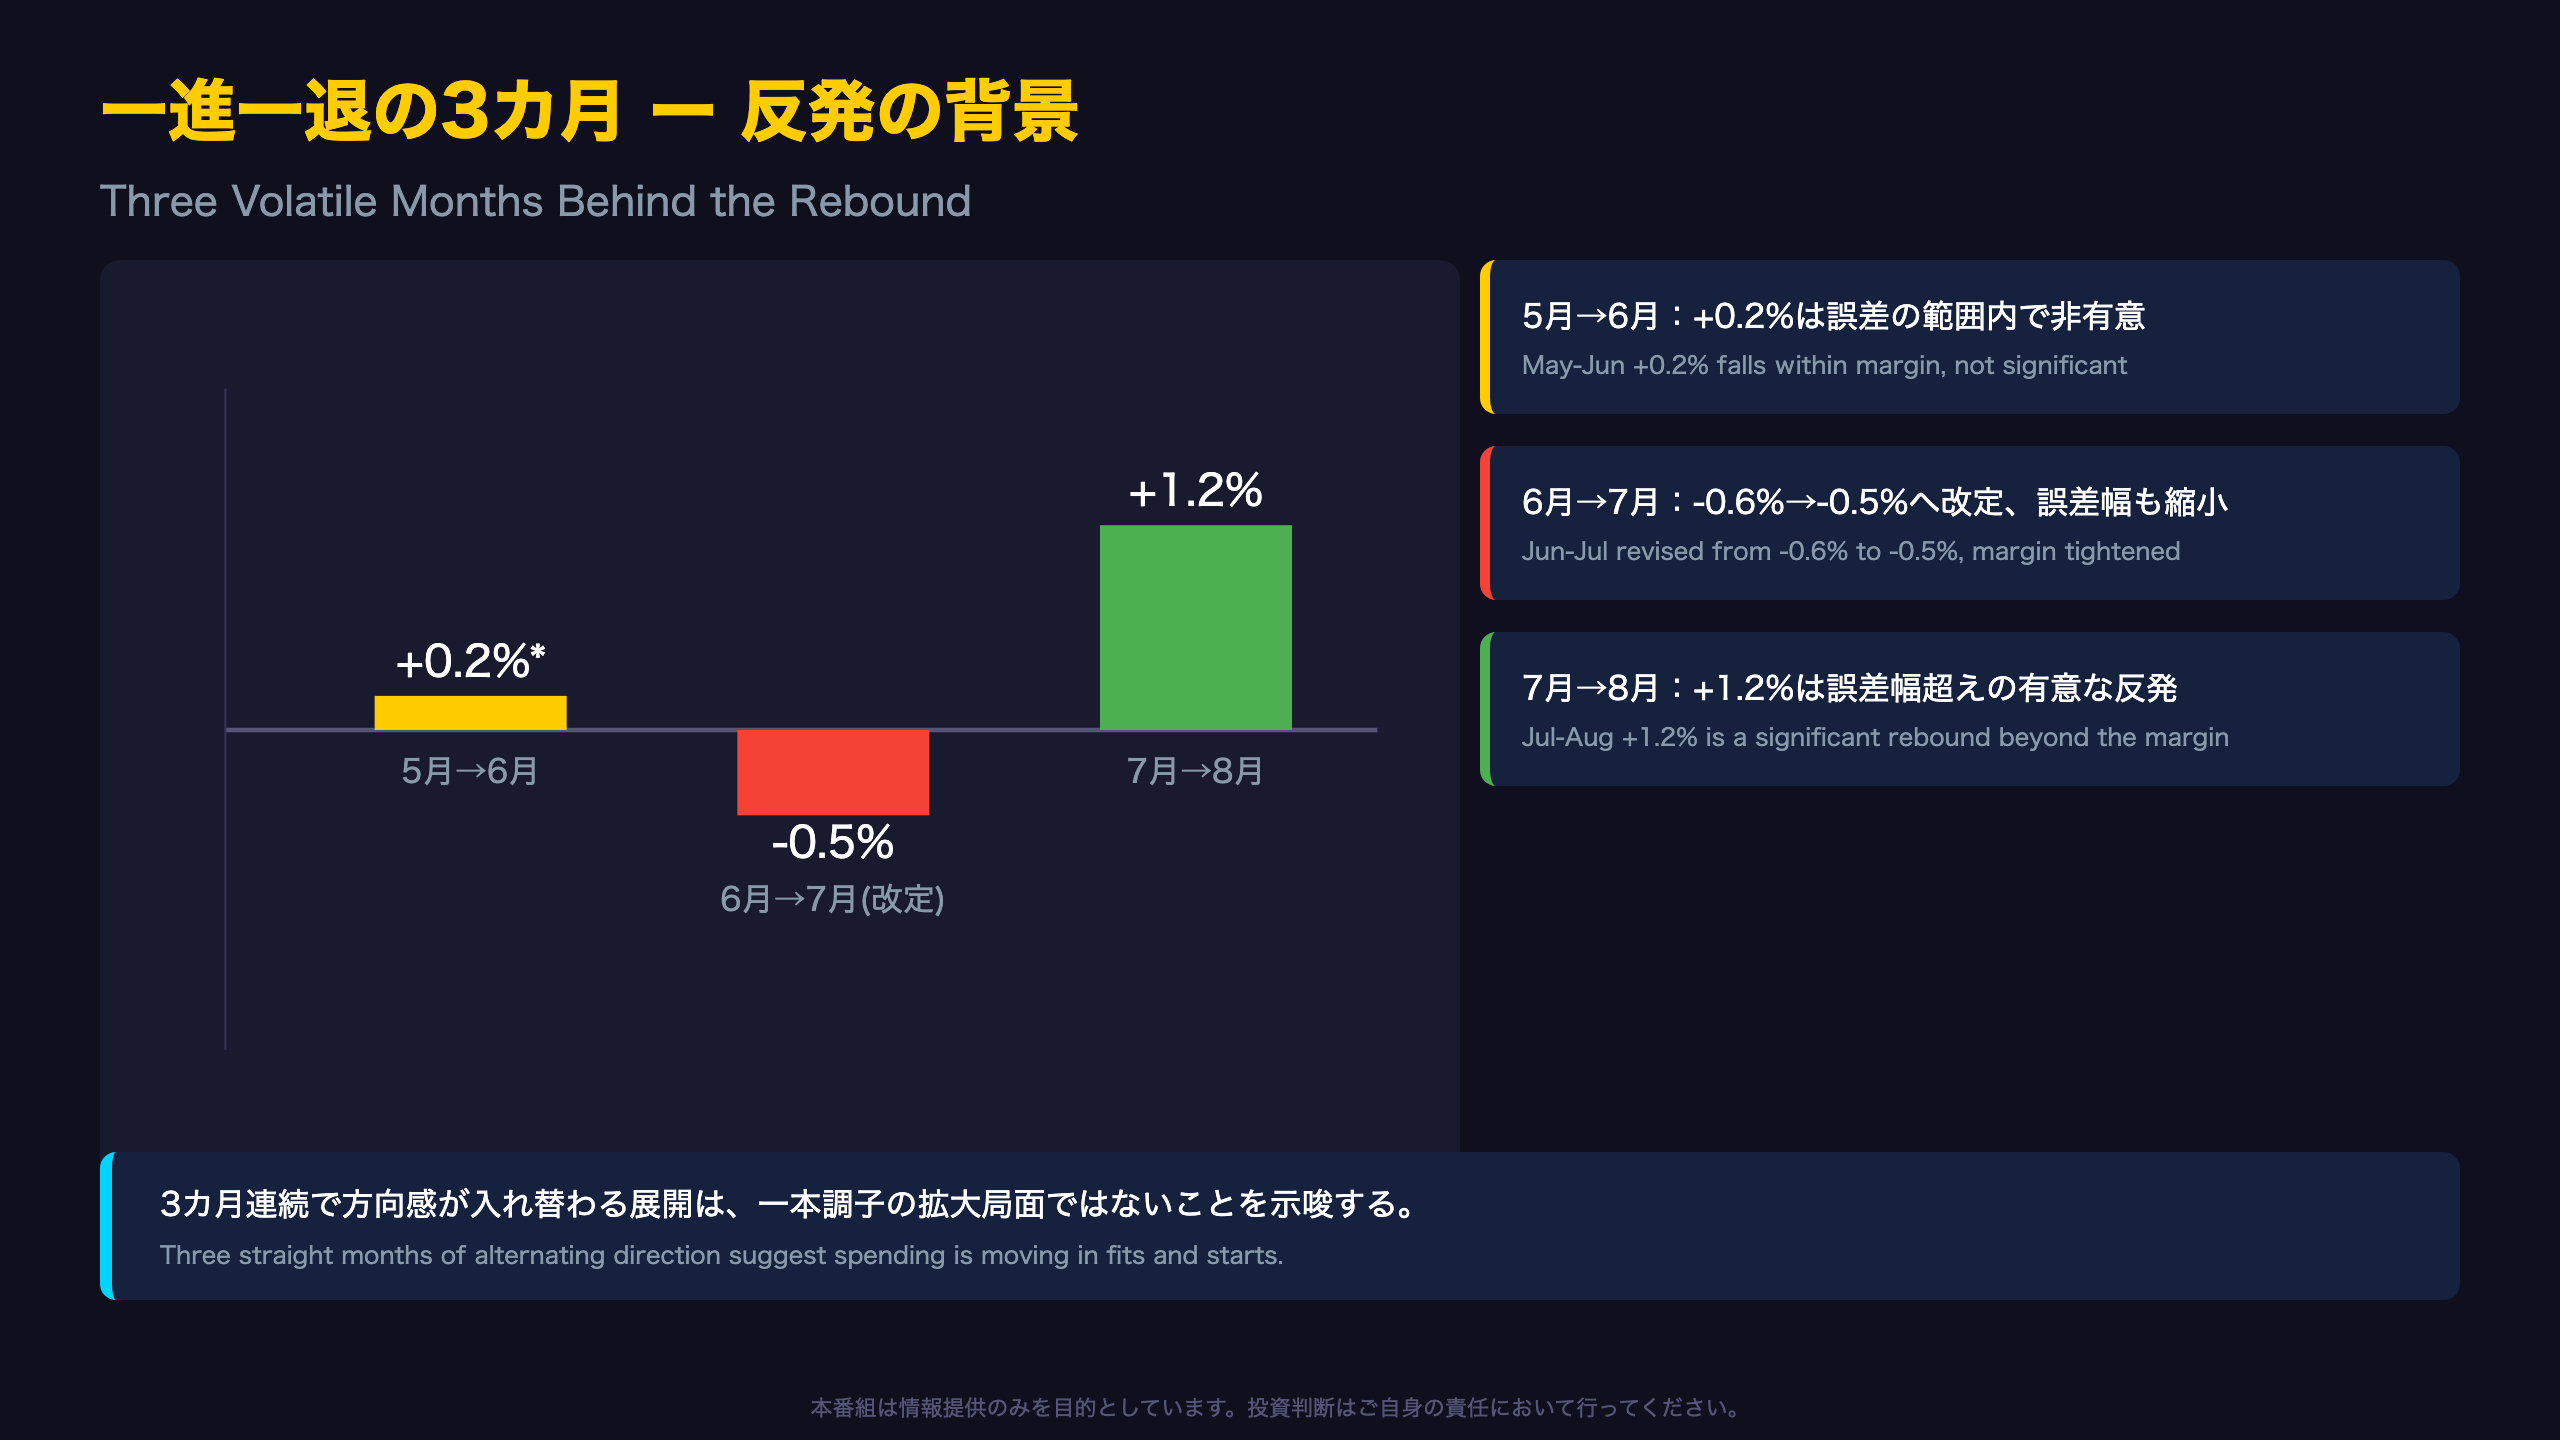
Retail sales have not moved in a straight line. Here is the month-to-month path based on the Census Bureau’s latest and previous releases:
| Period | Change | Margin | Significance |
|---|---|---|---|
| May→June | +0.2% | ±0.3% | Not significant |
| June→July (revised) | -0.5% | ±0.2% | Significant decline |
| July→August | +1.2% | ±0.4% | Significant increase |
Why the Revision Matters
The Census Bureau initially estimated the June-to-July change at -0.6% (±0.4%) in its August 14 release. In this report, it revised that figure to -0.5% with a tighter ±0.2% margin—evidence that additional survey responses improved estimate precision. Per Table 3 of the report, the median absolute revision for the headline total over the past 12 months is just 0.1 percentage point, underscoring that the Advance estimate is generally a reliable early read, even if individual months get nudged.
Two Ways to Read the Zigzag
The bearish read: two directional reversals in three months signal genuine uncertainty in the underlying spending trend—hardly the stuff of a confident, one-way growth narrative that a headline 1.2% might suggest in isolation.
The bullish read: a statistically significant decline followed by a statistically significant rebound could simply reflect a temporary July pullback (perhaps tied to seasonal categories) followed by a natural bounce-back, rather than any deeper weakening. It is too early, from a single month, to declare either narrative correct. Watch the September data, due October 15, for confirmation of which pattern holds.
底堅い消費の実像 ー 基調とEC消費 / Resilient Core: Underlying Demand & E-Commerce
Measuring Real Strength Through the “Core” Lens
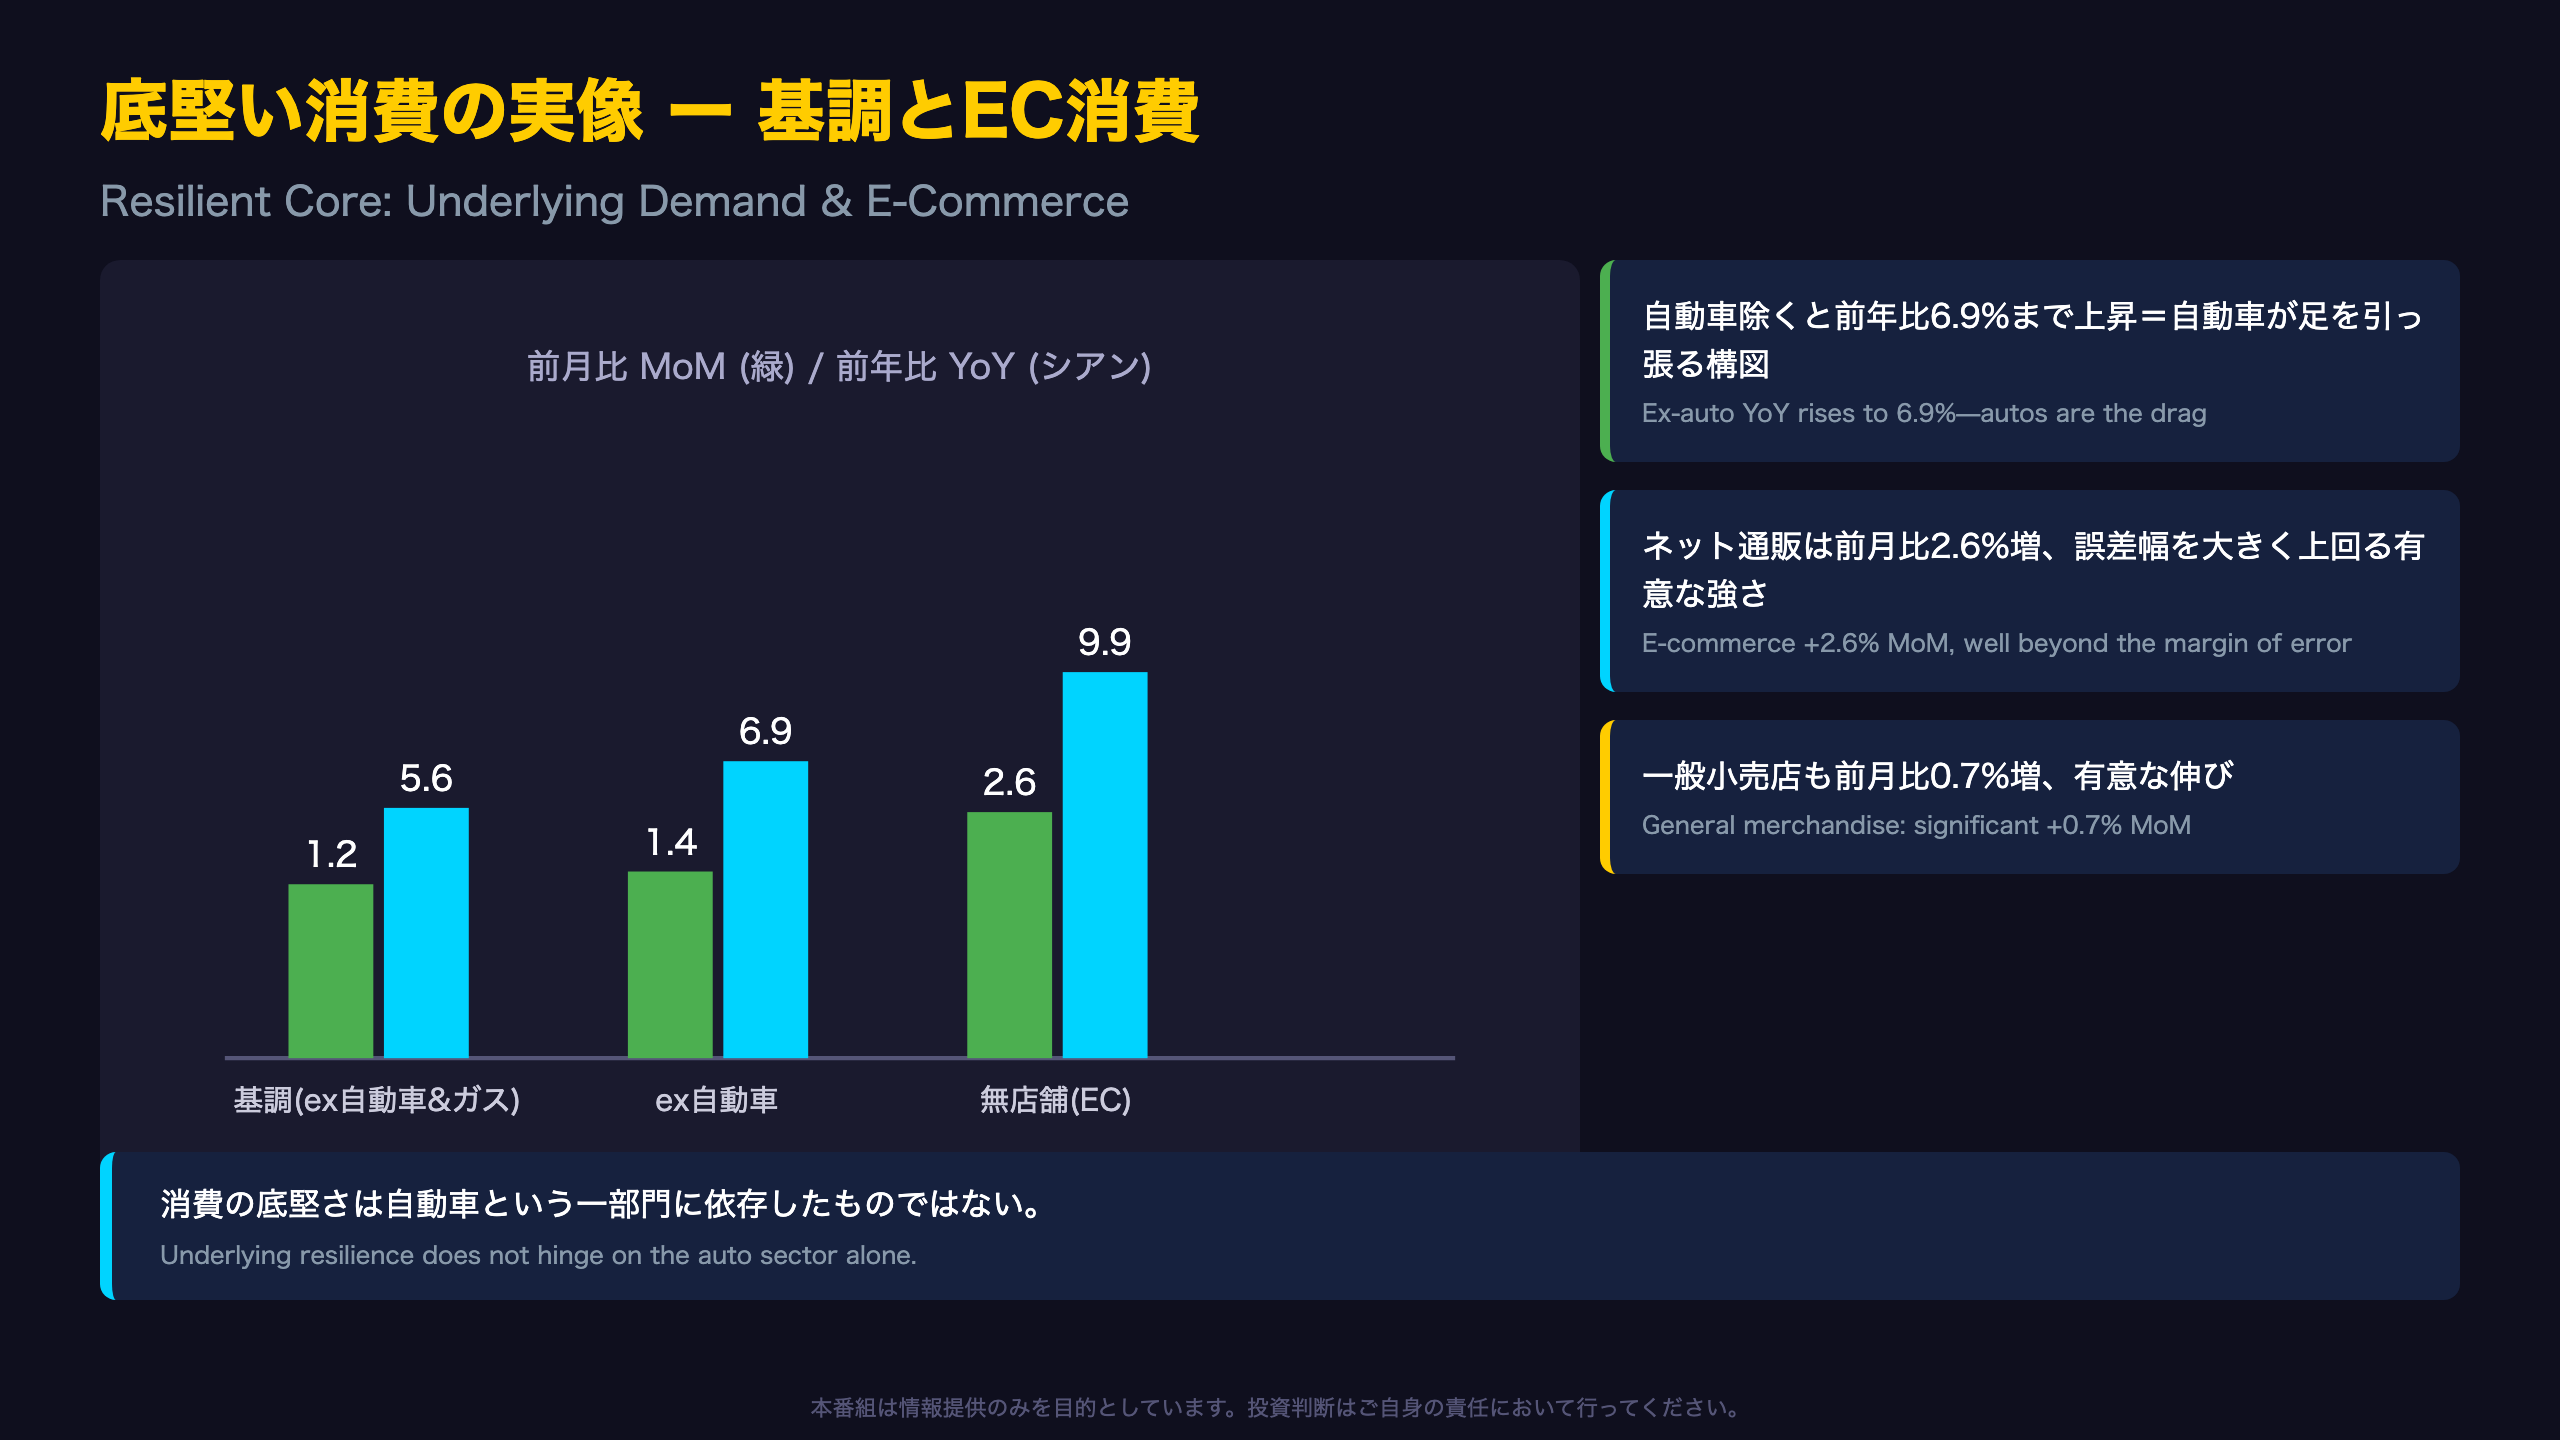
Beyond the 1.2% headline gain, the Census Bureau’s core sales measure—total retail excluding motor vehicles, parts, and gasoline stations—rose a statistically significant 1.2% month-over-month and 5.6% year-over-year. This core figure strips out two of the most volatile, price-sensitive categories, and its strength being roughly in line with the headline suggests broad-based resilience across many sectors, not just autos or fuel.
Autos Are Actually a Drag
A notable finding: the “ex-autos” measure (excluding just motor vehicles and parts) posted 6.9% year-over-year growth—higher than the 6.0% headline. That gap reveals the auto sector is dragging the overall number down. Auto and other motor vehicle dealers grew just 2.1% year-over-year, corroborating this drag (more in Slide 4).
E-Commerce: A Genuinely Confirmed Trend
Nonstore retailers—the category that captures most e-commerce activity—rose a significant 2.6% month-over-month and 9.9% year-over-year. Using the report’s own median standard error of 0.3 for this category, the 90% confidence margin is roughly ±0.53 points, meaning the 2.6% gain comfortably clears the noise threshold. For international investors familiar with the divergence between US e-commerce penetration and, say, eurozone online retail growth, this is one of the report’s clearest, most defensible signals of structural consumer behavior shift toward digital channels.
An Alternative Read on General Merchandise
General merchandise stores—a category including big-box and warehouse-club retailers—posted a significant 0.7% monthly gain. However, given this category’s broad mix of goods, the increase could reflect pricing dynamics or assortment shifts as much as pure demand strength; a single data point cannot fully disentangle the two.
隠れた脆弱性 ー 自動車・百貨店・食料品 / Hidden Cracks: Autos, Department Stores, Groceries
Reading the Weak Signals Carefully
Autos: Weaker Than the Headline Suggests
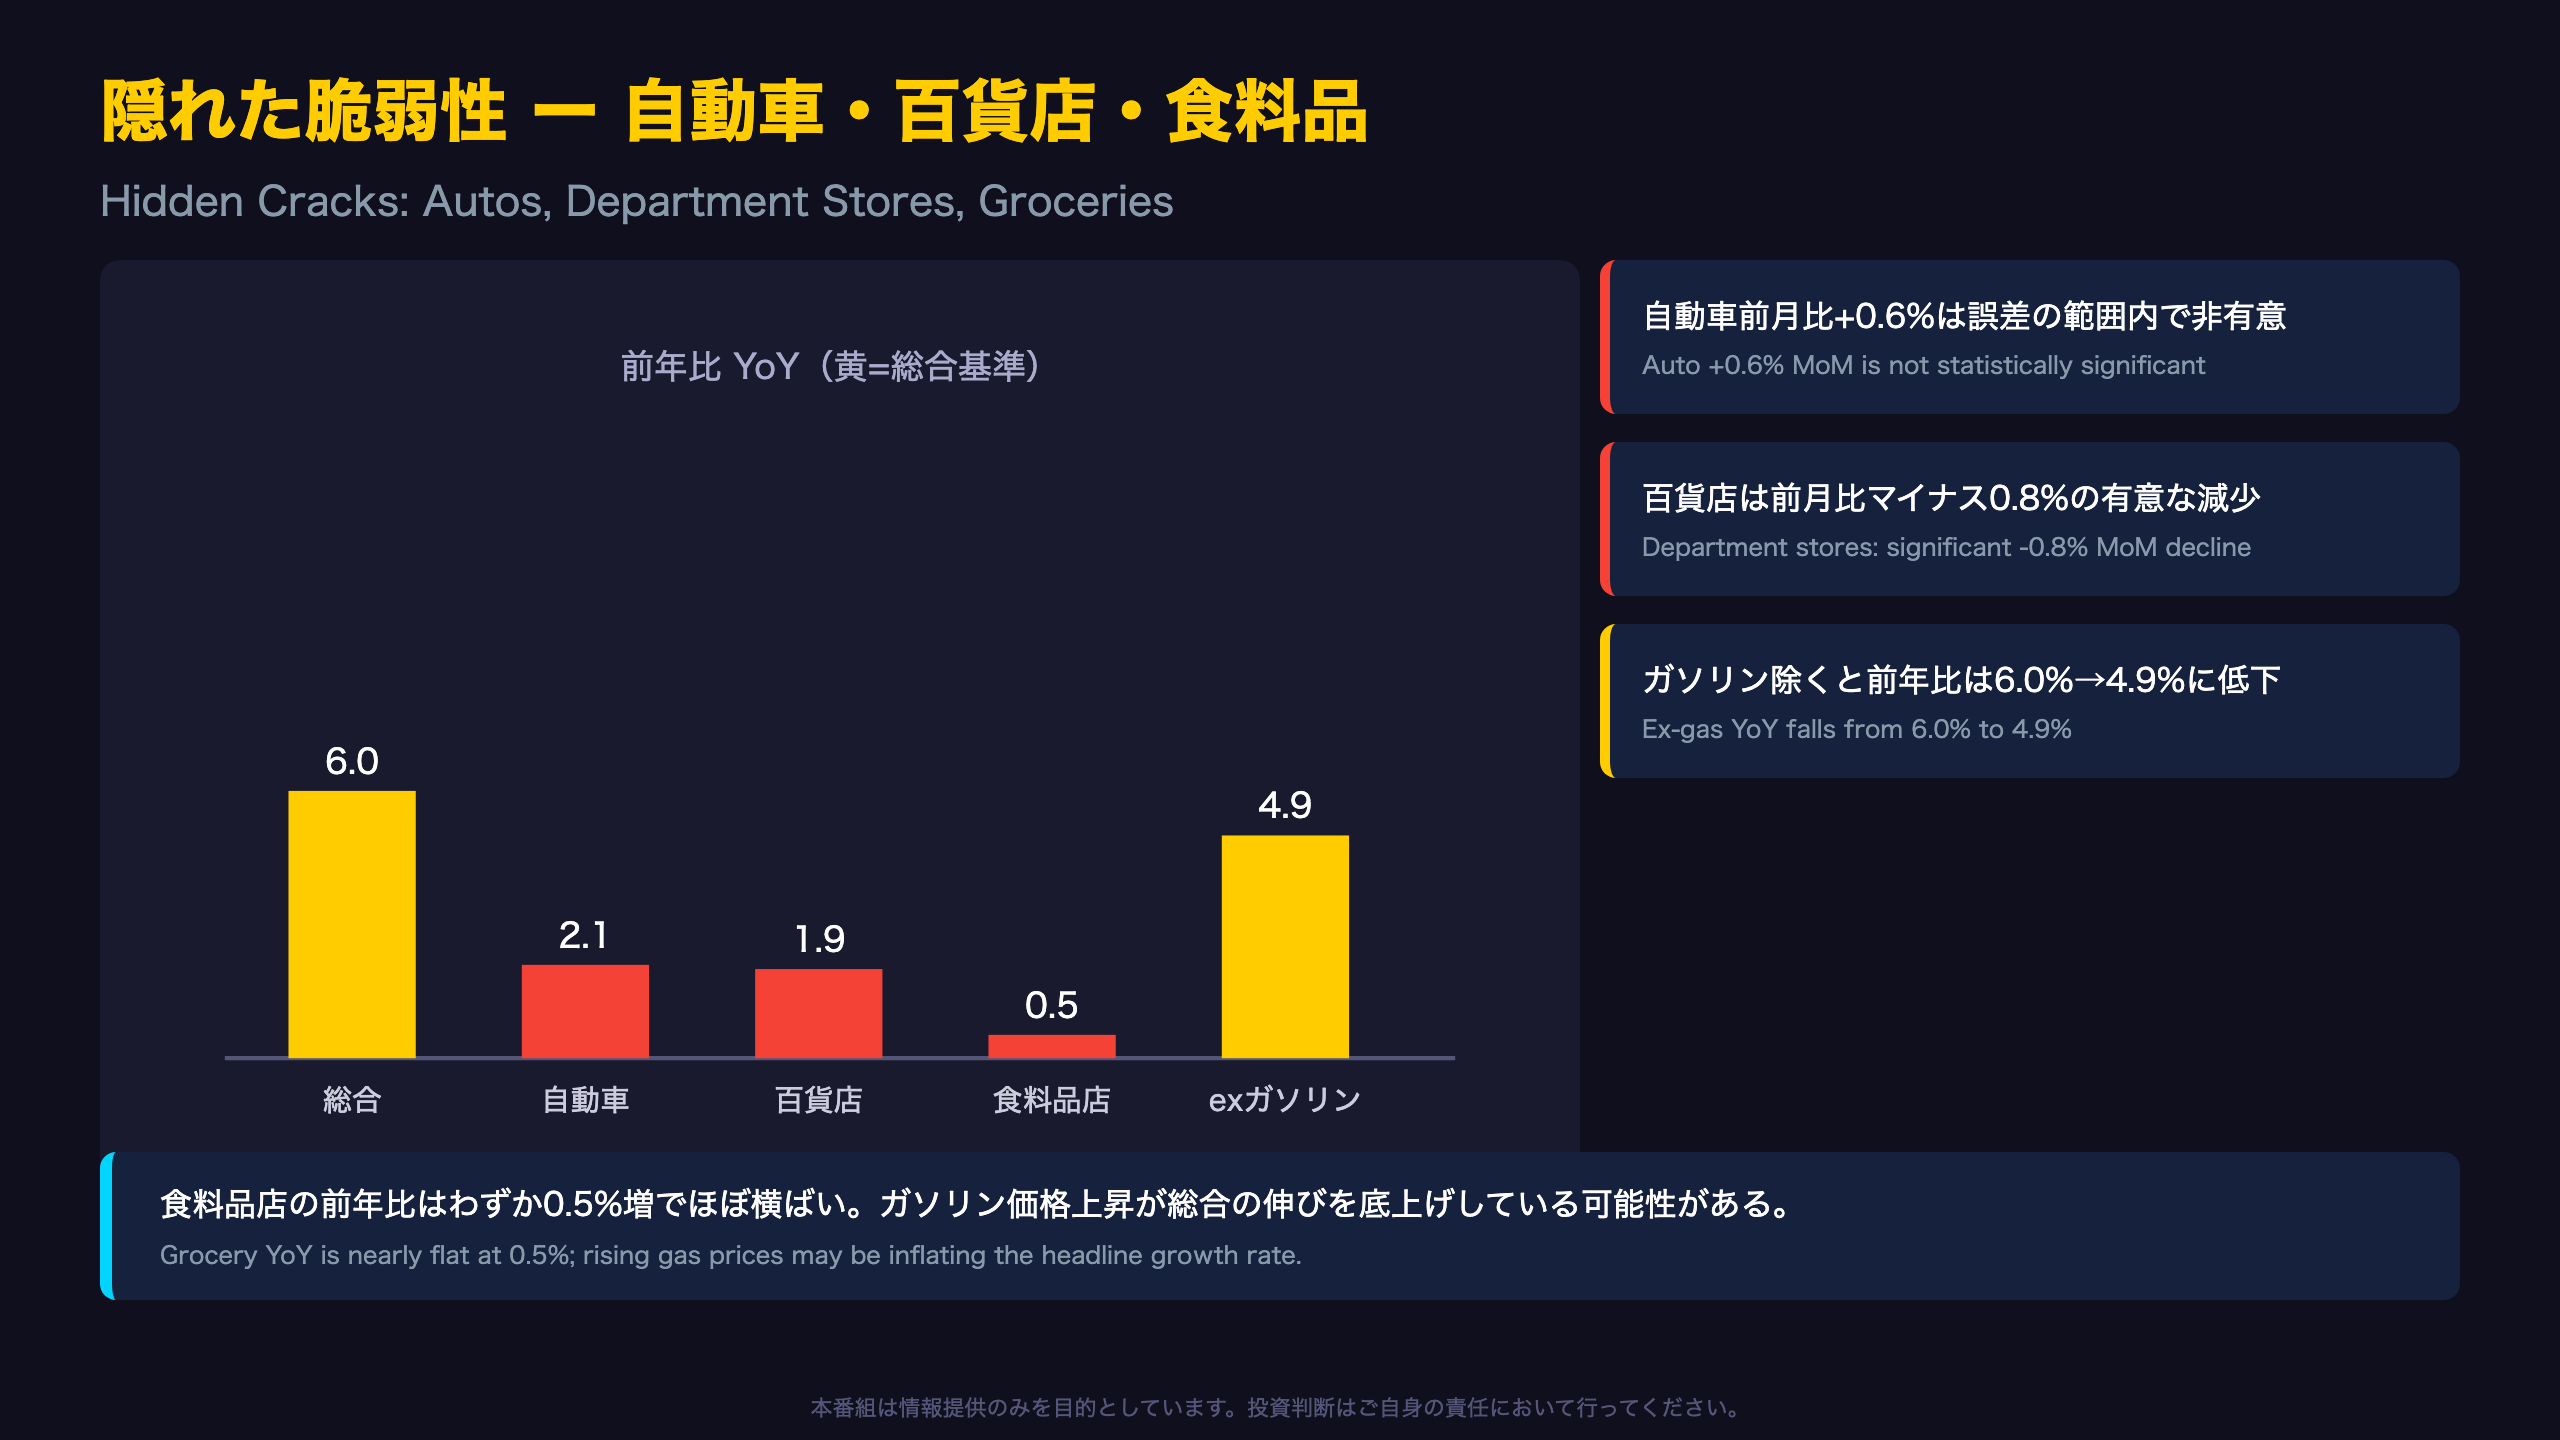
Auto and other motor vehicle dealers posted a 0.6% monthly gain, but using the report’s median standard error of 0.7 for this category, the 90% confidence margin is roughly ±1.23 points. That means the 0.6% figure sits comfortably within a range that includes zero—statistically, it cannot be distinguished from no change at all. Year-over-year growth of just 2.1% also lags far behind the 6.0% headline, reinforcing the picture of a lagging sector.
Department Stores: Structural Softness Persists
Department stores fell 0.8% month-over-month. Given this category’s near-zero historical standard error in Table 3, this decline is statistically meaningful. Annual growth of just 1.9% also trails most other retail categories—a pattern that will be familiar to US equity investors tracking legacy brick-and-mortar retailers against e-commerce peers.
Grocery Stores: What Does “Flat” Really Mean?
Grocery store sales rose just 0.5% year-over-year. With a tight standard error of 0.1 (a roughly ±0.18-point margin), this small gain is technically statistically significant, but in practical terms, nominal grocery spending was essentially unchanged from a year earlier. Since the Census data is not price-adjusted, this could reflect either stable-to-falling food prices or a modest shift in consumer shopping channels—though a single month of data cannot confirm either explanation definitively.
The Gasoline Price Effect
Gasoline stations posted 21.0% year-over-year nominal growth. Comparing the headline (6.0% YoY) against the “ex-gasoline” measure (4.9% YoY) reveals a 1.1-percentage-point gap attributable to this single category. Because the report explicitly states it is “adjusted for seasonal variation… but not for price changes,” it’s impossible to fully separate how much of this surge reflects higher pump prices versus higher fuel volumes purchased—an important caveat for anyone using this headline figure as a proxy for real consumer demand strength, similar to how US CPI watchers must strip out energy components to gauge core inflation trends.
数字のフィルター ー どこまでが「ノイズ」か / Filtering the Noise: Statistical Significance Check
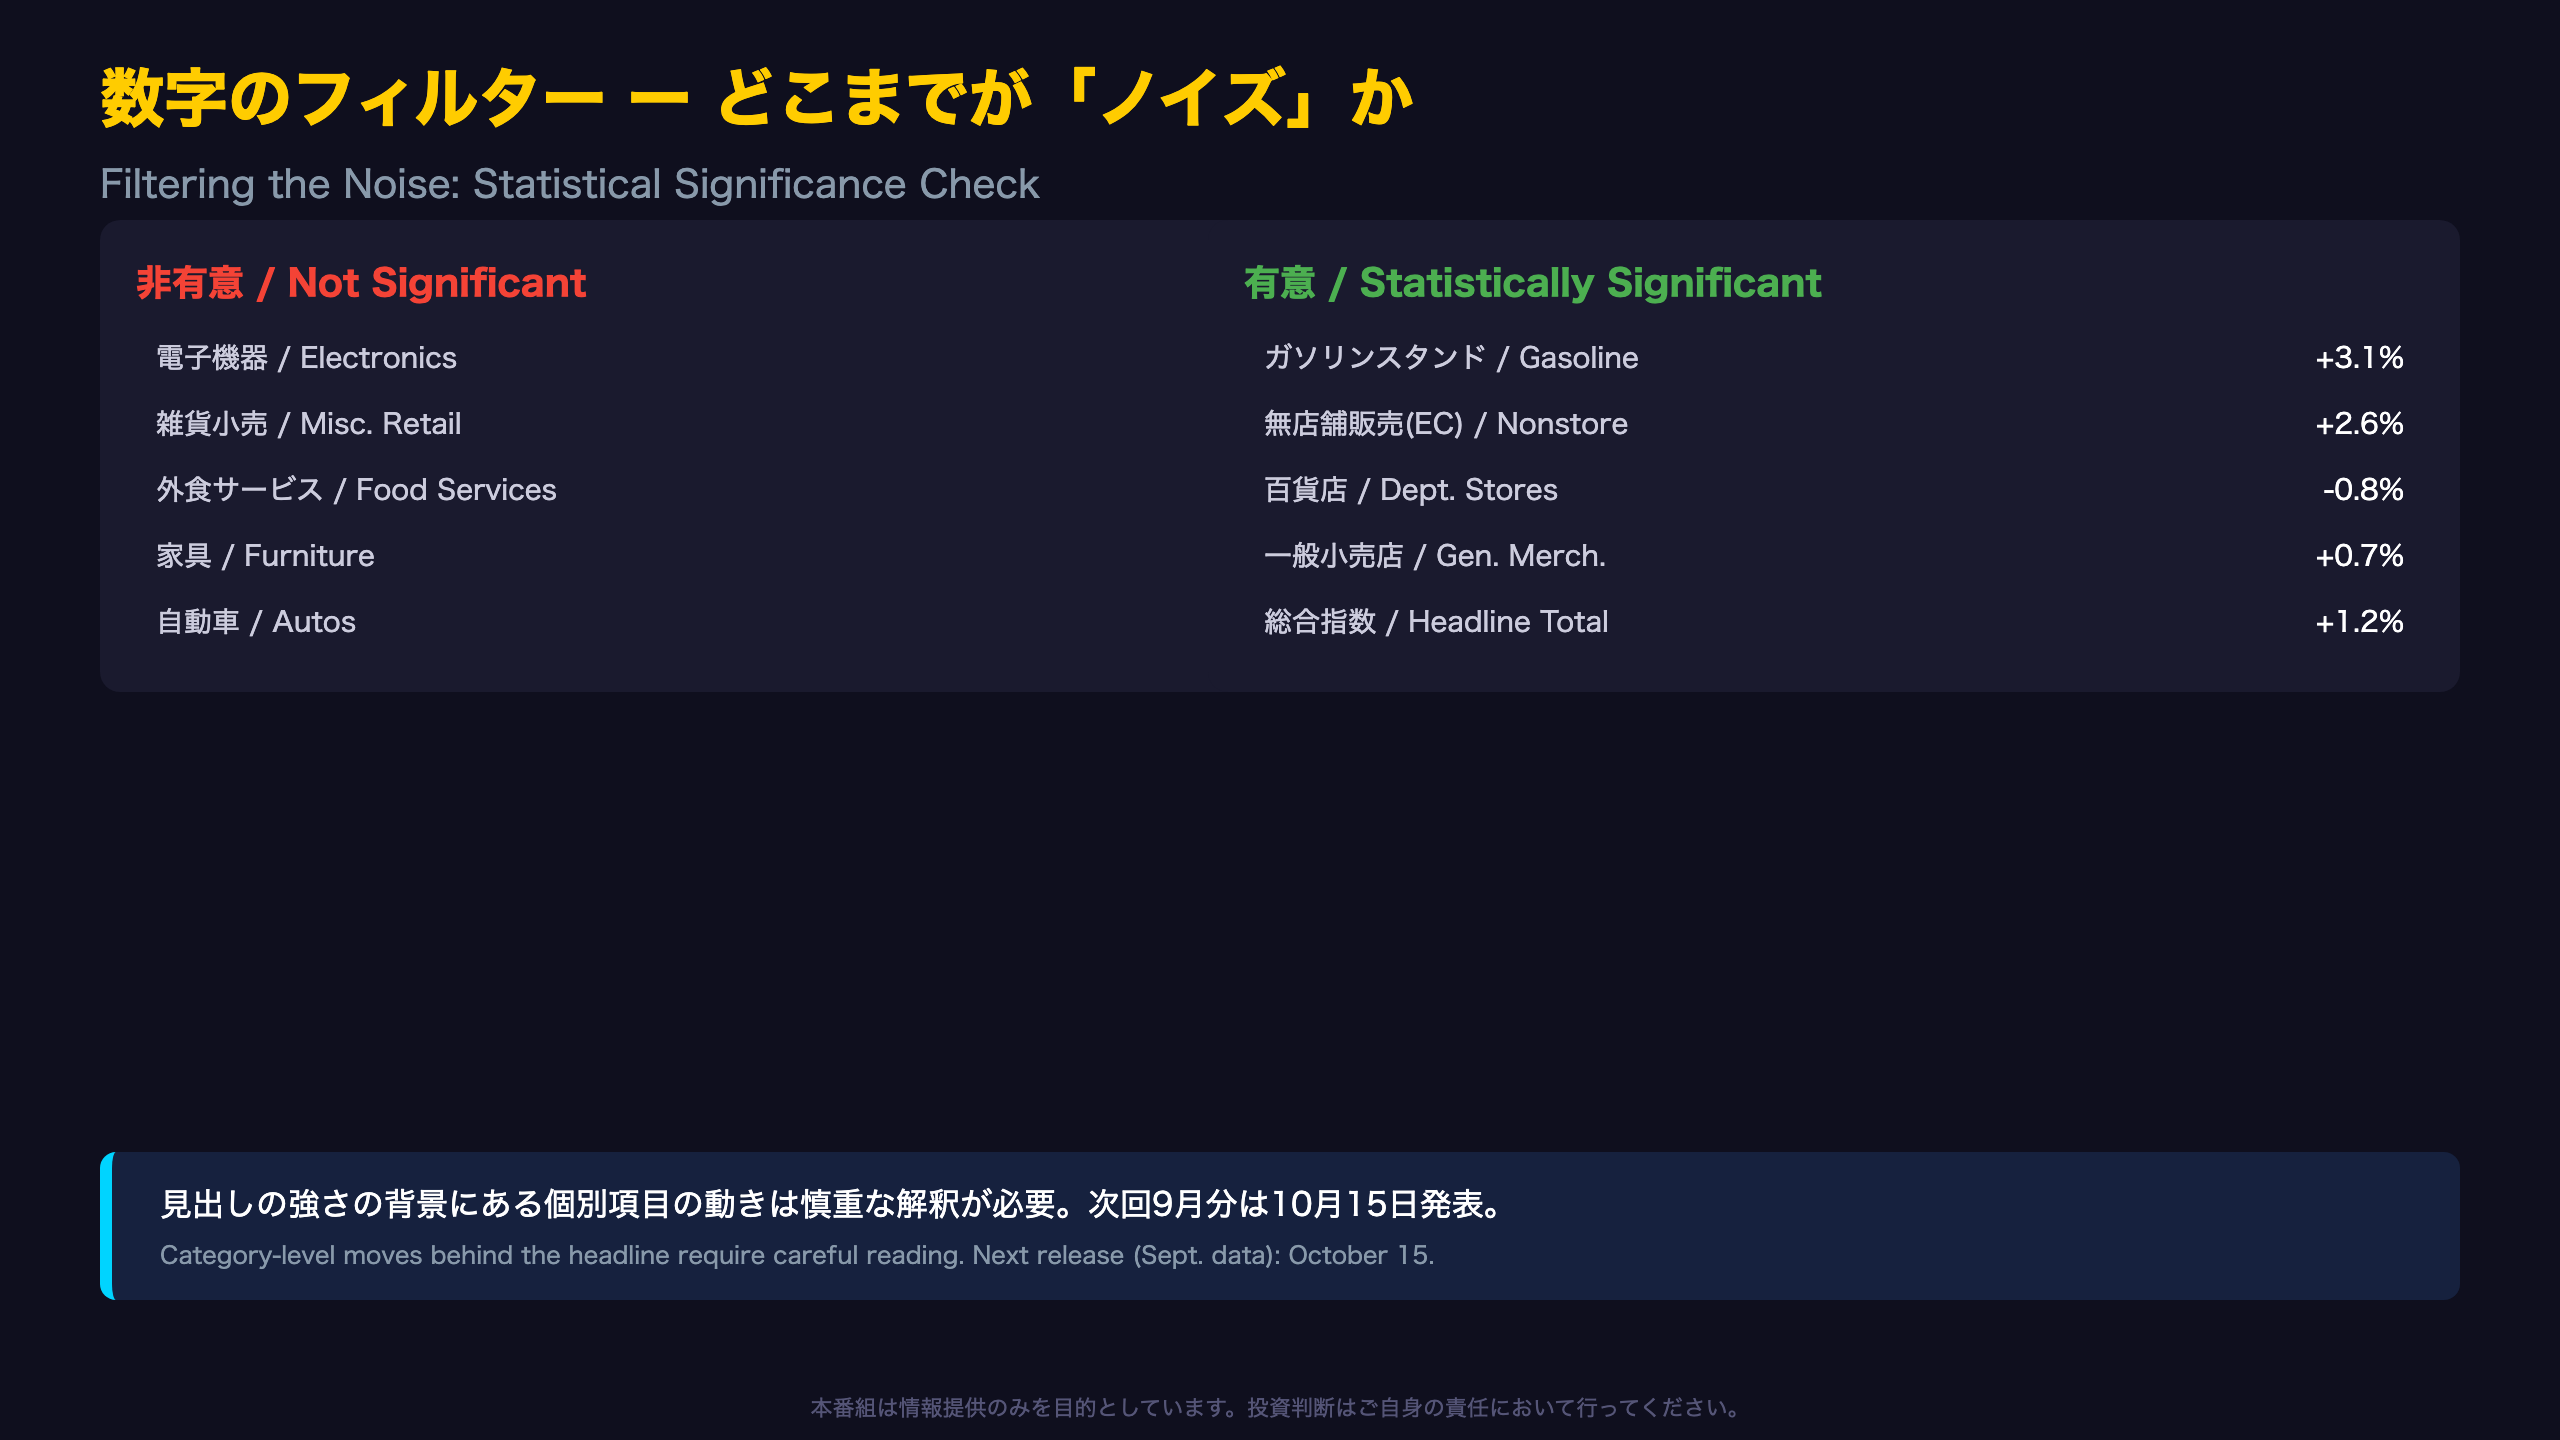
Separating Real Signal from Statistical Noise
Table 3 of the Census Bureau’s release publishes the median standard error for each retail category. Multiplying these by 1.753 (the factor for a 90% confidence interval) and comparing against August’s month-over-month changes produces a clear divide between confirmed moves and statistical noise.
Not Statistically Significant (Within Margin of Error)
- Electronics & appliance stores: +1.6% (margin ±2.1pt)
- Furniture & home furnishings: +0.9% (margin ±3.2pt)
- Miscellaneous store retailers: +1.9% (margin ±3.9pt)
- Food services & drinking places: +1.2% (margin ±1.6pt)
- Sporting goods, hobby, book stores: +1.2% (margin ±2.5pt)
- Clothing stores: +0.7% (margin ±1.8pt)
- Motor vehicle & parts dealers: +0.6% (margin ±1.2pt)
- Building materials & garden equipment: -0.2% (margin ±1.4pt)
Statistically Significant (Beyond the Margin)
- Headline total: +1.2% (margin ±0.4pt)
- Gasoline stations: +3.1% (margin ±0.7pt)
- Grocery stores: +0.5% (margin ±0.18pt)
- General merchandise stores: +0.7% (margin ±0.18pt)
- Department stores: -0.8% (margin near 0pt)
- Nonstore retailers (e-commerce): +2.6% (margin ±0.53pt)
Why This Matters for International Investors
The Advance Monthly Retail Trade Survey samples roughly 4,800 firms—far smaller than the full Monthly Retail Trade Survey universe. The report itself states plainly: “the estimates presented in this report are based on a sample survey, they contain sampling error.” This is analogous to how US nonfarm payrolls carry a standard error large enough that single-month misses often get revised significantly. The categories generating the most eye-catching headlines—electronics, food services—are, ironically, among the least statistically reliable in this particular release, a nuance that headline-driven news coverage often misses entirely.
Looking Ahead
The next release, covering September data, is scheduled for October 15. A benchmark revision incorporating the 2023-2024 Annual Integrated Economic Survey is also due September 28, meaning August’s own figures could still shift before the next Advance report arrives. The key questions for market watchers: does auto and department-store weakness persist, and does e-commerce’s confirmed strength hold up?
Disclaimer: This article is for informational purposes only. All investment decisions are made solely at your own risk.