📺 Watch the Full Video Analysis
This article was automatically generated by the NFC Market Live AI analysis system. (Updated: 2026-09-12 02:15 JST)
📄 Primary Source
University of Michigan
http://www.sca.isr.umich.edu/
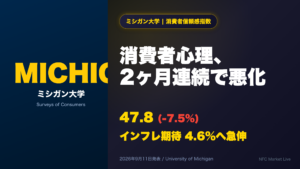
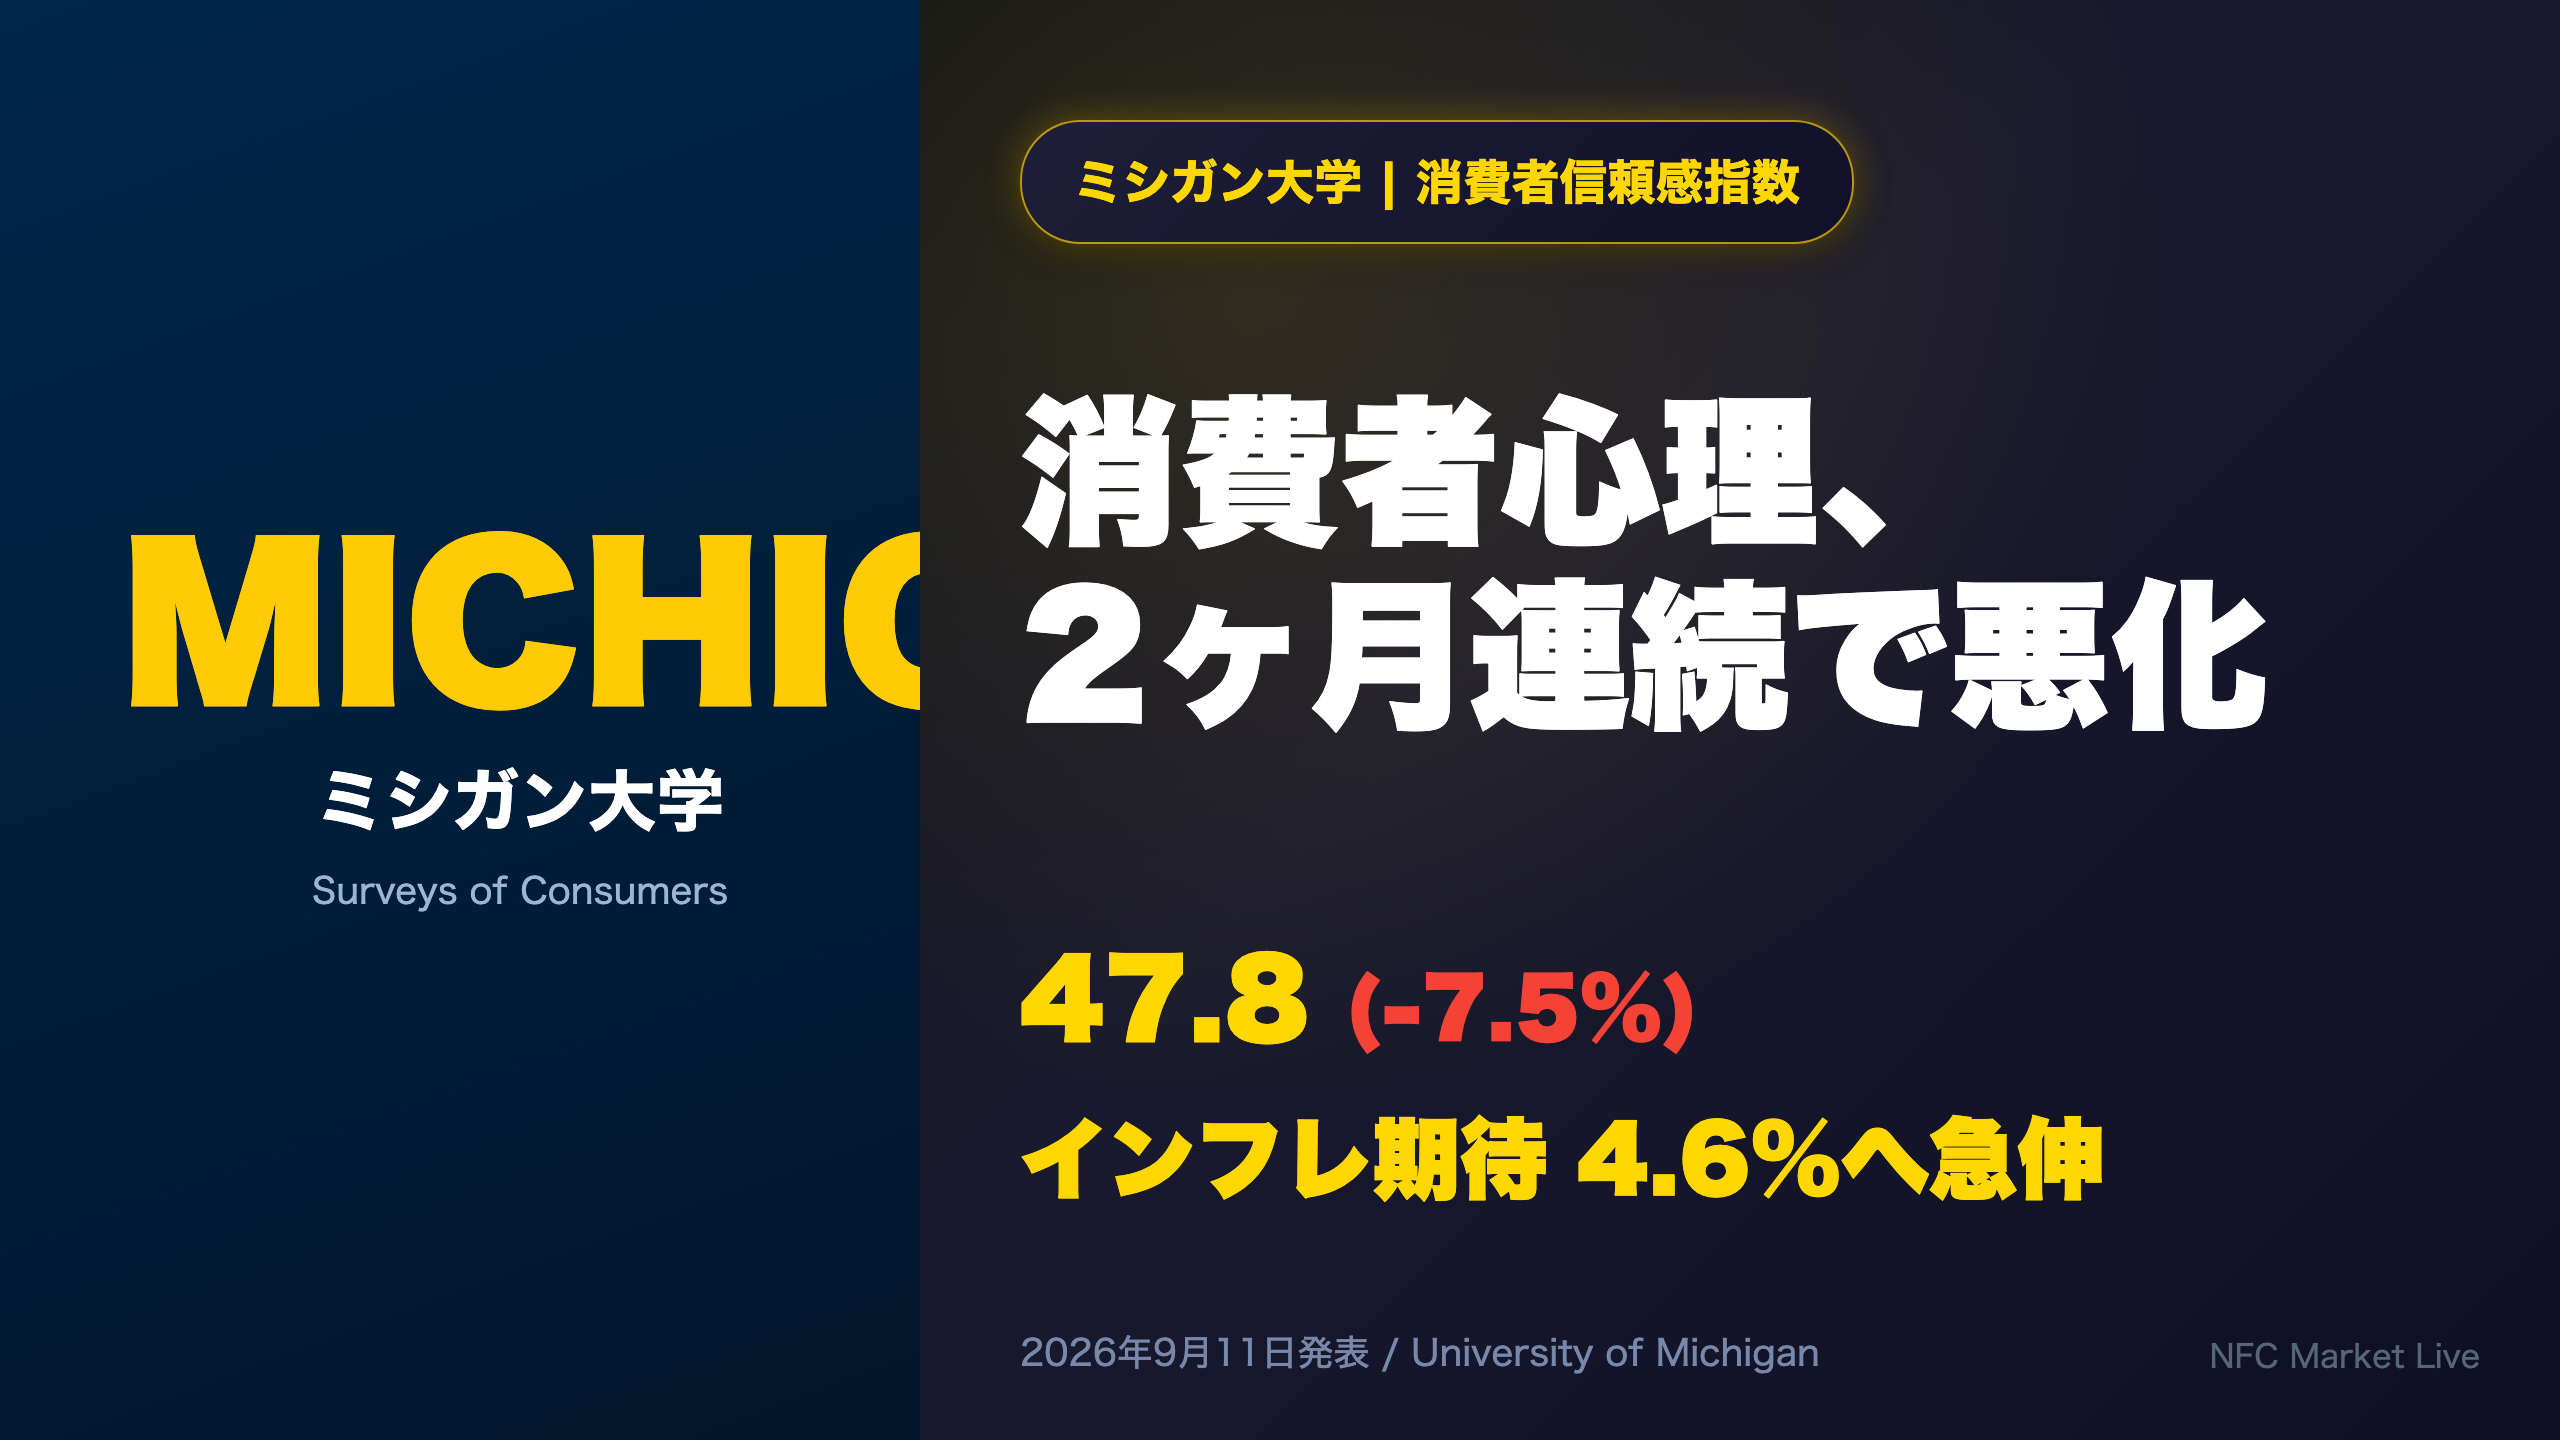
📊 The University of Michigan’s preliminary September reading fell to 47.8, down 7.5% from August — a second straight monthly decline.
📉 Current conditions barely moved, but the Expectations Index plunged 11.1%. Households are more worried about the future than the present.
🔥 1-year inflation expectations jumped from 4.0% to 4.6%, the highest since June.
⚠️ Weakening sentiment paired with rising inflation expectations complicates the Fed’s policy path. Final September data due Sep 25.
サマリー:二重のシグナル
Summary: Two Diverging Signals
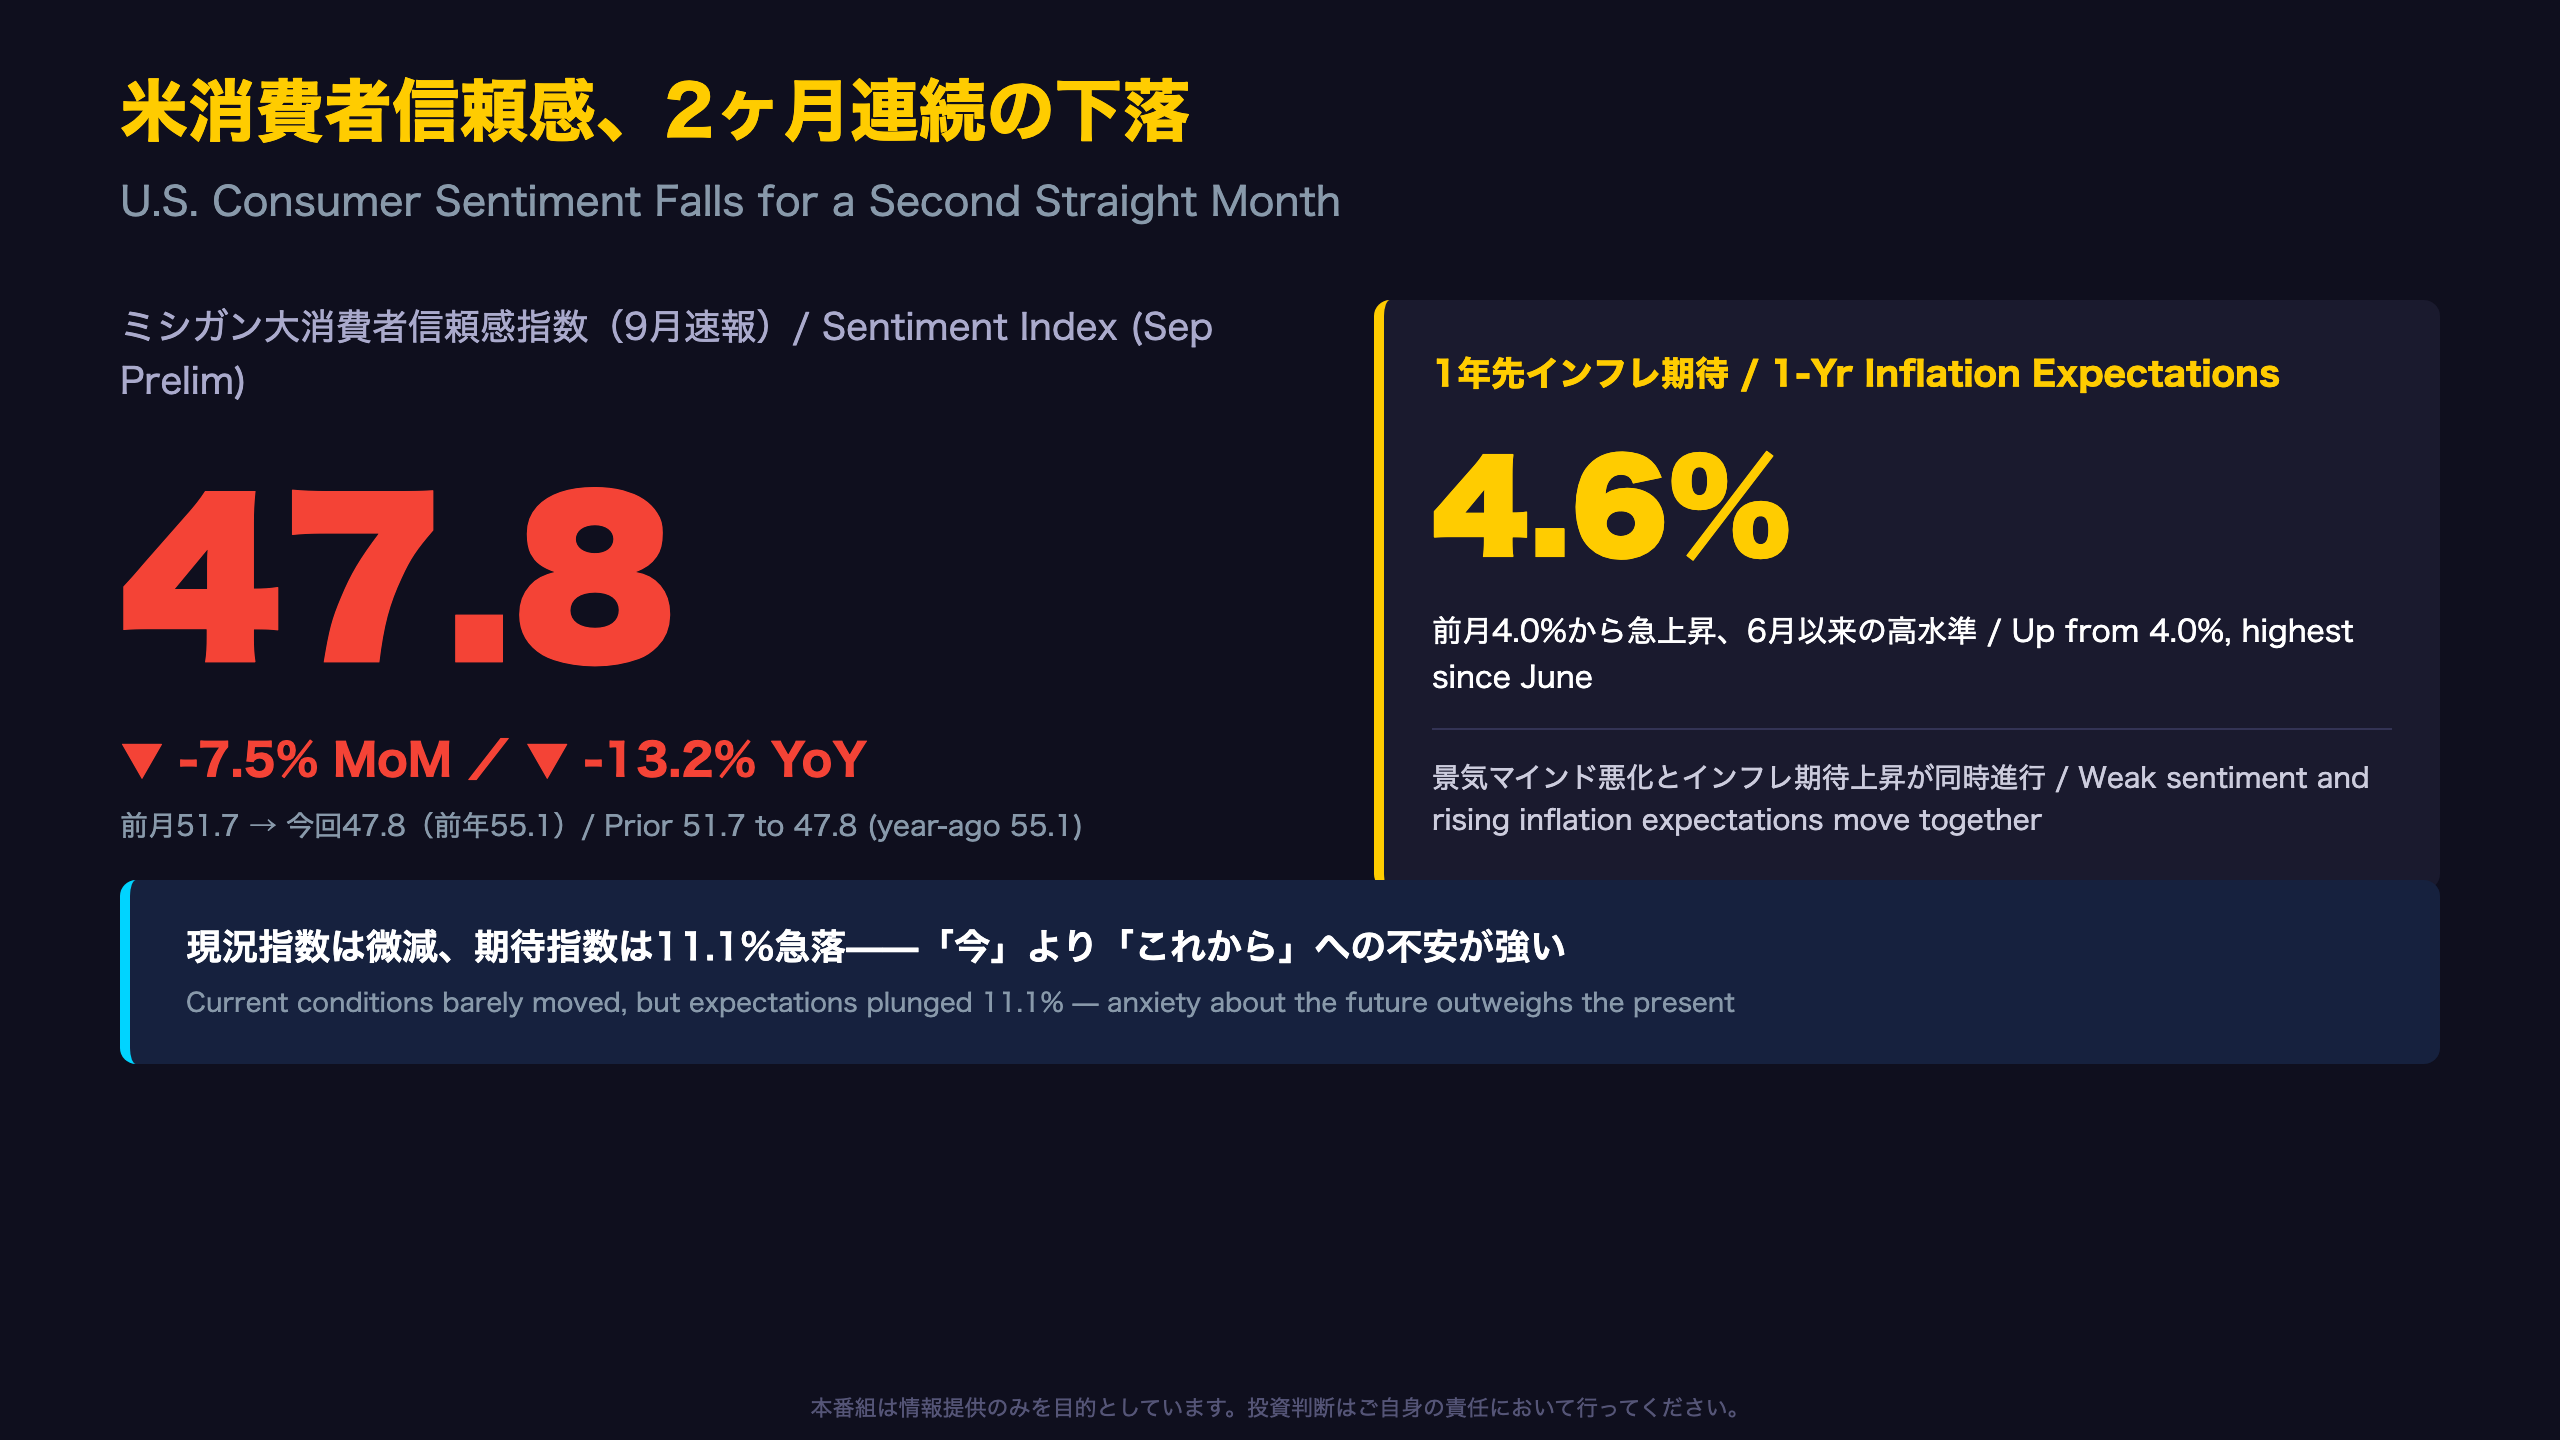
The University of Michigan’s preliminary September reading revealed two signals moving in opposite, concerning directions at once.
- Consumer Sentiment Index: 51.7 → 47.8 (-7.5% MoM, -13.2% YoY)
- 1-Year Inflation Expectations: 4.0% → 4.6% (highest since June)
“Consumer sentiment receded less than 4 index points for the second consecutive month of decreases,” said Survey Director Joanne Hsu.
For readers unfamiliar with this survey: the University of Michigan Consumer Sentiment Index is one of the longest-running U.S. consumer confidence gauges, closely watched by the Federal Reserve alongside the Conference Board’s index. Michigan’s survey places heavier weight on inflation expectations, making it especially relevant during periods of price instability — unlike headline U.S. CPI, which measures realized prices rather than forward-looking beliefs.
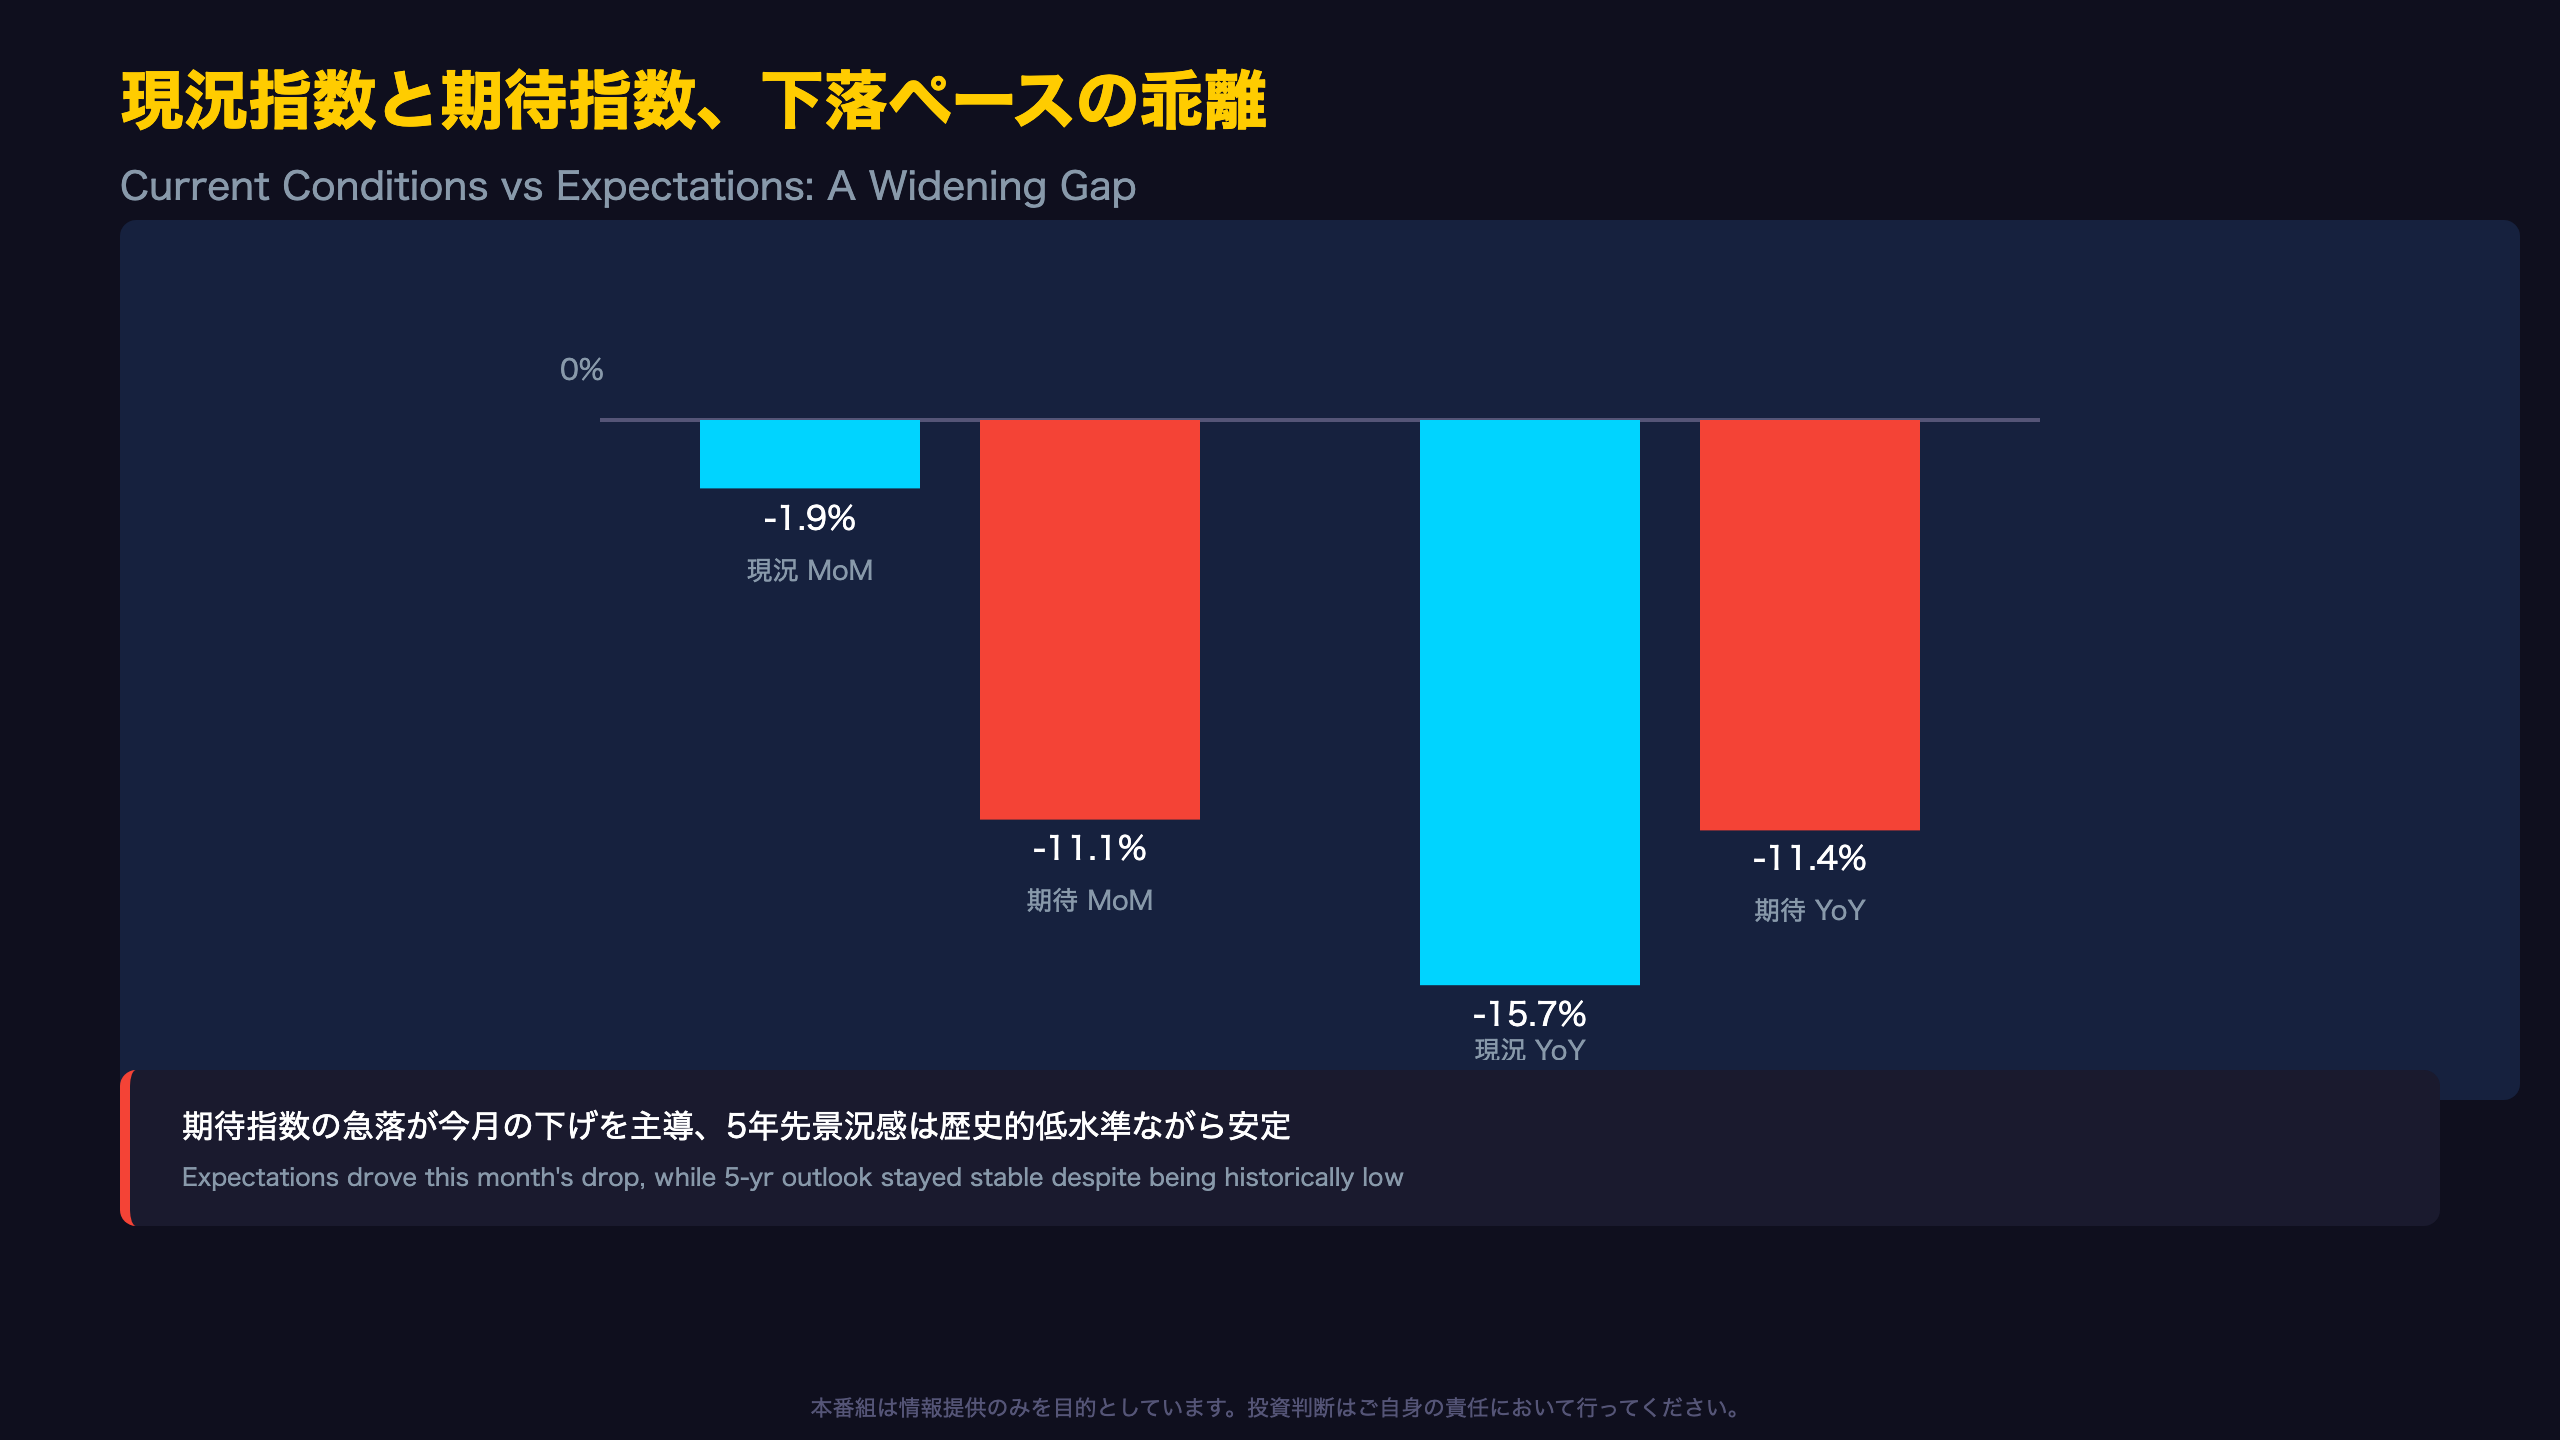
The breakdown shows the Current Conditions component barely moved (50.9, -1.9% MoM) while the Expectations component plunged (45.8, -11.1% MoM), meaning expectations are driving the overall decline. The report also notes sentiment is now “16% below February,” the month before the Iran conflict began — a reminder of how much ground has been lost this year for U.S. consumers.
24ヶ月のトレンドで見る位置づけ
Where This Reading Sits in the Trend
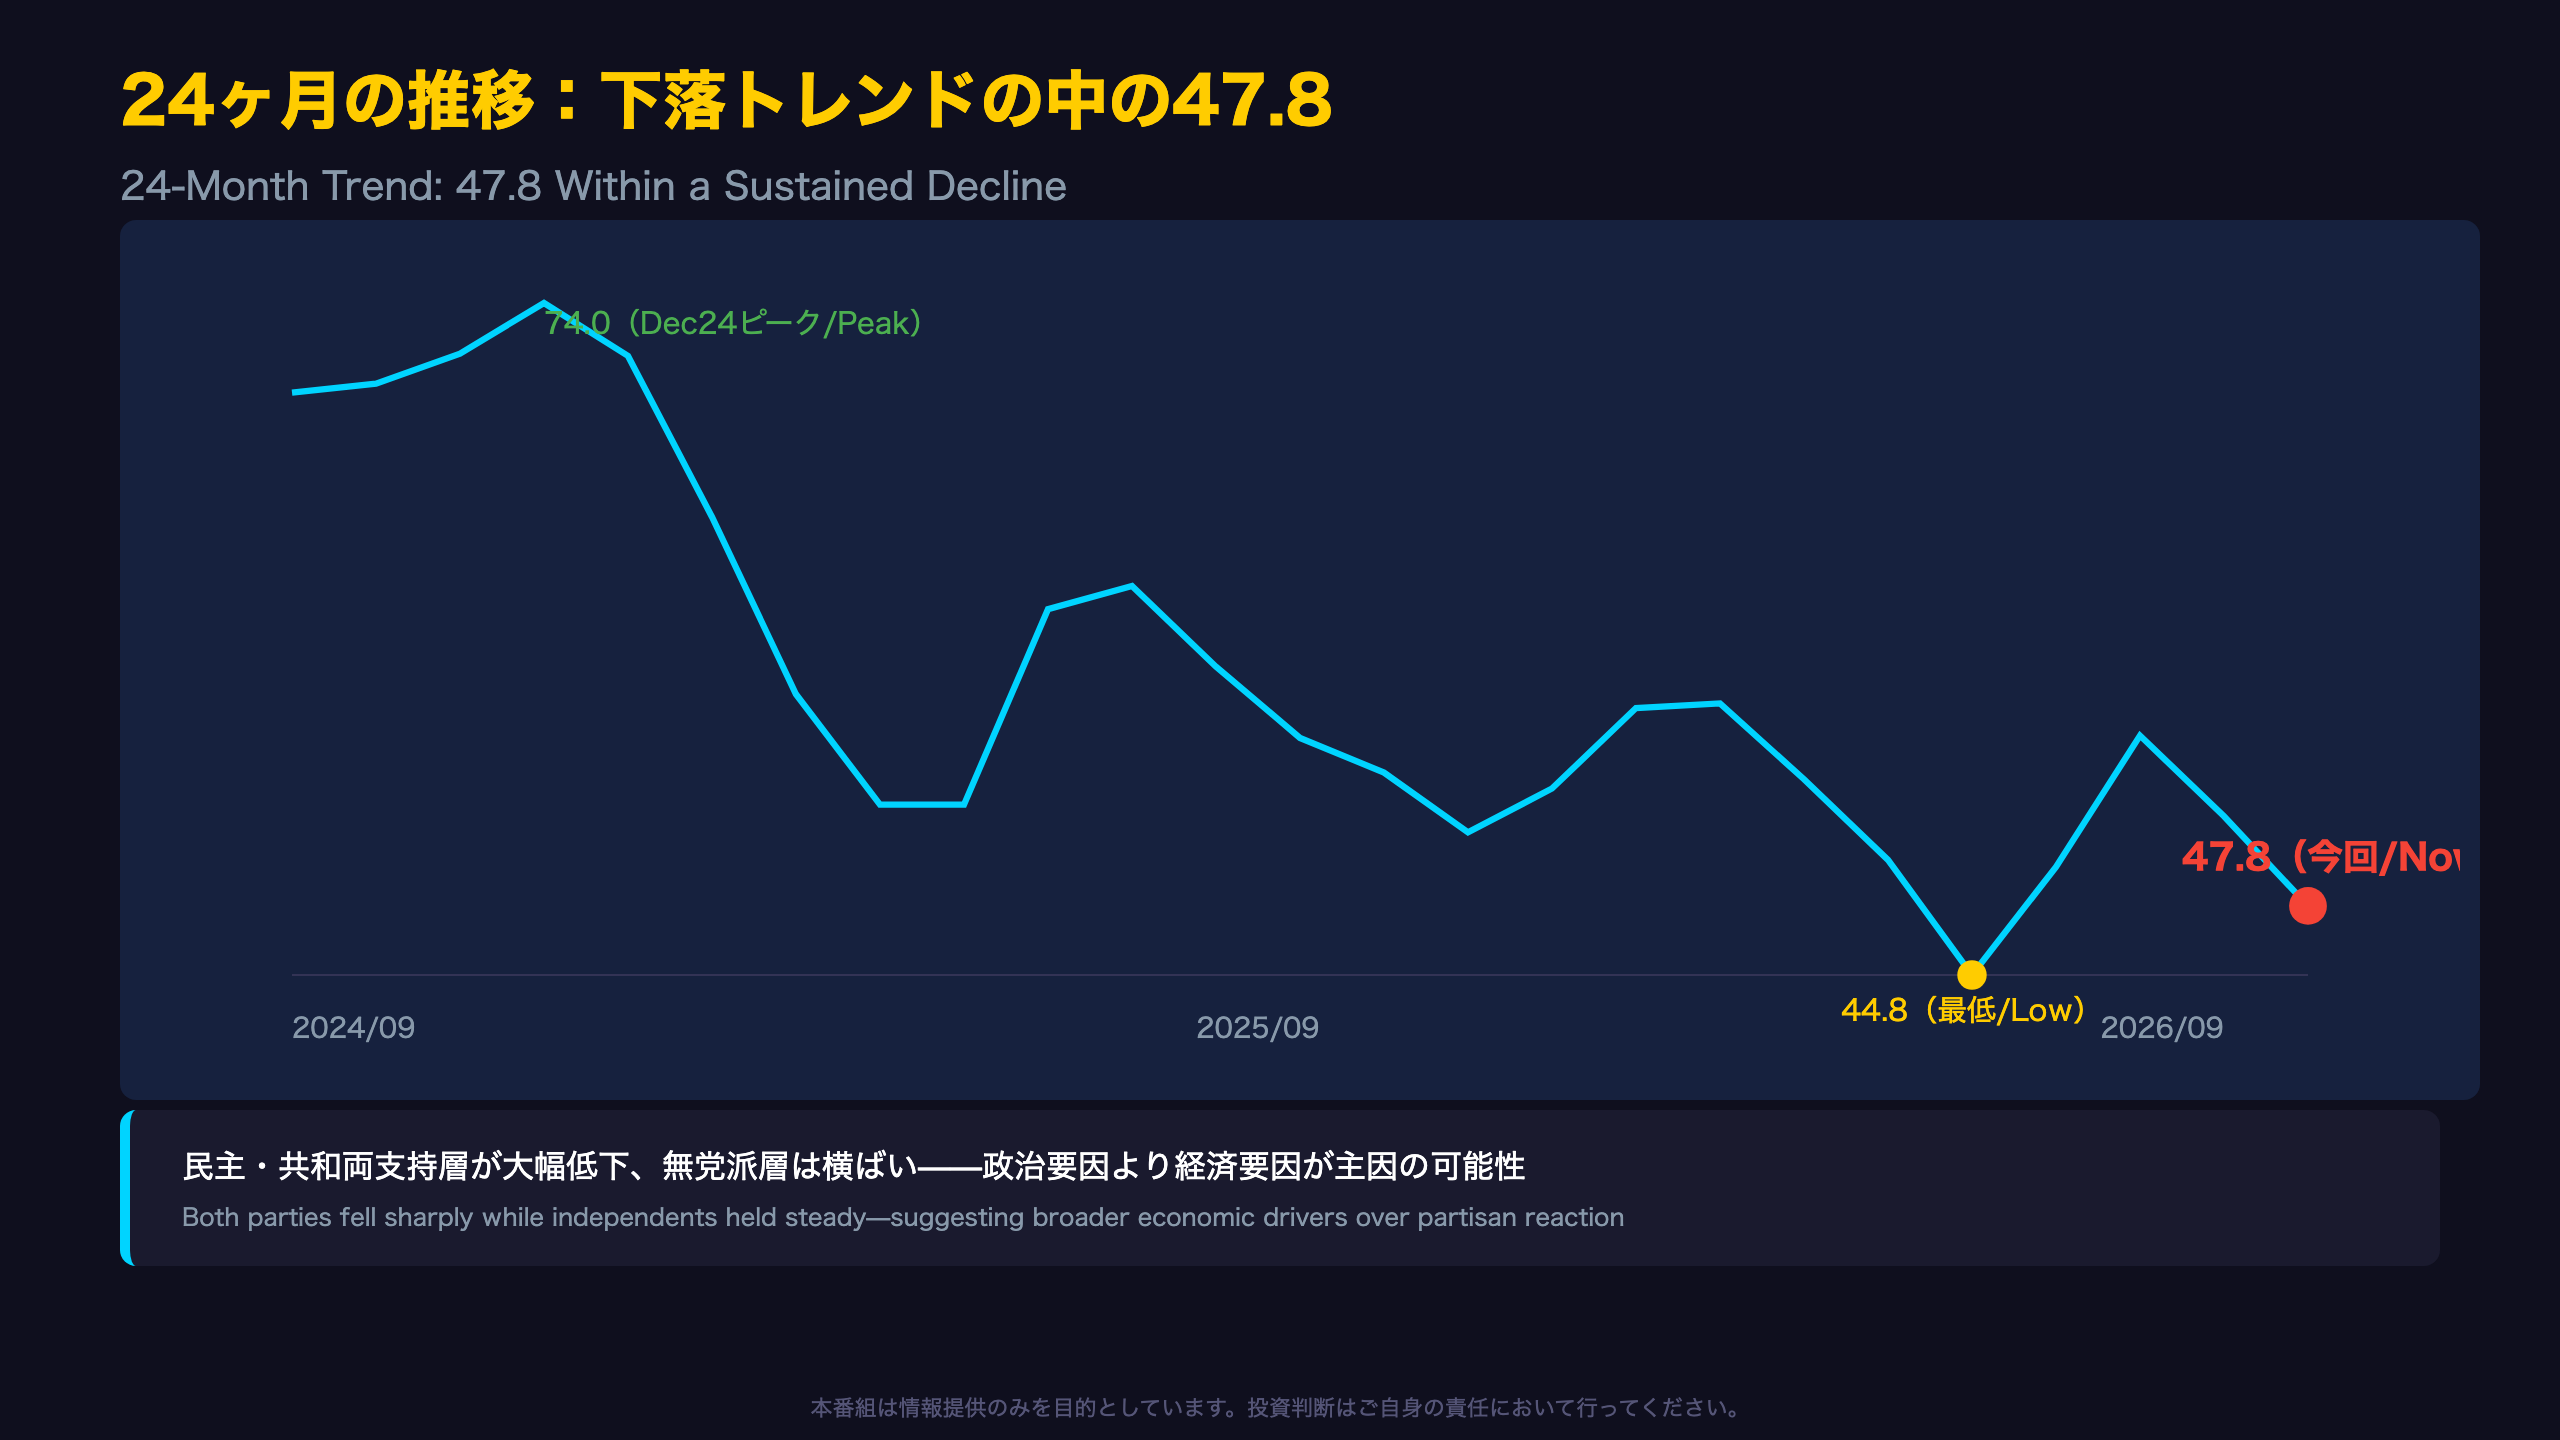
Looking at the past 24 months of data, the index peaked at 74.0 in December 2024 and has been on a clear downward trajectory since.
| Period | Index Level |
|---|---|
| Dec 2024 (peak) | 74.0 |
| May 2026 (recent low) | 44.8 |
| Jul 2026 (brief rebound) | 55.2 |
| Sep 2026 (current) | 47.8 |
The July rebound to 55.2 initially looked like a turning point, but August (51.7) and September (47.8) erased most of those gains. At 47.8, this reading is the second-lowest in the 24-month window, trailing only May 2026’s 44.8.
One notable structural detail: the report states that “Democrats and Republicans alike posted sizable declines, while independents were little changed from August.” For readers unfamiliar with this nuance — the Michigan survey has drawn attention in recent years for showing partisan swings tied to which party holds the White House. The fact that both major partisan groups declined together, while independents stayed flat, suggests (with moderate confidence) that this month’s drop reflects broad economic pressures — like fuel prices and trade tensions — rather than a one-sided political reaction. This is relevant context for U.S. equity and bond investors who might otherwise dismiss partisan swings as noise.
現況指数と期待指数の乖離
Why Current Conditions and Expectations Diverged So Sharply
The most striking feature of this report is the gap between the Current Economic Conditions component and the Index of Consumer Expectations.
| Component | MoM | YoY |
|---|---|---|
| Current Conditions | -1.9% | -15.7% |
| Expectations | -11.1% | -11.4% |
On a month-over-month basis, the Expectations Index fell nearly six times faster than Current Conditions, making clear that forward-looking anxiety — not present-day hardship — drove this month’s headline decline. Year-over-year, however, Current Conditions has actually deteriorated more than Expectations, showing that lived experience has also gradually worsened over the past twelve months.
One notable detail often overlooked: five-year business condition expectations held stable this month. The report states these readings remain “well below their historical average,” but did not deteriorate further despite emerging risks. This is analogous to how U.S. long-run inflation expectations (5-10yr, tracked separately by the Fed via the Cleveland Fed and NY Fed surveys) are watched for signs of “de-anchoring” — here, Michigan’s long-run business outlook appears to have avoided a fresh leg down, even as near-term sentiment worsened. For investors, this nuance argues against extrapolating today’s short-term anxiety into an imminent, structural collapse in consumer spending.
インフレ期待の急上昇
Inflation Expectations: A One-Month Blip or a New Plateau?
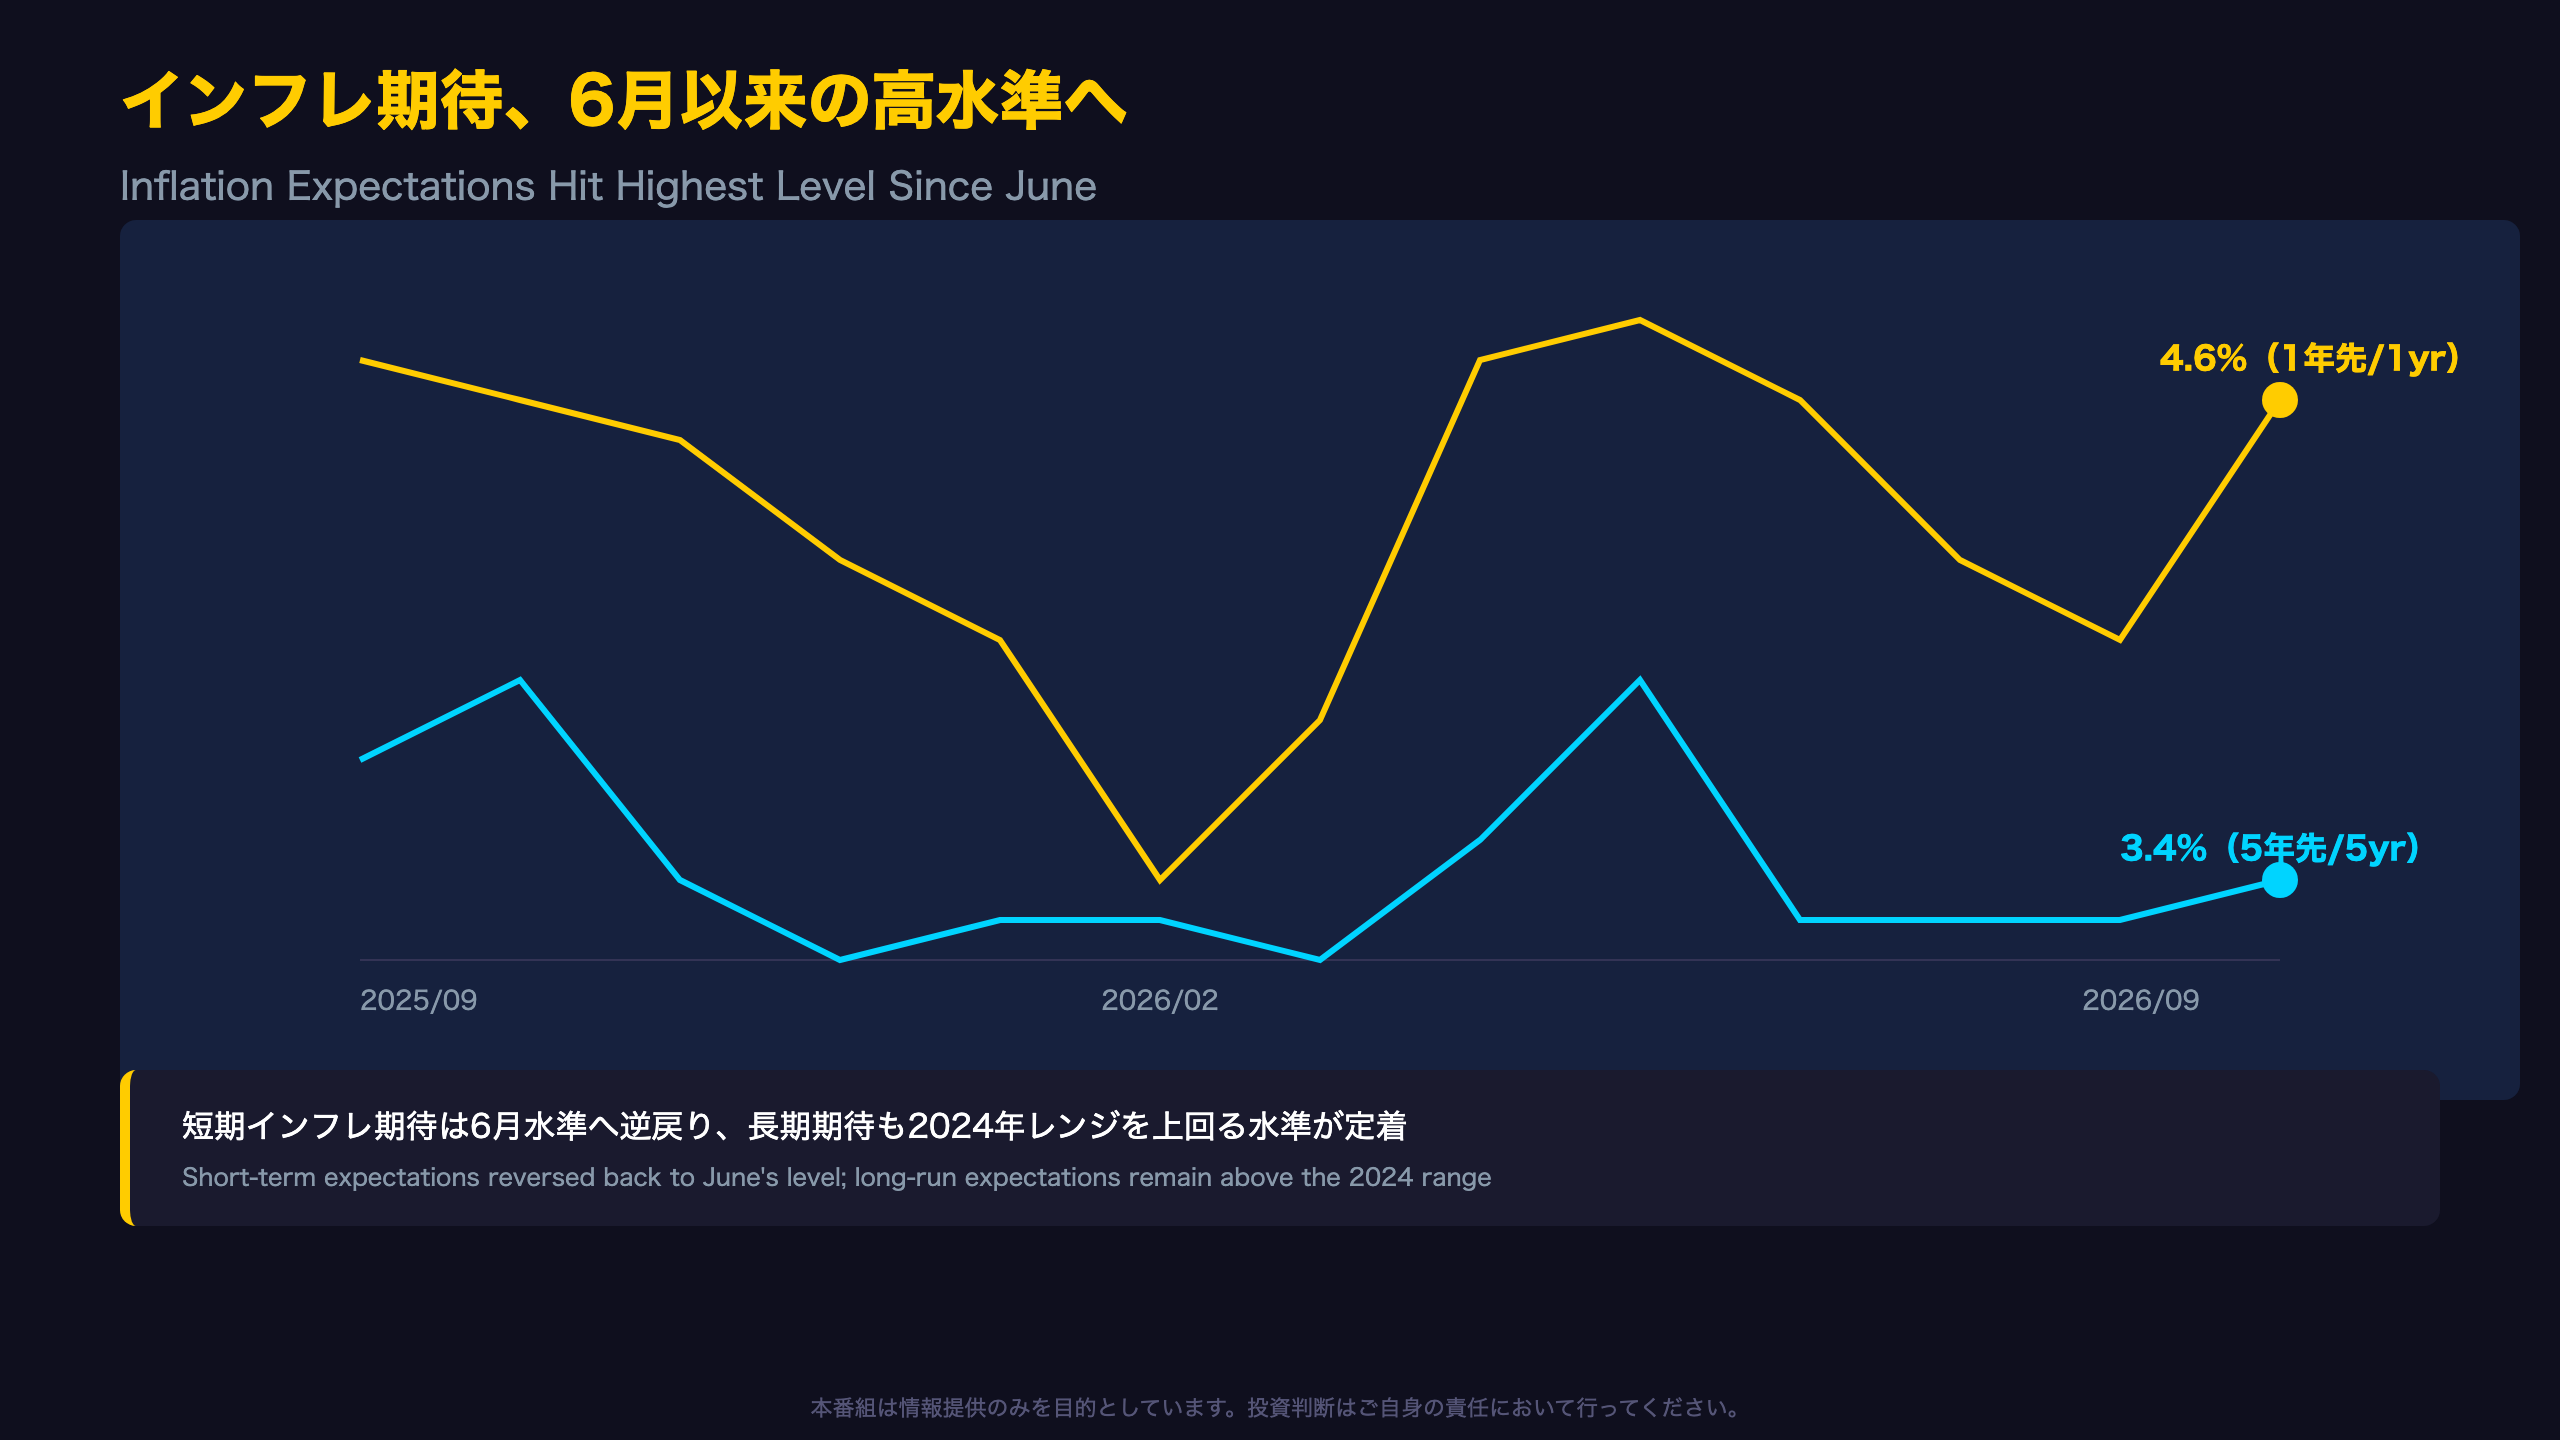
Looking at the past year of one-year inflation expectations, this month’s 4.6% is not unprecedented.
| Month | 1-Yr Expectation |
|---|---|
| Feb 2026 | 3.4% (pre-Iran conflict) |
| Jun 2026 | 4.6% |
| Aug 2026 | 4.0% |
| Sep 2026 (current) | 4.6% |
June 2026 already touched the same 4.6% level, before cooling to 4.2% in July and 4.0% in August. This month’s jump effectively reverses that cooling trend. As a single-month swing, some caution is warranted before treating it as a durable structural shift (a Level-C interpretation, pending further data).
For U.S.-focused investors: this measure is distinct from the Federal Reserve’s preferred PCE inflation gauge or the New York Fed’s Survey of Consumer Expectations, but the Fed does monitor Michigan’s inflation expectations series as one input among several, precisely because runaway expectations can become self-fulfilling via wage and pricing behavior.
The five-year (long-run) expectation, by contrast, rose only marginally to 3.4% from three straight months at 3.3% — the report explicitly states long-run expectations “ticked up… ending three consecutive months at 3.3%.” This stickier, longer-horizon measure remains clearly above 2024’s 2.8%-3.2% range, suggesting the inflation expectations “anchor” itself may be drifting modestly higher — a dynamic markets and the Fed would want to watch closely over coming releases.
インプリケーション:FRBへの示唆
A Difficult Combination for the Federal Reserve
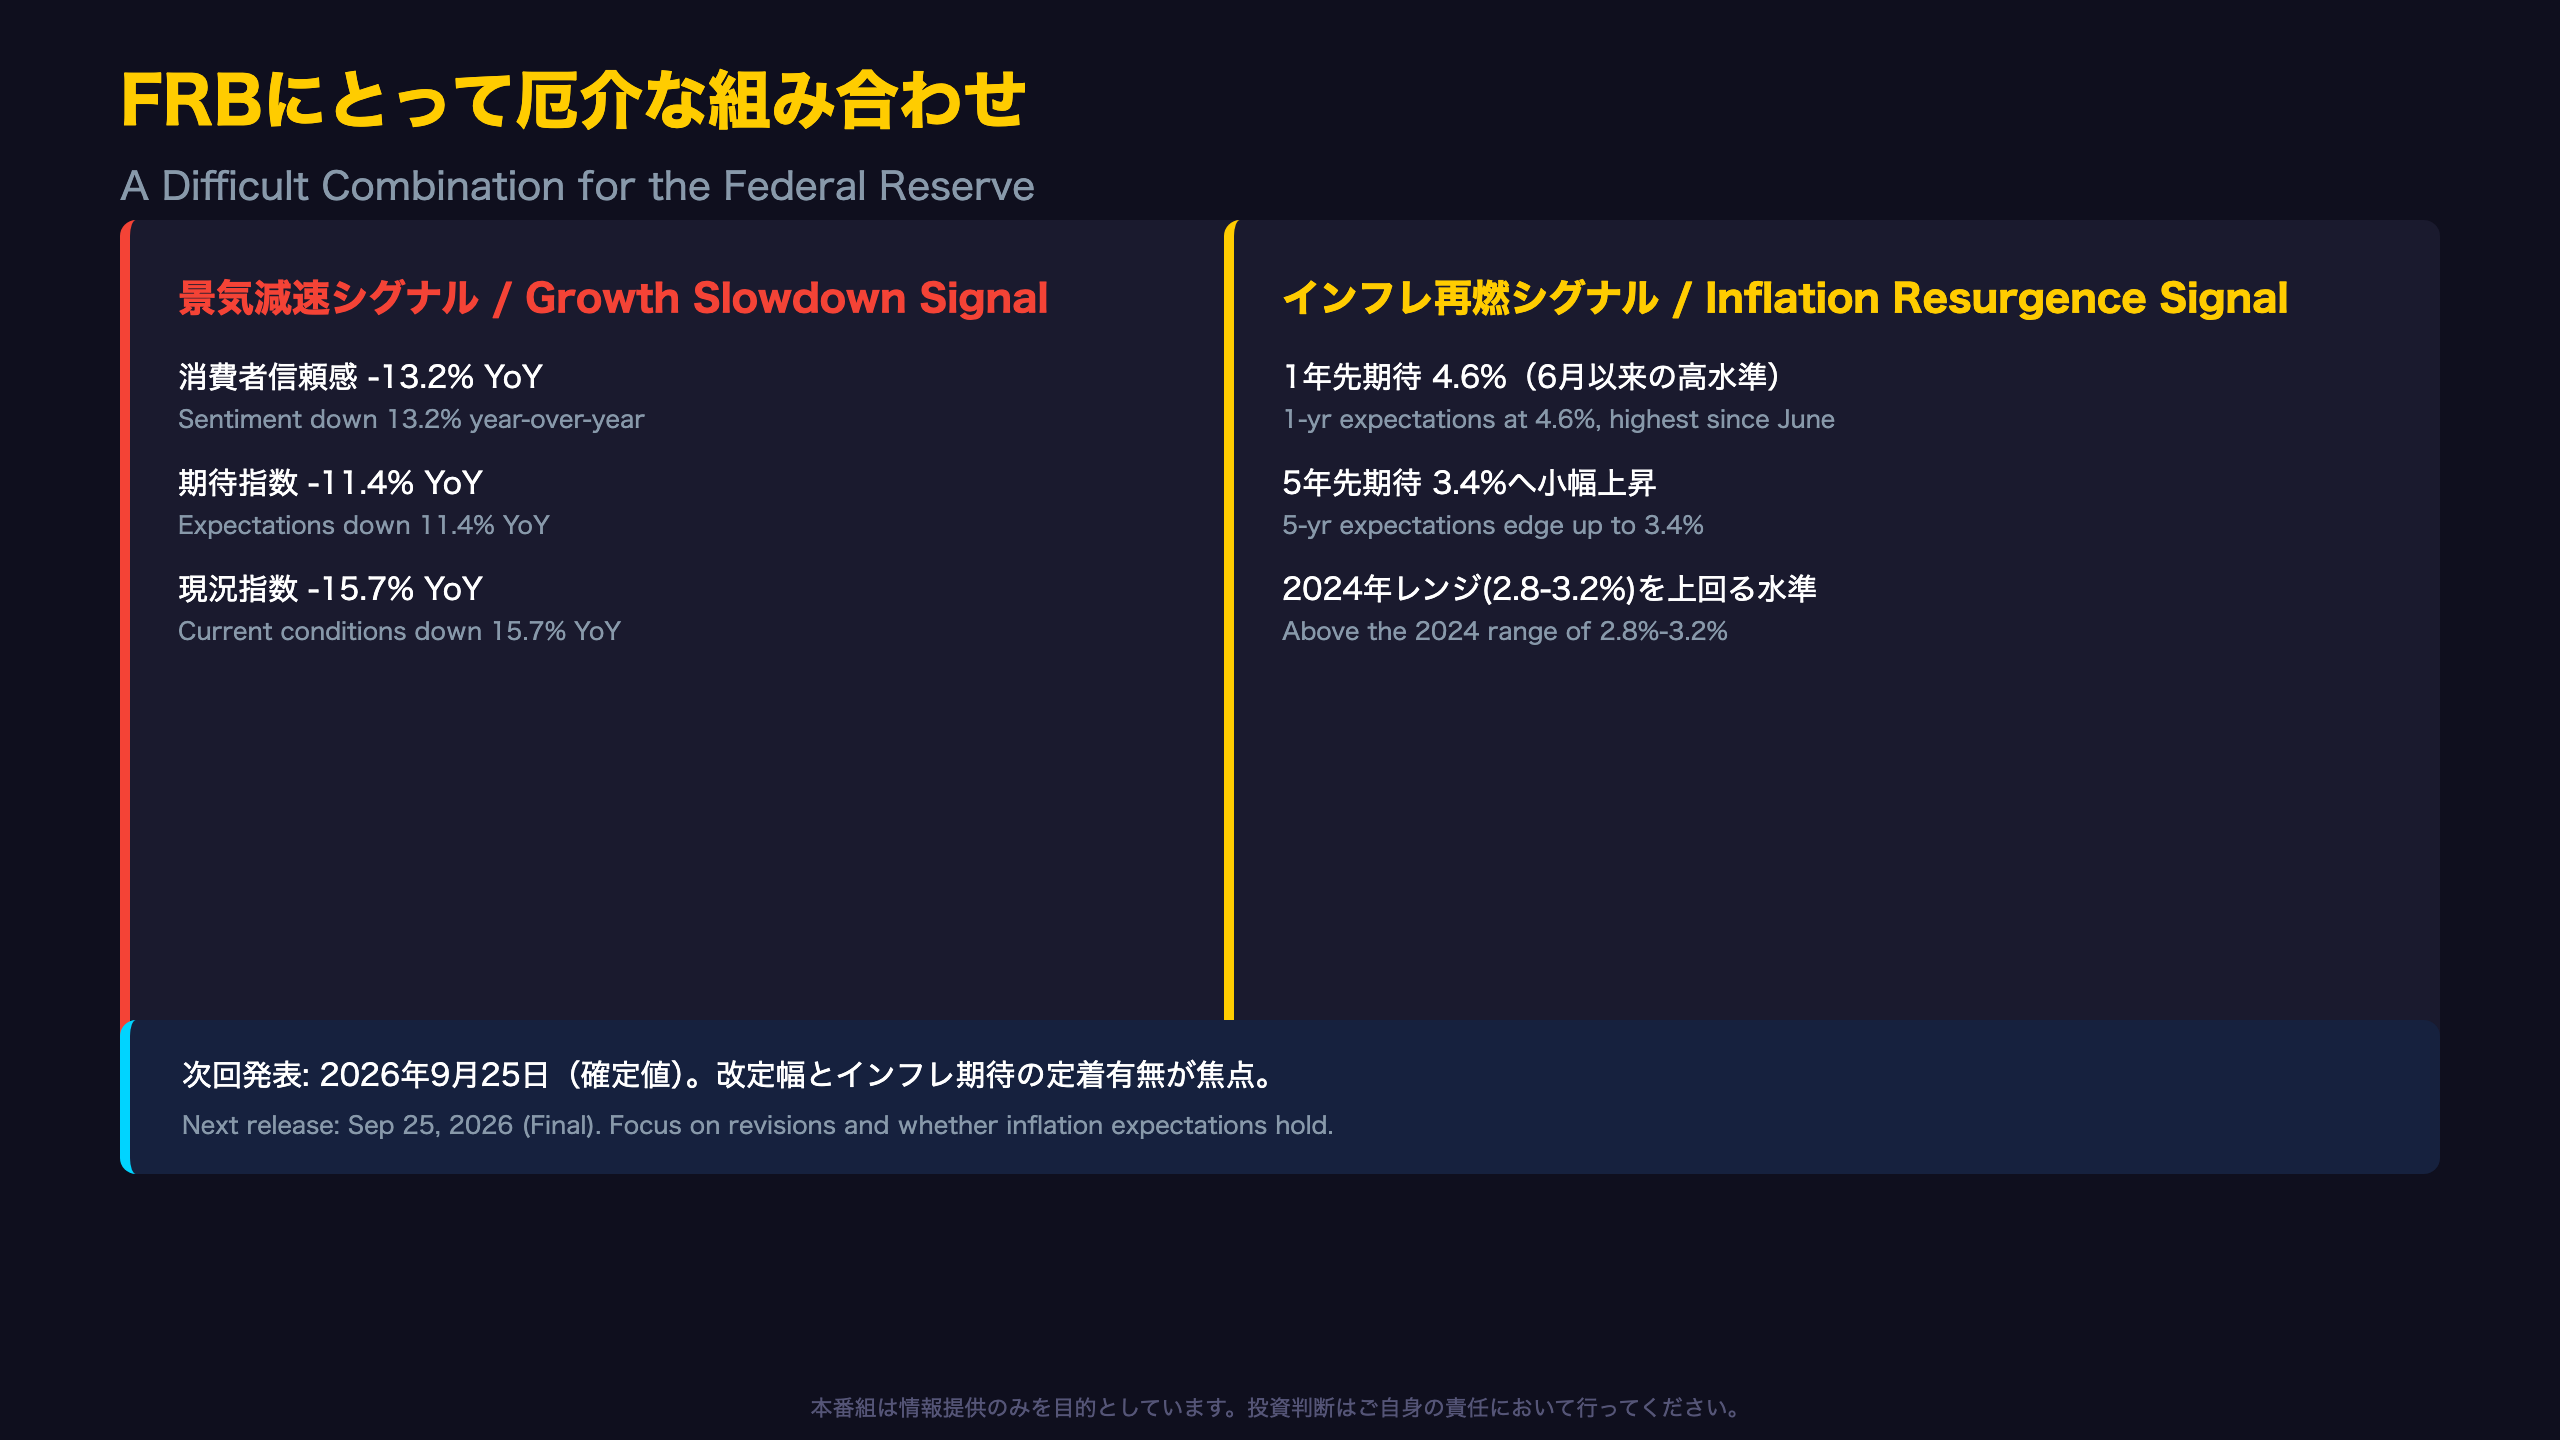
This report presents a textbook-adjacent “stagflationary” pattern: softening consumer sentiment occurring simultaneously with rising inflation expectations.
Normally, a decline in consumer sentiment would be read as a dovish signal supporting rate cuts. But because one-year inflation expectations also jumped to 4.6% this month, the Fed cannot simply treat weak sentiment as grounds for easing. Elevated inflation expectations carry their own risk: if left unaddressed, they can feed into actual wage and price-setting behavior, becoming self-reinforcing — a dynamic the Fed has explicitly cited as a reason to monitor this survey alongside its primary PCE inflation target.
On the other hand, five-year inflation expectations rose only marginally to 3.4%, and the report notes this month’s emerging risks did not further worsen the long-run outlook. This is a meaningfully reassuring counterpoint: it suggests inflation expectations have not become fully “de-anchored,” which would be the Fed’s greatest concern.
For markets: a simultaneous sentiment/inflation-expectations divergence like this typically supports a “higher for longer” rate stance narrative, all else equal, rather than an imminent dovish pivot — though a single month’s data alone should not be extrapolated into a firm policy call.
The final September report is due September 25, 2026. Two things to watch: (1) how much this preliminary 47.8 reading is revised, and (2) whether the 4.6% one-year inflation expectation reading holds or reverses, as it did after June’s identical level.
Disclaimer: This article is for informational purposes only. All investment decisions are made solely at your own risk.