📺 Watch the Full Video Analysis
This article was automatically generated by the NFC Market Live AI analysis system. (Updated: 2026-09-10 23:11 JST)
📄 Primary Source
U.S. Census Bureau
https://www.census.gov/wholesale/pdf/mwts/currentwhl.pdf
📊 A deep dive into the U.S. Census Bureau’s July 2026 Wholesale Trade report, released Sept 10.
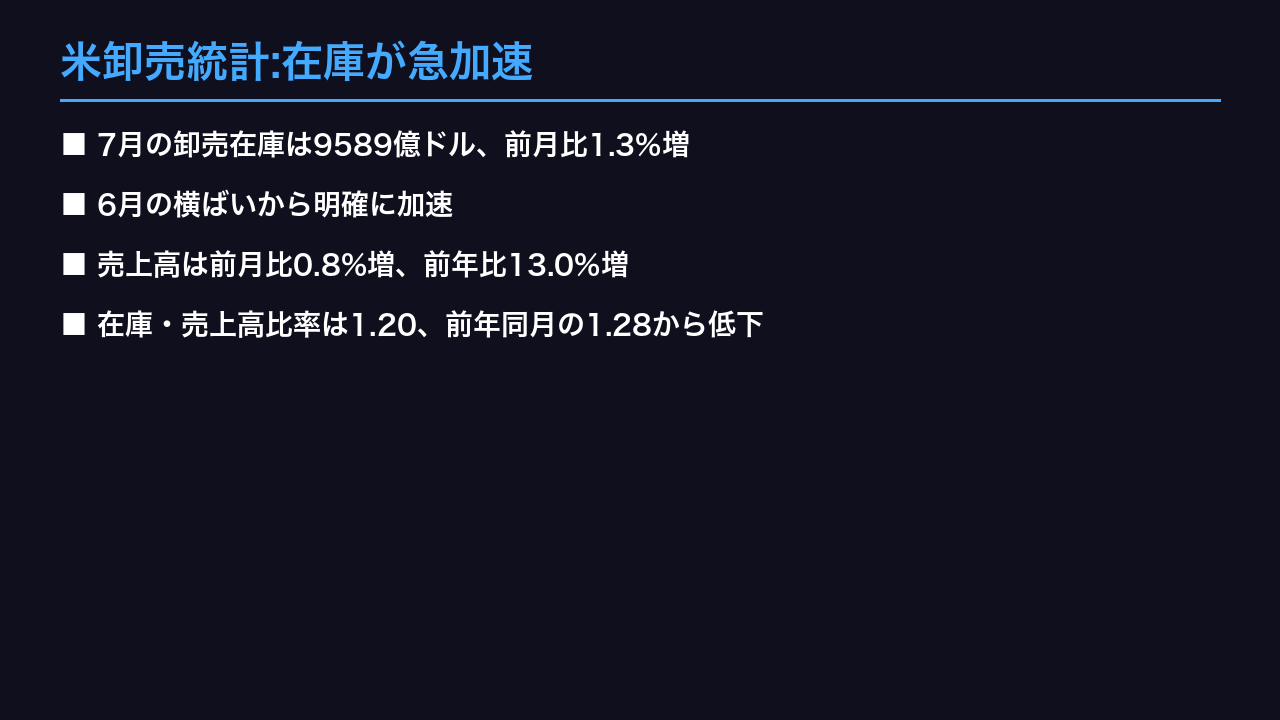
📈 Inventories rose 1.3% MoM to $958.9B, a clear acceleration from June’s flat reading.
💹 Sales grew 13.0% YoY, but the inventories-to-sales ratio held at just 1.20, versus 1.28 a year ago.
⚠️ Petroleum and electronics remain extremely lean, while machinery inventories pile up.
We break down what this means for GDP, prices, and markets.
米卸売統計:在庫が急加速
About This Report
The data comes from the U.S. Census Bureau’s Monthly Wholesale Trade Survey (MWTS), a sample-based survey of roughly 4,200 employer firms covering merchant wholesalers, excluding manufacturers’ sales branches. Unlike diffusion-index surveys such as ISM, the MWTS produces dollar-value estimates with published confidence intervals — a level of statistical rigor increasingly rare among monthly indicators.
Why the Confidence Interval Matters
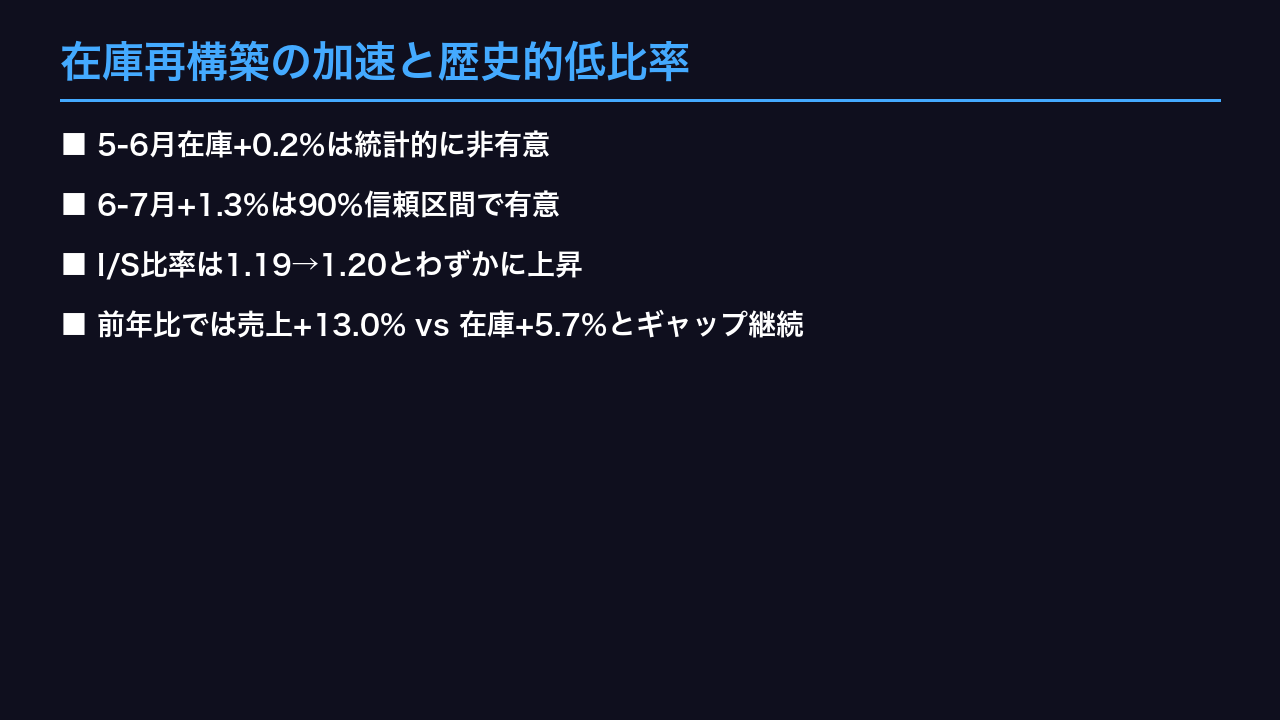
The Census Bureau states the July inventory increase of 1.3% carries a margin of error of just ±0.2%, meaning the 90% confidence interval does not include zero — a statistically robust signal. By contrast, June’s reading of +0.2% was flagged with an asterisk indicating the interval spanned zero, meaning no reliable signal could be drawn that month.
Year-to-Date Context
Cumulative 2026 sales-to-date reached roughly $5.44 trillion, up about 12.5% from $4.84 trillion in the same period of 2025 — reinforcing that year-over-year strength is not a one-month artifact.
Market Implications
Wholesale inventory data feeds directly into GDP’s private inventory investment component. A sustained acceleration in restocking, layered on already-strong nominal sales, could modestly lift Q3 GDP tracking estimates — relevant for Fed assessments of underlying demand momentum.
乱高下する売上高:業種間で明暗
A Closer Look at the Volatility
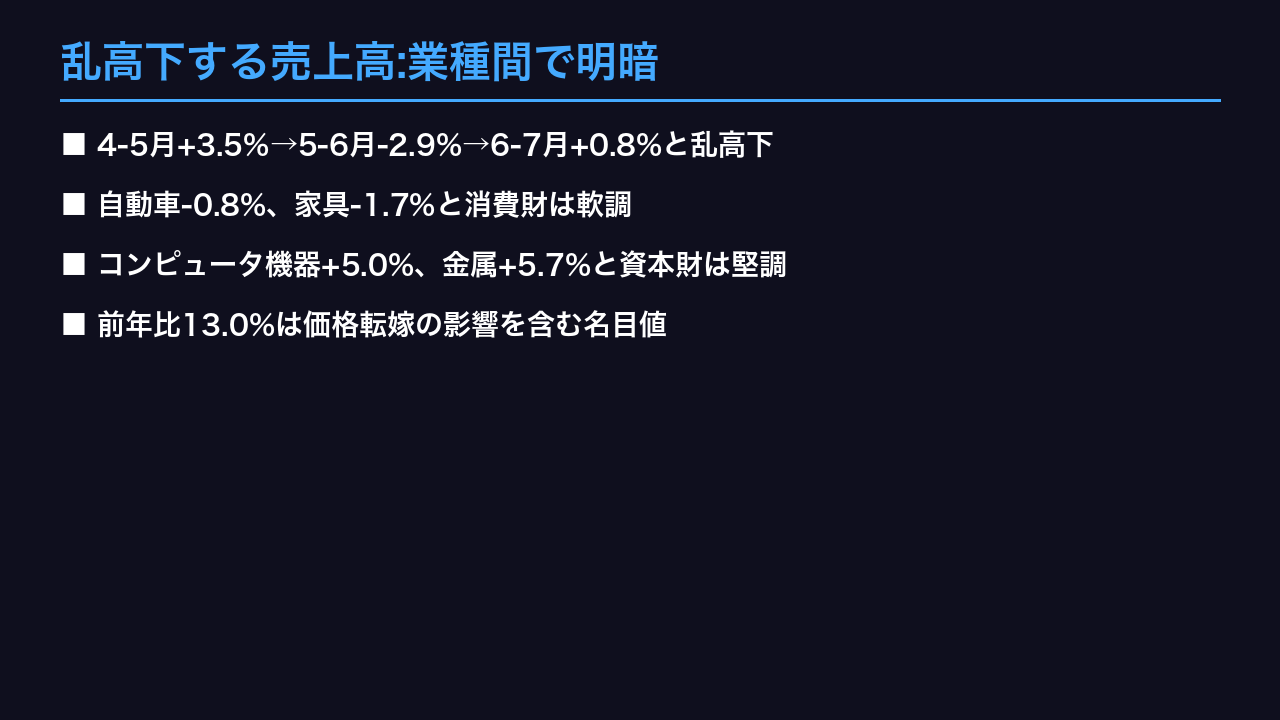
Sector data reveals a bifurcated durable goods complex. Automotive sales fell 0.8% month-over-month in July, and furniture dropped 1.7%, even though furniture’s year-over-year growth remains a robust 23.0%. Meanwhile, computer equipment (+5.0% MoM) and metals (+5.7% MoM) surged, hinting at stronger capital-goods and construction-linked demand.
The Three-Month Whipsaw
| Period | MoM Sales Change |
|---|---|
| Apr→May | +3.5% |
| May→Jun | -2.9% |
| Jun→Jul | +0.8% |
This kind of swing is unusual for an aggregate covering over $800 billion in monthly sales. One plausible explanation: pull-forward buying ahead of 2026 tariff implementation deadlines, followed by a payback effect. This remains a hypothesis, not a confirmed causal link — trading-day adjustments and one-off seasonal factors could also be contributing.
Comparison to Retail Data
Unlike Advance Retail Sales, which reflect consumer-facing demand, wholesale sales sit further up the supply chain, making them a useful — if noisier — leading indicator for factory orders and industrial production one to two months out.
在庫再構築の加速と歴史的低比率
Where Does 1.20 Sit Historically?
The chart accompanying this release plots the inventories-to-sales ratio from 2017 through 2026, with the y-axis spanning roughly 1.10 to 1.70. The current reading of 1.20 sits in the lower half of that decade-long range — a level last approached only during periods of unusually tight supply chains.
Context for International Readers
The U.S. wholesale I/S ratio is analogous to Japan’s wholesale inventory ratio tracked by METI, though the U.S. series benefits from published sampling-error bands its Japanese equivalent typically lacks. A ratio near 1.20, against a historical range extending to 1.70, indicates wholesalers are holding comparatively little buffer stock relative to sales.
Bull and Bear Reads
Bullish: Lean inventories set up a potential restocking cycle that could support factory orders and industrial production in coming months.
Cautious: If wholesalers cannot rebuild stock fast enough to match 13.0% nominal sales growth, downstream retailers could face availability constraints, adding modest upward pressure on prices — worth monitoring alongside upcoming PPI releases.
業種間で分かれる需給:品薄と過剰在庫
Sector Divergence: A Tale of Two Supply Chains
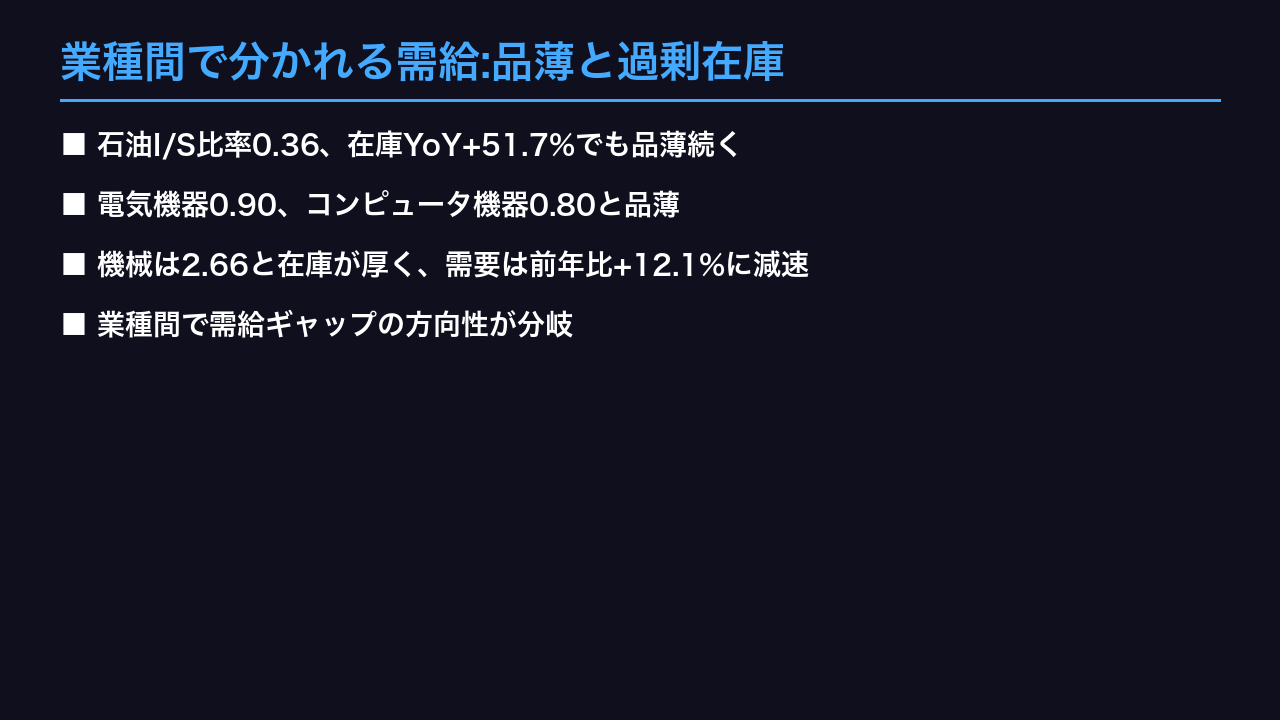
Petroleum’s inventories-to-sales ratio of 0.36 is the tightest of any category tracked — despite inventories jumping 6.5% MoM and 51.7% YoY, sales grew even faster (+34.0% YoY), likely reflecting a mix of volume and oil-price effects, since this data is not deflated.
Electrical equipment (0.90) and computer equipment (0.80) show similarly thin buffers, with both categories posting 22-30% year-over-year sales growth — consistent with continued demand strength tied to data-center and electronics-related capital spending.
The Other End: Machinery’s Heavy Stockpile
Machinery’s ratio of 2.66 is the highest in the survey, with July inventories up another 0.6% even as sales growth cooled to 12.1% year-over-year — the slowest pace among durable categories highlighted here. This divergence between lean, high-turnover categories (petroleum, electronics) and heavy, slow-turnover categories (machinery, hardware at 2.06) illustrates how unevenly the current demand cycle is being felt.
Investor Takeaway
For equity investors tracking industrial distributors, these ratios offer an early read on which sub-sectors may face restocking tailwinds versus destocking headwinds.
マクロへの波及と次回焦点

GDP Mechanics: How Wholesale Inventories Feed Into Growth
In the U.S. National Income and Product Accounts, the change in private inventories is a direct component of GDP. July’s roughly $12.2 billion inventory build, if it persists through August and September, would flow into the \”Change in Private Inventories\” line of Q3 GDP — a dynamic closely tracked by models such as the Atlanta Fed’s GDPNow.
A Reminder This Data Is Nominal
The Census Bureau explicitly notes this release is \”adjusted for seasonality but not price changes.\” With tariff-related cost pass-through elevated in 2026, some portion of the 13.0% year-over-year sales growth likely reflects price rather than volume. Cross-referencing with the Producer Price Index will help investors isolate the real component.
What’s Next
The August 2026 report is due October 8. A more significant event for data revisionists: benchmark revisions incorporating the 2023 and 2024 Annual Integrated Economic Survey are scheduled for October 26, which could meaningfully reshape the historical inventory series investors use for trend analysis.
Disclaimer: This article is for informational purposes only. All investment decisions are made solely at your own risk.