📺 Watch the Full Video Analysis
This article was automatically generated by the NFC Market Live AI analysis system. (Updated: 2026-09-08 08:59 JST)
📄 Primary Source
財務省
https://www.mof.go.jp/policy/international_policy/reference/balance_of_payments/preliminary/pg202607.htm
📊 Japan’s Ministry of Finance released July 2026 balance of payments (preliminary).
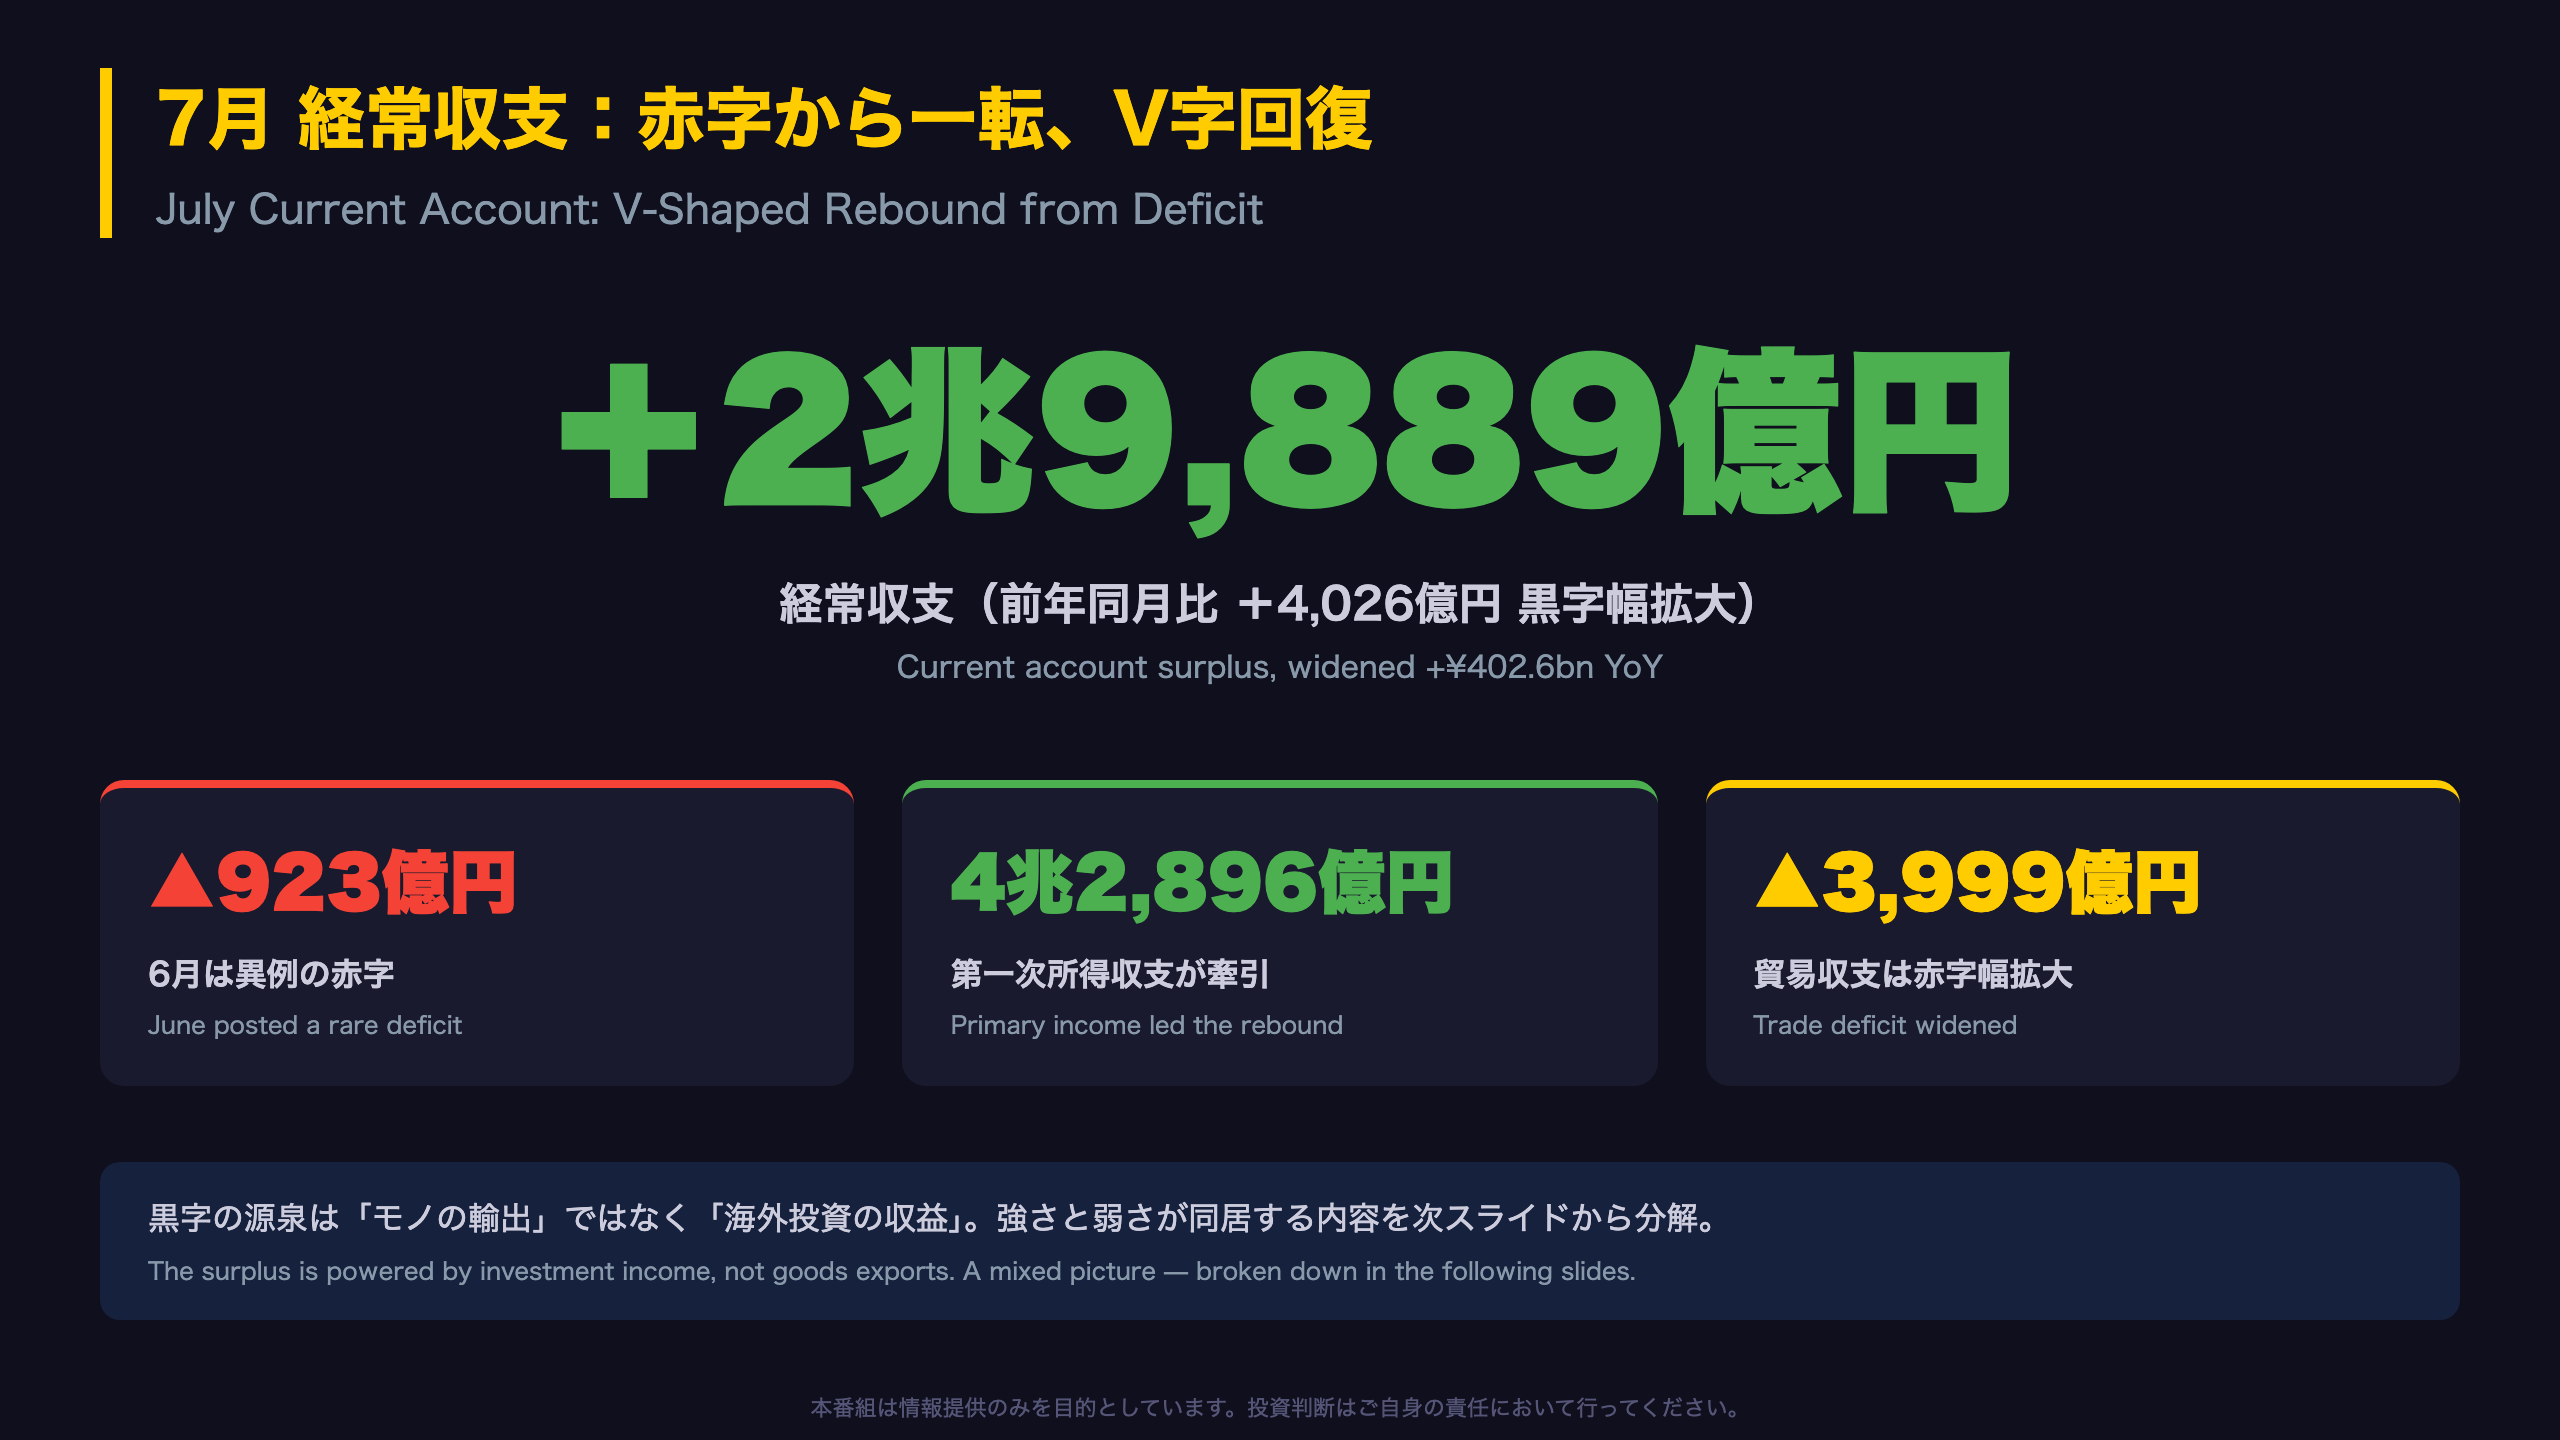
The current account swung back to a ¥2.99tn surplus (+¥402.6bn YoY) from June’s rare ¥92.3bn deficit — a V-shaped rebound. 💡 The engine: primary income of ¥4.29tn, i.e., returns on Japan’s overseas investments.
📈 Strengths: exports up 24.1% YoY (11th straight monthly gain) led by semiconductors; services deficit narrowed; foreign investors bought ¥1.79tn of Japanese equities.
⚠️ Weaknesses: imports surged 25.9%, widening the trade deficit as oil (+60.2% in USD) and a weak yen (¥162.55/USD) pushed costs up; inbound tourism growth stalled at +0.1%.
A balanced deep dive into Japan’s structural shift from trading nation to investment-income nation.
The Ultimate Summary:経常収支2.99兆円、赤字から一転V字回復
Japan’s Current Account: A ¥3tn Single-Month Swing
Japan’s Ministry of Finance (MOF) publishes the monthly Balance of Payments — the most comprehensive record of the country’s transactions with the rest of the world. The July 2026 preliminary release showed a current account surplus of ¥2.99 trillion (+¥402.6bn YoY), rebounding sharply from June’s rare deficit of ¥92.3 billion.
Why June was a deficit — and why July is not
June’s deficit was driven by a temporary collapse in primary income (income on overseas investments), which fell to just ¥380.1bn as securities investment income deteriorated. In July, primary income snapped back to ¥4.29tn — its usual scale. For context, primary income is now Japan’s dominant external earner, the equivalent of what net exports were for Japan in the 1980s.
How this compares internationally
Unlike the US, which runs persistent current account deficits, Japan remains one of the world’s largest creditor nations. Its surplus is no longer built on trade — the goods balance was in deficit (¥-400bn) — but on dividends, interest, and reinvested earnings from decades of outbound FDI and portfolio investment.
Market relevance
A large income-driven surplus provides a structural cushion for the yen over the long run, though much of this income is reinvested abroad rather than repatriated — one reason the surplus has not prevented yen weakness (¥162.55/USD monthly average in July). Watch whether the trade-side deterioration persists as energy prices stay elevated.
構造分解:貿易・サービスの赤字を吸収する所得収支
Anatomy of the Surplus: One Pillar Holding Up Everything
The July breakdown
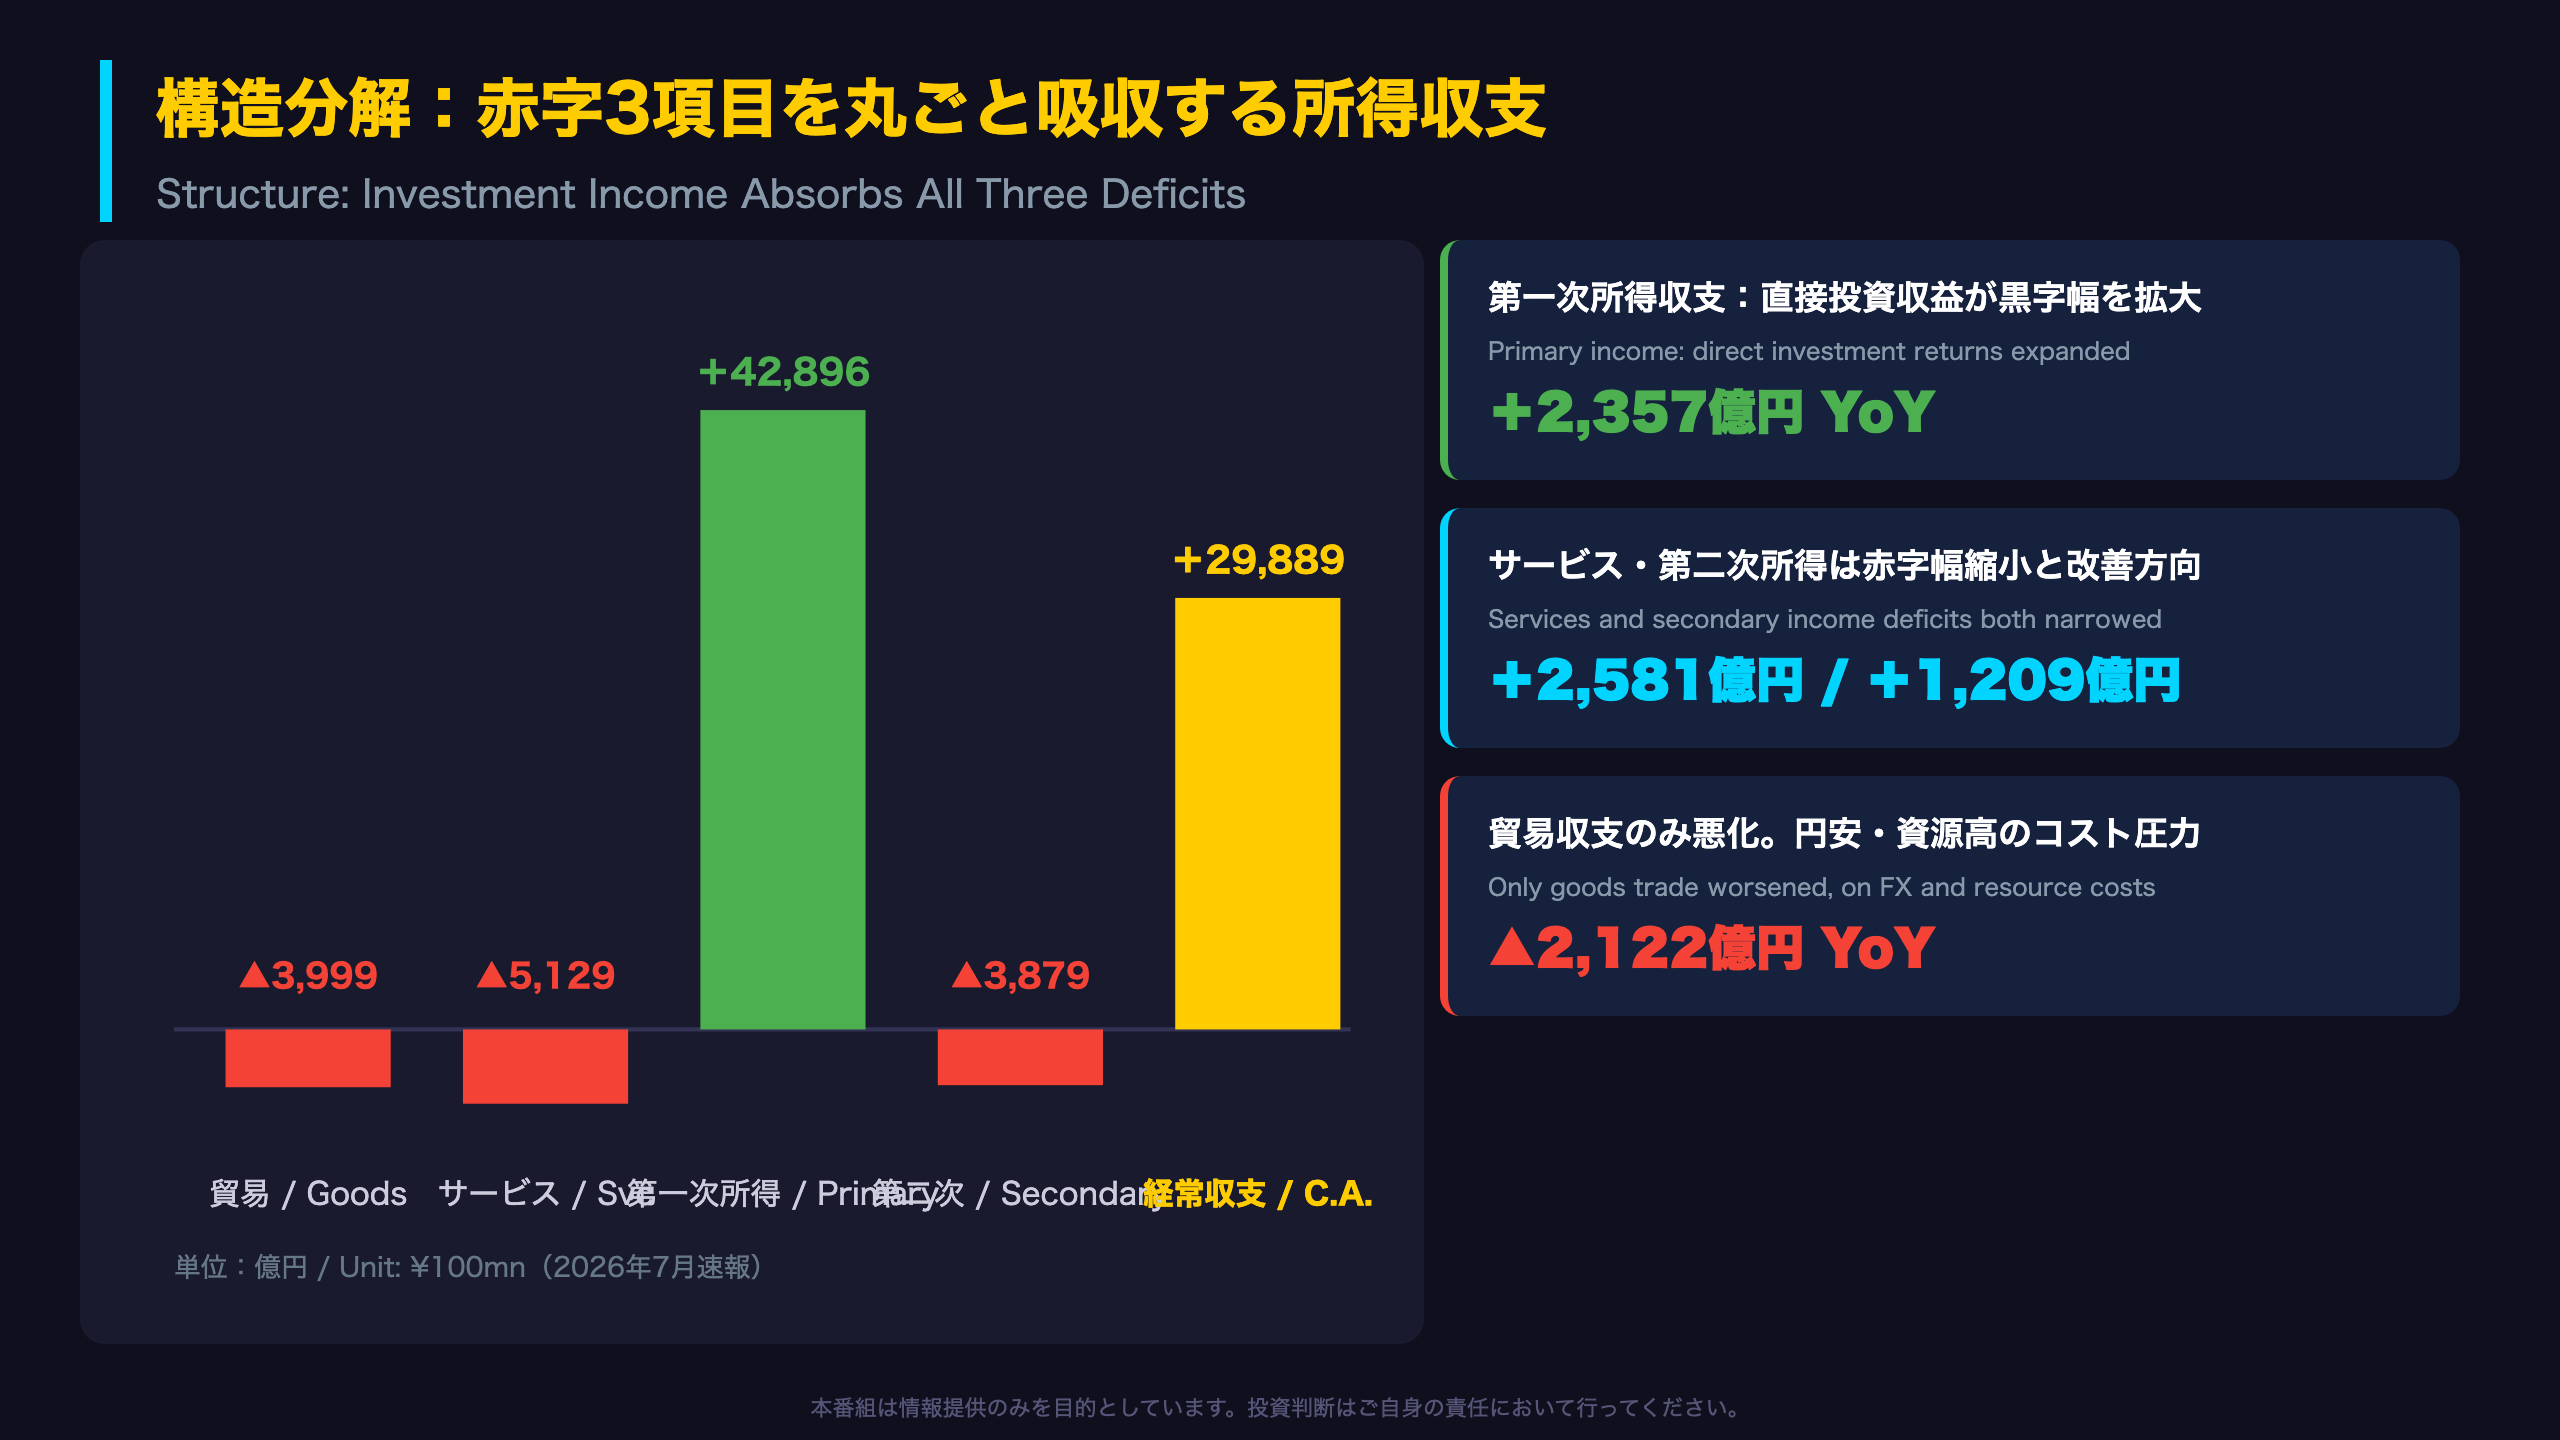
- Goods trade: -¥399.9bn (deficit widened ¥212.2bn YoY)
- Services: -¥512.9bn (deficit narrowed ¥258.1bn YoY)
- Primary income: +¥4,289.6bn (surplus expanded ¥235.7bn YoY)
- Secondary income: -¥387.9bn (deficit narrowed)
- Current account: +¥2,988.9bn
The MOF release attributes the primary income expansion to \”direct investment income,\” i.e., dividends and reinvested earnings from Japanese firms’ overseas subsidiaries. This is the payoff from decades of outbound M&A and factory-building — Japan effectively earns like a global holding company.
The FX double edge
The yen averaged ¥162.55/USD in July, 10.8% weaker YoY. A weak yen inflates import costs (widening the trade deficit) but also inflates the yen value of foreign-currency income streams. The same currency move hurts one line of the current account while boosting another.
Bull vs. bear reading
Bulls see resilience: even with oil up 60% in dollar terms and a historically weak yen, Japan still cleared a ¥3tn monthly surplus. Bears see concentration risk: goods, services, and secondary income are all in deficit, leaving the entire surplus riding on a single line item. Notably, income surpluses generate less spot yen-buying than trade surpluses, since much of the earnings are reinvested abroad — one reason the surplus coexists with a weak yen.
貿易収支の深掘り:数量は底堅く、赤字拡大は「価格」由来
Decomposing the Trade Deficit: A Price Story, Not a Volume Story
Price-volume breakdown (customs basis, July)
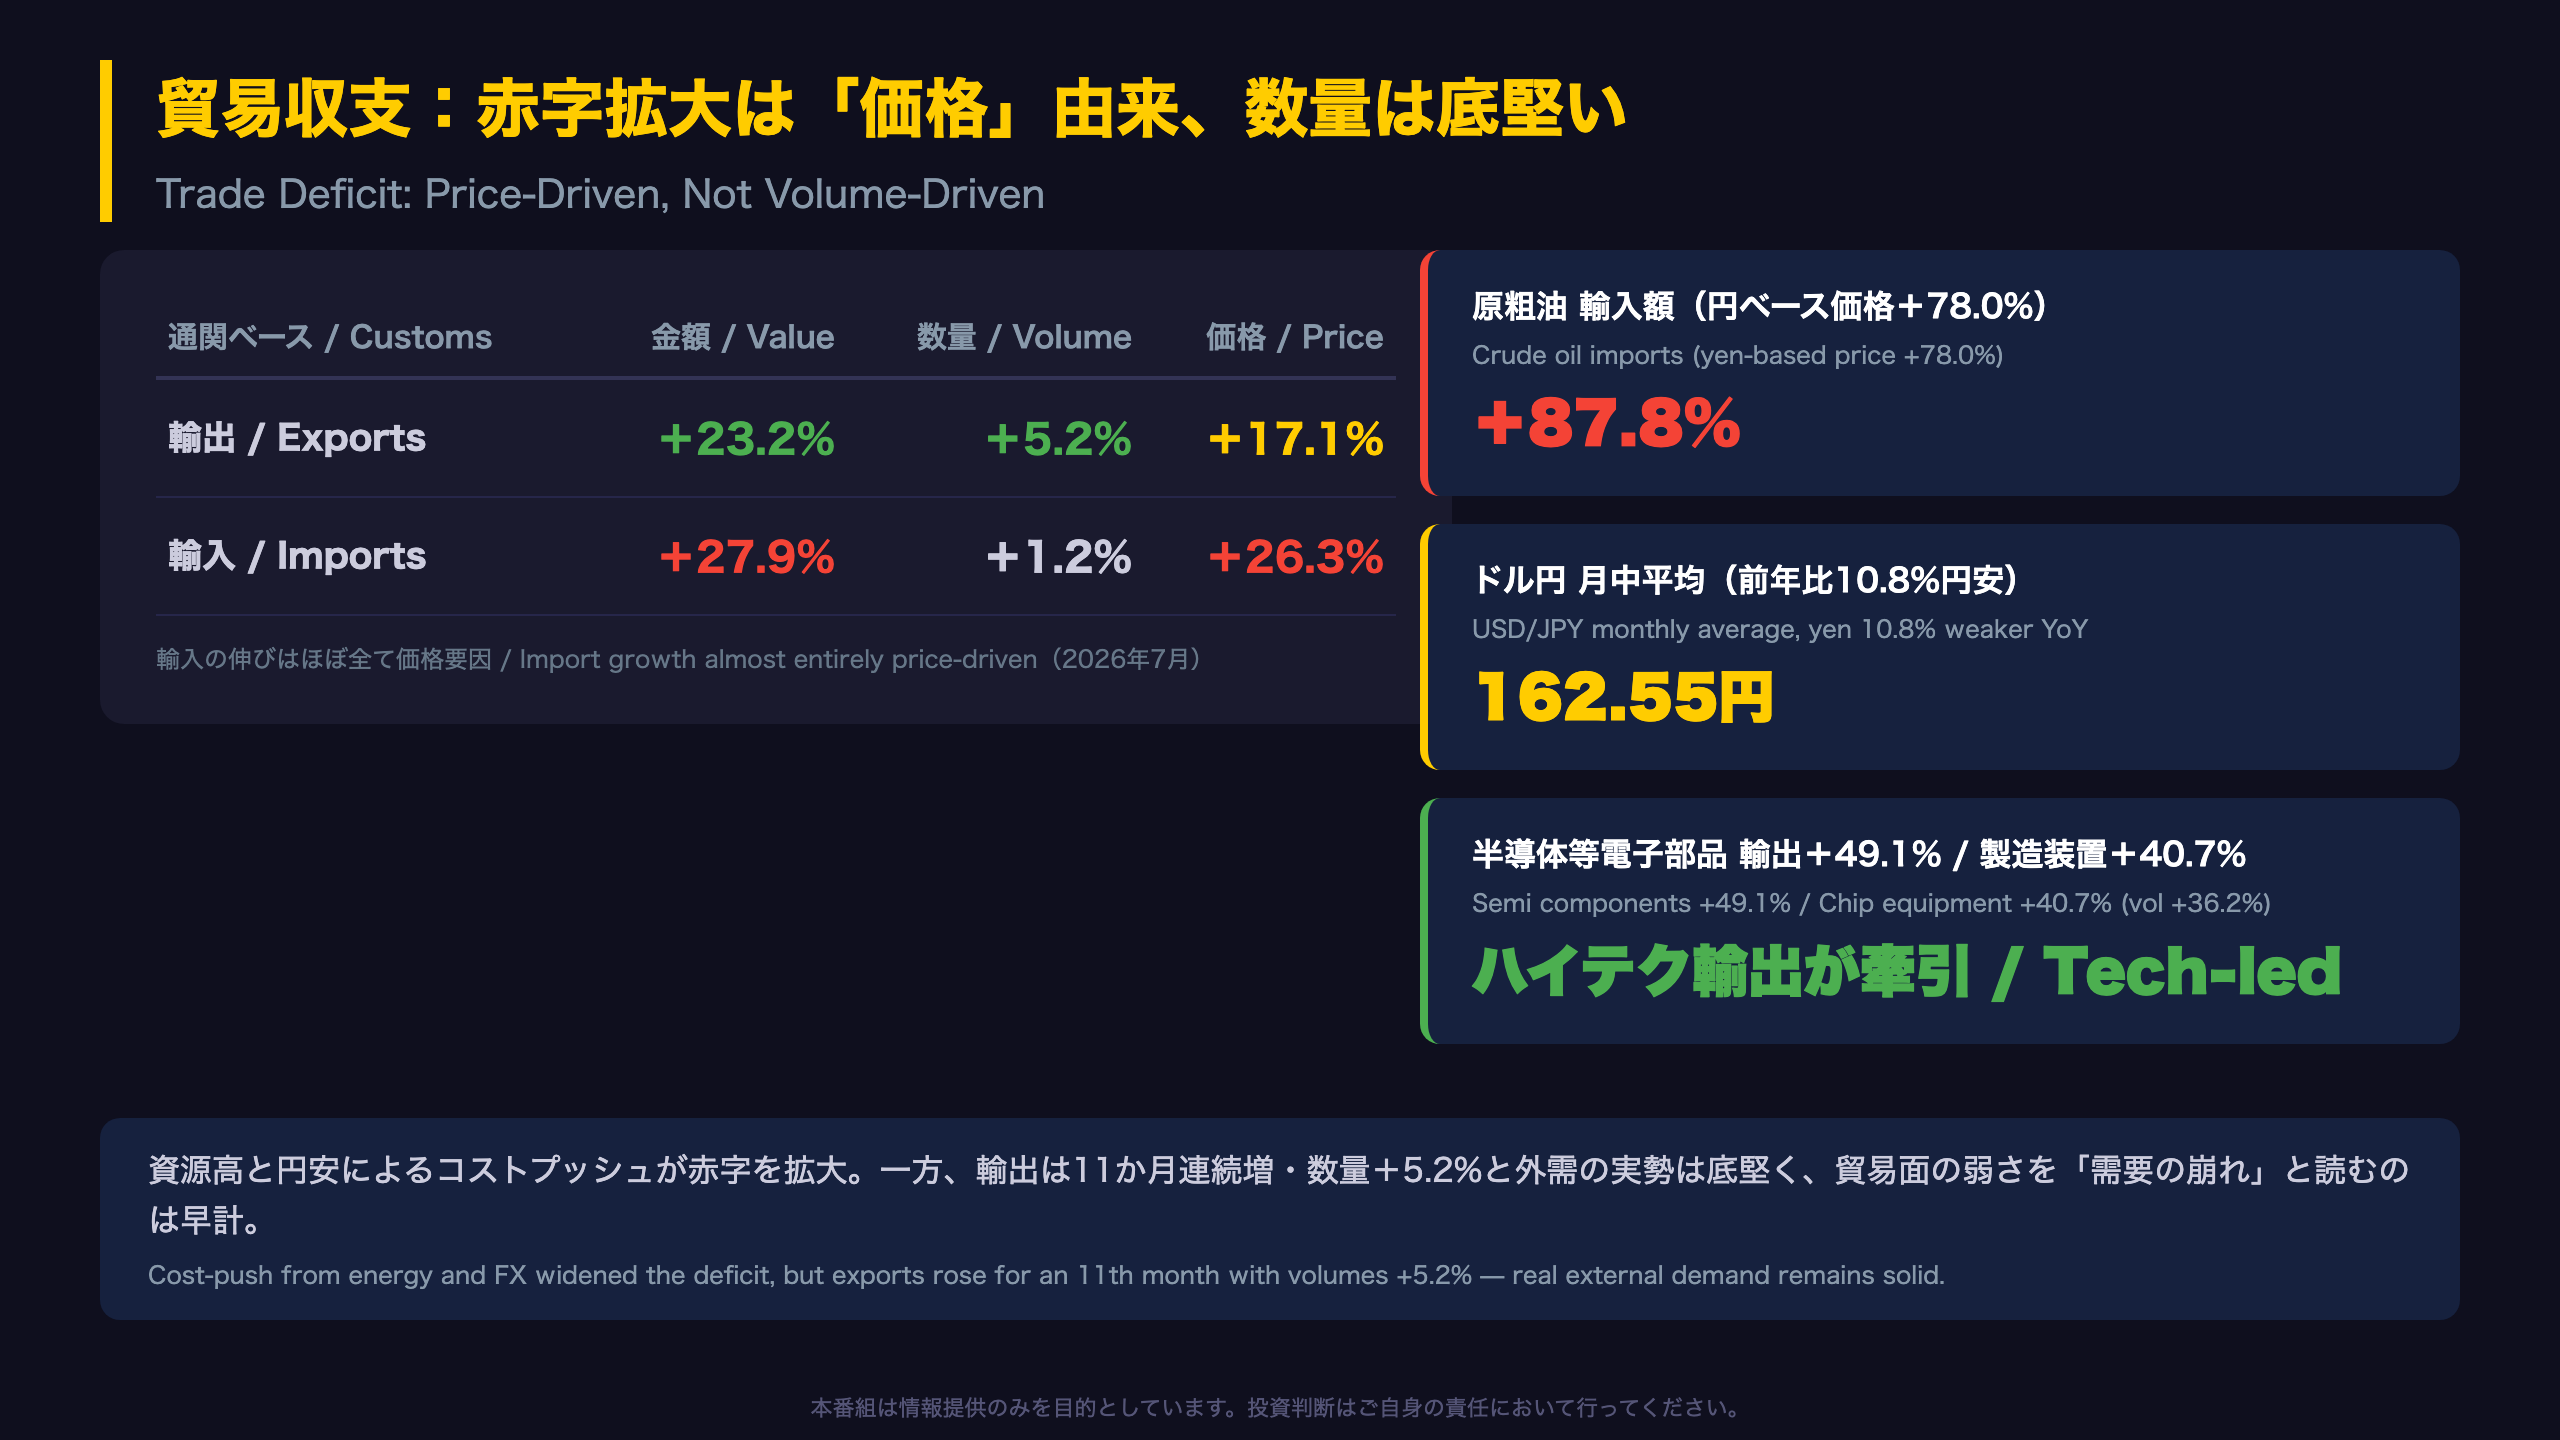
- Exports: value +23.2% = volume +5.2% × price +17.1%
- Imports: value +27.9% = volume +1.2% × price +26.3%
Japan’s customs data separates value growth into volume and price components — a critical distinction for macro analysis. Nearly all of July’s 27.9% import surge came from prices. Real import demand was essentially flat, meaning the widening deficit reflects imported cost inflation, not an overheating domestic economy.
The energy amplifier
Crude oil import values jumped 87.8% YoY with volumes up only 5.5%. Dollar-based crude averaged $114.35/barrel (+60.2% YoY), but in yen terms oil was up 78.0% — the weak yen (¥162.55/USD, -10.8% YoY) amplified the shock. This is the classic terms-of-trade squeeze that has periodically hit Japan since 2022.
The tech bright spot
Semiconductor component exports rose 49.1% and chip-making equipment 40.7% — with equipment volumes up 36.2%, indicating genuine global capex demand rather than price effects. Semiconductor imports also surged 79.7%, pointing to active intra-supply-chain trade. For investors in Japanese semiconductor equipment names, the customs data corroborates the strength seen in corporate guidance.
What to watch
Oil’s YoY price gain decelerated from +66.6% in June to +60.2% in July. If base effects fade, the price-driven deficit pressure could ease in coming months — a key swing factor for the goods balance.
サービス収支と第一次所得収支:改善と回復、ただしインバウンドに一服感
Services and Income: The Two Underappreciated Lines
Services deficit narrows — but not because of tourism
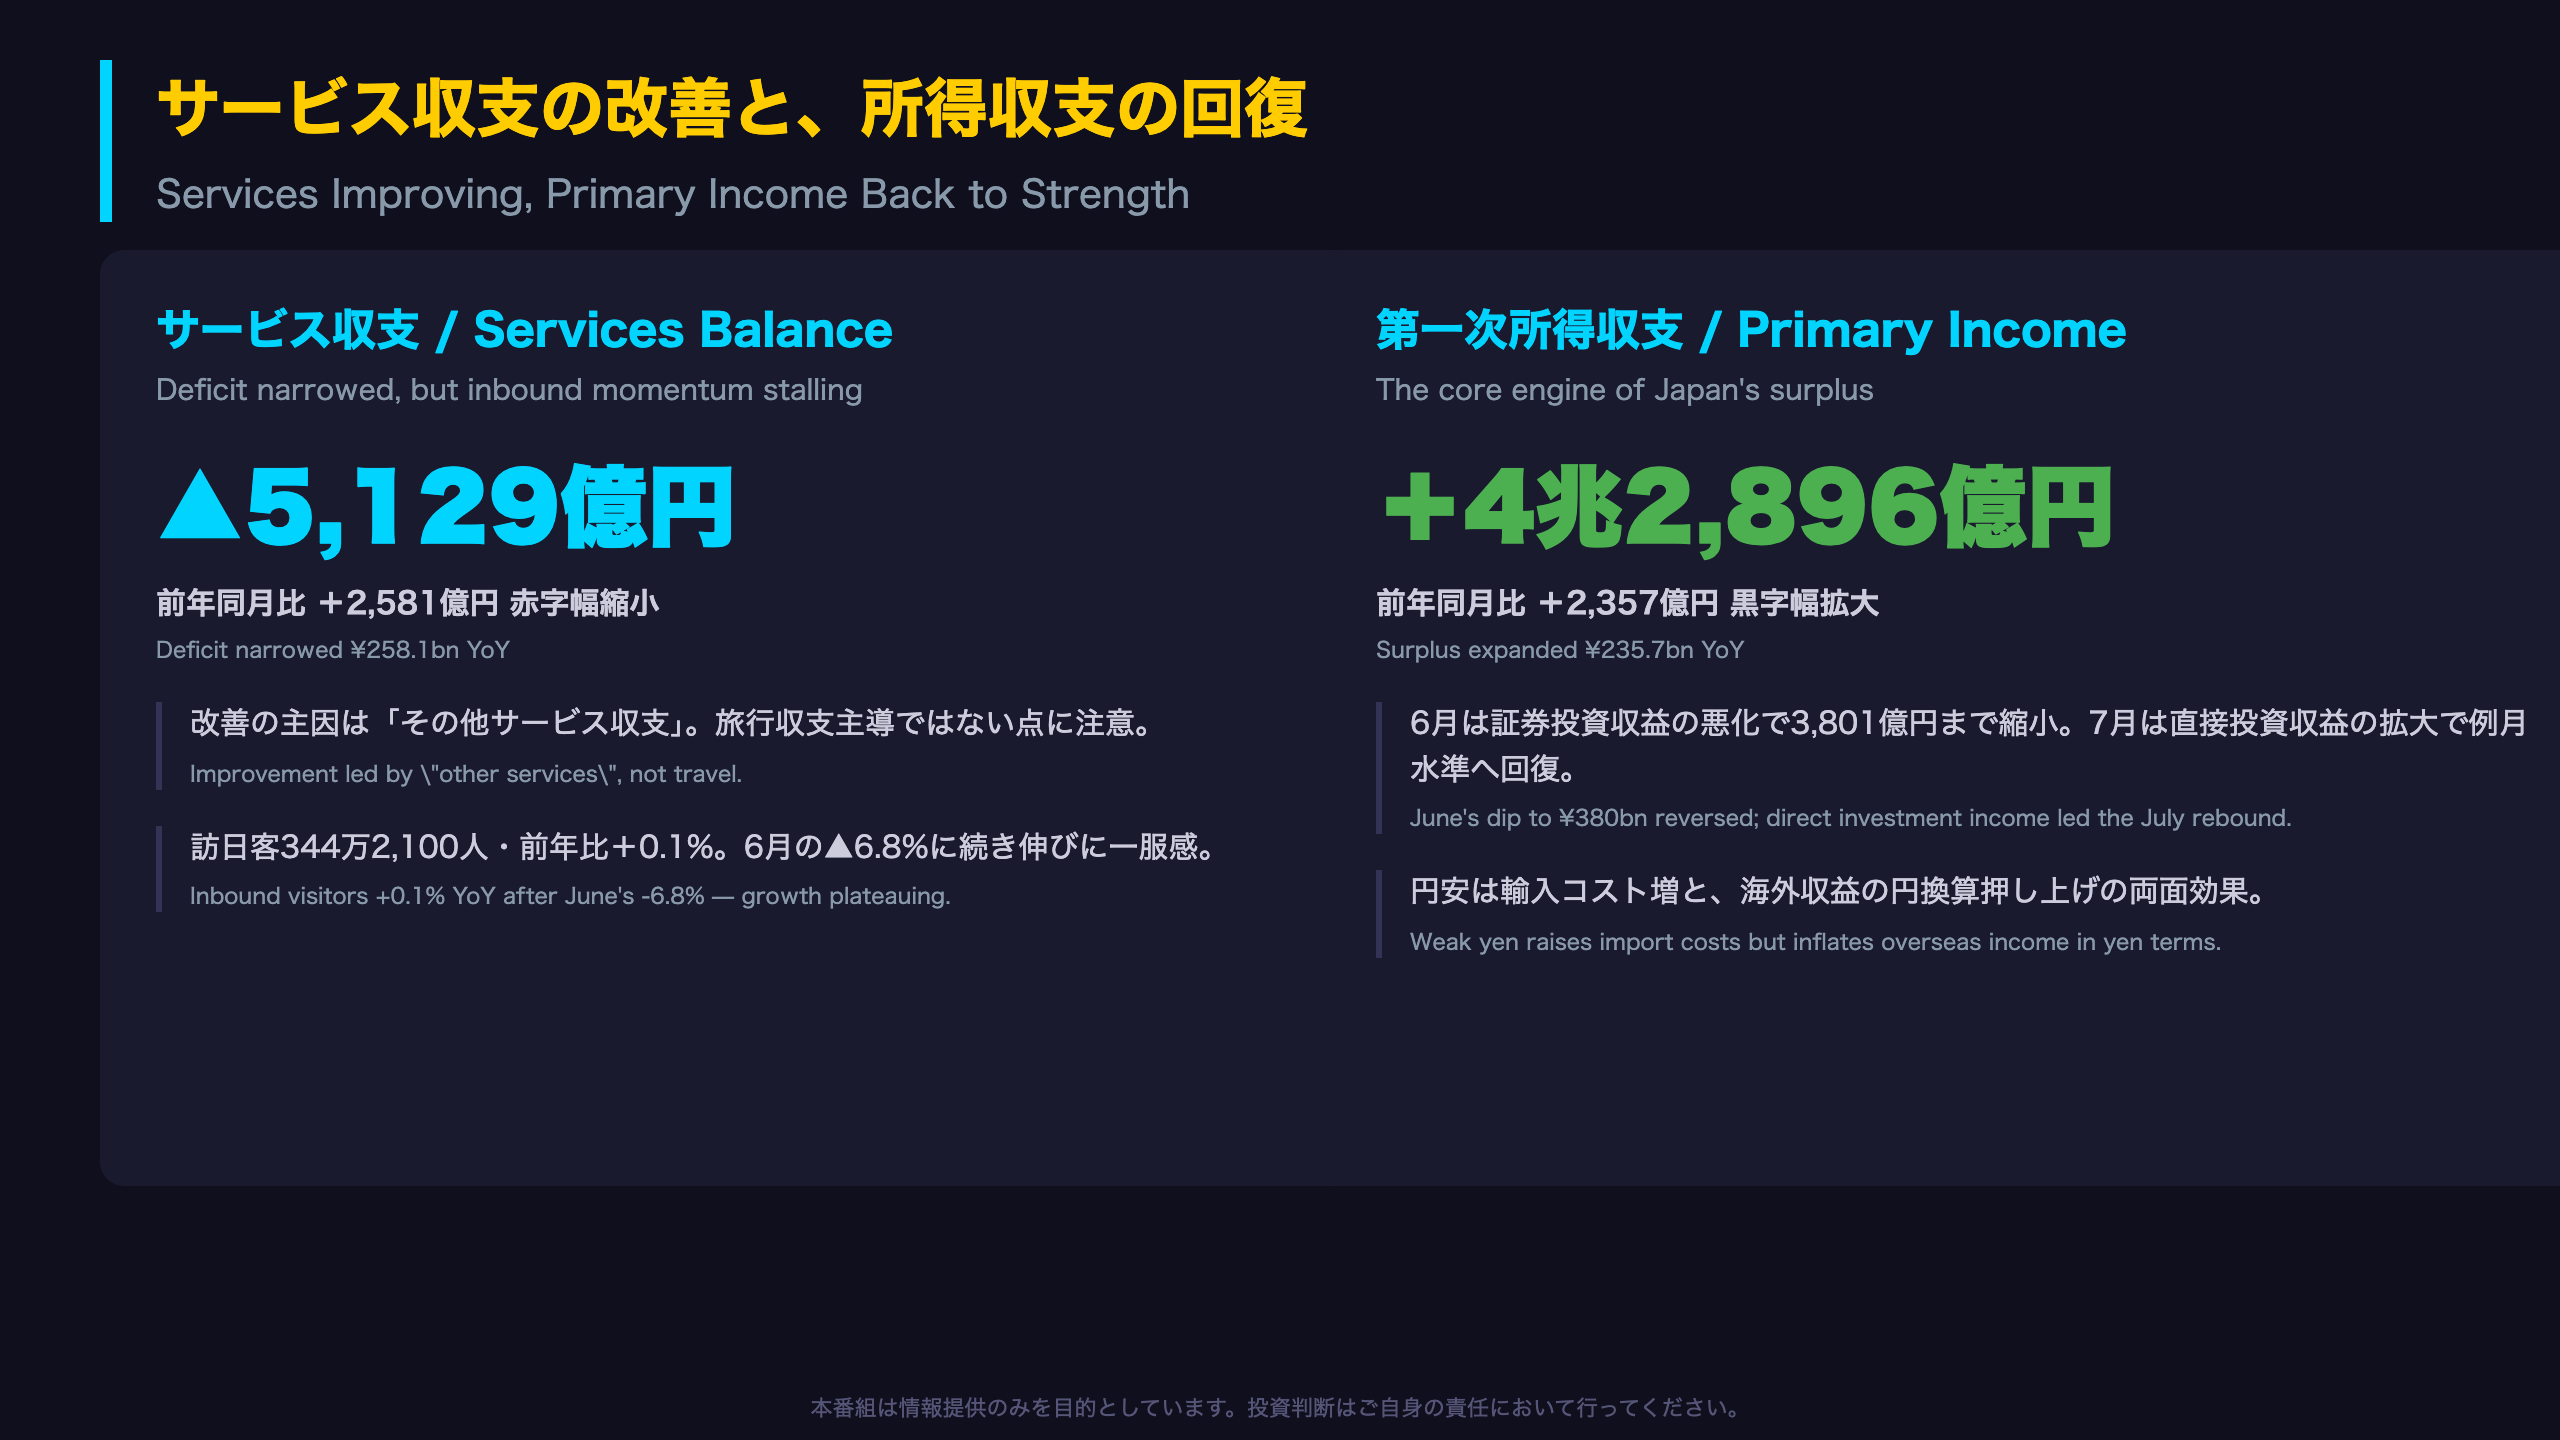
Japan’s services deficit shrank ¥258.1bn YoY to ¥512.9bn. The MOF attributes this to \”other services\” — the category that includes Japan’s much-discussed \”digital deficit\” (payments to foreign cloud, software, and streaming providers). Improvement here is notable because this line has been a persistent structural drag.
Inbound tourism plateau
Foreign visitors to Japan totaled 3,442,100 in July, up just 0.1% YoY, following June’s -6.8% decline (data from JNTO, Japan’s national tourism organization). Two consecutive months of stalled growth suggest the post-pandemic inbound boom — a key services-account tailwind — may be maturing. The absolute level remains historically high, so this is deceleration, not decline.
Primary income: back to full strength
Primary income — Japan’s equivalent of a sovereign dividend stream — rebounded from June’s anomalous ¥380.1bn to ¥4.29tn, expanding ¥235.7bn YoY on direct investment income. For non-Japan specialists: this line reflects earnings on Japan’s roughly ¥470tn+ net international investment position, the world’s largest. Unlike the US, which runs an income surplus despite being a net debtor, Japan’s income surplus is straightforwardly asset-driven.
Investor takeaway
The income cushion means Japan’s external position remains fundamentally solid even when trade deteriorates. However, income surpluses are largely reinvested abroad, generating less spot yen demand than trade surpluses — a structural reason yen weakness can persist alongside large current account surpluses.
金融収支:海外マネーが日本株・債券へ回帰、フローは流入へ反転
The Financial Account: A Dramatic Flow Reversal
Foreign flows into Japan, month over month
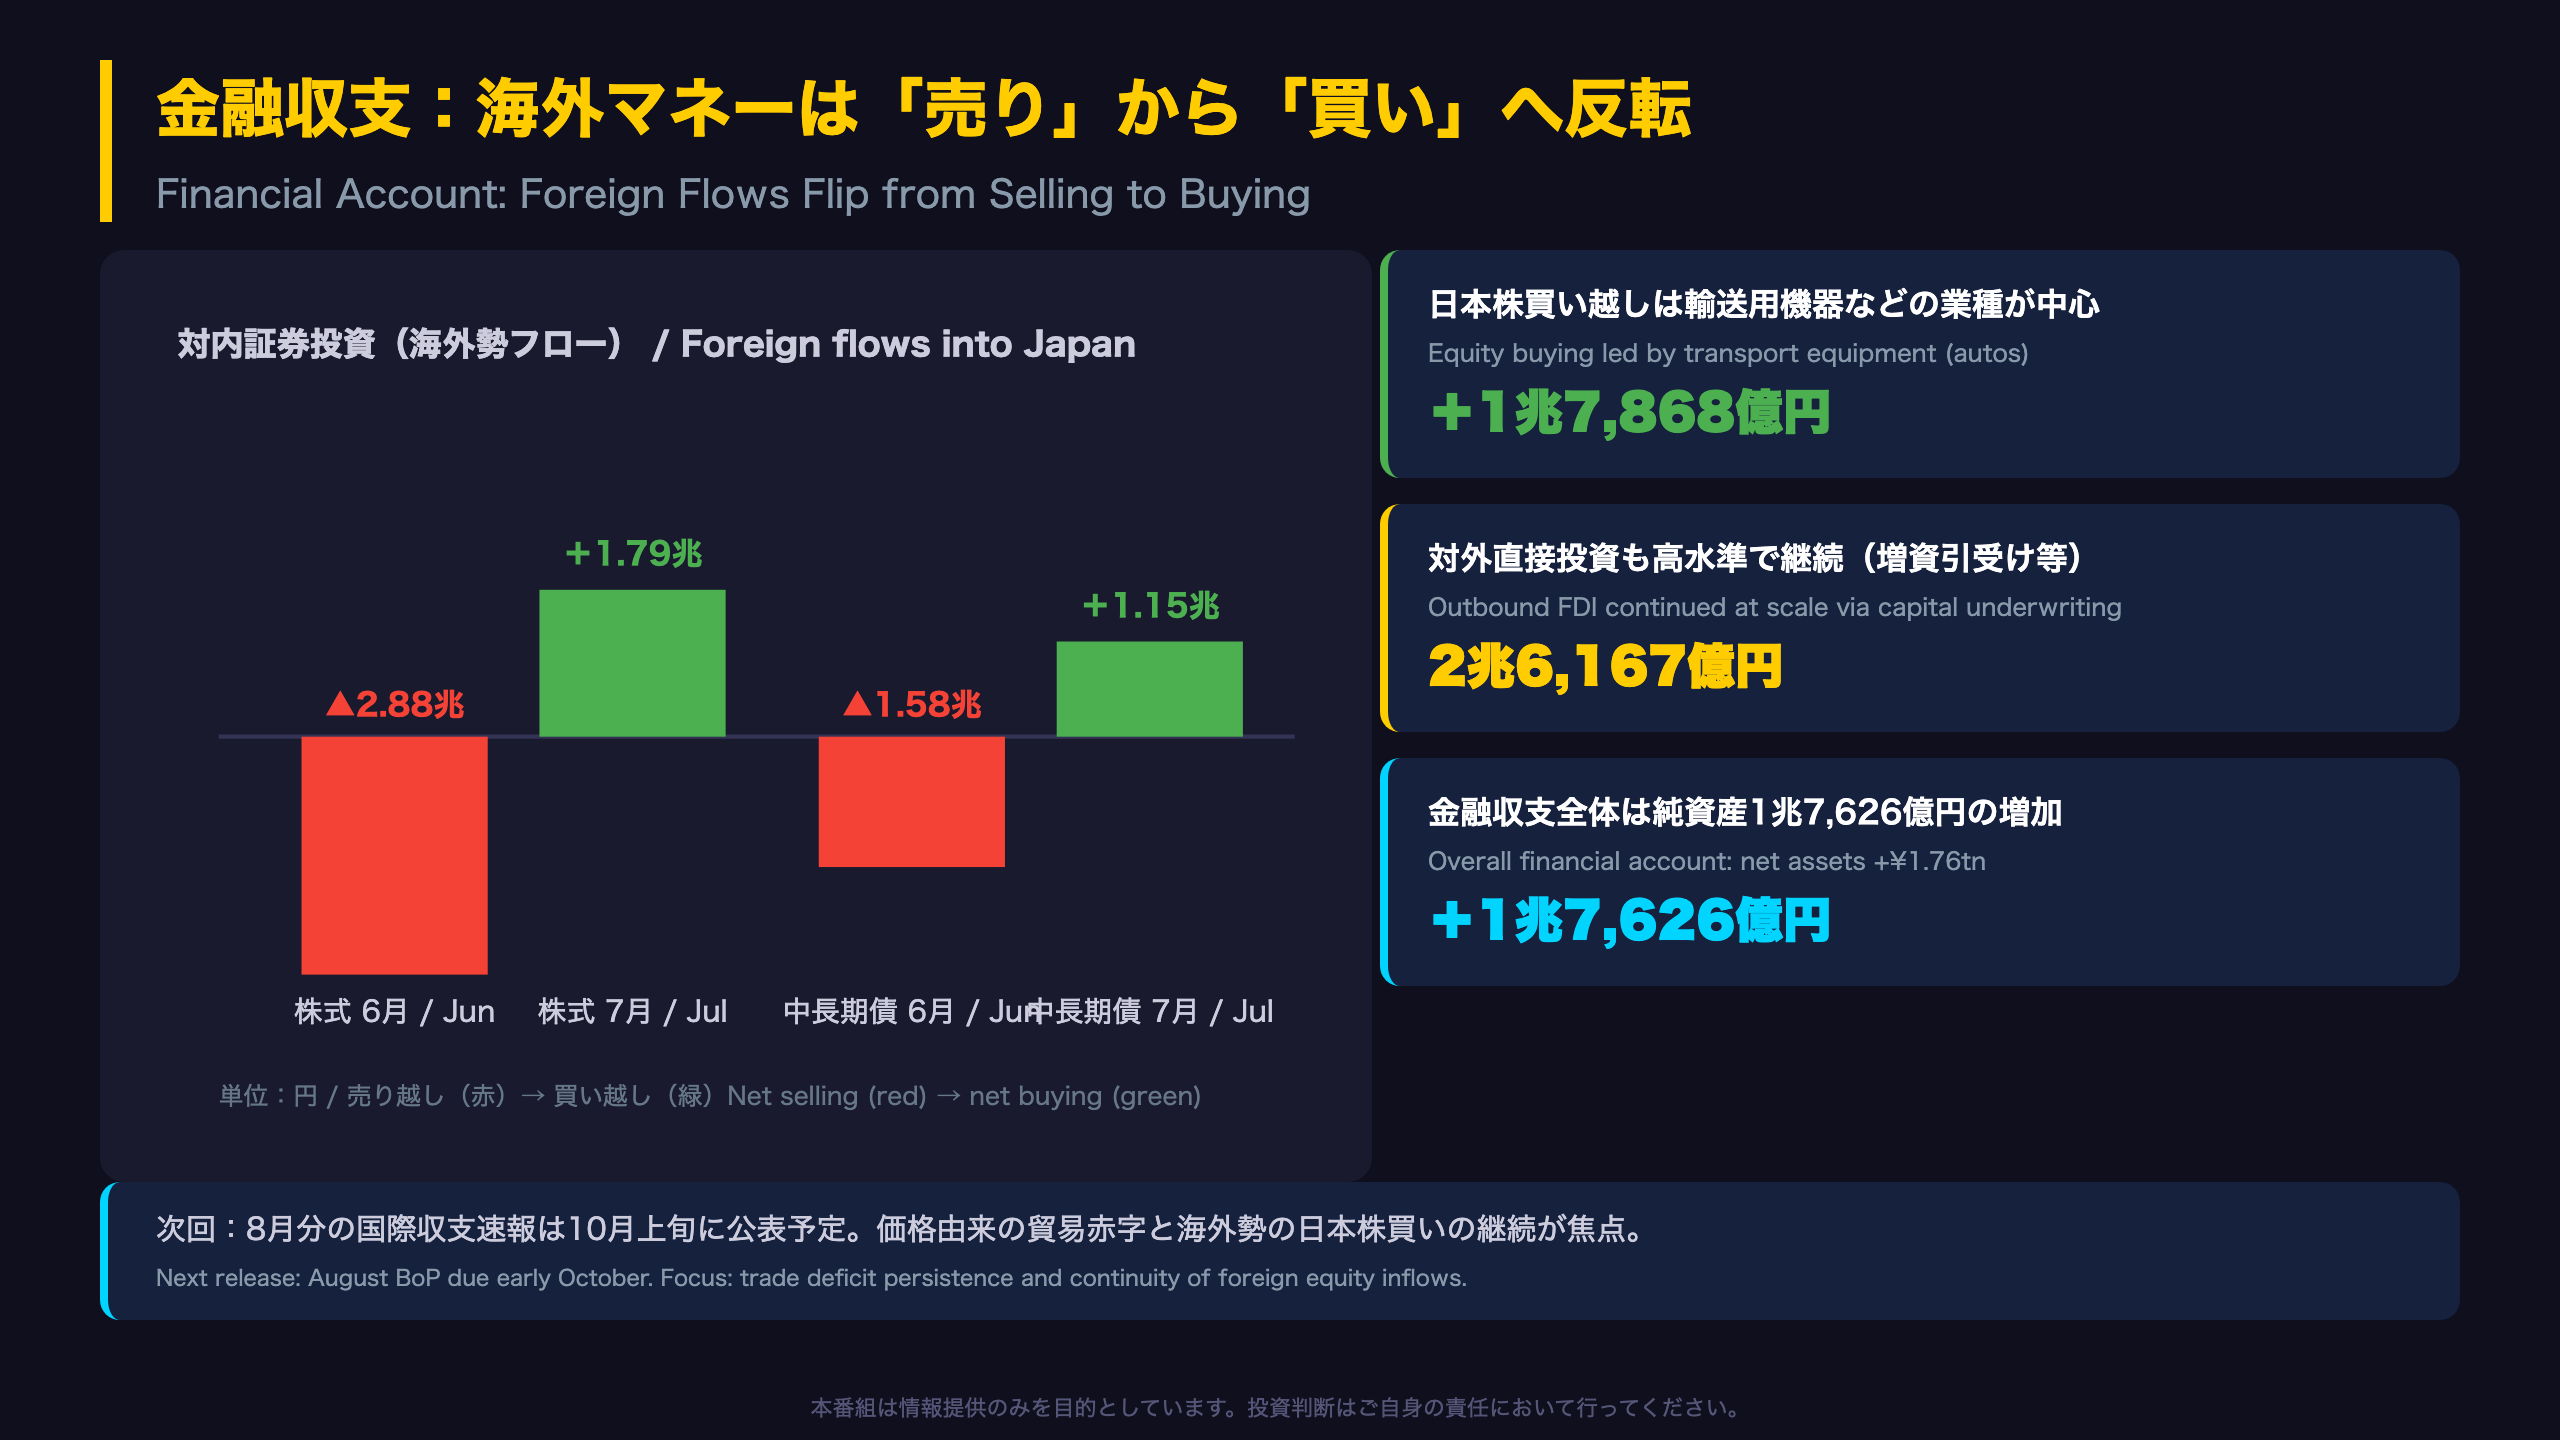
- Japanese equities: June net selling of ¥2.88tn → July net buying of ¥1.79tn
- Medium/long-term bonds: June net selling of ¥1.58tn → July net buying of ¥1.15tn
That is a swing of roughly ¥4.6tn in equity flows in a single month. In June, foreigners dumped electrical machinery stocks and JGBs; in July, the MOF reports net buying concentrated in \”transport equipment\” — Japan’s auto sector — and \”other bonds.\” For global investors, Japan’s balance of payments provides one of the cleanest official records of cross-border portfolio flows, published monthly with sector color.
Japanese money still going abroad
Outbound FDI continued at ¥2.62tn (after ¥2.41tn in June), driven by Japanese firms underwriting capital increases at overseas companies. This sustained outbound investment is precisely what feeds the primary income surplus discussed earlier — Japan keeps converting trade competitiveness of the past into a global asset portfolio.
Two readings
Bullish: renewed foreign demand for yen assets supports Japanese equities and caps JGB yield pressure. Cautious: portfolio flows are notoriously volatile month to month; one month of inflows after one month of outflows establishes no trend. Watch for confirmation over the next two to three releases.
Next up
The August preliminary BoP is due in early October. Key watch items: whether oil base effects ease the price-driven trade deficit, whether foreign equity buying persists, and whether the inbound tourism plateau starts to weigh on the travel balance.
Disclaimer: This article is for informational purposes only. All investment decisions are made solely at your own risk.