
📺 Watch the Full Video Analysis
This article was automatically generated by the NFC Market Live AI analysis system. (Updated: 2026-09-05 07:14 JST)
📄 Primary Source
米国労働省(DOL)— 新規失業保険申請件数
https://www.dol.gov/newsroom/releases/eta/eta20260903
米国エネルギー情報局(EIA)— 週間石油状況レポート
https://www.eia.gov/petroleum/supply/weekly/pdf/highlights.pdf
連邦準備制度理事会(FRB)— H.4.1 バランスシート
https://www.federalreserve.gov/releases/h41/current/h41.htm
📊 This week’s three key US macro reports, explained.
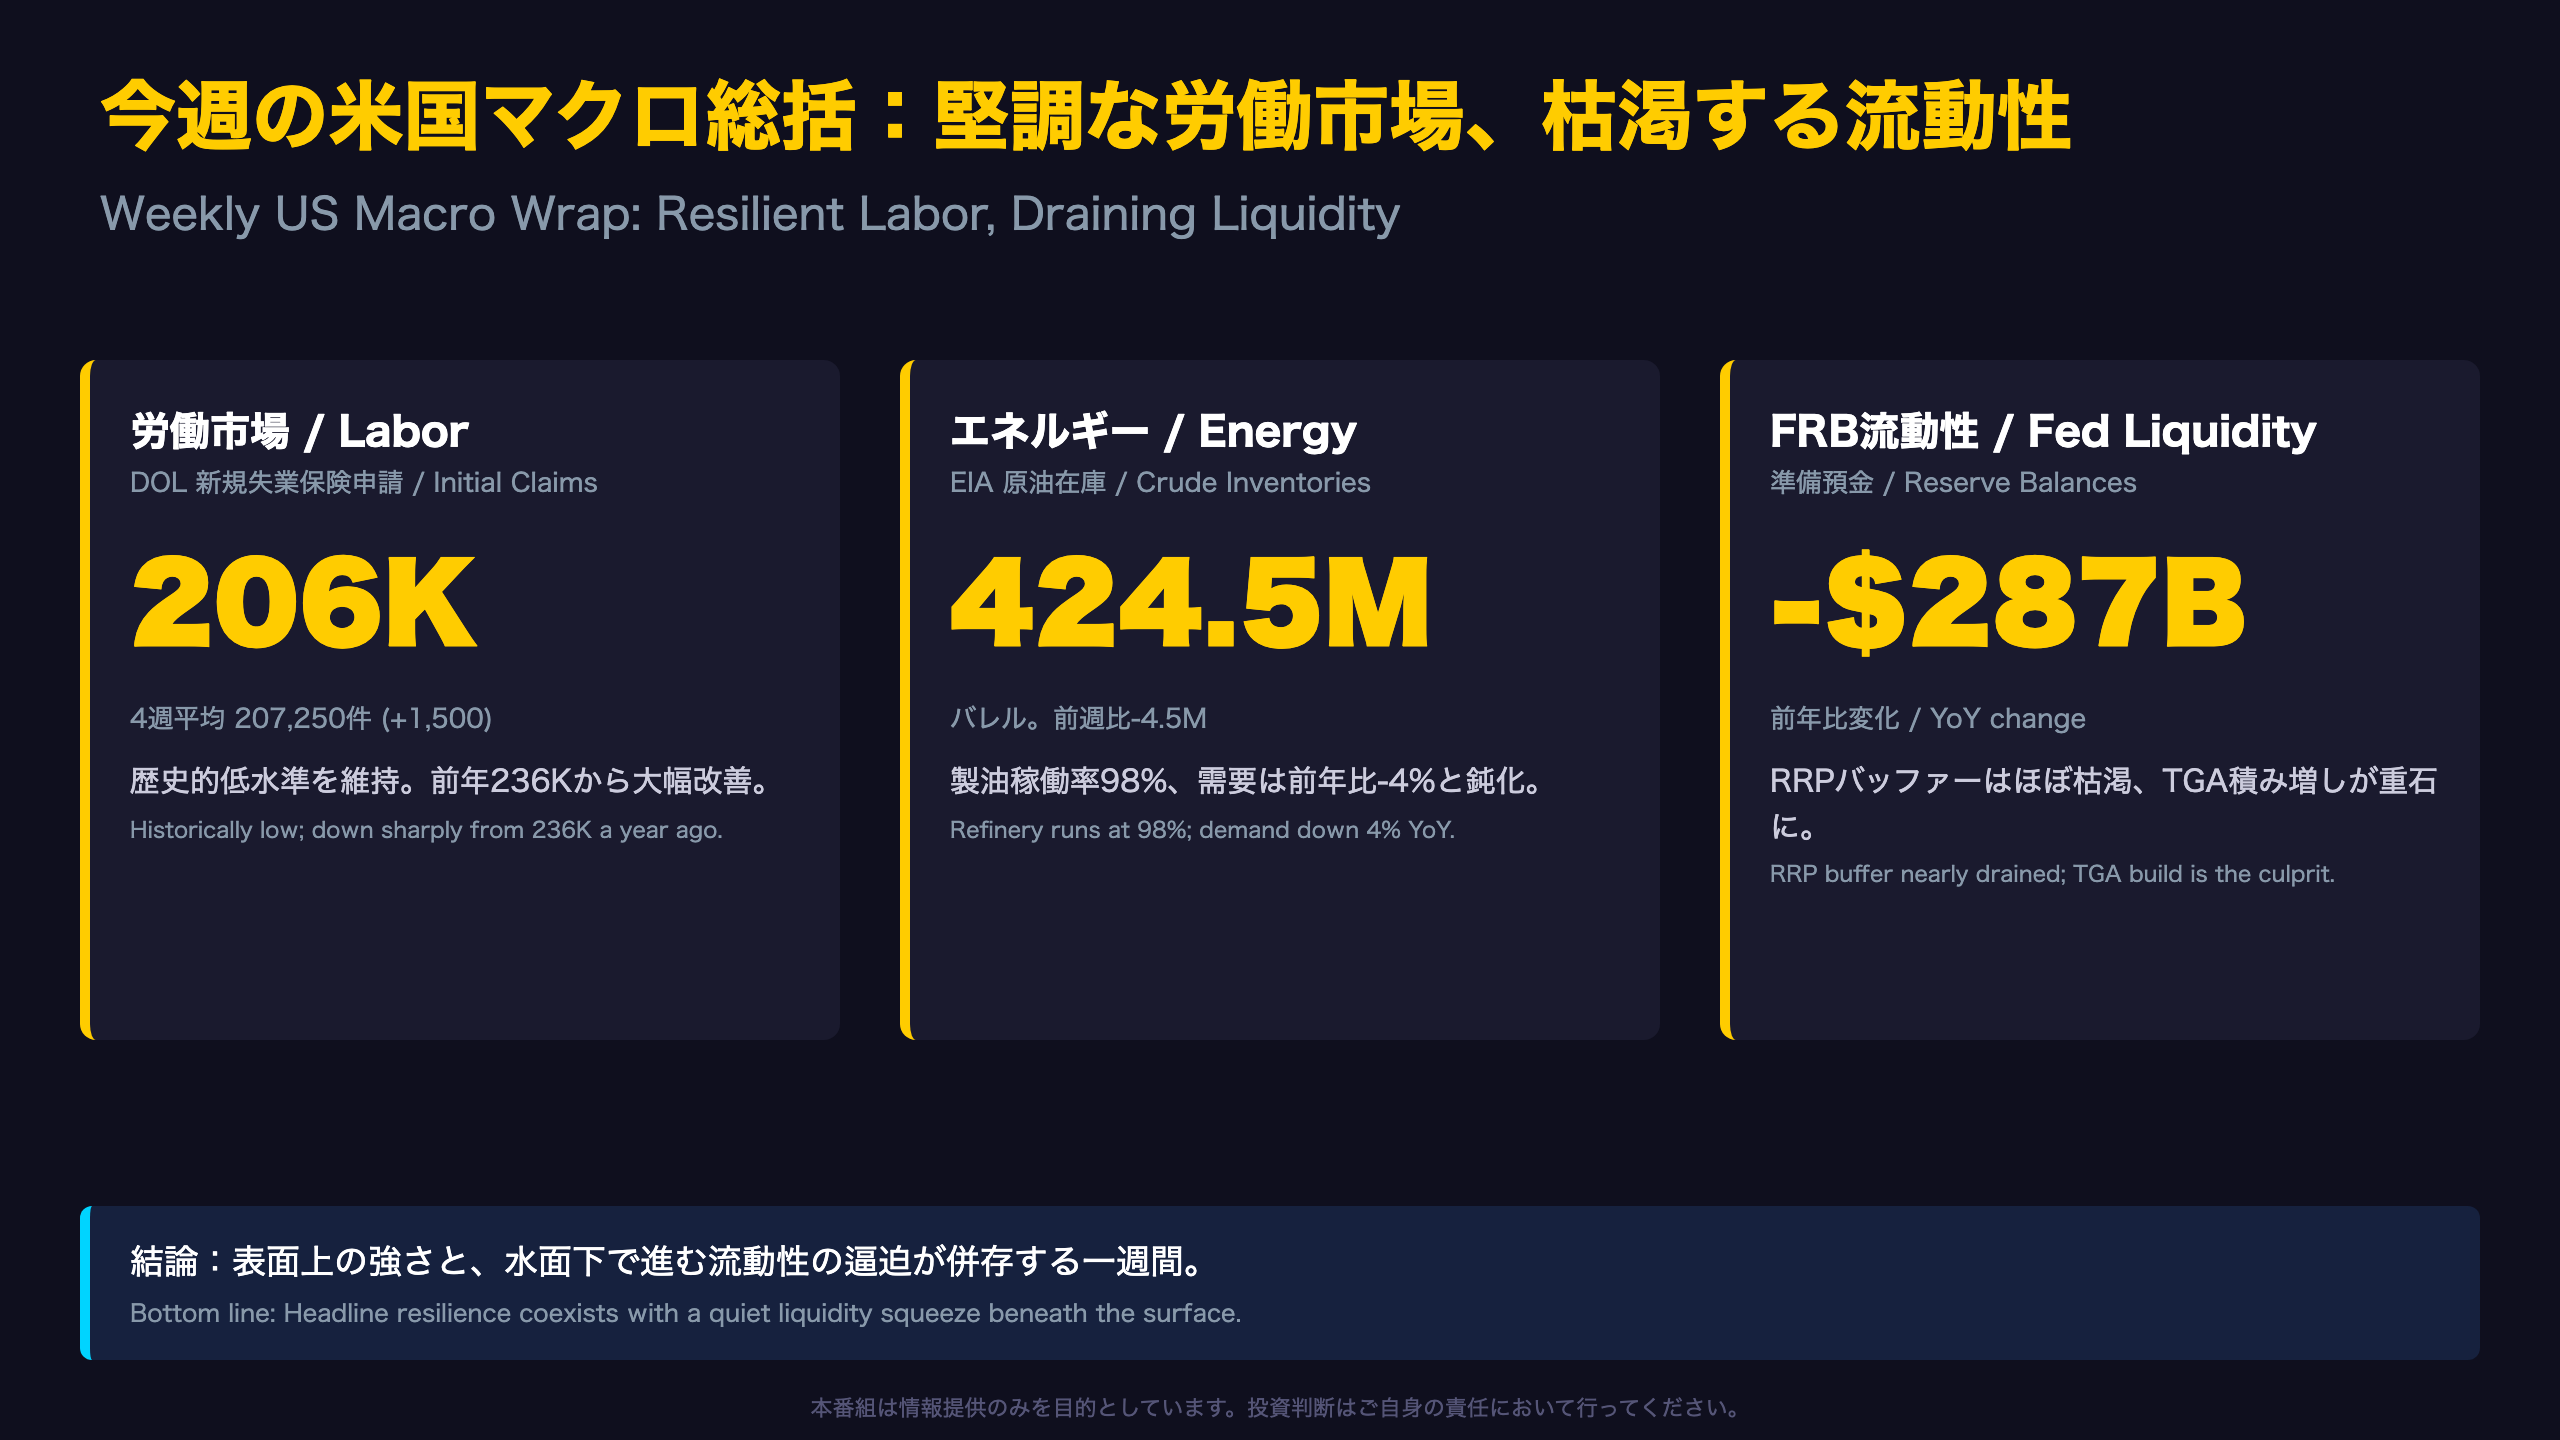
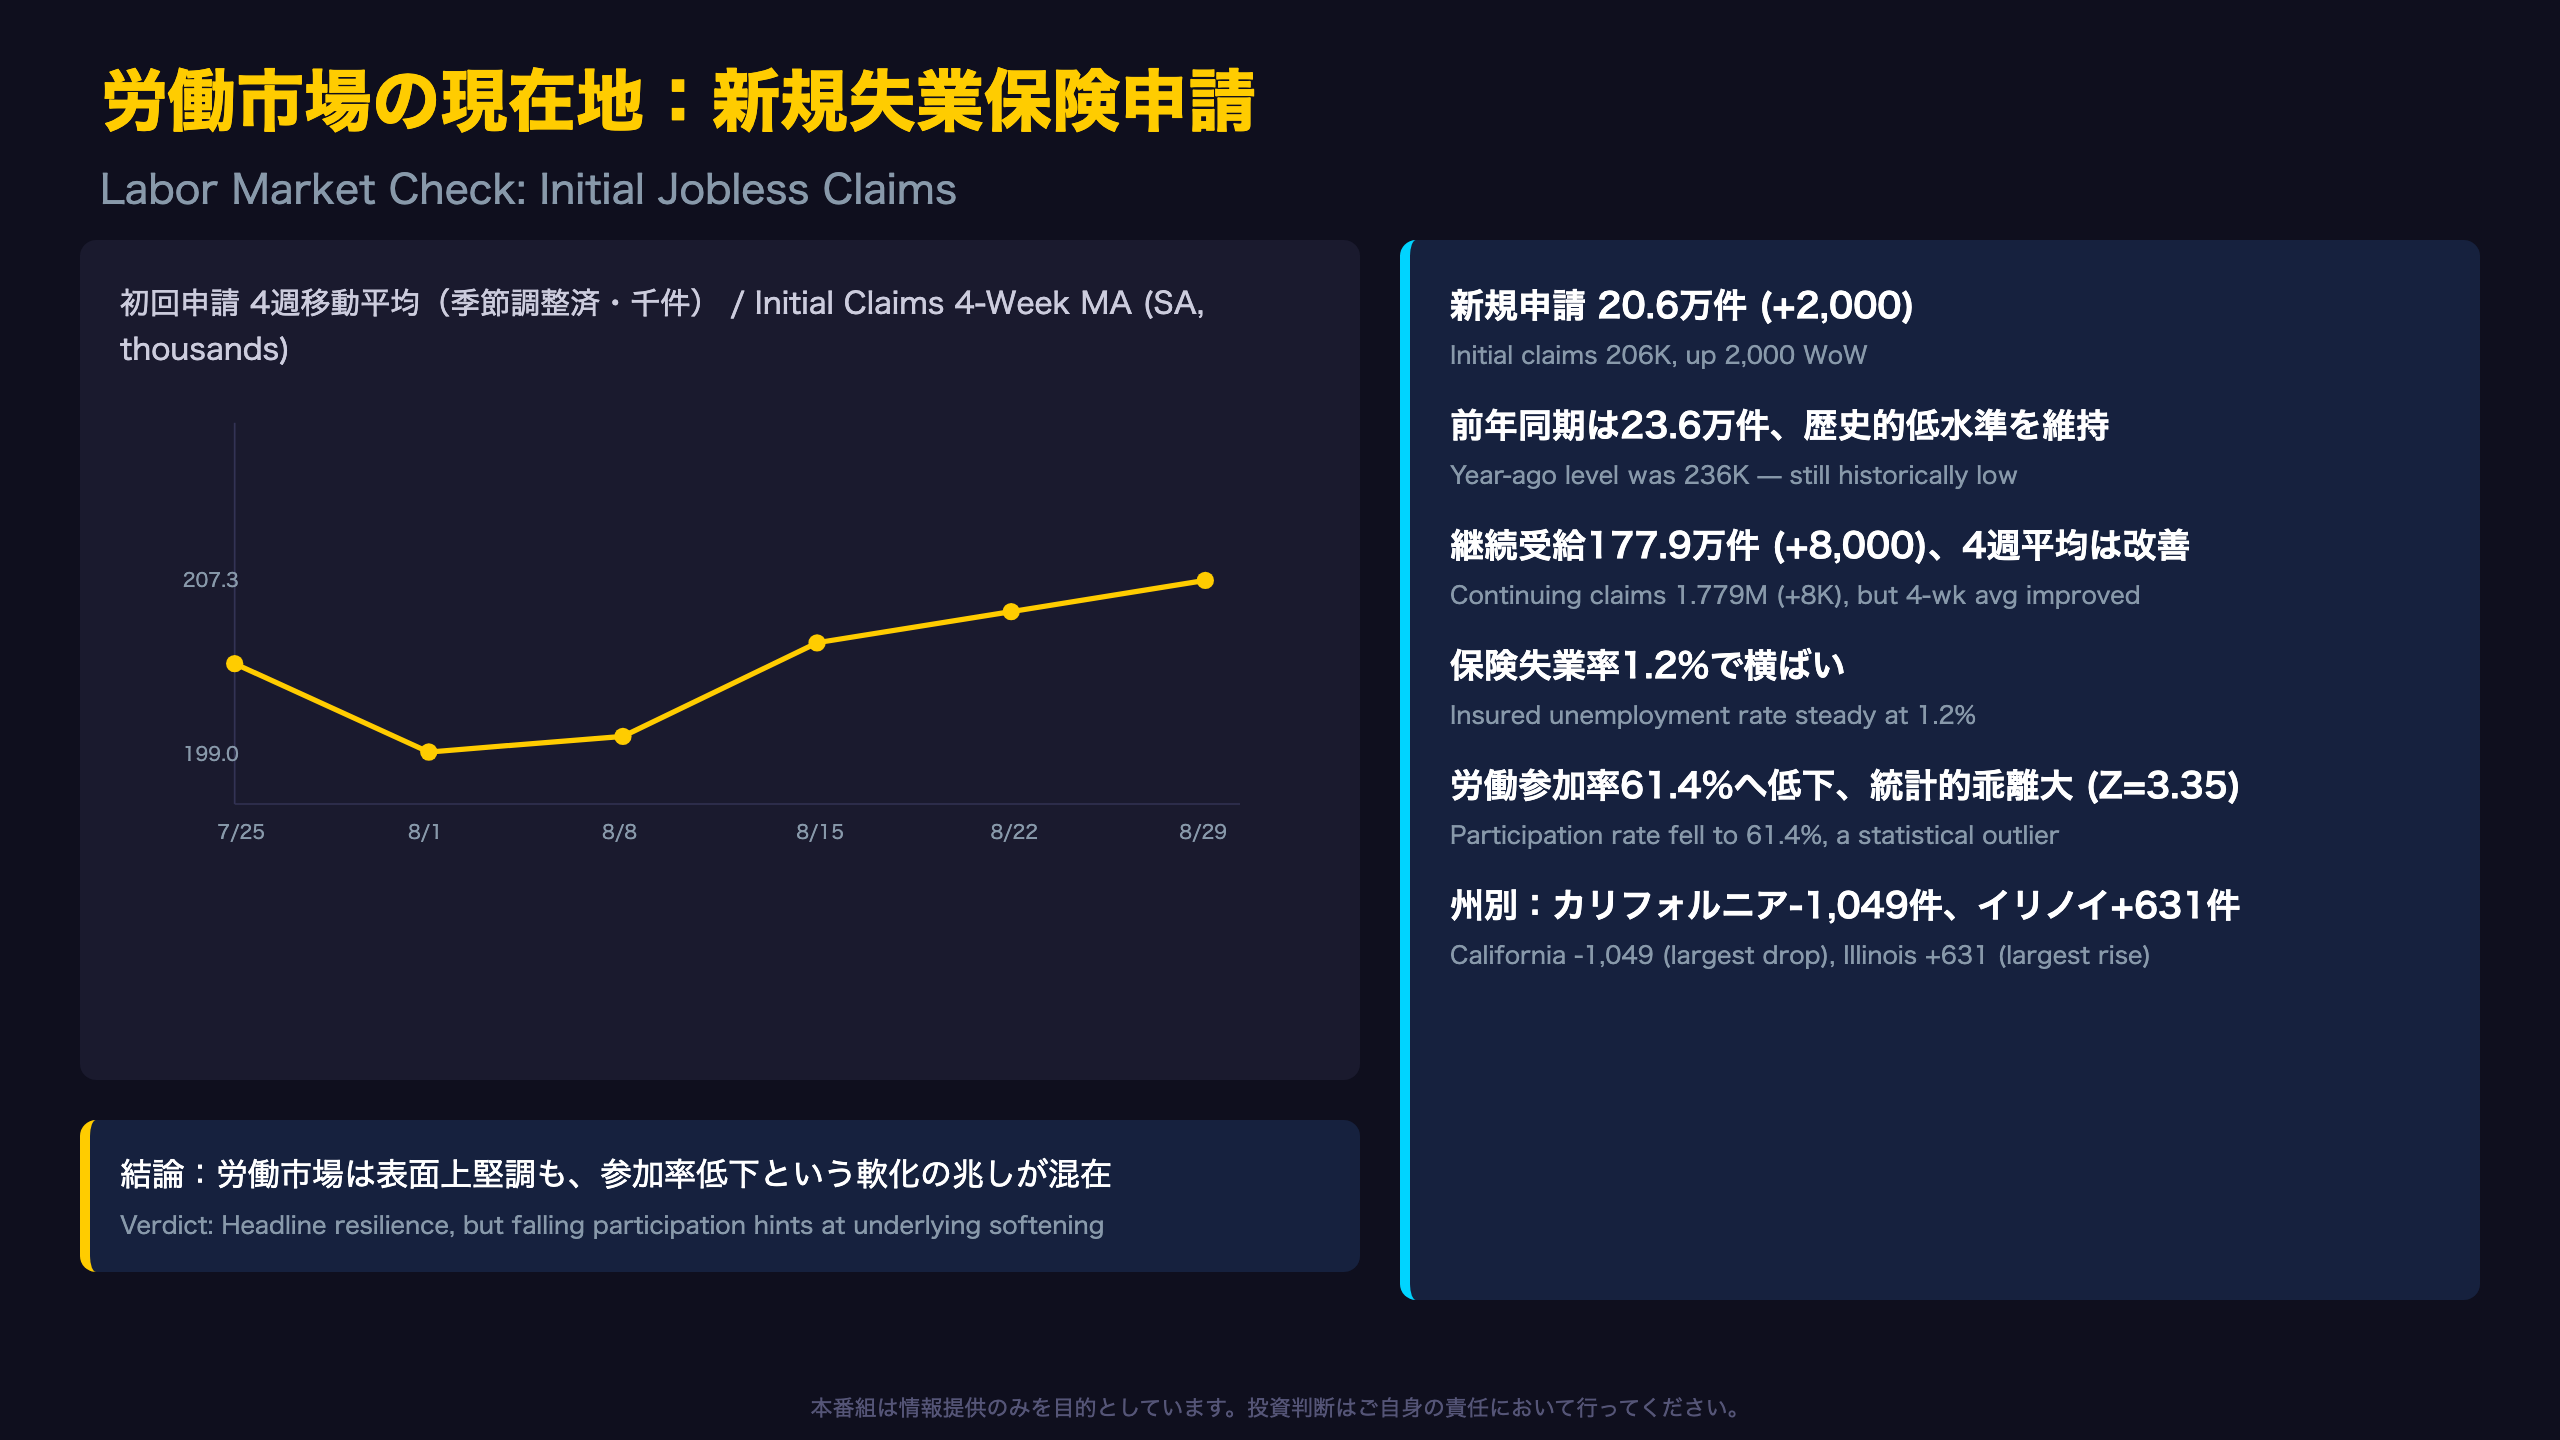
Initial jobless claims held at a historically low 206,000, signaling labor market resilience. 📈
But the Fed’s overnight reverse repo buffer has drained to just $525 million weekly, while Treasury’s cash rebuild squeezed bank reserves by $287 billion year-over-year. ⚠️
Energy supply stayed firm even as demand softened 4% YoY. 💡
Labor, energy, and liquidity — three crosscurrents investors should watch heading into next week.
今週のアルティメット・サマリー
Reading the Week: Three US Macro Reports in Context
Each Thursday, the U.S. Department of Labor (DOL) releases jobless claims data, the Energy Information Administration (EIA) publishes its Weekly Petroleum Status Report, and the Federal Reserve Board issues its H.4.1 balance sheet release. Together they offer a real-time cross-section of labor, energy, and monetary conditions — arguably the closest thing to a weekly \”vital signs\” check on the U.S. economy.
Institutional context: The H.4.1 release is the Fed’s most granular weekly disclosure of its System Open Market Account (SOMA) holdings and reserve liabilities. Unlike an FOMC statement, it carries no explicit policy signal — but it reveals the mechanical plumbing of quantitative tightening (QT) in real time.
What stands out this week: Initial claims (206,000) remain far below year-ago levels (236,000). Yet the Fed’s overnight reverse repo \”Others\” category — the facility that absorbed over $2 trillion in excess liquidity in 2022-23 — has shrunk to a weekly average of just $525 million, down $53.4 billion year-over-year. That buffer is functionally exhausted.
Market implication: With RRP nearly gone, further Treasury General Account (TGA) rebuilding competes directly with bank reserves for funding — a dynamic reminiscent of September 2019’s repo market stress, though no funding-market dislocation is evident in this data set yet.
労働市場の現在地(DOL詳細)
Beyond the Headline: What Weekly Jobless Claims Don’t Capture
The DOL’s weekly claims report is one of the most closely watched high-frequency indicators in U.S. macro, because unlike monthly nonfarm payrolls, it arrives every Thursday with minimal lag. But claims only capture people who file for benefits — they say nothing about people who stop looking for work altogether.
The participation rate signal: According to our quantitative regime model, the U.S. labor force participation rate has fallen to 61.4%, a reading that is a statistical outlier (Z-score 3.35) relative to the \”resilient economy\” regime the model currently assigns to the U.S. This divergence echoes the debate seen in the UK and Eurozone about \”hidden slack\” in labor markets that doesn’t show up in headline unemployment rates.
State dispersion: The states with the highest insured unemployment rates — New Jersey and Puerto Rico (2.6%), Rhode Island (2.2%), and Massachusetts (2.1%) — are concentrated on the East Coast, suggesting regional rather than nationwide stress.
Government payrolls: Government employment fell by 53,000 in the latest monthly reading, a sharp divergence (Z-score 2.62) from the regime average of +24,865, aligning with ongoing federal workforce reduction headlines.
Caveat: These are single-indicator, single-month signals requiring several more months of confirming data before drawing firm structural conclusions.
エネルギー需給の現在地(EIA詳細)
Reading US Energy Data Through a Seasonal Lens
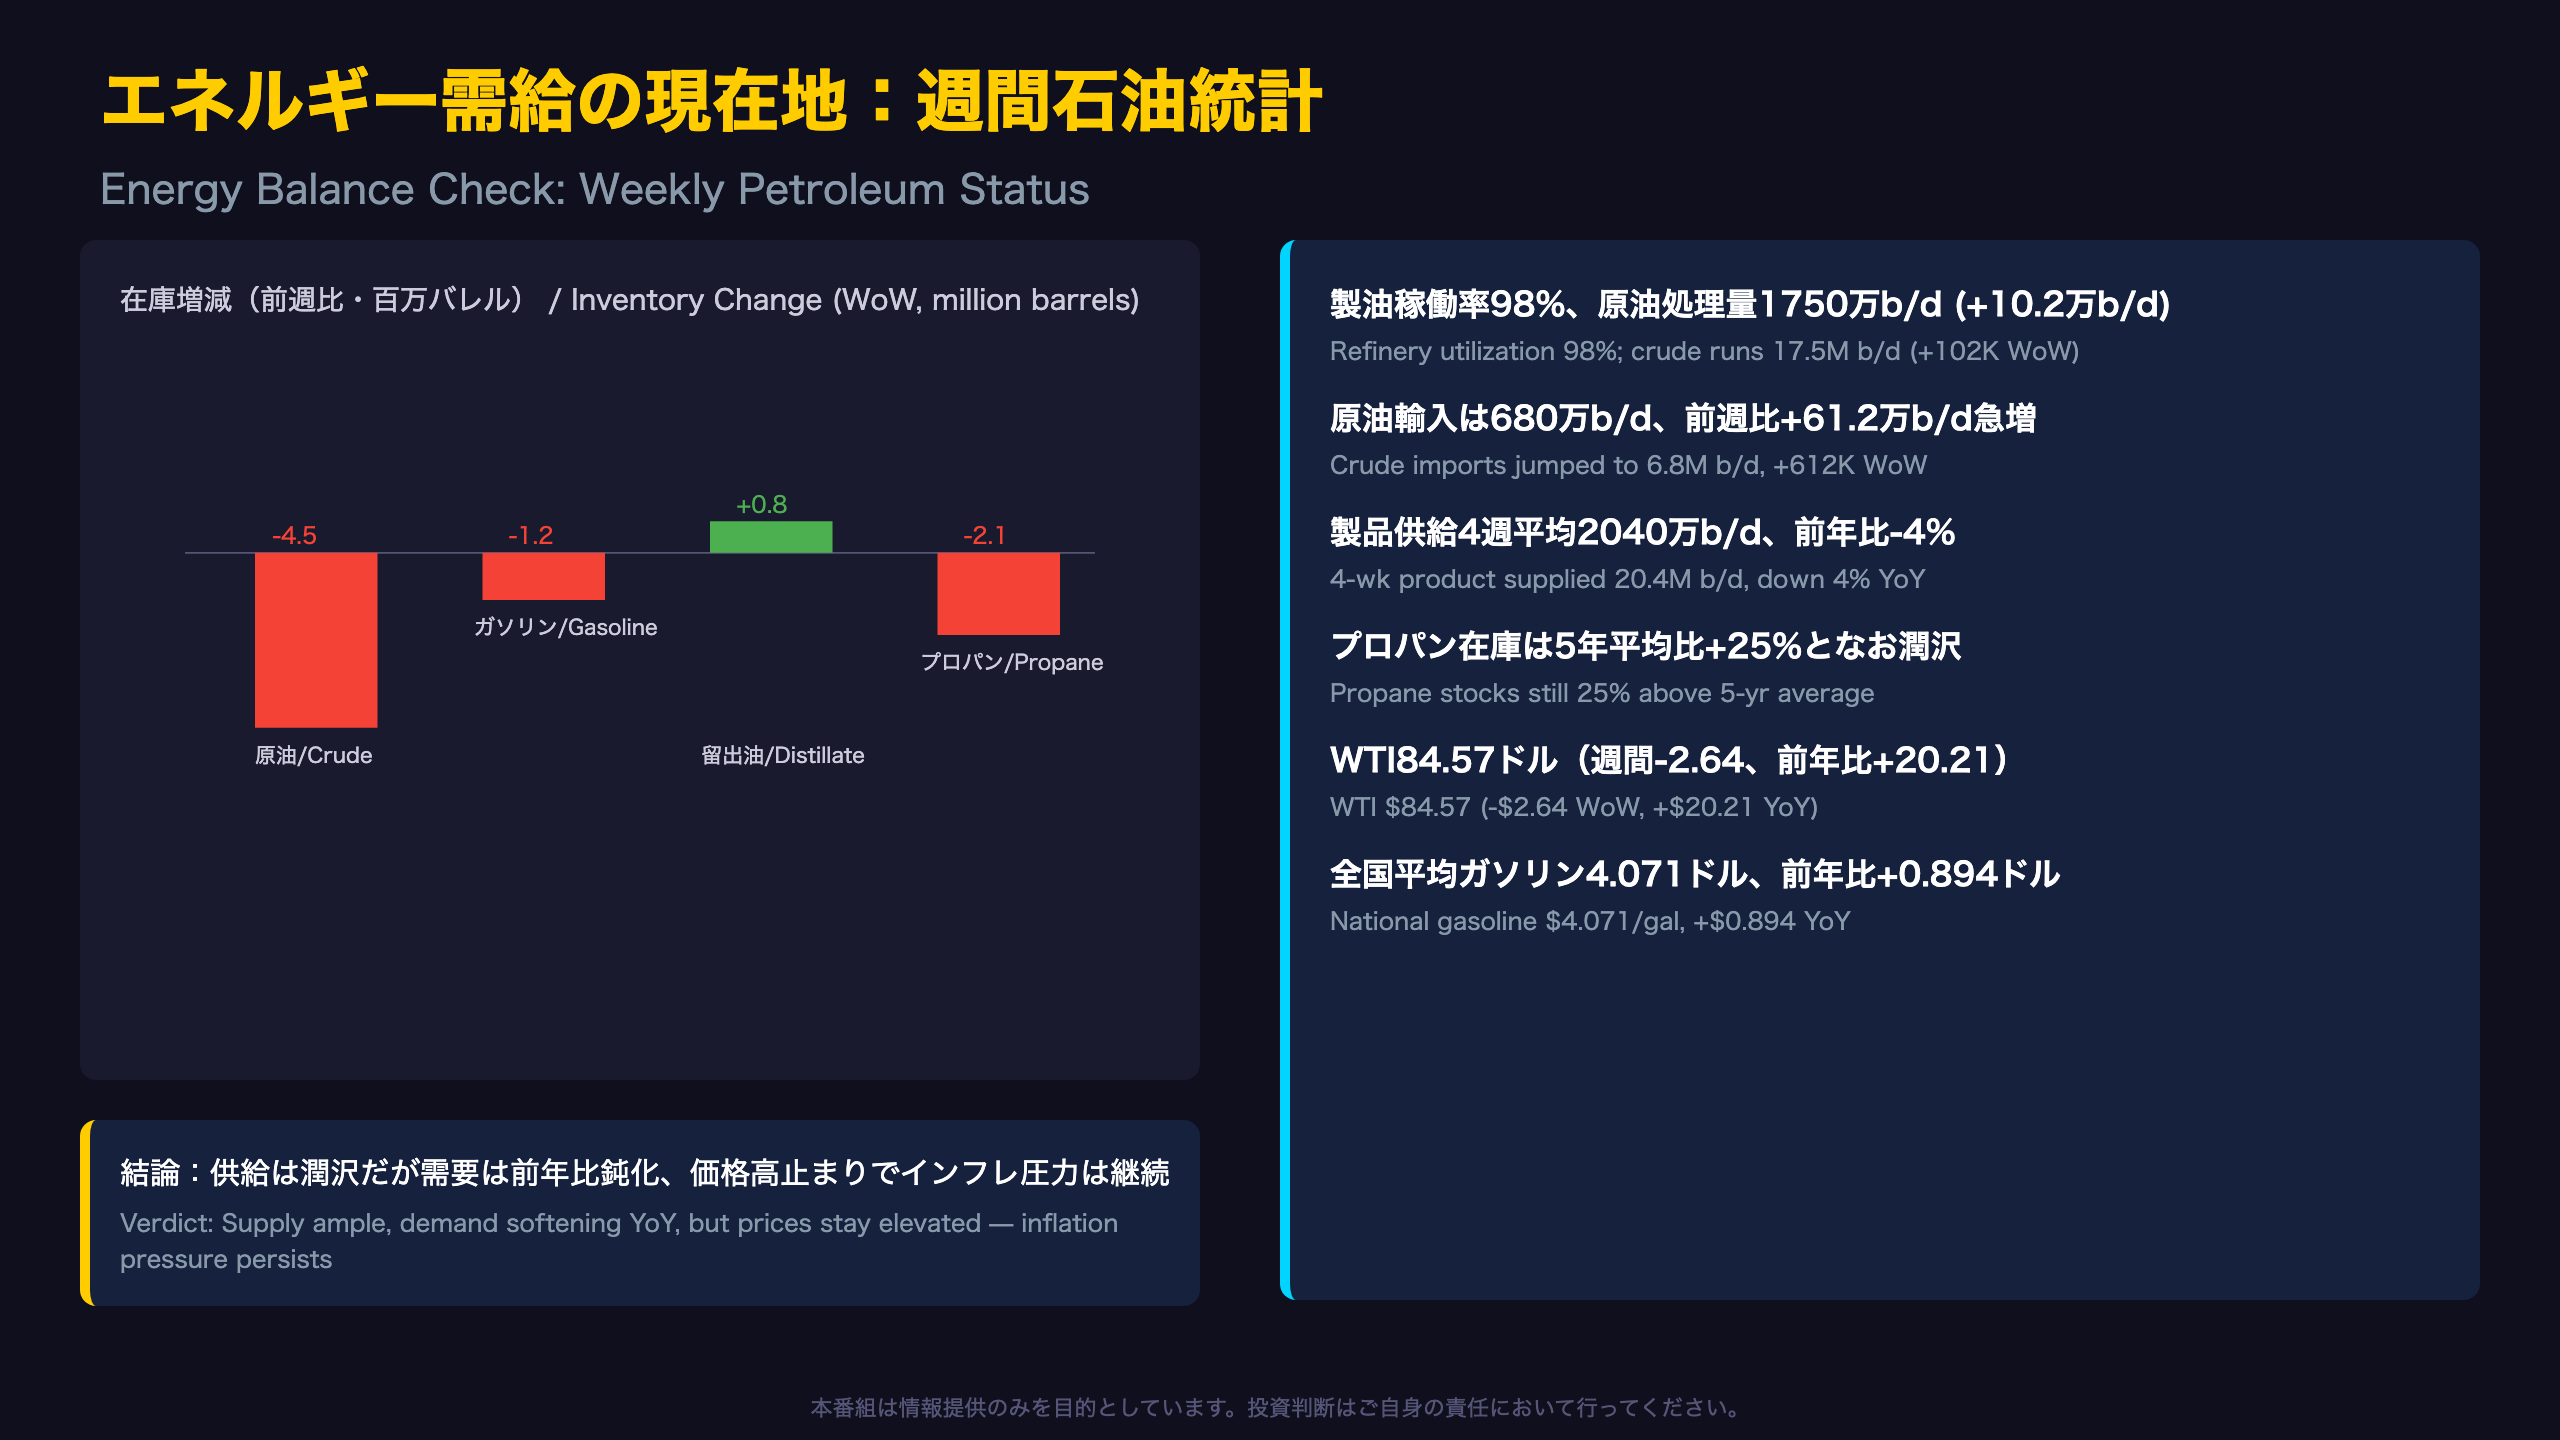
Late August marks the tail end of the U.S. summer driving season, when gasoline demand typically peaks and begins to ease. This week’s 1.2-million-barrel drawdown in gasoline stocks should be read partly through that seasonal lens rather than as a pure demand signal.
Propane tells a different story: Propane/propylene inventories fell 2.1 million barrels on the week but remain a striking 25% above their five-year average — consistent with pre-winter stock building ahead of the heating season. This contrasts sharply with distillate fuel oil, which remains 14% below its five-year norm despite this week’s modest 800,000-barrel build.
Import surge: Crude imports jumped 612,000 b/d to 6.8 million b/d, with the four-week average now 2% above year-ago levels — a flow that eases the pace of inventory drawdowns.
Product mix (four-week year-over-year): Gasoline -2%, distillate -6%, jet fuel -1%. The distillate decline could hint at softer trucking and industrial fuel demand, though this is a single-month reading warranting confirmation.
For international readers: Unlike Brent-based European benchmarks, WTI-Cushing pricing reflects U.S. domestic supply-demand balances directly, making this report a useful complement to OPEC+ output data when assessing global oil market direction.
FRB流動性の現在地(H.4.1詳細)
Inside the Fed’s Balance Sheet: Has QT Actually Stalled?
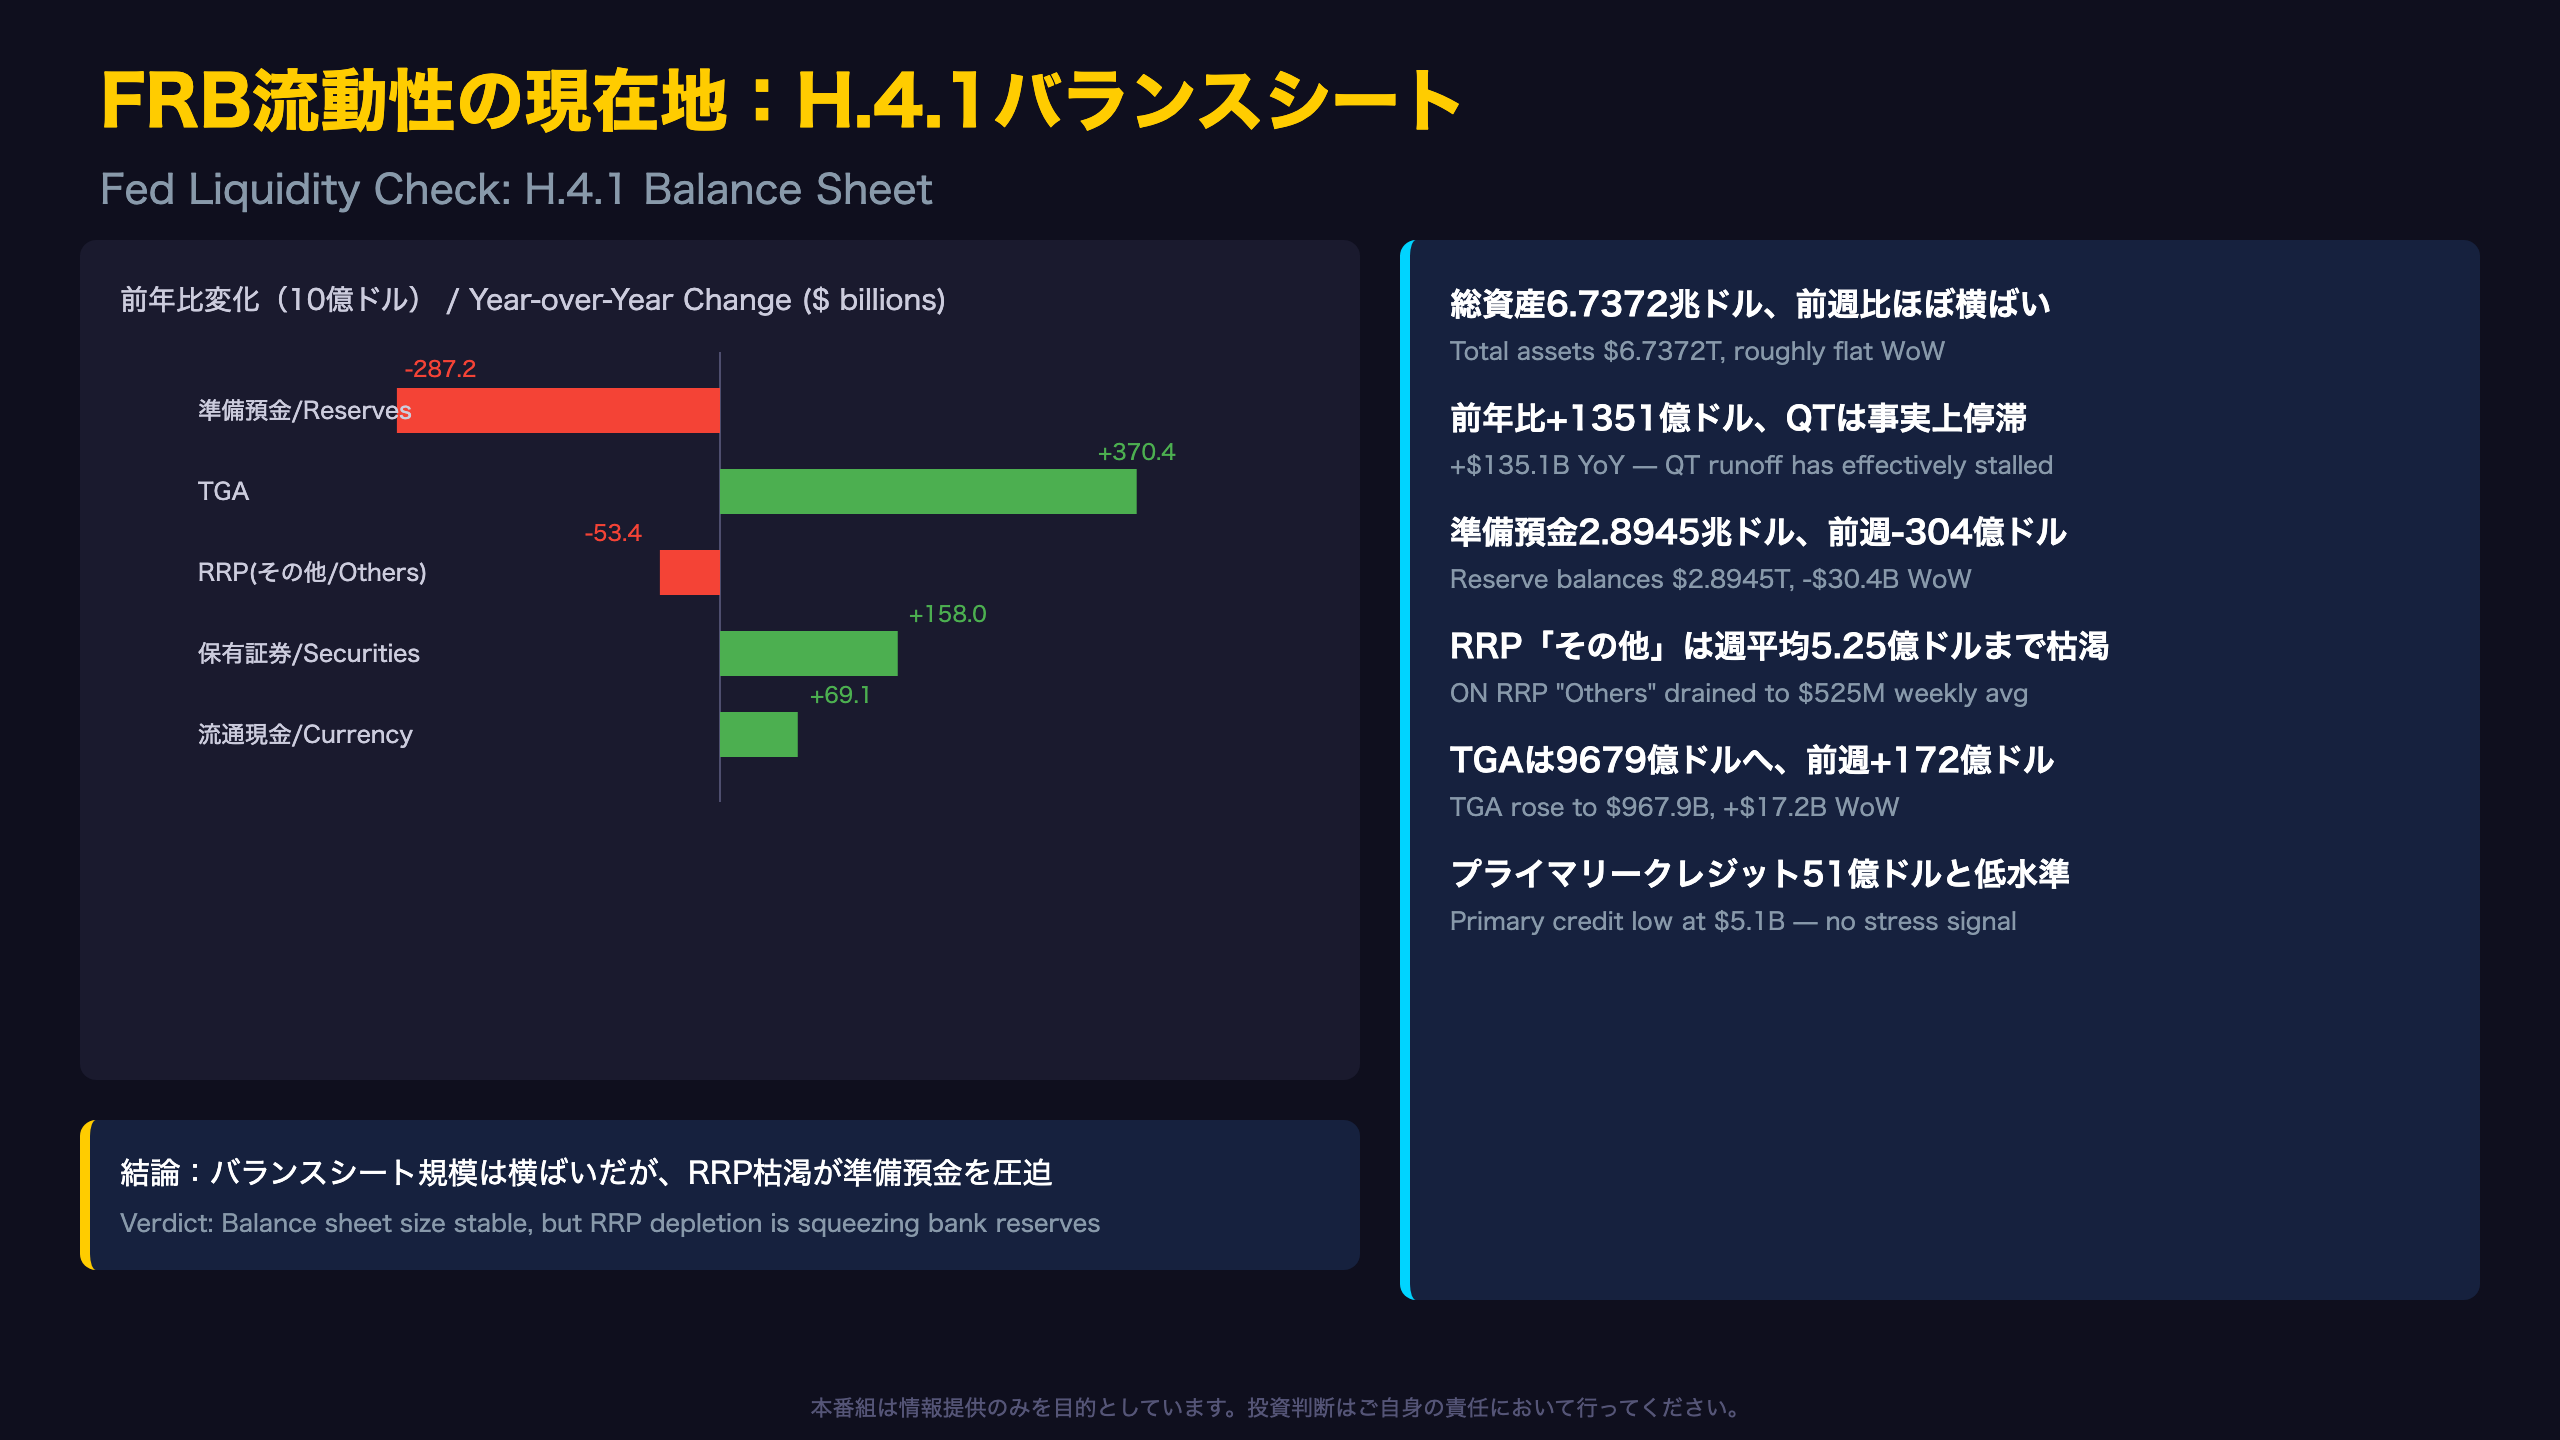
For investors used to a simple \”the Fed is shrinking its balance sheet\” narrative, this week’s H.4.1 data complicates the picture. Total assets are actually up $135.1 billion year-over-year, even as coverage continues to describe ongoing quantitative tightening (QT).
Securities composition shift: U.S. Treasury holdings rose $347.3 billion year-over-year, while mortgage-backed securities (MBS) fell $189.3 billion — consistent with the Fed allowing MBS to run off while reinvesting some proceeds into Treasuries, a dynamic worth watching similar to how the ECB’s PEPP reinvestment policy shaped European sovereign spreads in past cycles.
No funding stress — yet: Primary credit (discount window borrowing) remains low at just $5.1 billion, showing none of the sharp uptick seen during the September 2019 U.S. repo market squeeze, when overnight rates spiked and the Fed had to intervene with emergency repo operations.
The real story is the RRP buffer: The Fed’s overnight reverse repo facility’s \”Others\” category — essentially money-market fund cash parked at the Fed — has collapsed from $53.9 billion a year ago to just $525 million now. With this buffer gone, further Treasury General Account (TGA) rebuilding (up $370.4 billion year-over-year) drains bank reserves directly.
What to watch: If TGA continues rising while RRP stays near zero, upward pressure on repo rates (SOFR) could emerge, historically a dynamic that has forced the Fed to adjust runoff pace or expand standing repo facility (SRF) usage.
ストラテジスト総括:3指標の連関と来週の注目シナリオ
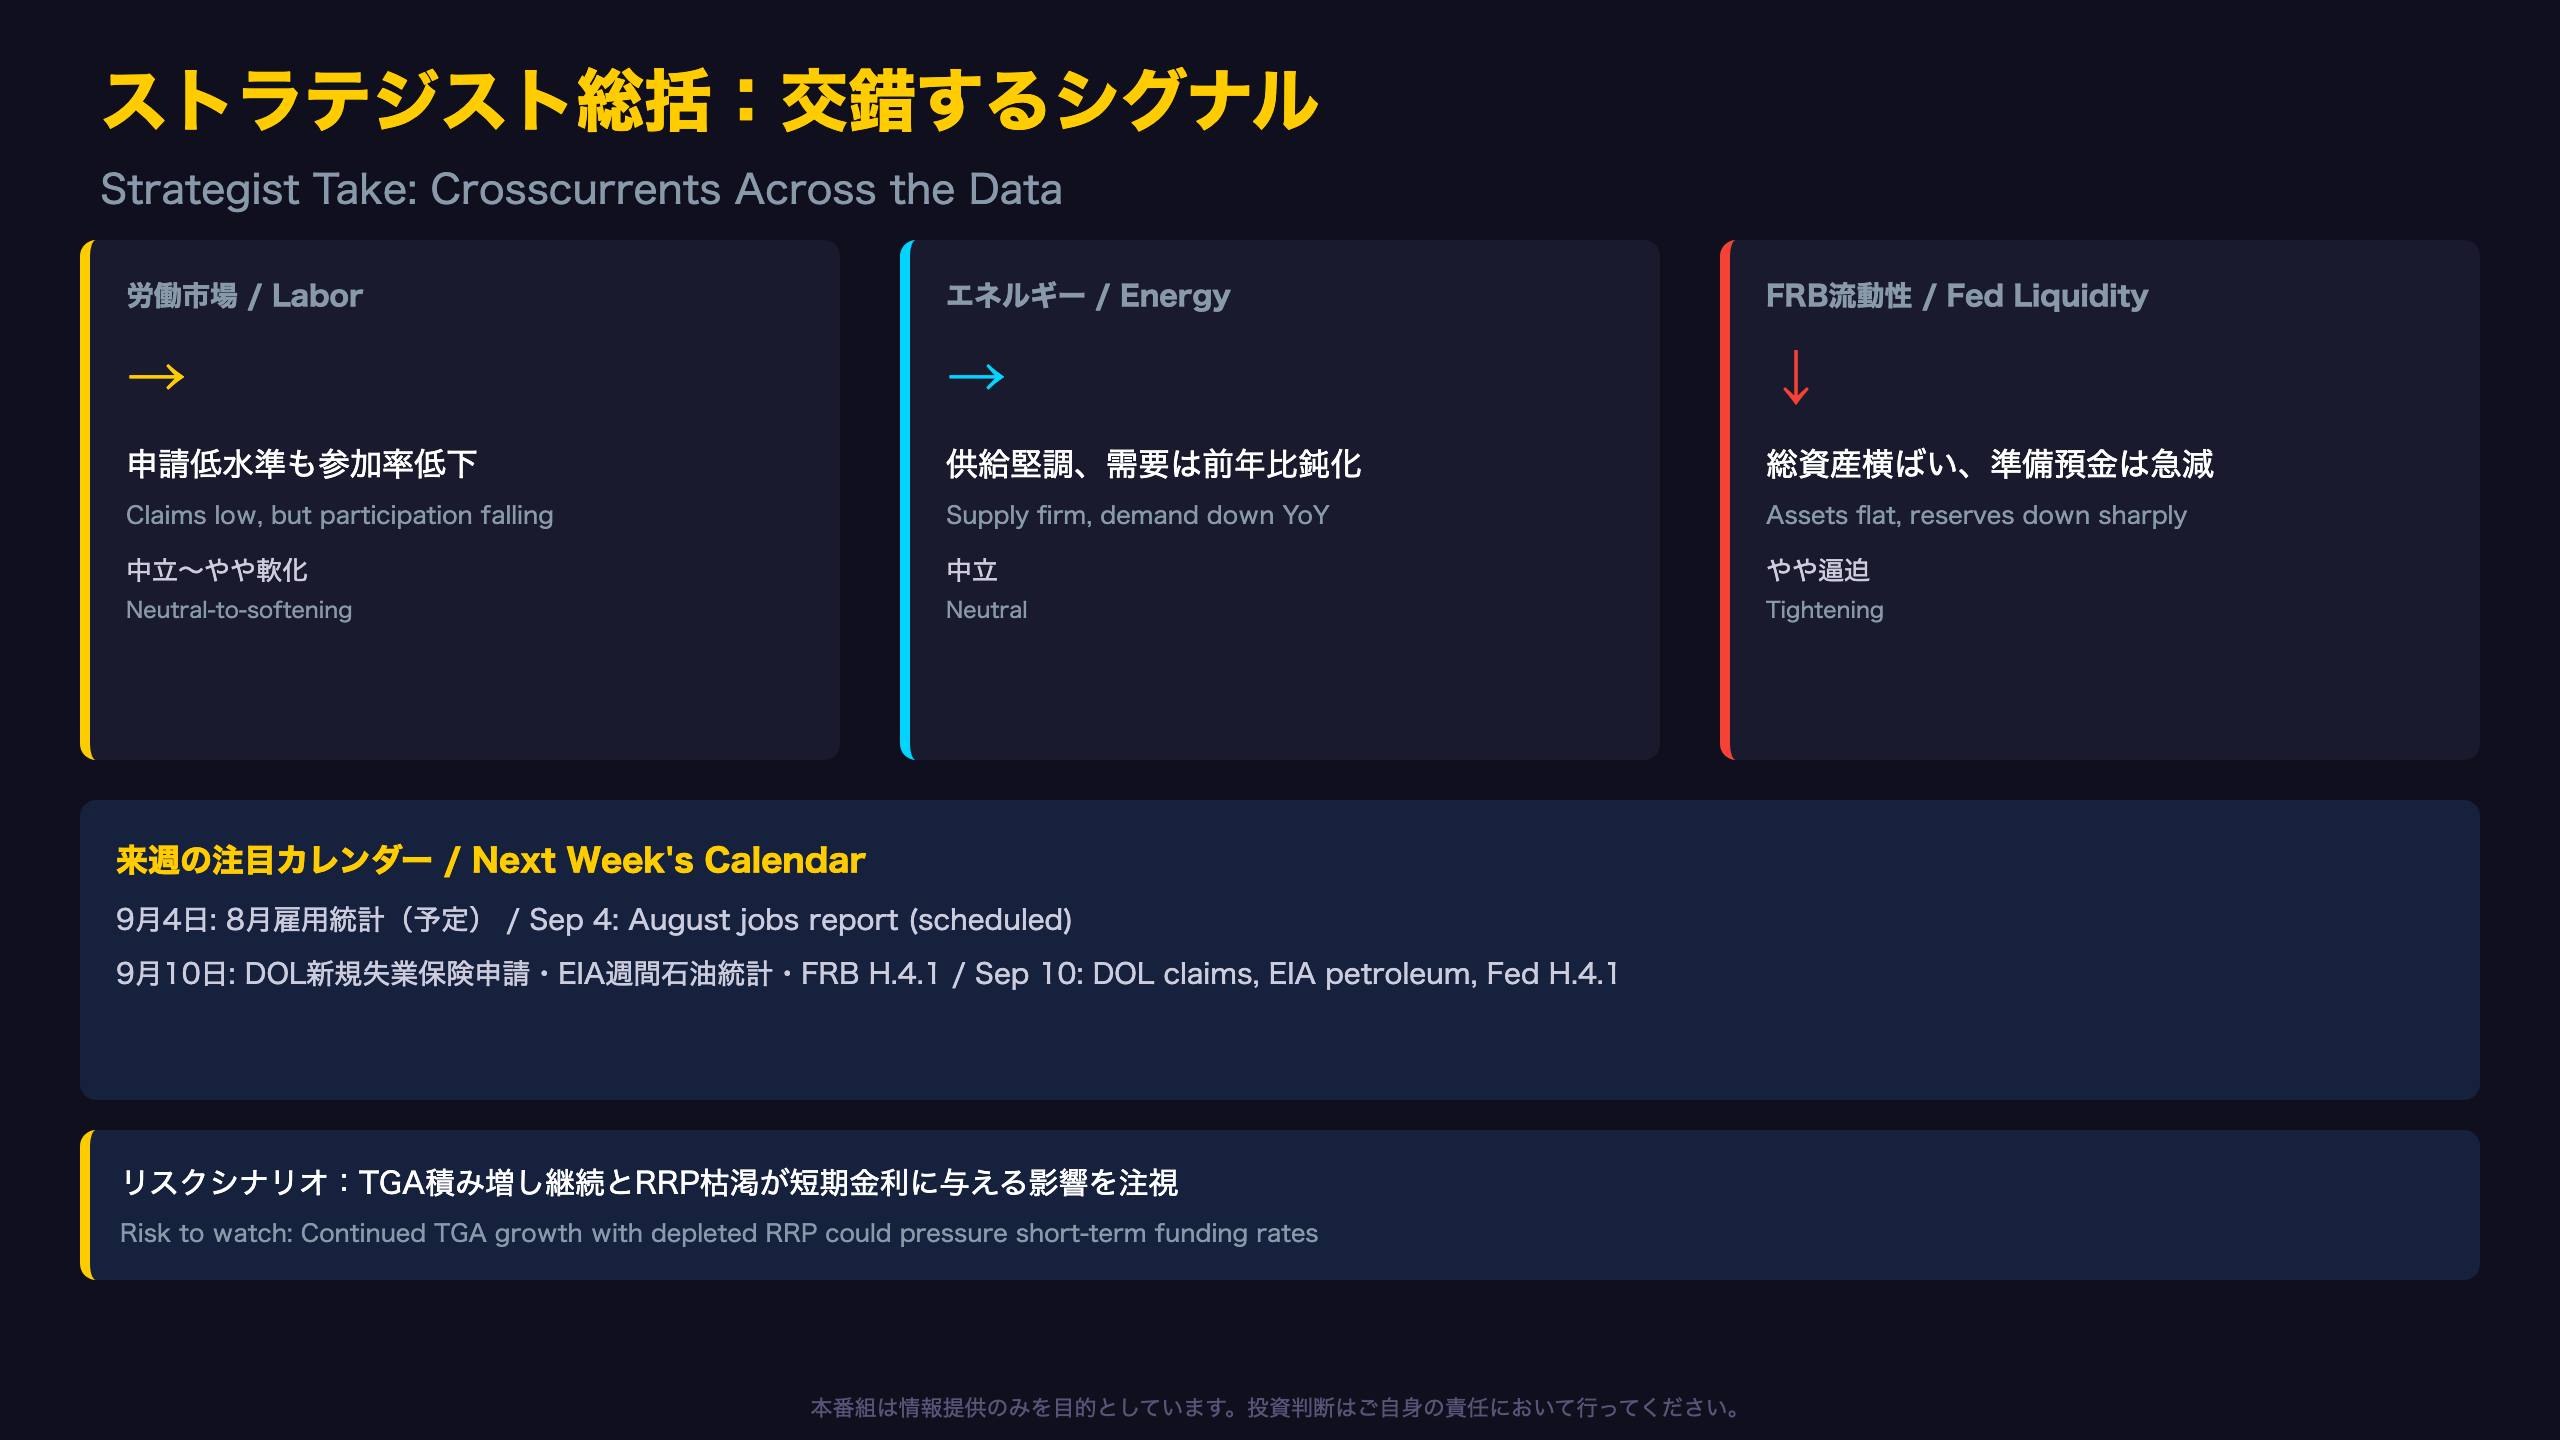
Cross-Currents Across Labor, Energy, and Liquidity
Taken together, this week’s three reports don’t tell a single, clean story — they describe a market with crosscurrents that U.S. rates and equity investors should track closely heading into September.
| Indicator | Signal | Read |
|---|---|---|
| Labor (DOL) | Claims low, participation falling | Neutral-to-softening |
| Energy (EIA) | Supply firm, demand down YoY | Neutral |
| Fed liquidity (H.4.1) | Assets flat, reserves down sharply | Tightening |
Risk scenarios to watch:
-
Repo market stress: If the Treasury General Account keeps rising while the reverse repo buffer stays near zero, upward pressure on SOFR and other short-term funding rates could build — a dynamic that echoes the September 2019 U.S. repo market squeeze, when the Fed had to inject emergency liquidity via repo operations.
-
Labor market slack: If the falling labor force participation rate persists over several more months, it could reveal underlying slack that the historically low headline claims figures are currently masking — a divergence worth monitoring against upcoming nonfarm payrolls prints.
What’s next: The August U.S. jobs report is due September 4, followed by the next weekly round of DOL claims, EIA petroleum data, and the Fed’s H.4.1 balance sheet release on September 10. For rates markets, the interplay between TGA growth and RRP depletion is likely to be a more important short-term signal than the headline balance sheet total.
Disclaimer: This article is for informational purposes only. All investment decisions are made solely at your own risk.