📺 Watch the Full Video Analysis
This article was automatically generated by the NFC Market Live AI analysis system. (Updated: 2026-07-24 08:42 JST)
📄 Primary Source
総務省統計局
https://www.stat.go.jp/data/cpi/sokuhou/tsuki/pdf/zenkoku.pdf
Deep dive into Japan’s National CPI for June 2026, released by the Statistics Bureau 📊
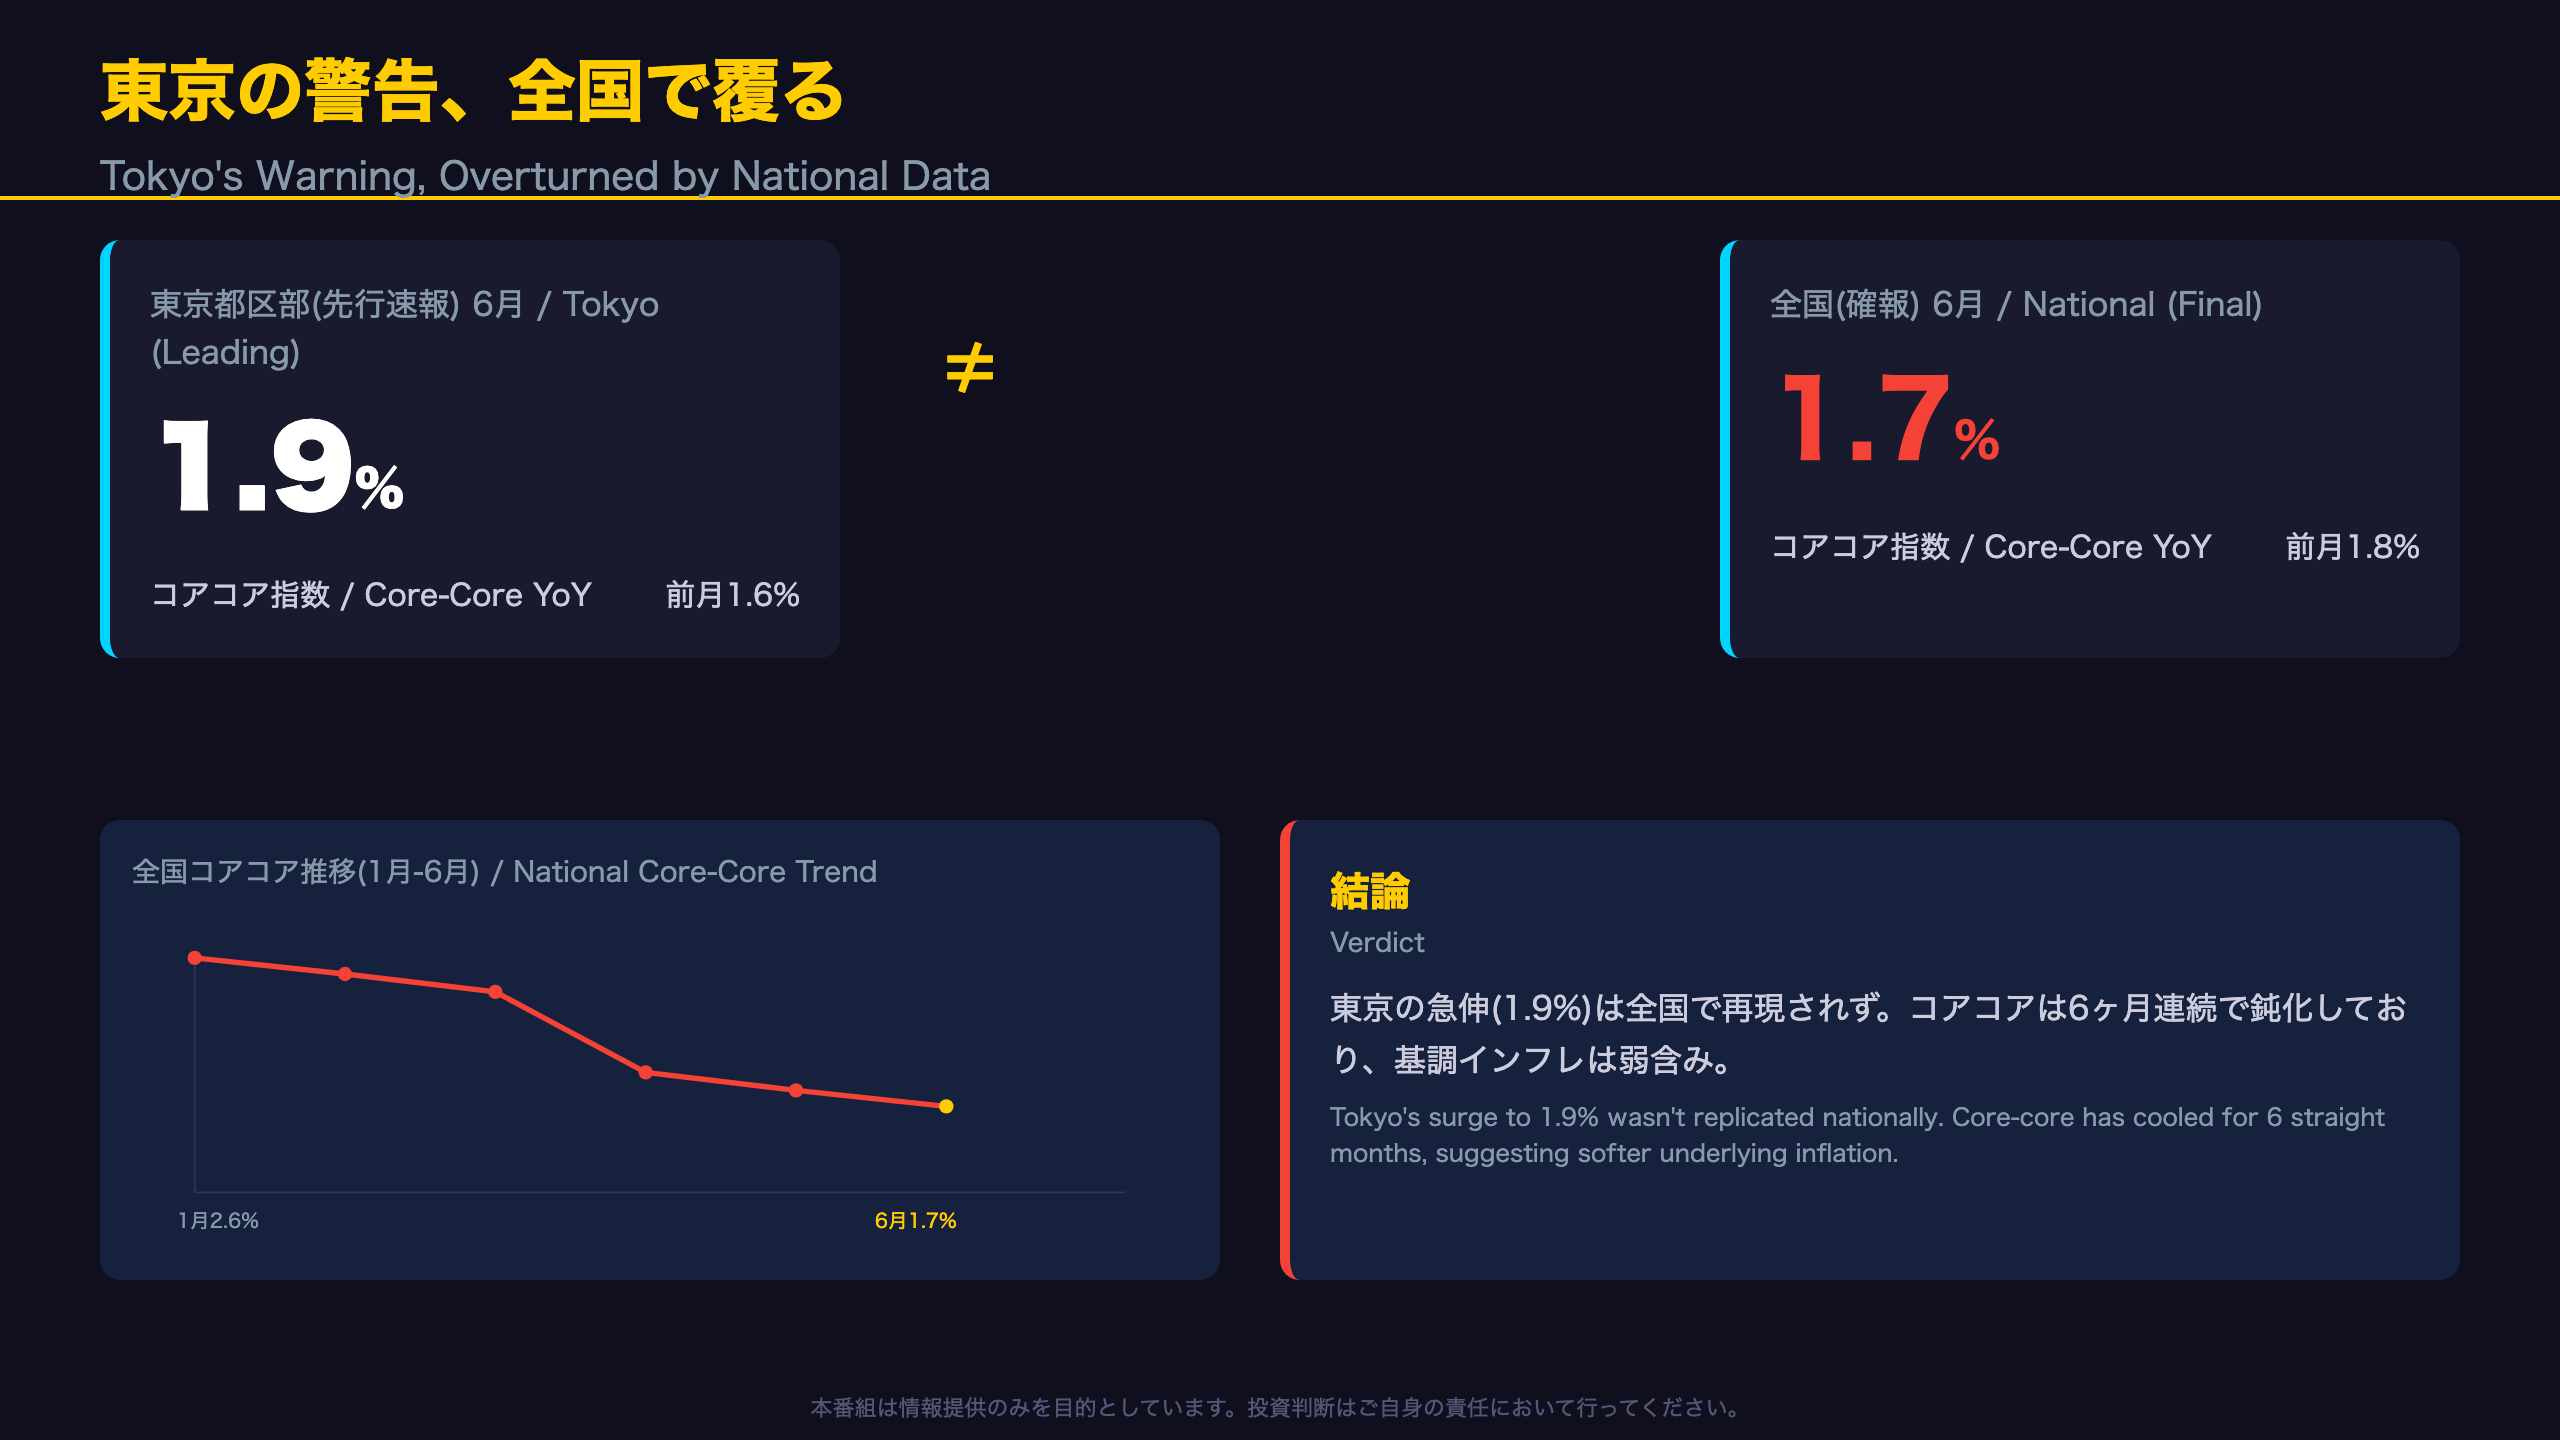
Tokyo’s preliminary data (a leading indicator) showed core-core inflation jumping from 1.6% to 1.9%, raising hawkish expectations in markets.
But the national confirmed figure told a different story: core-core actually slowed from 1.8% to 1.7% 📉
— extending a 6-month deceleration trend from 2.6% in January.
Headline and core CPI did accelerate, but our analysis shows this was largely a mechanical base effect from fading gasoline tax policy impacts ⚠️
We also examine resilient food and service prices (medical fees, auto insurance) for a balanced view, and discuss what this means for BOJ policy and JGB/JPY markets 💡
The Ultimate Summary:東京の警告、全国で覆る
What Tokyo’s Leading Indicator Signaled
Tokyo’s preliminary CPI (released June 26, 2026) showed core-core inflation—the Bank of Japan’s preferred gauge, excluding fresh food and energy—jumping from 1.6% to 1.9% year-on-year. This is a significant one-month move, and markets often treat Tokyo’s data (a subset released about a month ahead of the national figures) as a leading indicator for BOJ policy expectations.
What the National Confirmation Revealed
The Statistics Bureau of Japan (総務省統計局), the government body that compiles Japan’s CPI, released the national June 2026 figures on July 24. While headline and core (ex-fresh food) CPI did accelerate in line with Tokyo’s direction, core-core actually declined to 1.7% from 1.8%—falling well short of Tokyo’s 1.9% signal.
For context, Japan’s CPI framework differs from the US: the Bank of Japan targets 2% on a comparable “core” measure, but unlike the Fed’s PCE-based framework, Japan’s core-core (generally comparable to US core CPI) has been the market’s preferred gauge of “sticky” domestic inflation.
The Six-Month Deceleration Nobody Talked About
National core-core has now fallen for six consecutive months: 2.6% (Jan) → 2.5% → 2.4% → 1.9% → 1.8% → 1.7% (June). This structural cooling trend was largely overshadowed by the headline’s superficial acceleration—an important nuance for anyone positioning around BOJ rate-hike expectations.
The next Tokyo preliminary release (July 2026 data) is due July 31, 2026, offering the next opportunity to test whether Tokyo’s leading signal proves more reliable.
東京都区部の先行シグナル:何が警戒されたか
Why Tokyo’s Data Matters
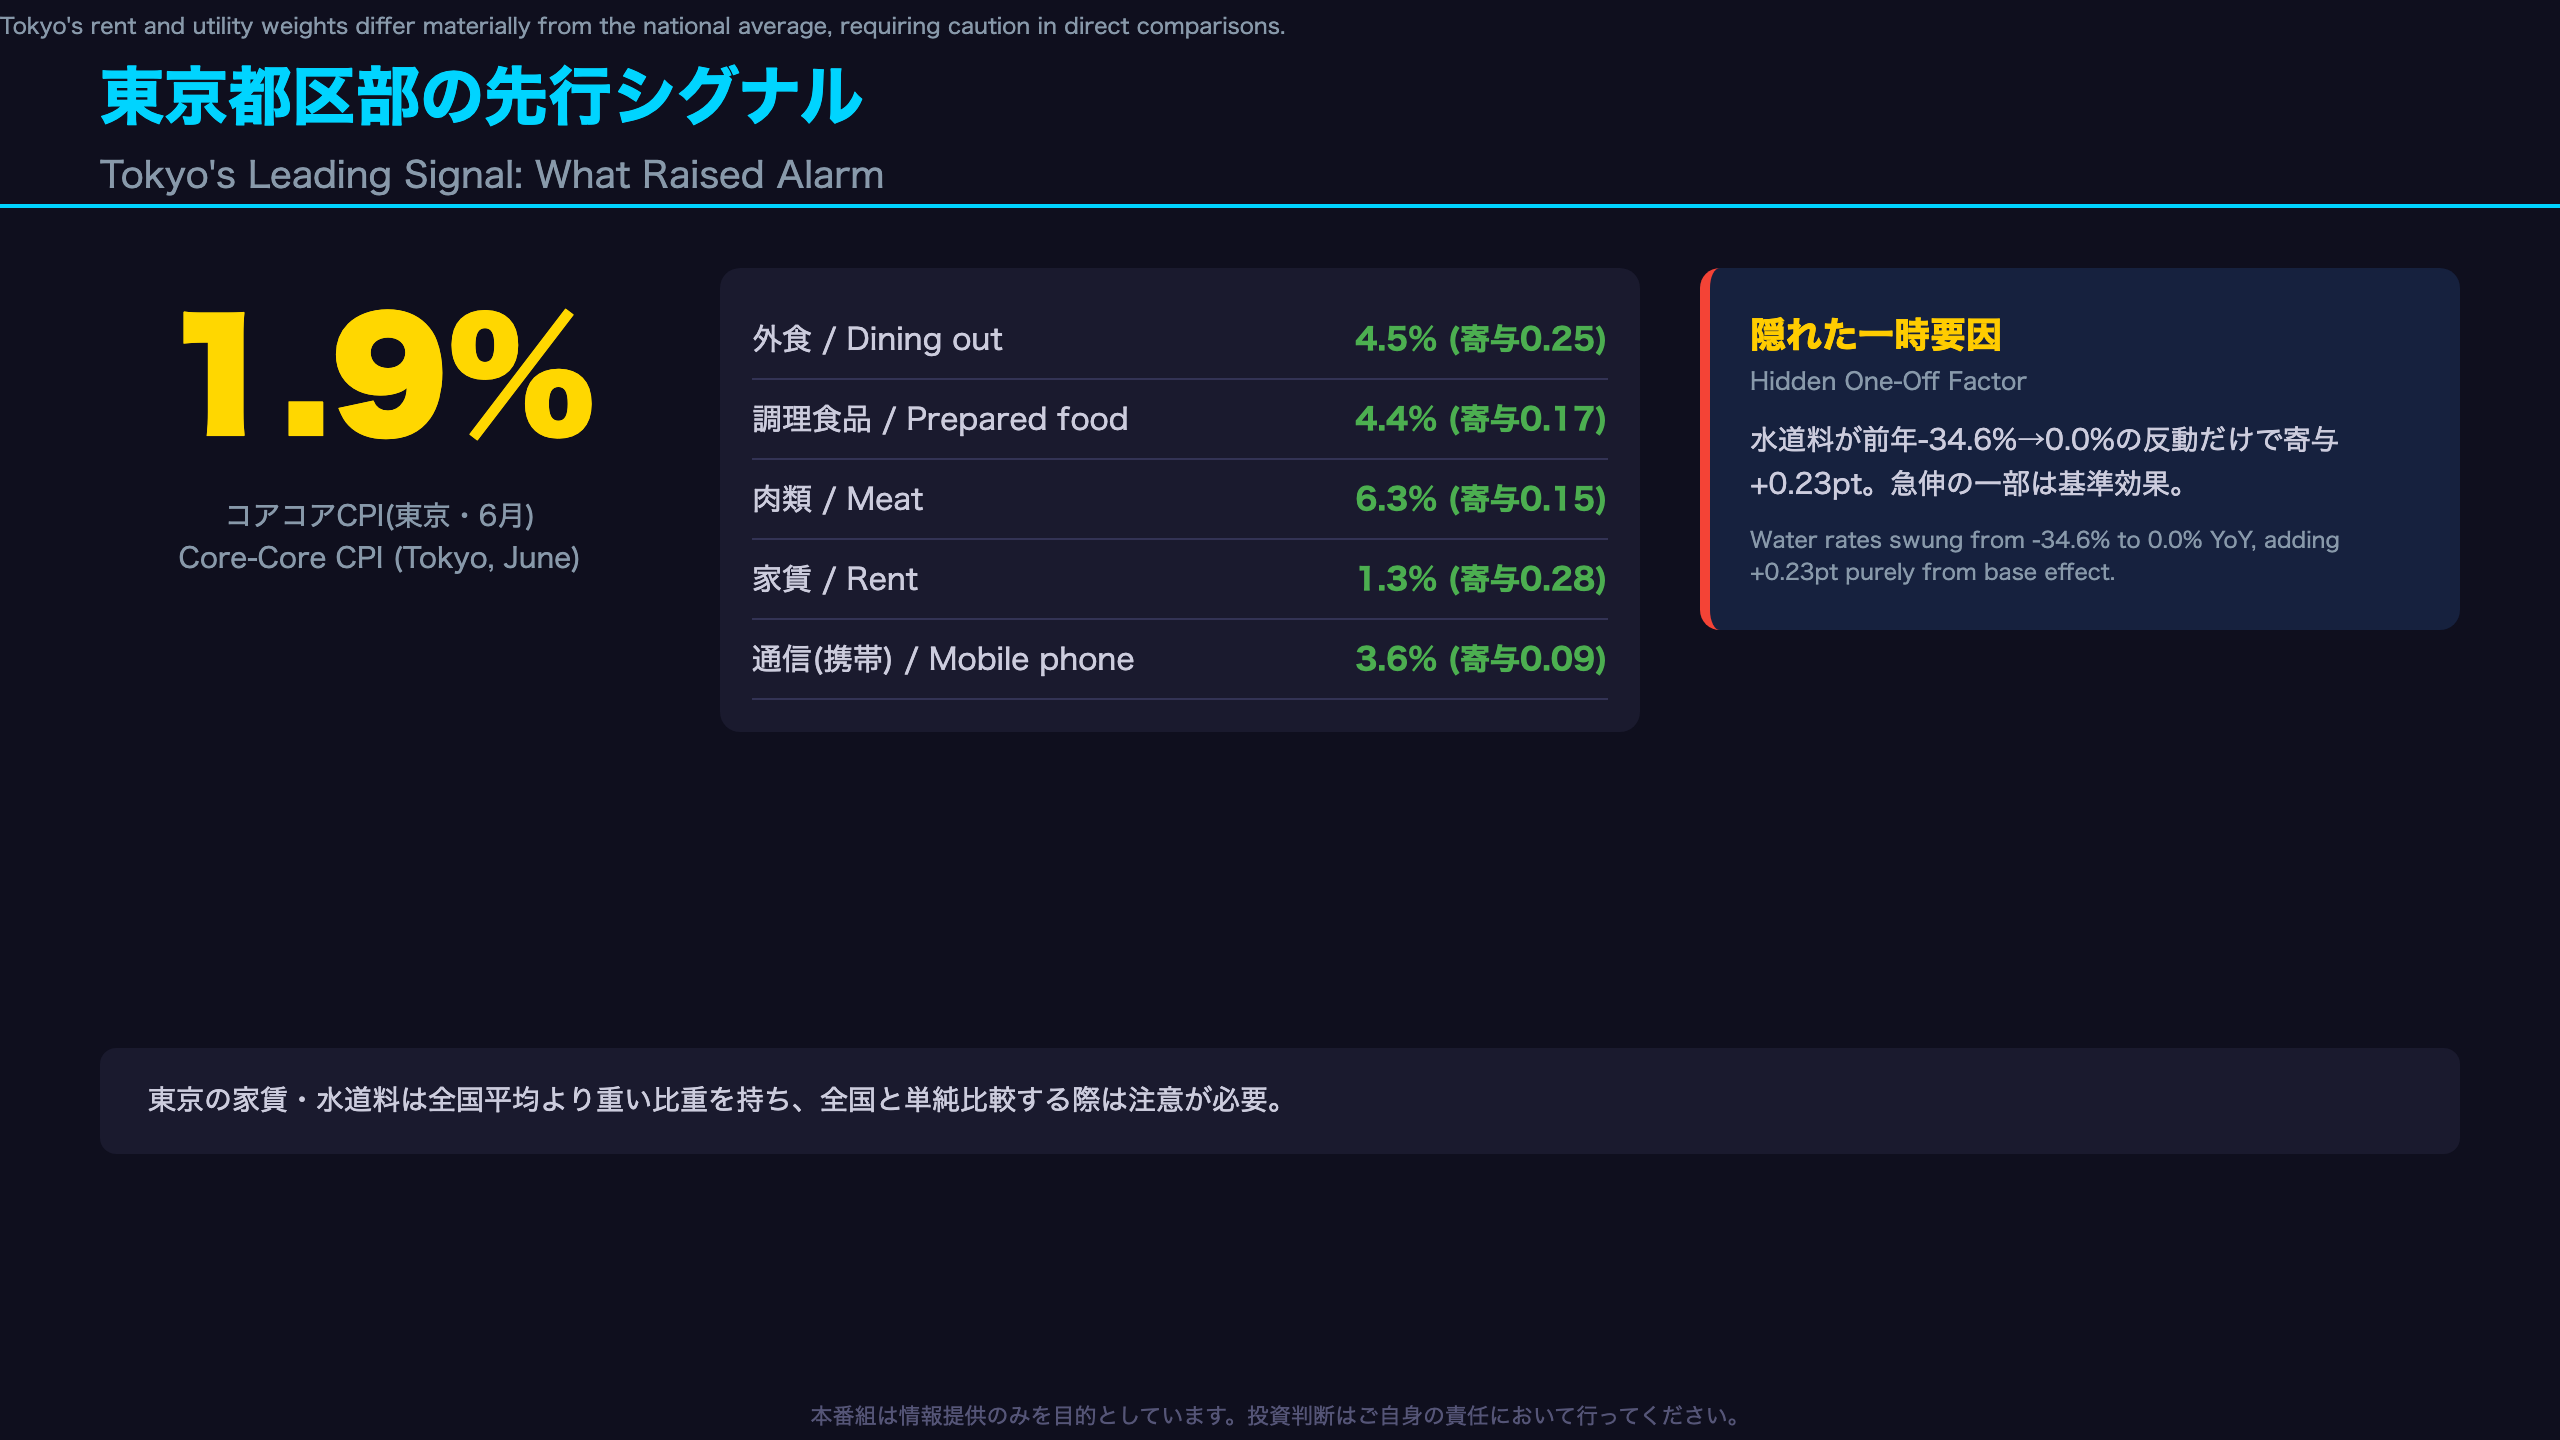
Tokyo’s ward-area CPI (東京都区部) is released roughly a month before the national figures, since it only surveys mid-month prices in the capital. Because Tokyo represents a large, closely tracked subset of Japan’s economy, market participants and BOJ watchers treat it as a leading indicator for the national print. This time (June 2026 data, released June 26), core-core jumped from 1.6% to 1.9%—a 0.3 percentage point move in a single month.
What Drove the Jump
Key contributors included dining out (+4.5%, contributing 0.25pp), prepared food (+4.4%, 0.17pp), meat (+6.3%, 0.15pp), and rent (+1.3%, contributing 0.28pp)—the latter reflecting Tokyo’s disproportionately high housing weight compared to the national average.
The Overlooked One-Off: Water Rates
Critically, water rates alone explain a large chunk of the headline move. Last year’s sharp 34.6% year-on-year drop lapsed, pushing this year’s rate to a flat 0.0% — mechanically adding about 0.23 percentage points to the total. The Statistics Bureau’s own release explicitly credits water rates with expanding the year-on-year gain by 0.23 points. This suggests a meaningful portion of Tokyo’s core-core surge was a base-effect artifact rather than a genuine broadening of price pressure — a nuance that got lost in initial market reactions.
Still, mobile phone charges remained elevated at 11.0% year-on-year, indicating last year’s discount-plan effects had not yet fully faded — a trend worth monitoring in subsequent releases.
全国確報の現実:コアコアはむしろ低下
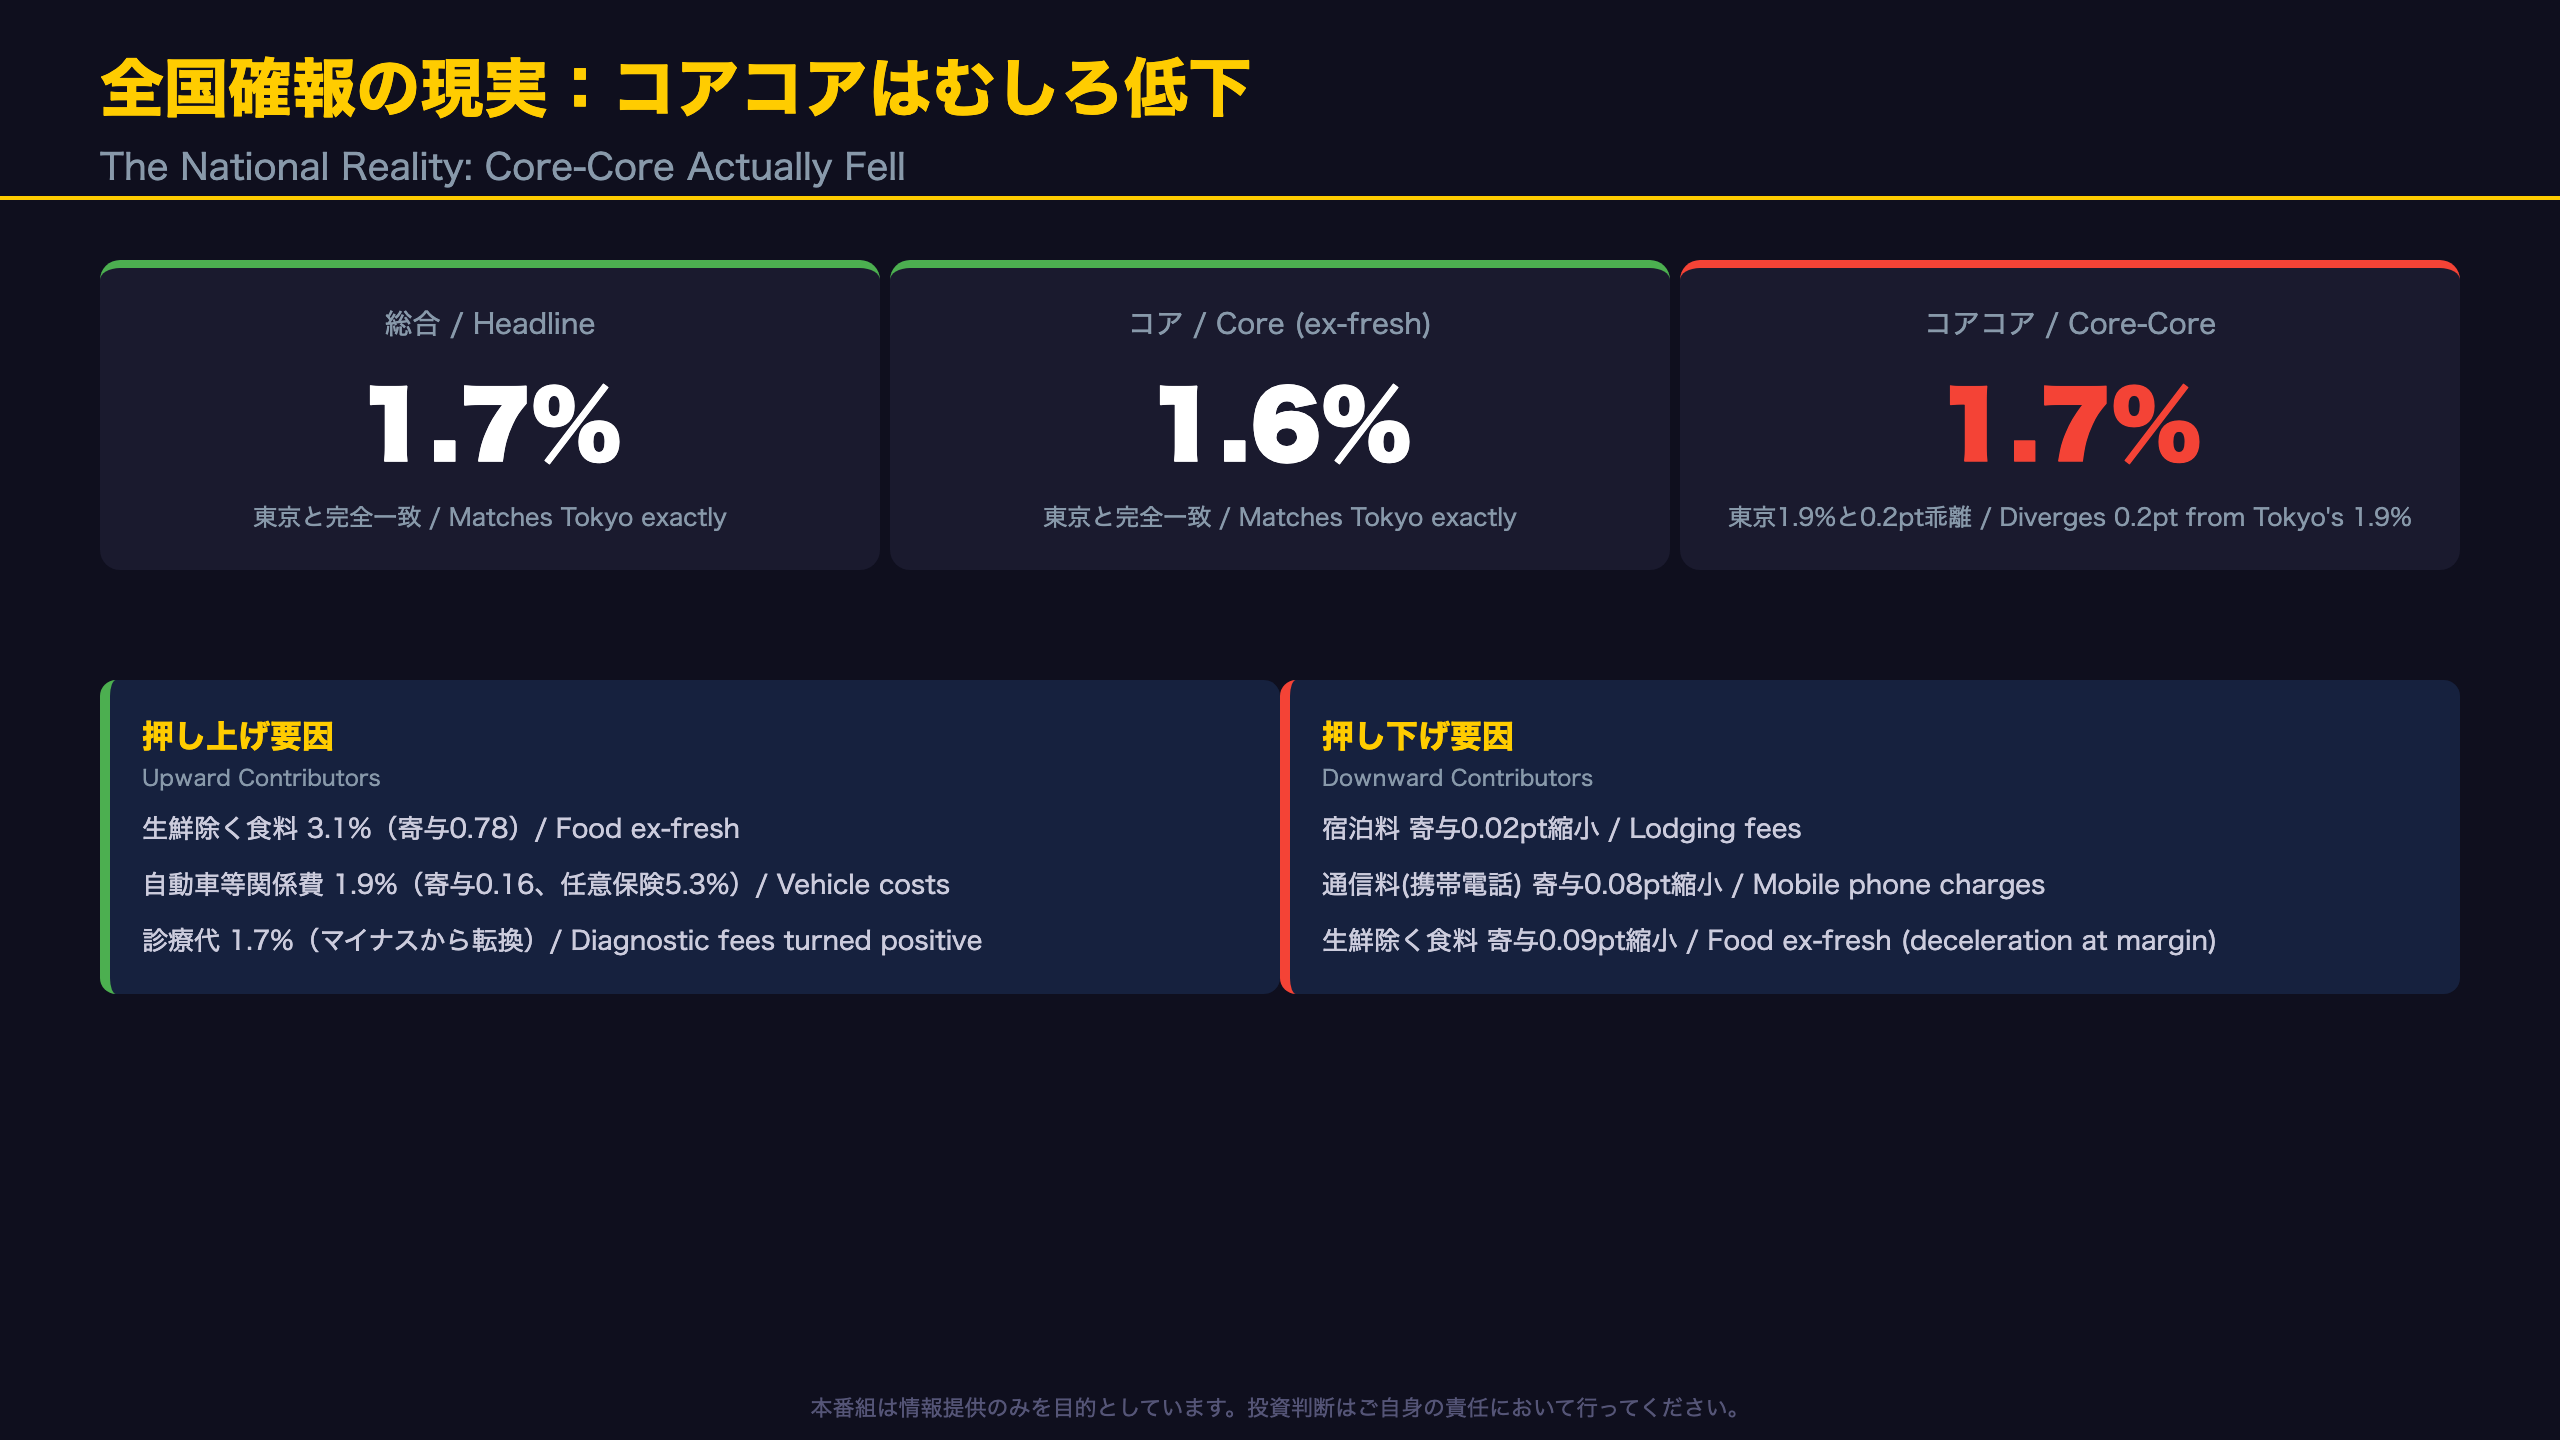
Headline and Core Matched Tokyo Precisely
Remarkably, the national headline (1.7%) and core (1.6%) figures matched Tokyo’s preliminary readings almost exactly—underscoring just how influential Tokyo is within the national CPI basket, given its outsized economic weight.
But Core-Core Broke the Pattern
Core-core alone diverged: 1.7% nationally versus Tokyo’s 1.9%, a 0.2 percentage point gap. According to the Statistics Bureau of Japan’s official commentary, “the year-on-year increase for the ex-fresh-food index widened by 0.2 points (from 1.4% in May to 1.6% in June)”—but this refers to core (ex-fresh food, energy included), not core-core. The core-core figure itself, isolated in Table 1, actually narrowed from 1.8% to 1.7%.
Item-Level Breakdown
On the upside: food excluding fresh items (+3.1%, contributing 0.78 points, though itself decelerating from May), vehicle-related costs (+1.9%, contributing 0.16 points, driven by a 5.3% jump in voluntary auto insurance), and diagnostic fees (turning positive at +1.7%). On the downside: lodging fees and mobile phone charges both saw their contributions shrink further (by 0.02 and 0.08 points respectively).
What to Watch Next
The next national CPI release (July 2026 data) is scheduled for August 21, 2026, with Tokyo’s July preliminary print (due July 31) again serving as the key cross-check for whether the leading indicator’s signal proves reliable this time.
隠れたメカニズム:エネルギー基準効果の剥落
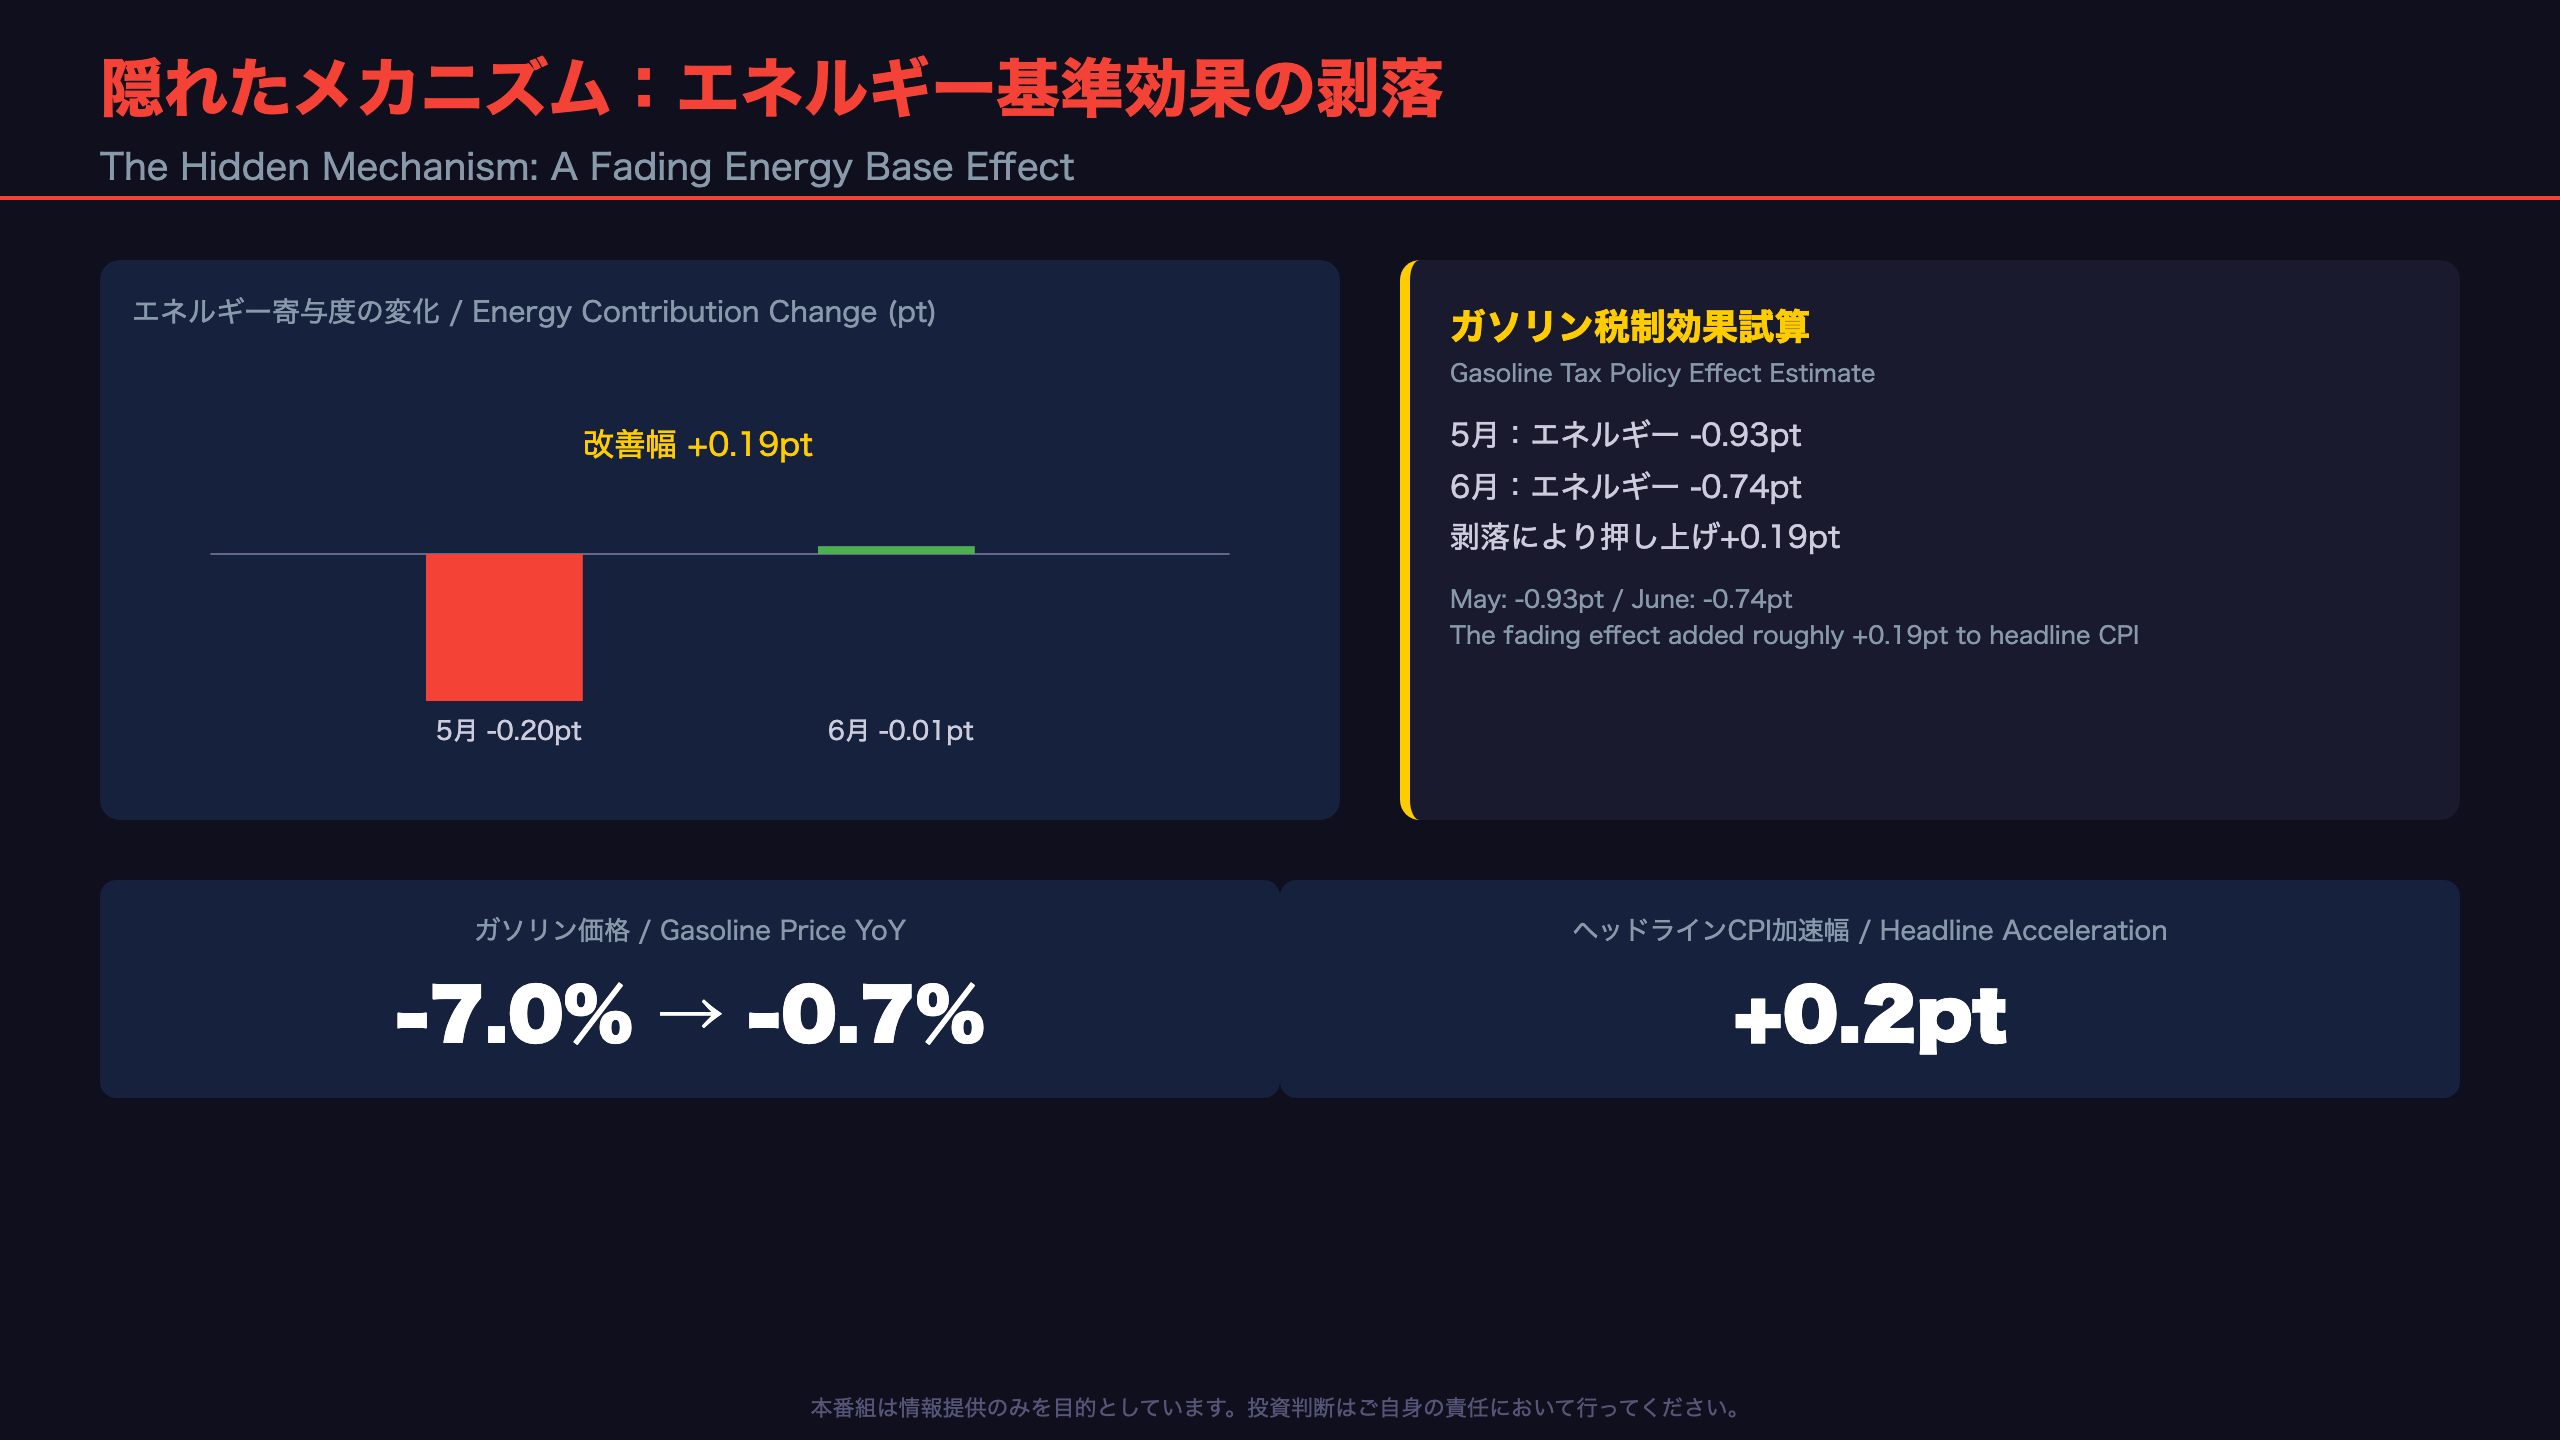
The Gasoline Tax Policy Effect Explained
In 2025, Japan abolished the provisional gasoline tax rate (暫定税率), which had been pushing down year-on-year price comparisons sharply. The Statistics Bureau of Japan publishes an explicit estimate of this policy effect each month.
For June: “Energy: -0.74 (-0.87 current month, +0.13 base-effect lapse)”
For May: “Energy: -0.93 (-0.98 current month, +0.05 base-effect lapse)”
In other words, the negative drag from this policy effect narrowed from -0.93 to -0.74 points—a swing of roughly +0.19 percentage points in the upward direction.
The Raw Contribution Numbers
According to Table 5 of the release, energy’s overall contribution to headline CPI improved from -0.20 points in May to just -0.01 points in June. Gasoline’s year-on-year decline narrowed sharply from -7.0% to -0.7%, while kerosene prices actually accelerated further, from +12.4% to +16.5%.
A Striking Coincidence—or the Whole Story?
Headline CPI accelerated by +0.2 percentage points (from 1.5% to 1.7%), almost exactly matching the +0.19 point improvement in energy’s contribution. This doesn’t mean energy explains literally everything—other categories like food saw their contributions shrink at the margin—but among all identifiable drivers disclosed in the report, the energy base effect stands out as by far the largest single factor behind the headline’s apparent acceleration. For US-based readers: this is analogous to how base effects from energy and used-car prices have periodically distorted US CPI readings, requiring investors to look past headline noise toward core measures for the true inflation signal.
強さの検証:食料・サービス価格の底堅さ
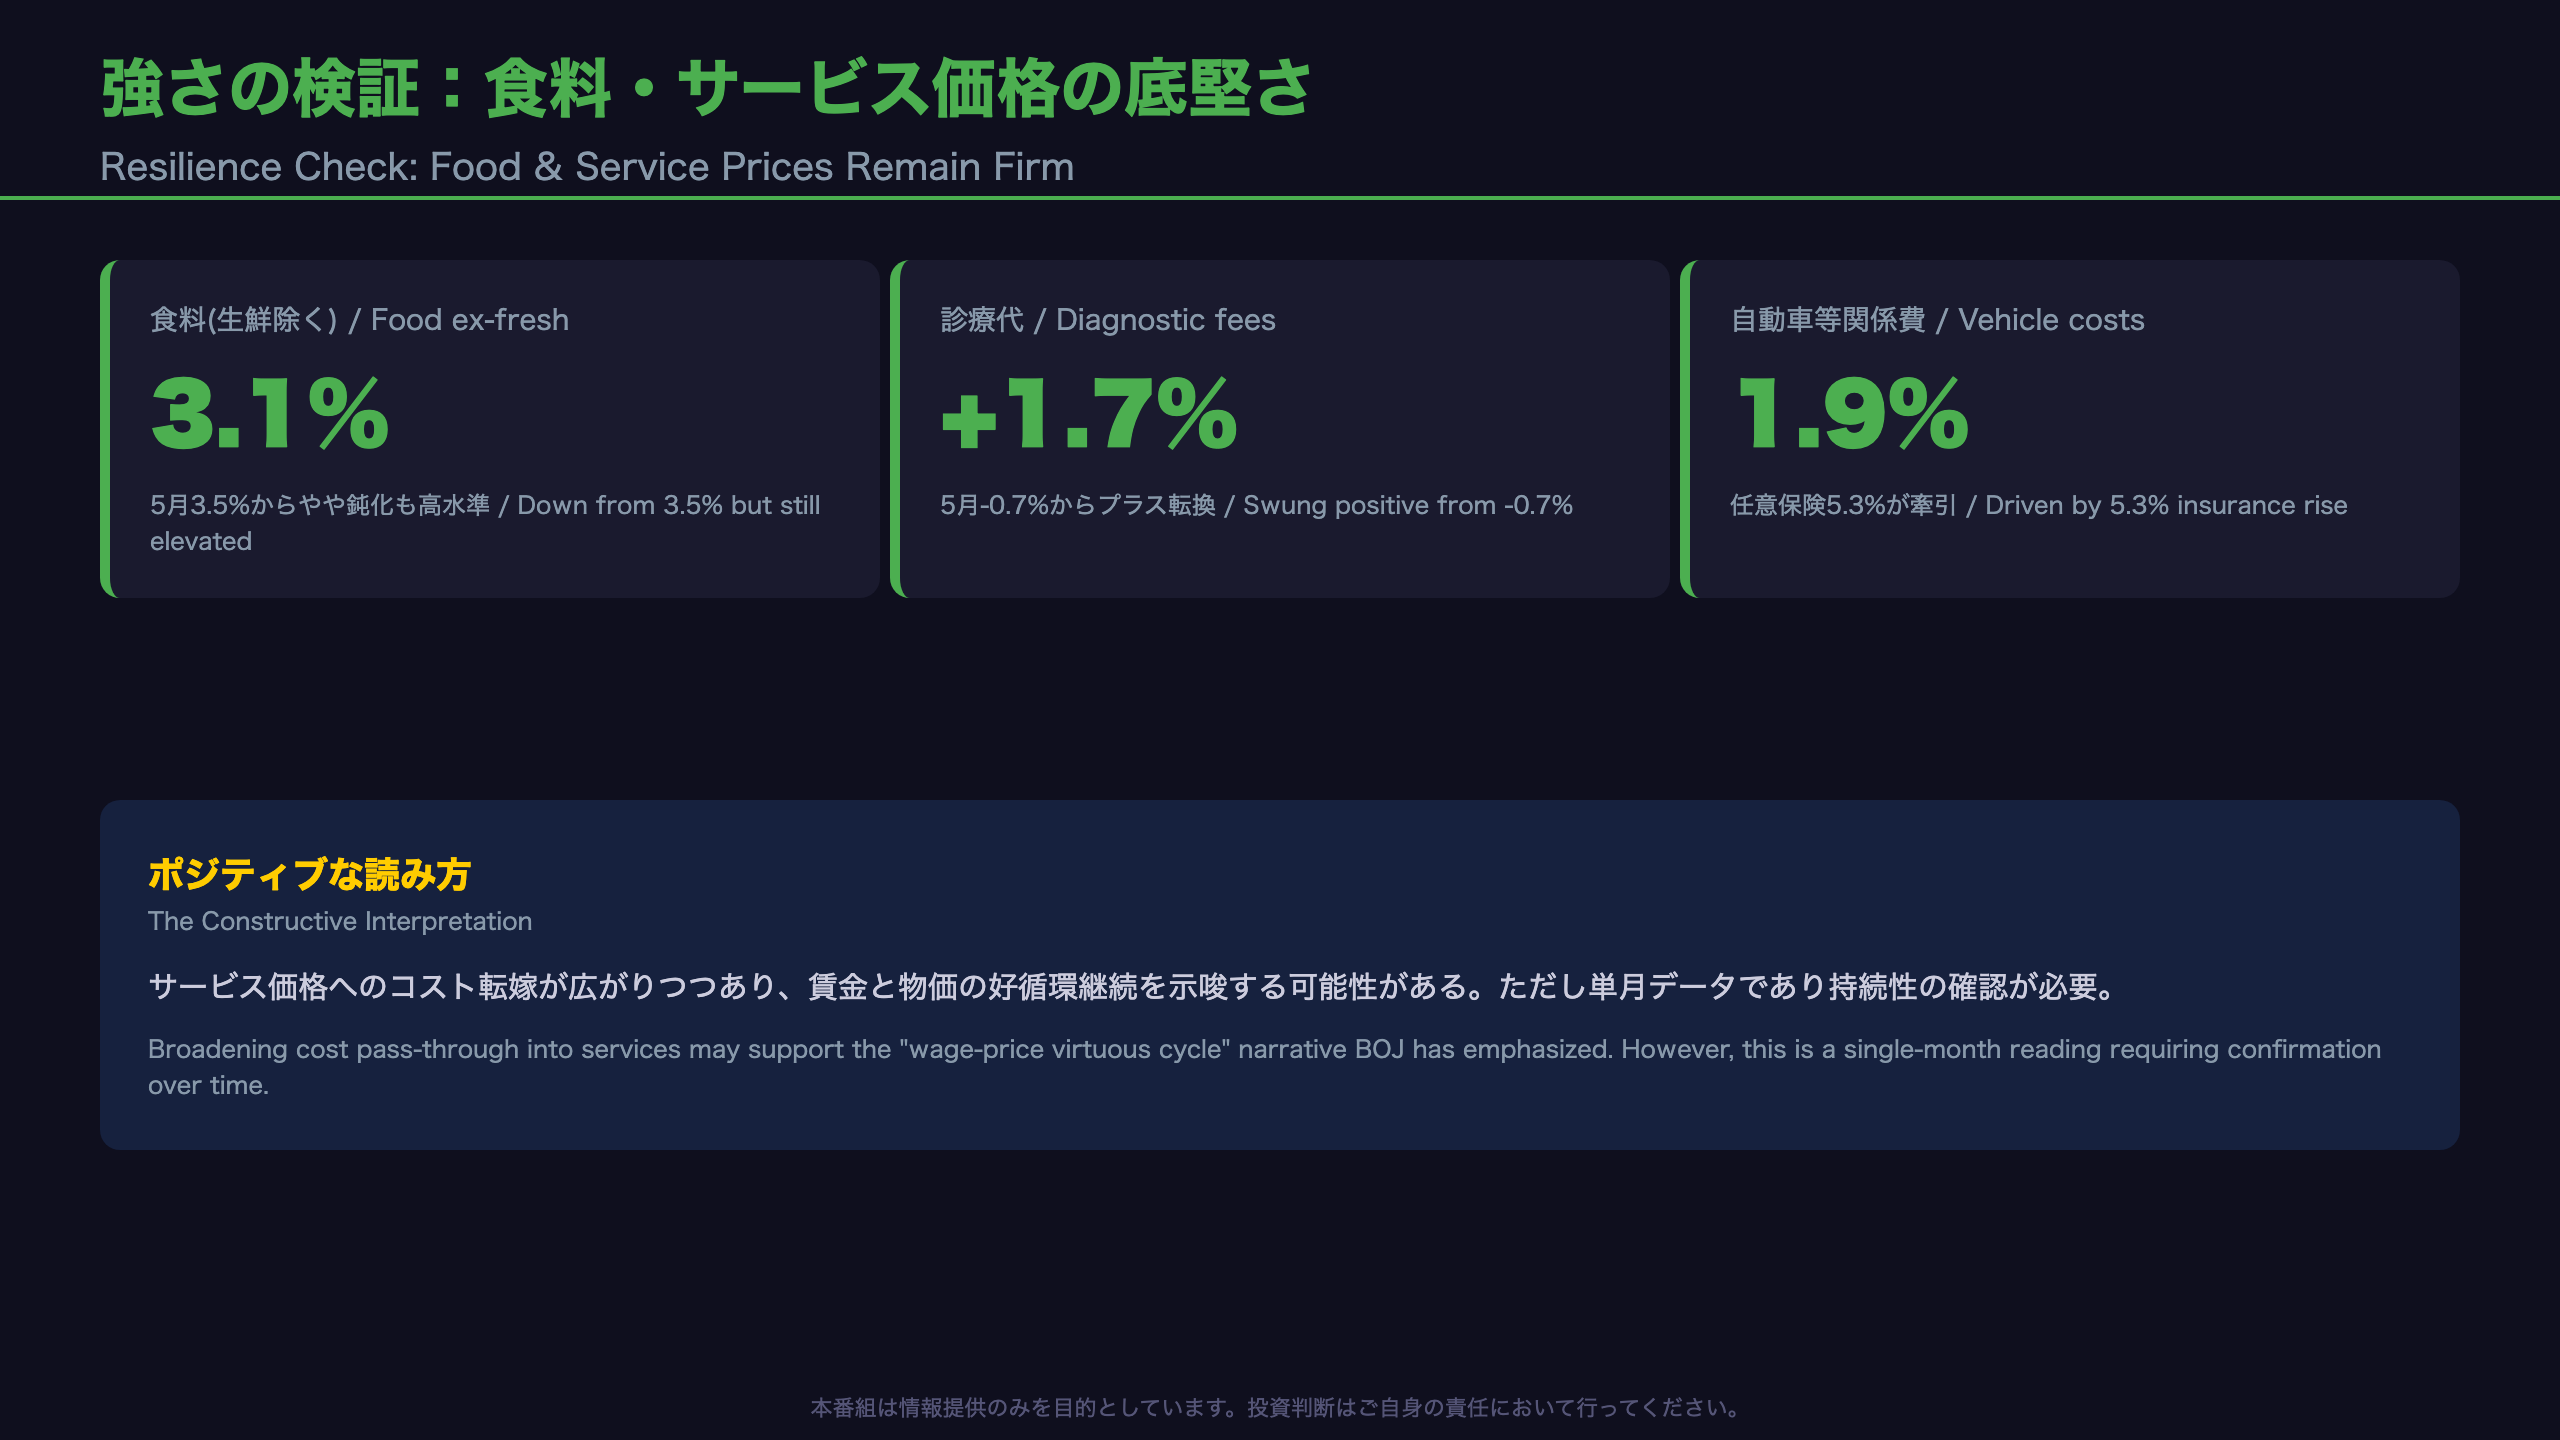
Food Inflation Remains Elevated
Food excluding fresh items rose 3.1% year-on-year in June (down modestly from 3.5% in May), but this still represents a historically high pace. Confectionery rose 5.7% (contributing 0.16 points) and beverages rose 6.8% (0.12 points), showing price increases remain broad-based across categories—not confined to a handful of items.
Signs of Broadening Service-Sector Pass-Through
Diagnostic/medical fees are particularly noteworthy: they swung from -0.7% in May to +1.7% in June, with their contribution improving from -0.01 to +0.03 points—a 0.05 point swing. This may reflect fee schedule revisions or labor cost pass-through within Japan’s healthcare system, which operates under a government-regulated pricing structure quite different from the US private insurance model.
Rising Auto-Related Costs
Vehicle-related costs rose 1.9% year-on-year (contributing 0.16 points), with voluntary auto insurance premiums up 5.3% (contributing 0.10 points)—likely reflecting persistently elevated repair and parts costs, suggesting a structural rather than purely transient cost increase.
A Balanced Read
This resilience in food and services could support a constructive narrative around Japan’s long-sought “virtuous cycle” of wages feeding into prices, which the Bank of Japan has cited as a precondition for policy normalization. That said, these are single-month readings, and their persistence over subsequent releases needs to be confirmed before drawing firm conclusions.
弱さの検証:6ヶ月連続鈍化と反動要因
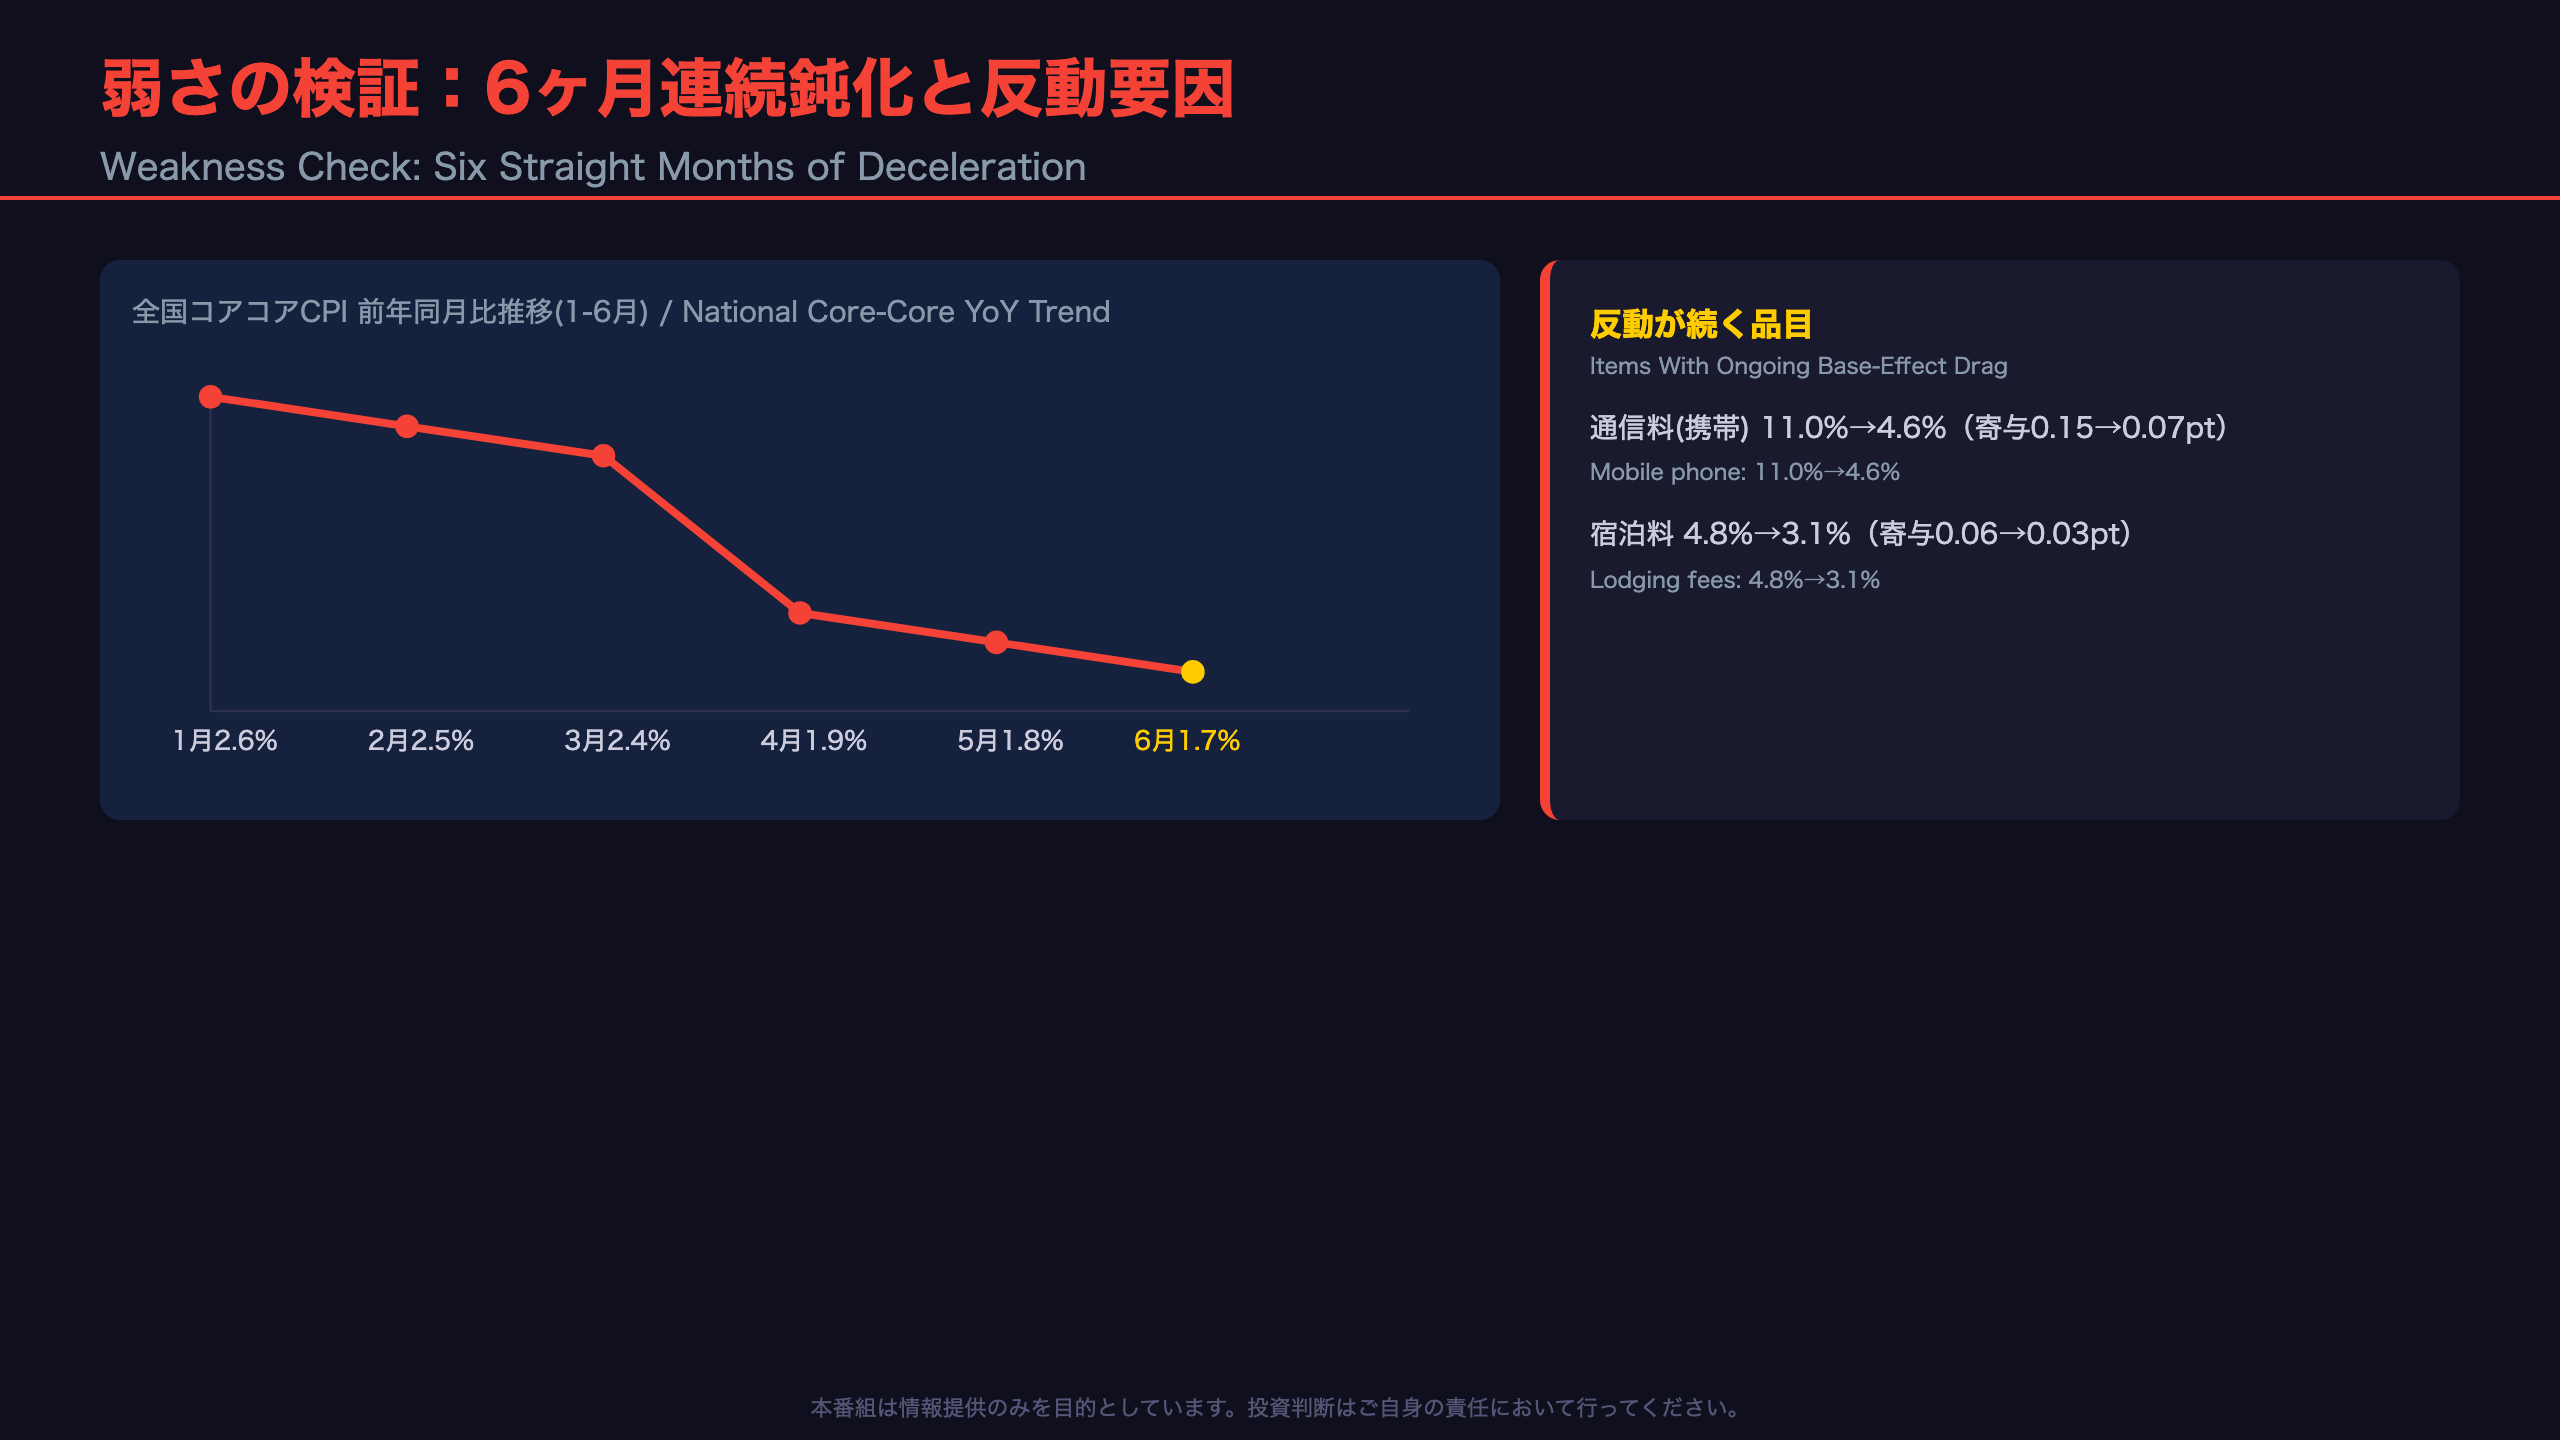
The Six-Month Deceleration Trend
Here’s how national core-core CPI has trended month by month:
| Month | YoY |
|---|---|
| Jan | 2.6% |
| Feb | 2.5% |
| Mar | 2.4% |
| Apr | 1.9% |
| May | 1.8% |
| Jun | 1.7% |
Notably, the pace of deceleration accelerated sharply between March and April (a 0.5 point drop), before settling into a more gradual pace of decline through June.
The Mobile Phone Base Effect Still Has Room to Run
Mobile phone charges saw year-on-year growth shrink dramatically from 11.0% to 4.6%, with their contribution to core-core roughly halving from 0.15 to 0.07 points. This reflects the fading impact of rate plan changes implemented by Japanese carriers last year. Given how these base effects typically unwind gradually over several months, this drag is likely to persist into upcoming releases—a factor U.S. investors should note, given how mobile/telecom pricing shifts have similarly distorted US CPI readings in past cycles.
Lodging Growth Also Cooling
Lodging fees decelerated from 4.8% to 3.1% year-on-year, with their contribution shrinking from 0.06 to 0.03 points—potentially reflecting a plateauing of inbound tourism demand and the maturing of post-pandemic price pass-through in Japan’s hospitality sector.
A Caveat
None of these item-level softening signals should be read as a definitive “trend reversal” based on a single month’s data alone. Continued monitoring across several more releases will be necessary to confirm whether this deceleration persists.
インプリケーション:日銀政策と市場への含意
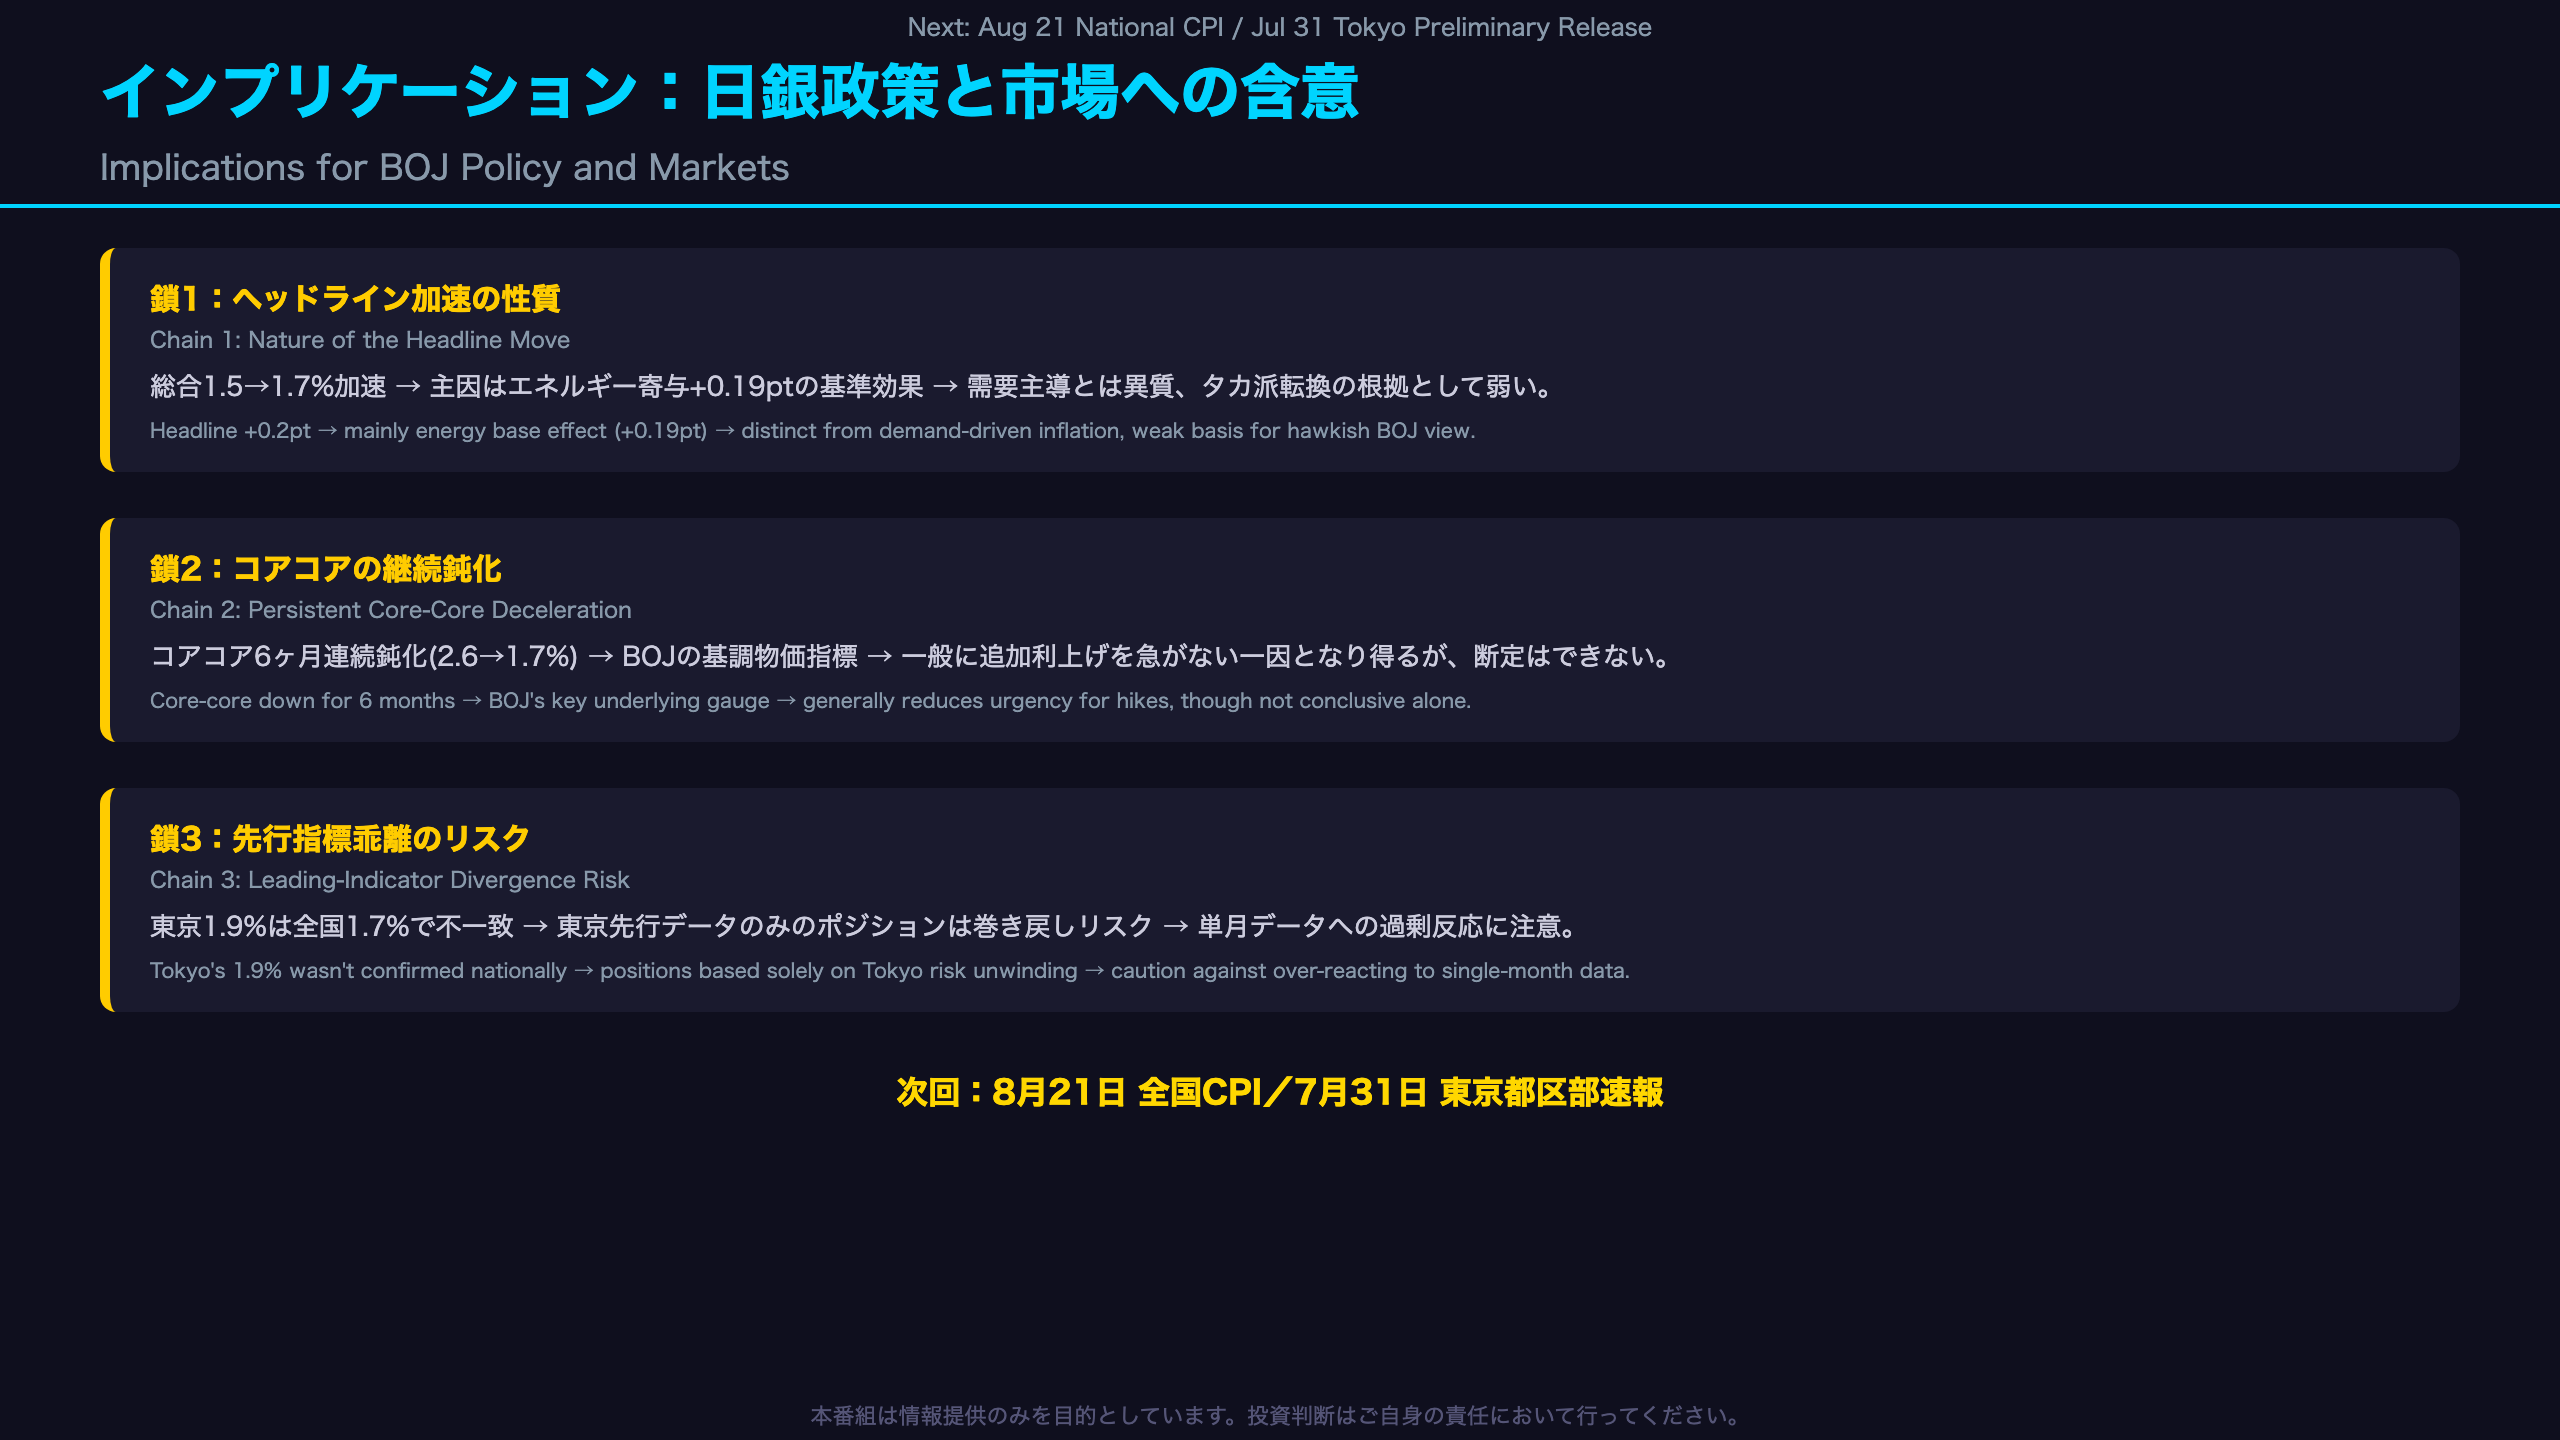
Reading Market Implications Through the Chain of Evidence
Chain 1: The Nature of the Headline Acceleration
National headline CPI rose from 1.5% to 1.7% year-on-year → The single largest identified driver was a +0.19 percentage point improvement in energy’s contribution, reflecting a fading gasoline tax base effect → This is mechanically distinct from demand-driven inflationary pressure, meaning the headline’s apparent acceleration alone is a weak basis for expecting a hawkish BOJ shift.
Chain 2: The Persistent Core-Core Deceleration
National core-core has decelerated for six consecutive months, from 2.6% in January to 1.7% in June → Core-core is generally regarded as the BOJ’s preferred proxy for “underlying” inflation, roughly comparable to how the Fed watches core PCE → It is generally believed that sustained deceleration in this measure reduces the urgency for further rate hikes, though this data alone cannot determine the outcome of the BOJ’s upcoming policy meetings.
Chain 3: The Risk of Over-Relying on Leading Indicators
Tokyo’s core-core surged from 1.6% to 1.9%, but the national figure came in at just 1.7% → Market participants who built rate or yen positions based solely on Tokyo’s preliminary signal may now face position unwinding following the national confirmation → This divergence is a useful case study for international investors monitoring Japan: Tokyo CPI, while a genuine leading indicator, carries meaningful noise from its distinct expenditure weights (notably rent and utilities) and should be interpreted with appropriate caution rather than as a precise national preview.
Bottom Line
Headline-grabbing “inflation acceleration” narratives can obscure a cooling underlying trend once the data is properly decomposed. The next data points to watch are the July national CPI (due August 21) and Tokyo’s July preliminary release (due July 31), which will together determine whether this month’s divergence was a one-off or the start of a more durable pattern.
Disclaimer: This article is for informational purposes only. All investment decisions are made solely at your own risk.