📺 Watch the Full Video Analysis
This article was automatically generated by the NFC Market Live AI analysis system. (Updated: 2026-07-01 08:59 JST)
📄 Primary Source
日本銀行
https://www.boj.or.jp/statistics/tk/yoshi/tk2606.htm
Deep dive into Japan’s Tankan Q2 2026 (June survey). Large manufacturer DI surged to 22, crushing the prior forecast of 14. Yet FY2026 recurring profit plans collapsed -6.5% across all firms. Input price DI hit 62 (large) and 76 (SMEs), while 5-year selling price expectations jumped to 6.1%. Capex plans were sharply revised upward. We analyze what this means for BOJ rate hike timing and Japan’s inflation trajectory.
The Ultimate Summary:2026年6月短観の総合評価
June 2026 Tankan: Three Forces Operating Simultaneously
What is the Tankan?
The Tankan (Short-Term Economic Survey of Enterprises in Japan) is a quarterly survey conducted by the Bank of Japan, covering approximately 9,000 companies across all sizes and industries. The headline metric is the Business Conditions DI (Diffusion Index), calculated as the percentage of firms reporting “favorable” conditions minus those reporting “unfavorable” conditions. It is one of the most closely watched leading indicators for the Japanese economy and BOJ policy.
Headline Strength
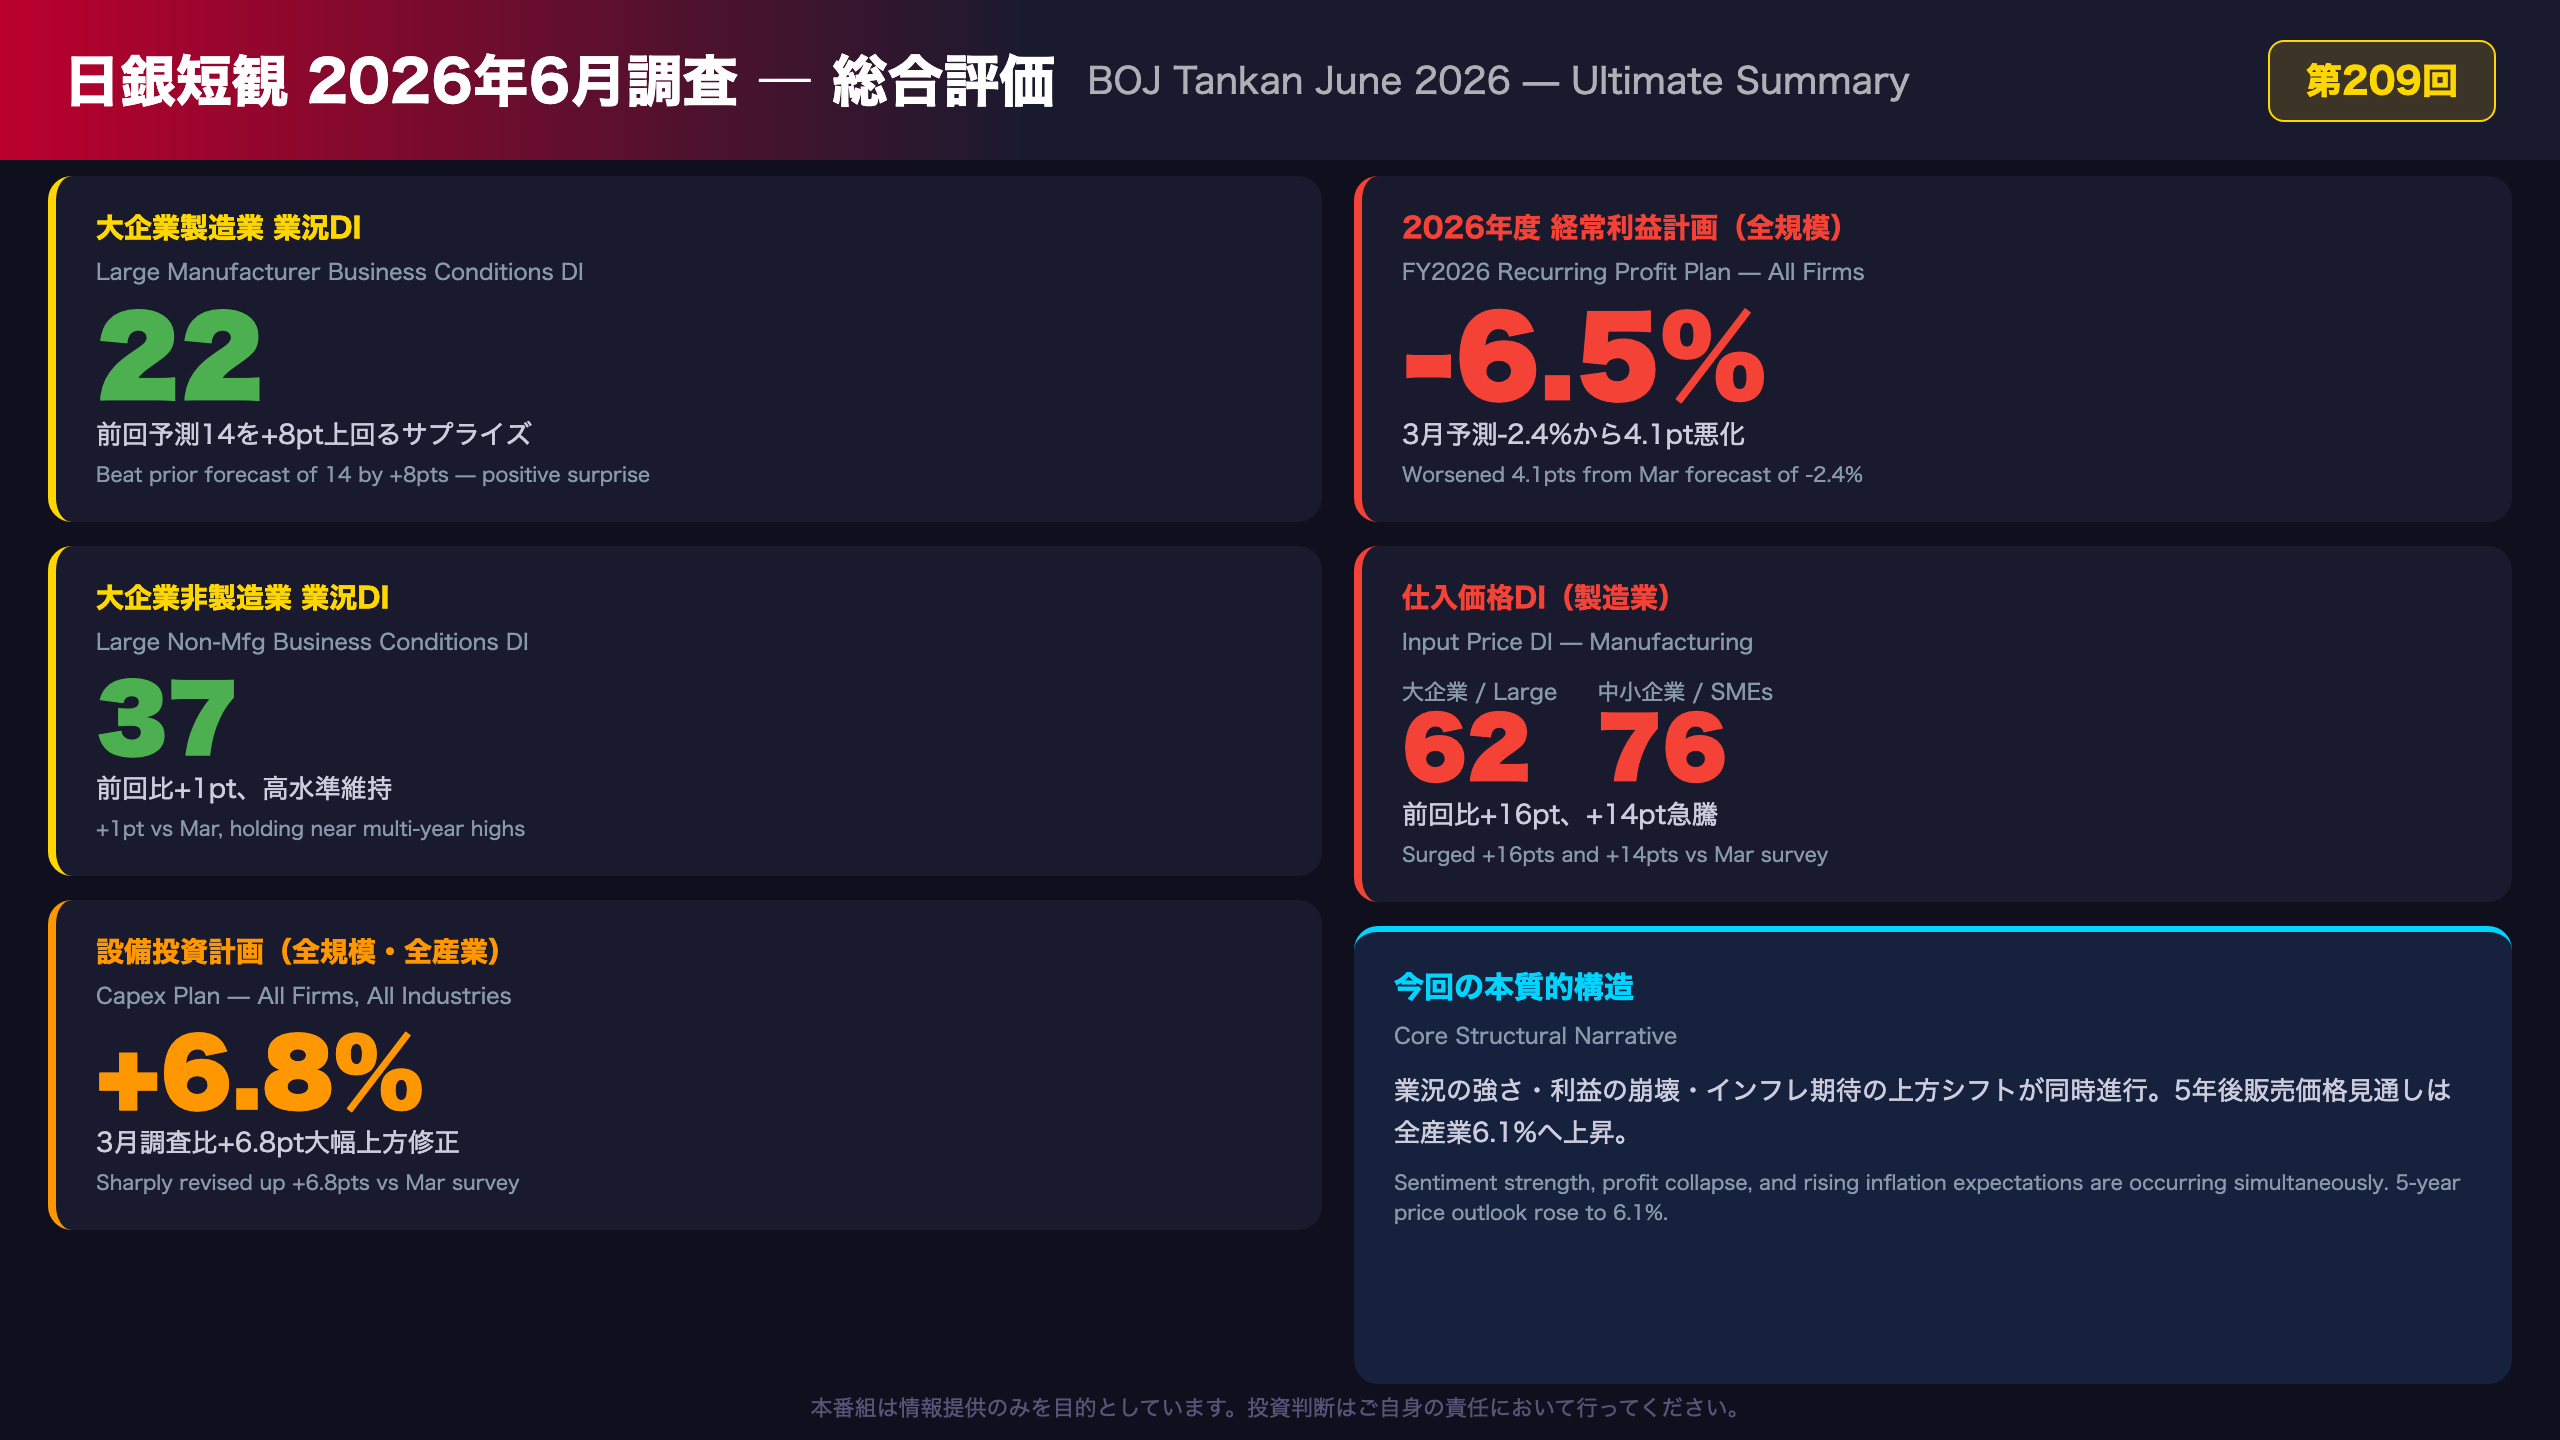
The large manufacturer DI surged to 22, beating the prior forecast of 14 by 8 points — a significant positive surprise. Large non-manufacturer DI held at 37, near multi-year highs. The all-industry, all-size DI remained stable at 18, matching the March reading.
The Profit Collapse Beneath the Surface
Despite the sentiment beat, FY2026 recurring profit plans were revised sharply lower to -6.5% across all firms, compared to the -2.4% forecast in the March survey. Large manufacturers guided for -6.7% and large non-manufacturers for -6.3%. Critically, revenue plans were revised upward to +2.5% — meaning firms expect to sell more but earn less. This divergence strongly suggests that cost pressures are outpacing firms’ ability to pass them through to customers (Level B inference).
International Context
For comparison, U.S. S&P 500 companies have generally maintained profit margins through aggressive price increases. Japan’s corporate sector faces a structurally different challenge: decades of deflationary psychology have conditioned both firms and consumers to resist price hikes, making full cost pass-through more difficult even as input costs surge.
Forward Look
The September 2026 Tankan (expected release: October 2026) will be critical. Forward-looking DI forecasts point to sharp deterioration — large manufacturer DI expected at 17 (from 22), large non-manufacturer at 28 (from 37). Whether these pessimistic forecasts materialize will be a key input for BOJ’s autumn policy deliberations.
Deep Dive 1:業況DIサプライズの解剖 ― 何が予測を裏切ったか
Dissecting the DI Surprise: Manufacturing vs. Non-Manufacturing Divergence
Scale of the Forecast Miss
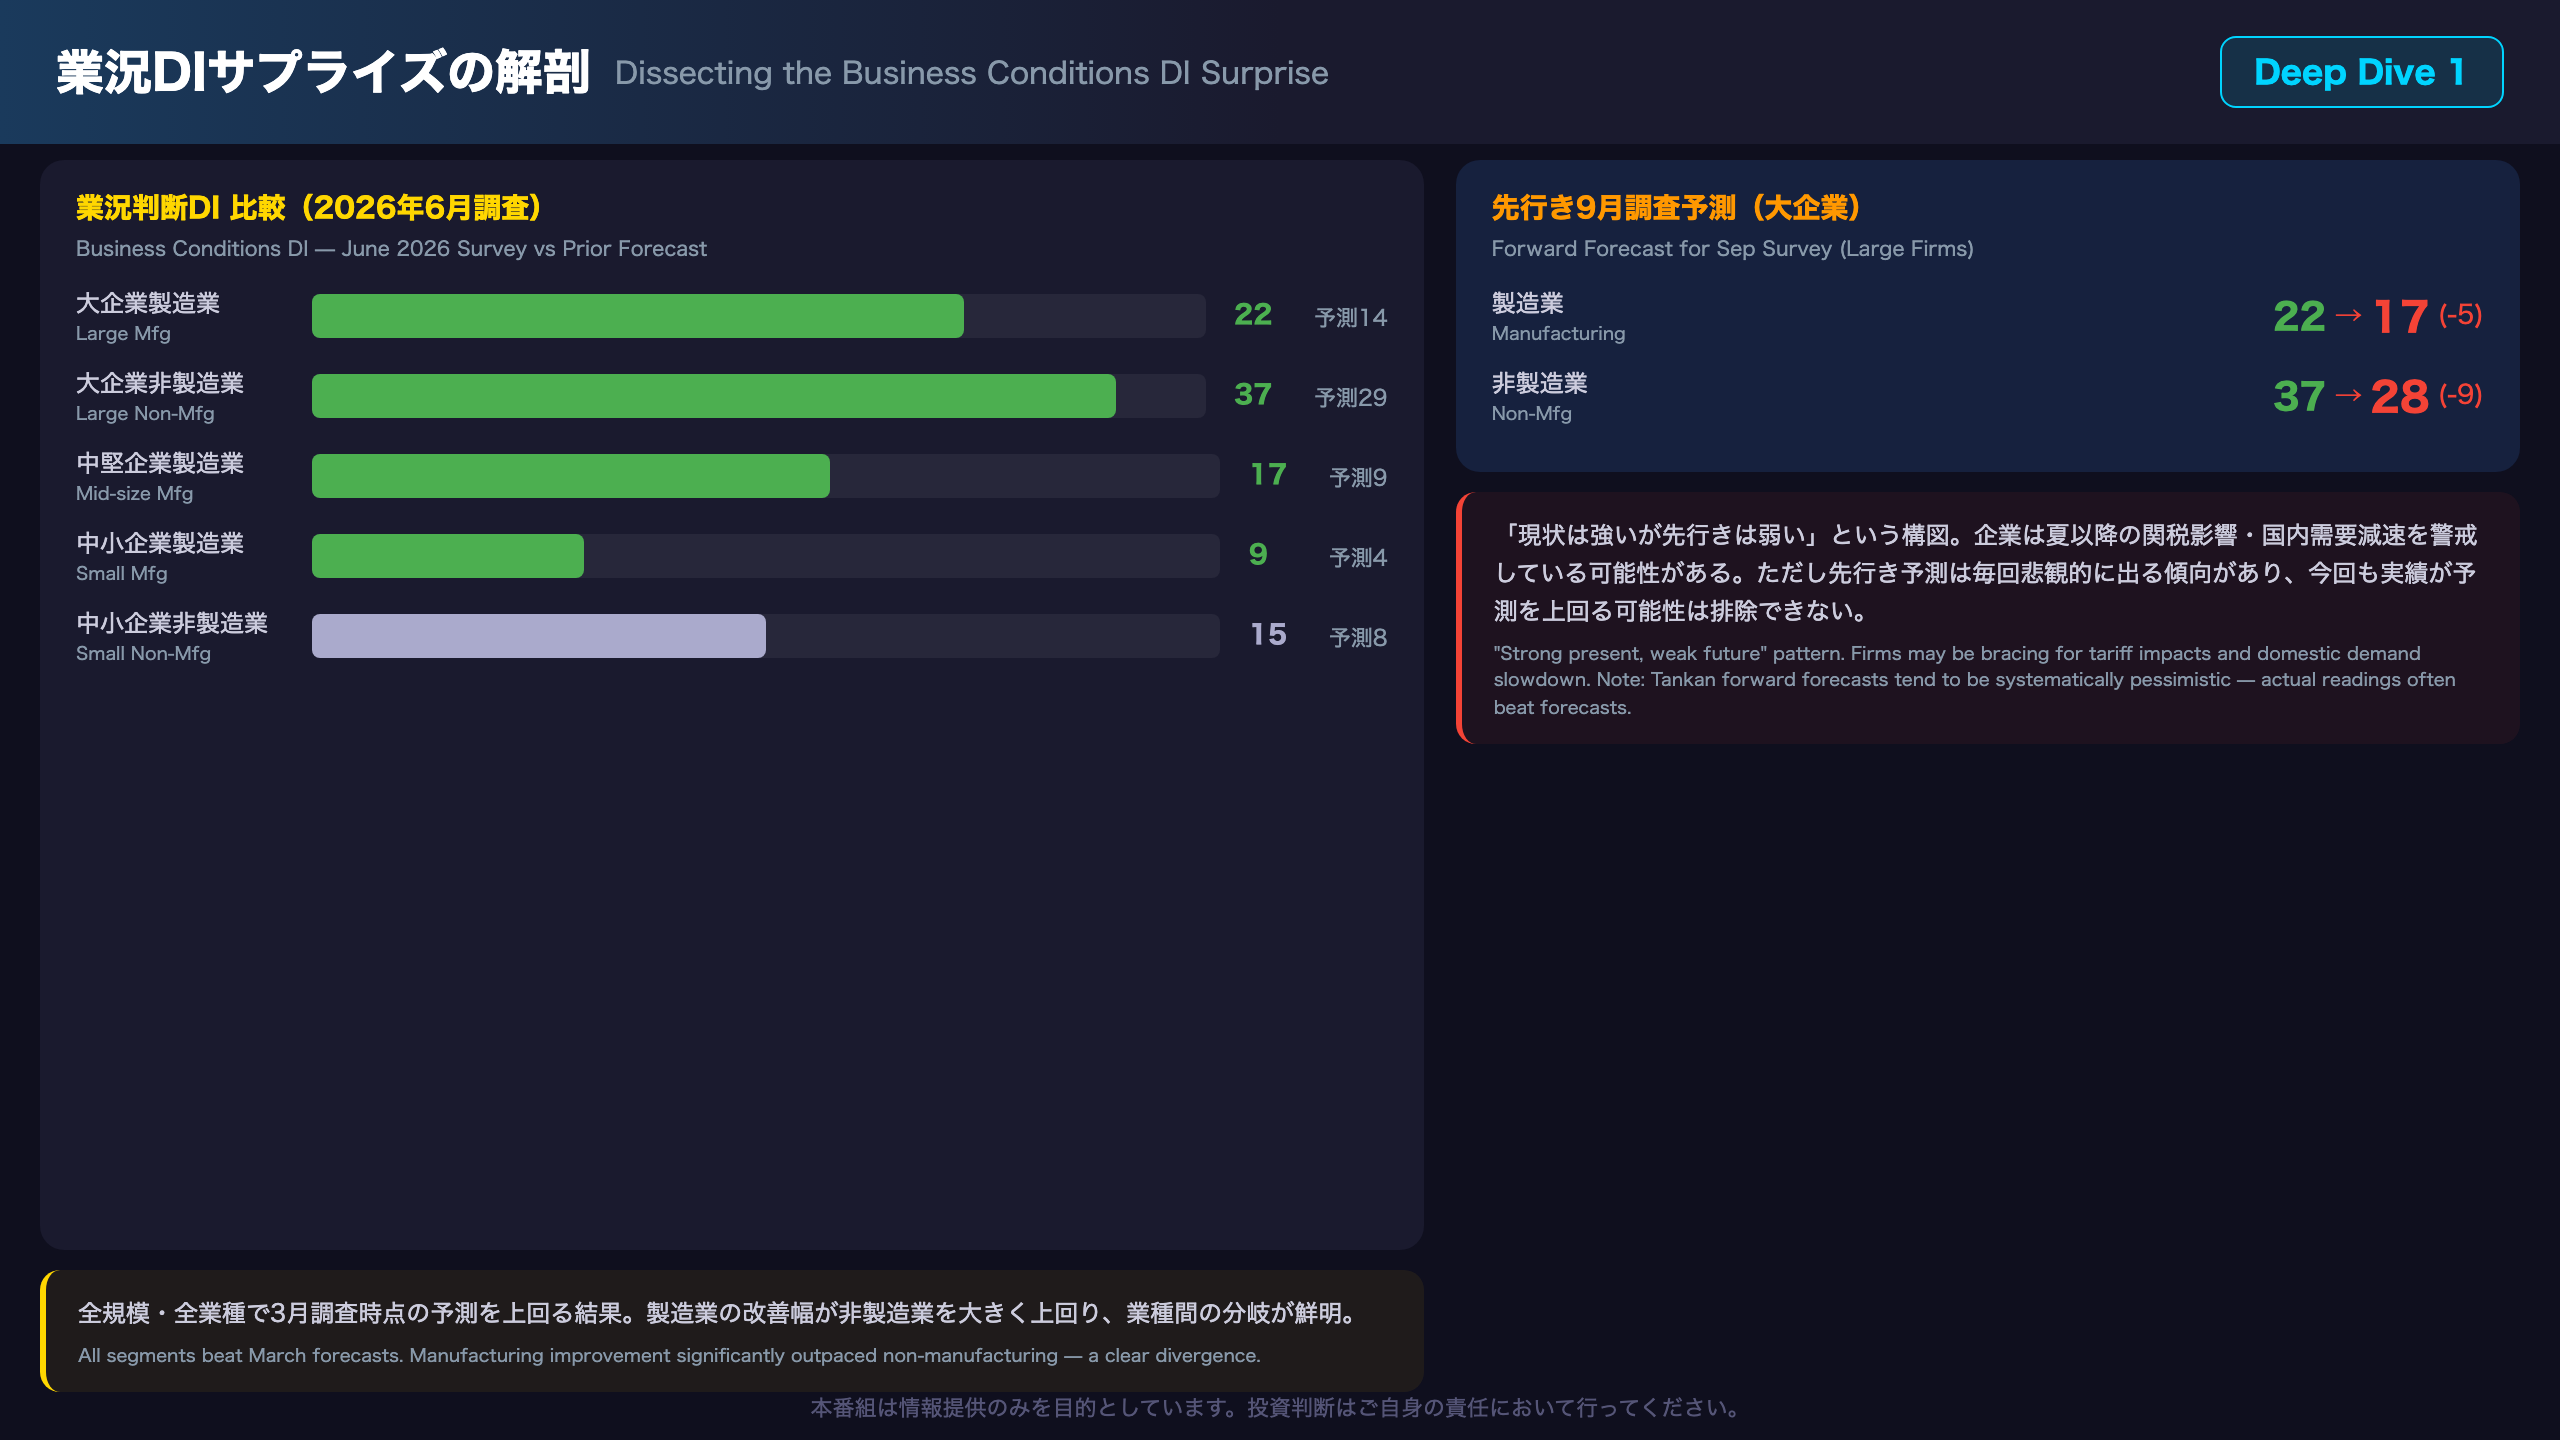
The most striking feature of the June 2026 Tankan is the magnitude of the forecast miss for large manufacturer DI. The March survey’s forecast for June was 14; the actual reading came in at 22 — an 8-point beat. In the context of Tankan forecast accuracy, this is a substantial deviation, suggesting that firms in March may have been overly pessimistic about U.S. tariff risks and yen appreciation risks (Level C inference).
Size-Breakdown Detail
| Segment | Mar Survey | Jun Survey | Change | Jun Forecast (as of Mar) |
|---|---|---|---|---|
| Large Mfg | 17 | 22 | +5 | 14 (forecast: -3) |
| Mid-size Mfg | 16 | 17 | +1 | 9 (forecast: -7) |
| Small Mfg | 7 | 9 | +2 | 4 (forecast: -3) |
| Large Non-Mfg | 36 | 37 | +1 | 29 (forecast: -7) |
| Small Non-Mfg | 16 | 15 | -1 | 8 (forecast: -8) |
The beat was broad-based across manufacturing firm sizes. Non-manufacturers also beat forecasts but by a smaller margin.
The Forward-Looking Warning
Despite the current strength, forward-looking DI forecasts for the September survey point to sharp deterioration. Large manufacturer DI is expected to fall to 17 (-5 points), and large non-manufacturer DI to 28 (-9 points). This “strong present, weak future” pattern suggests firms are bracing for headwinds in H2 2026 — potentially from tariff impacts, domestic demand slowdown, or rising borrowing costs from BOJ rate hikes.
BOJ Policy Context
For the BOJ, a DI of 22 for large manufacturers is a supportive data point for continued policy normalization. However, the sharp forward deterioration forecasts introduce uncertainty. The BOJ will likely monitor whether the September actual reading confirms or contradicts these pessimistic forecasts before making its next rate decision.
Deep Dive 2:インフレの嵐 ― 仕入価格急騰と価格転嫁の加速
The Inflation Storm: Input Cost Surge and Accelerating Price Pass-Through
The Magnitude of the Input Price Surge
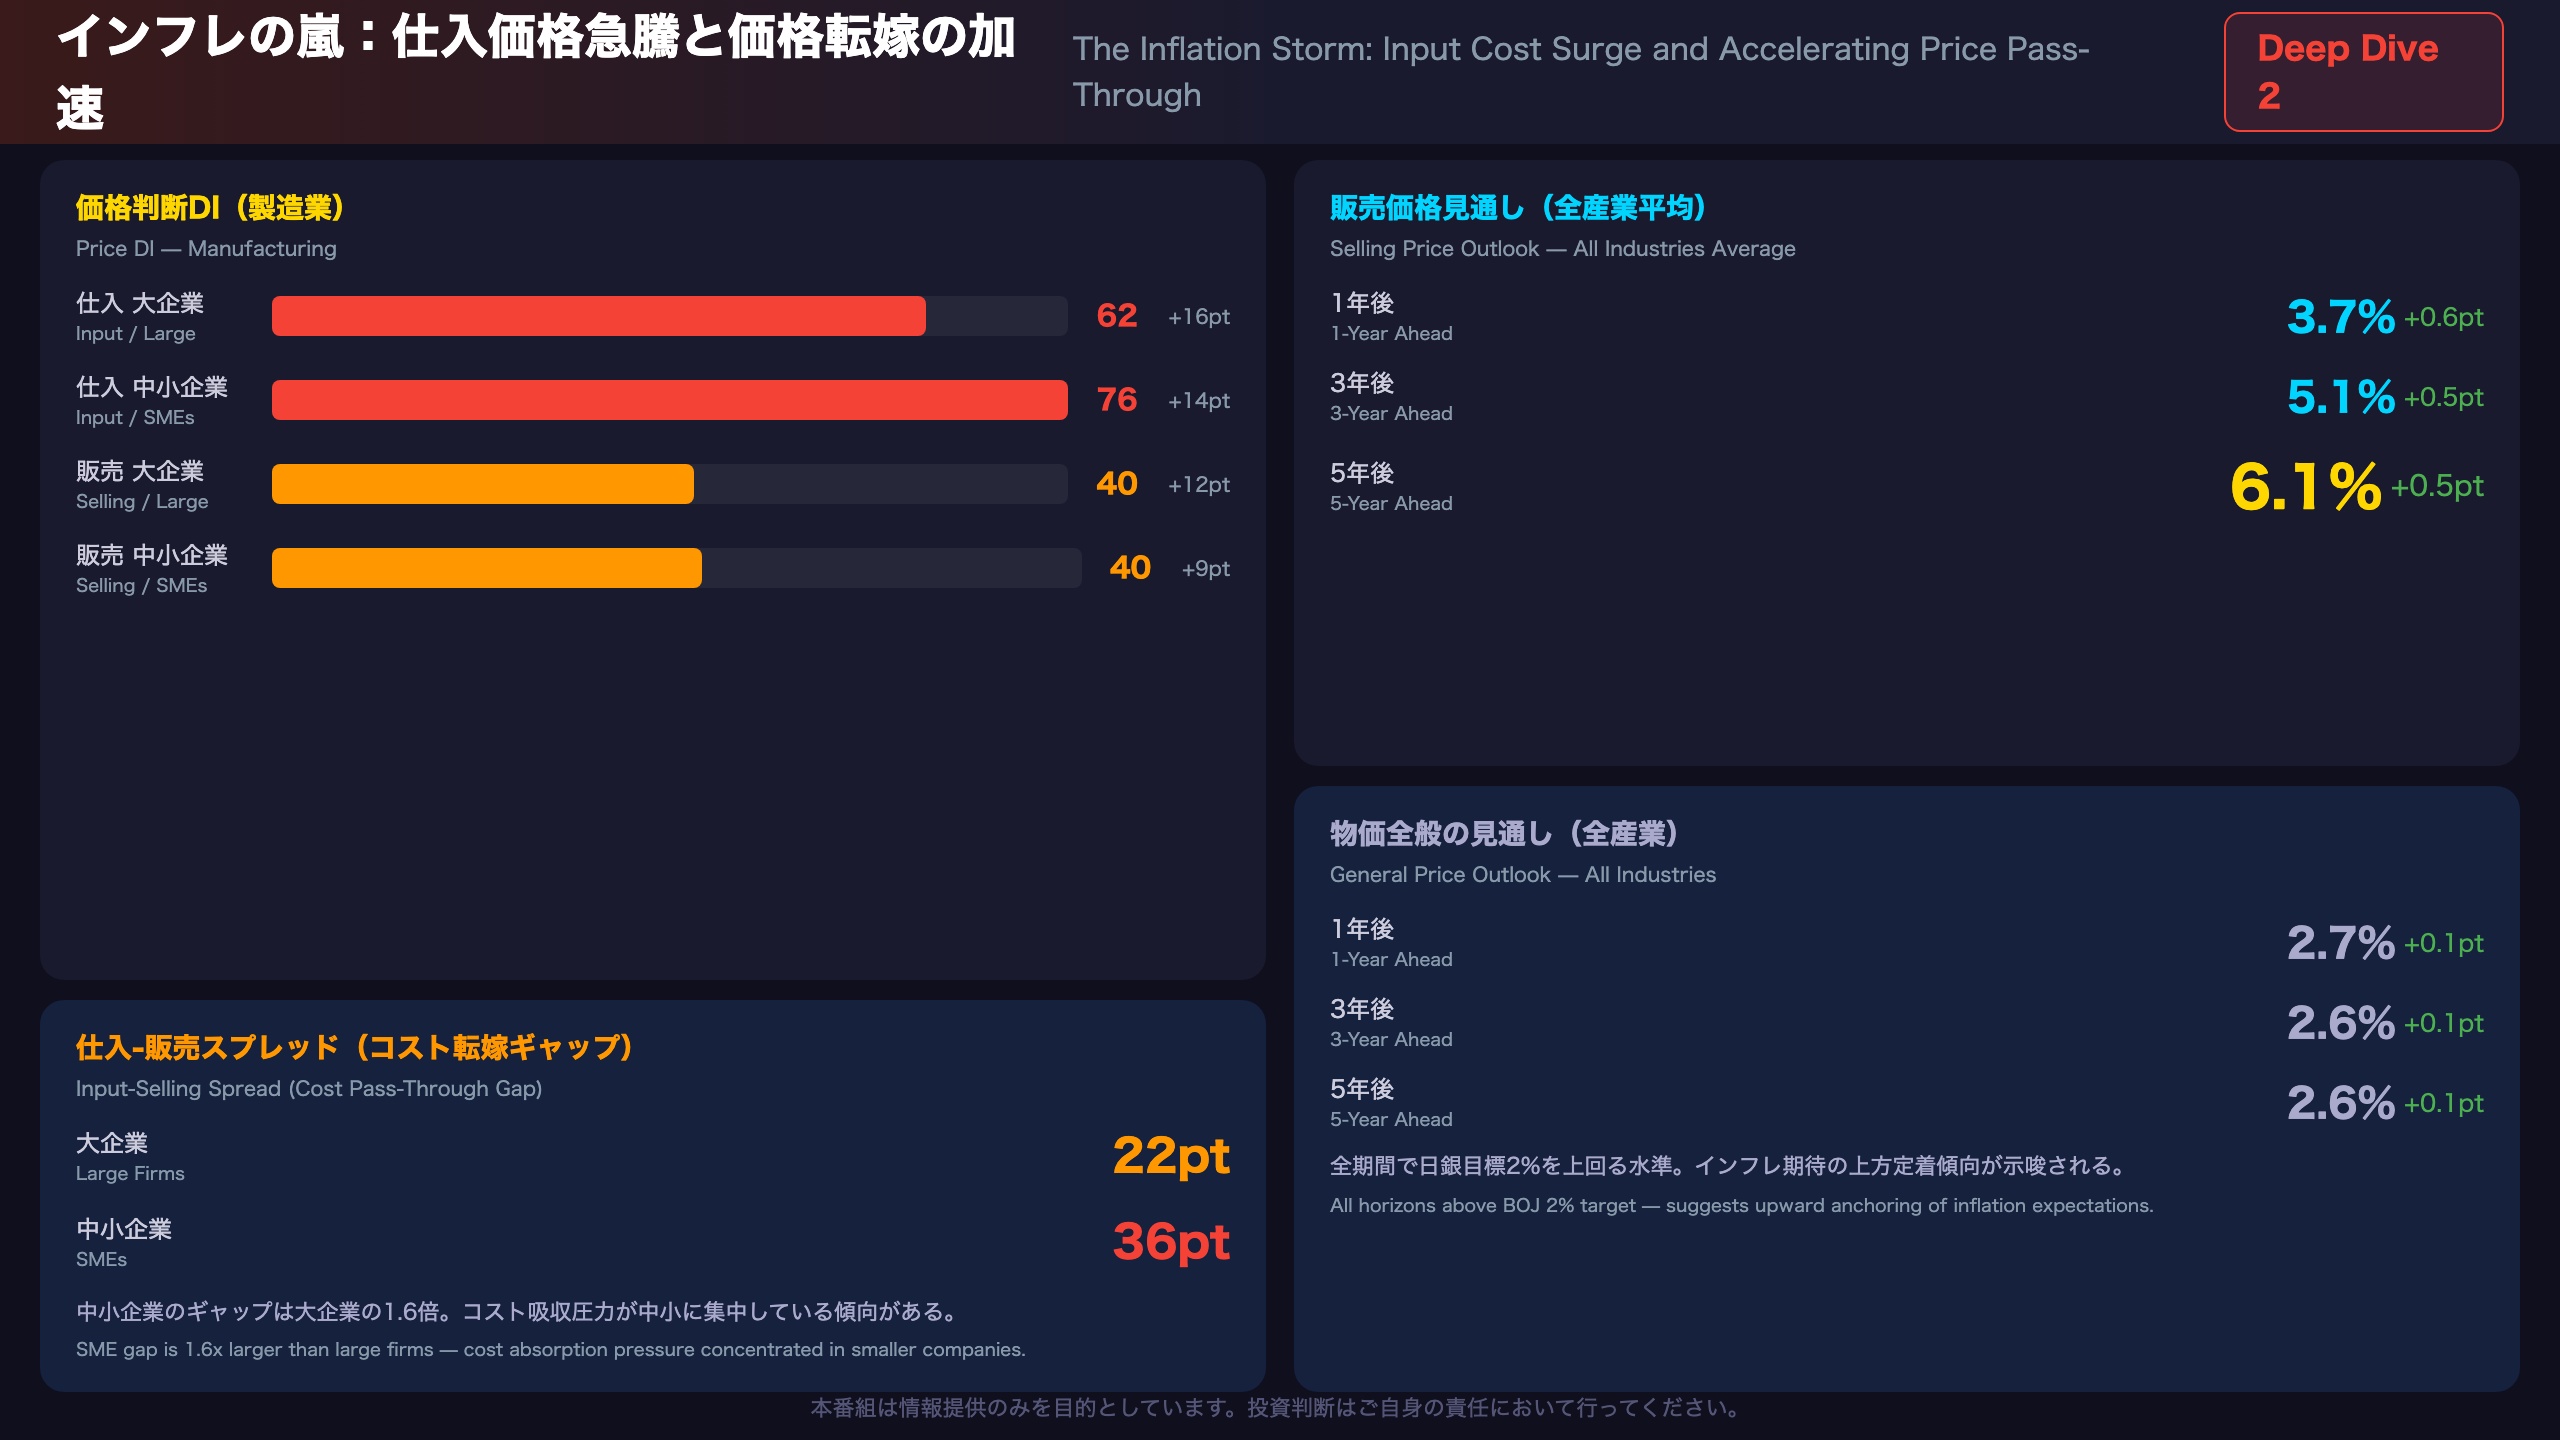
The input price DI jump in this Tankan is remarkable. Large manufacturer input price DI surged from 46 to 62 (+16pts), beating the March forecast of 52 by 10 points. SME input price DI rose from 62 to 76 (+14pts), beating the forecast of 69 by 7 points. This “worse-than-expected cost surge” suggests that tariff hikes and yen depreciation may have had a larger-than-anticipated impact on input costs (Level C inference).
The Input-Output Price Spread
The spread between input and selling price DIs reveals a critical asymmetry:
– Large firms: Input DI 62 vs Selling DI 40 → Spread: 22pts
– SMEs: Input DI 76 vs Selling DI 40 → Spread: 36pts
SMEs face a spread 1.6x wider than large firms, suggesting smaller companies are absorbing more cost pressure than they can pass through to customers (Level B inference). However, selling price DI also surged sharply, indicating pass-through is accelerating even if incomplete.
Structural Shift in Price Expectations
Firms’ selling price outlooks (all industries average) were revised upward across all time horizons:
| Horizon | Mar Survey | Jun Survey | Change |
|———|———–|———–|——–|
| 1-year | 3.1% | 3.7% | +0.6pt |
| 3-year | 4.6% | 5.1% | +0.5pt |
| 5-year | 5.6% | 6.1% | +0.5pt |
SME manufacturers showed the largest 1-year revision: 3.5% → 4.6% (+1.1pts). SME inflation expectations are rising faster than large firms — a potential leading indicator of broader price pressures.
BOJ Implications
The general price outlook (all industries) stands at 2.7% for 1-year ahead, 2.6% for 3-year and 5-year — all above the BOJ’s 2% target. The 5-year large firm outlook rose to 2.2% (+0.2pts). This data, combined with the input price surge, provides the BOJ with additional justification for continued rate normalization. However, the BOJ will also weigh the profit collapse and forward DI deterioration against these inflationary signals.
Deep Dive 3:設備投資の大幅上方修正 ― 強さの実態と構造
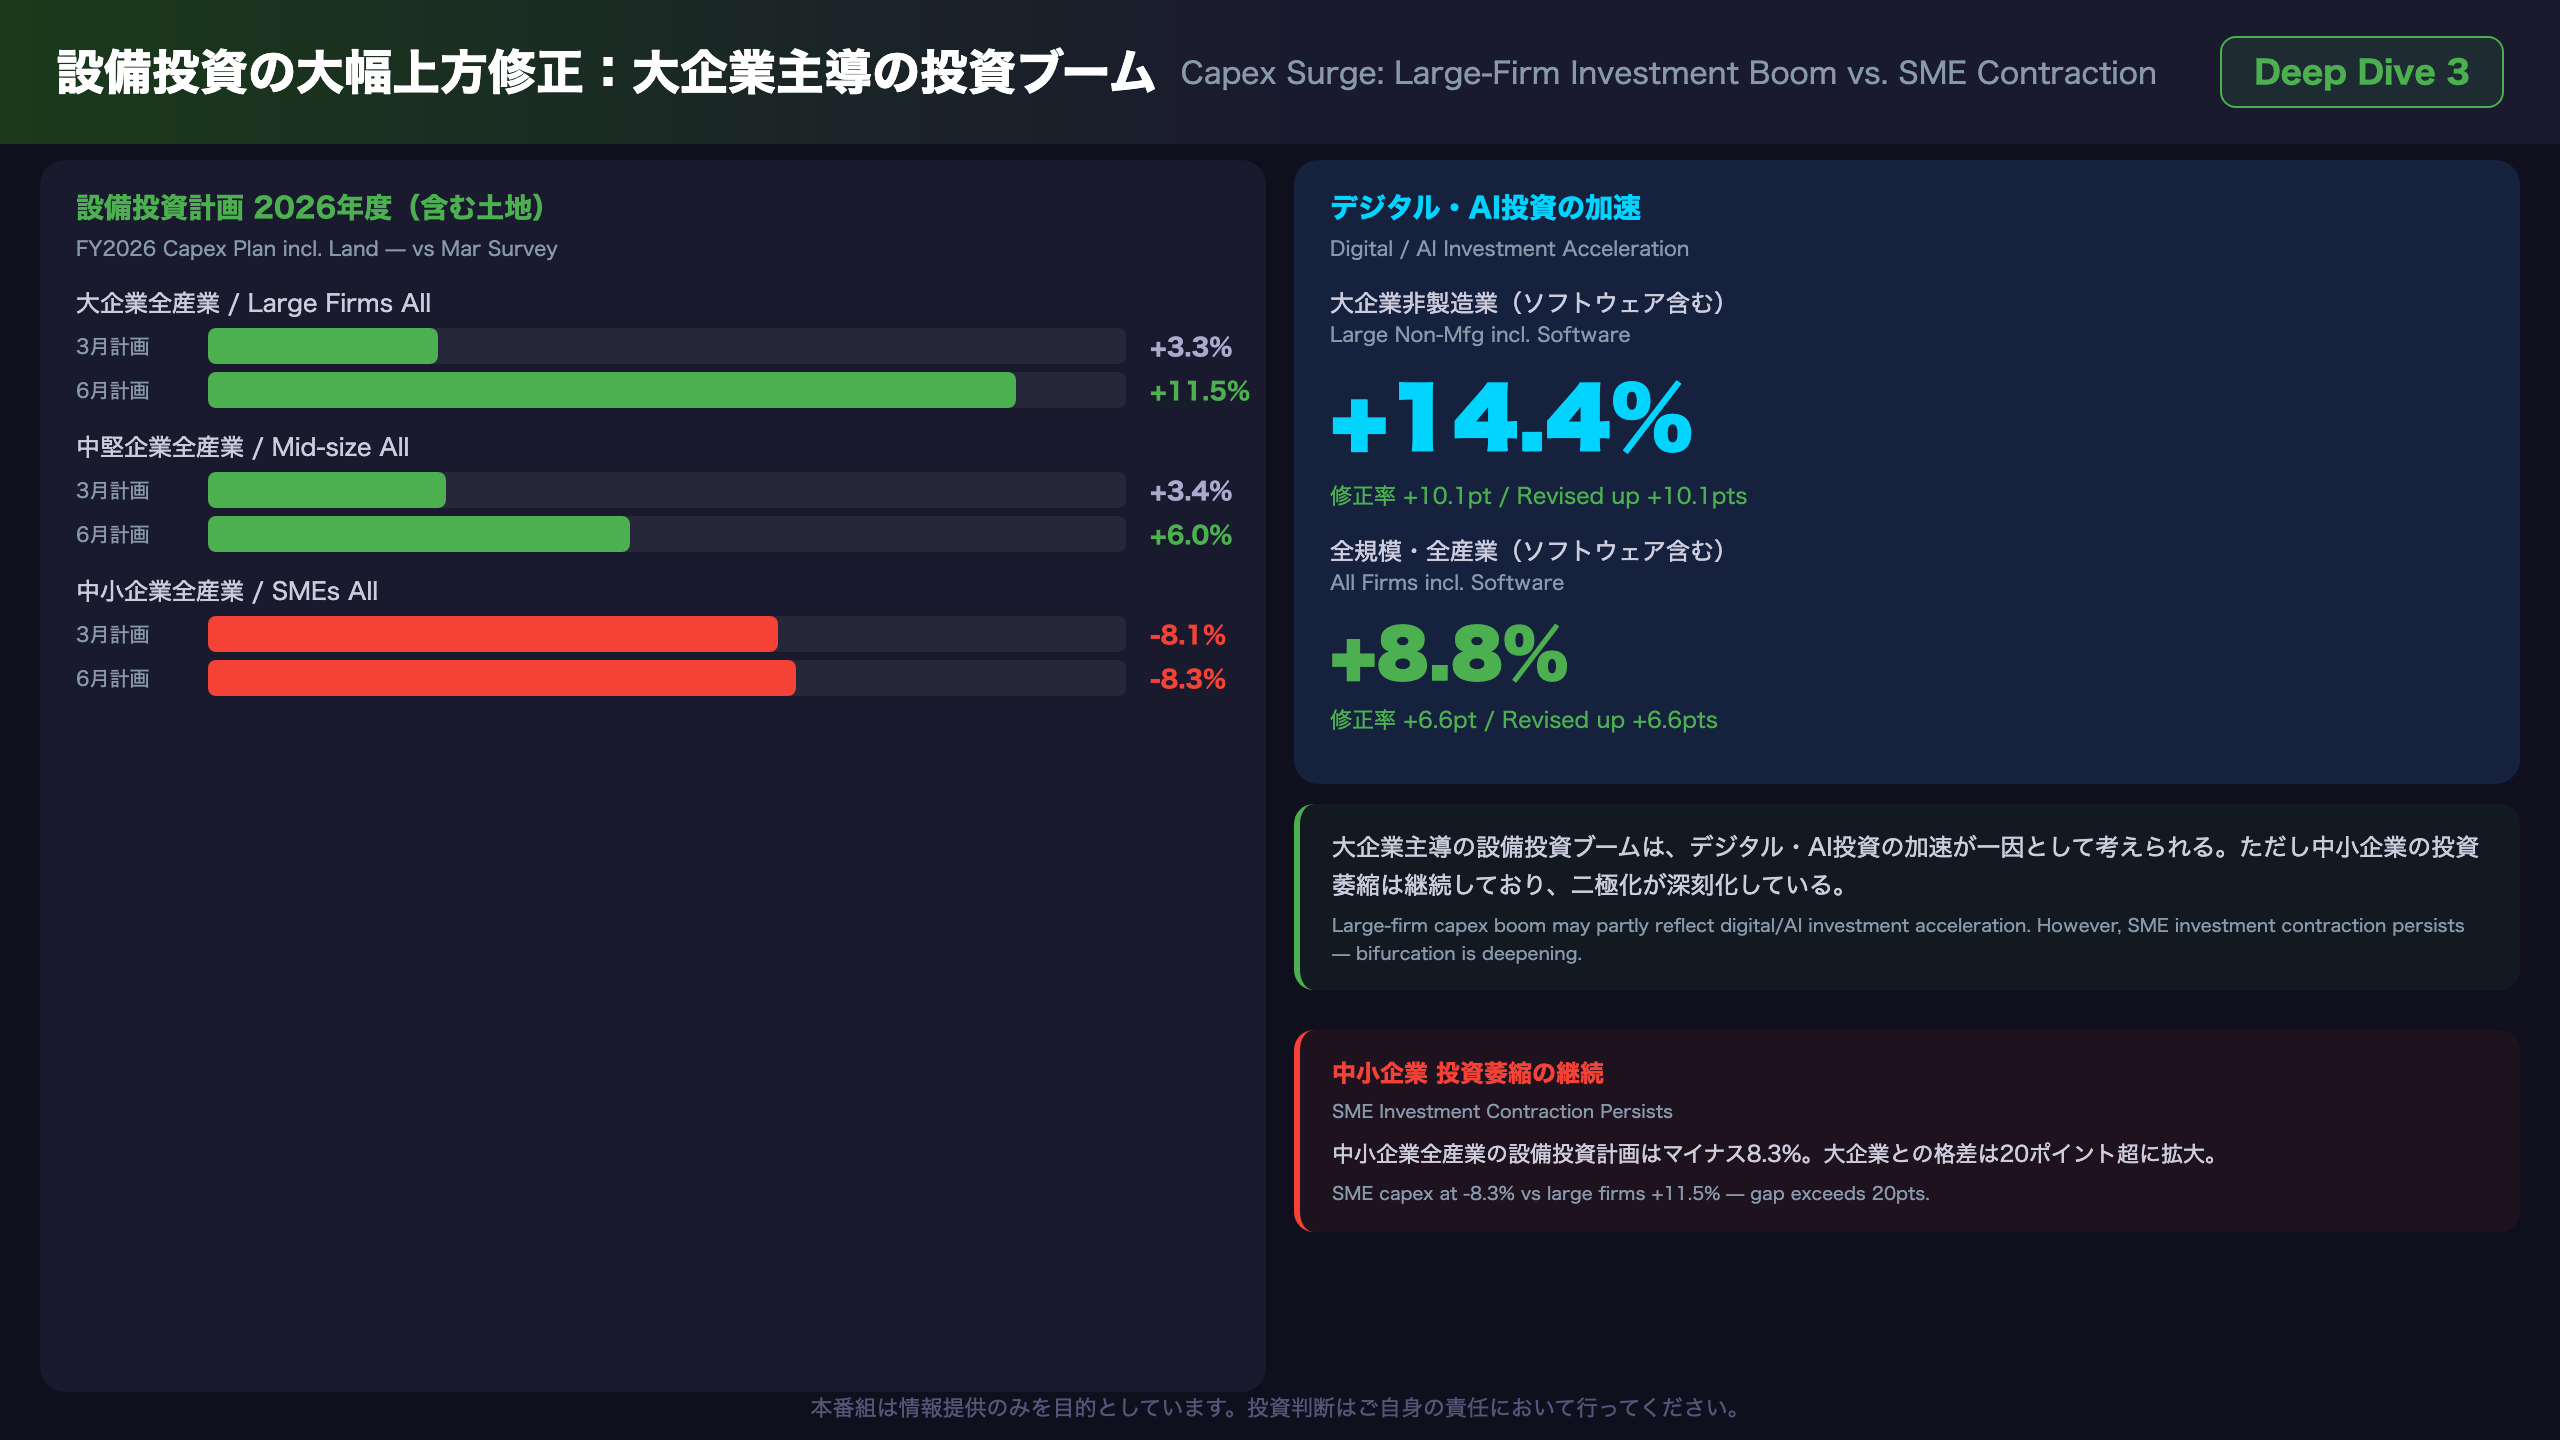
Capex Surge: Large-Firm Investment Boom vs. SME Investment Contraction
Scale of the Upward Revision
The magnitude of the capex plan revision is striking. All-firm, all-industry capex (including land) for FY2026 was revised from +1.3% to +6.8% — a 5.5-point upward revision in just one quarter. While the Tankan has a well-known seasonal pattern of conservative initial plans being revised upward as the fiscal year progresses, the scale of this revision appears larger than typical.
The Large Firm vs. SME Bifurcation
| Segment | FY2025 Actual | FY2026 Plan | Revision |
|---|---|---|---|
| Large firms (all) | +10.1% | +11.5% | +7.2pts |
| Mid-size firms (all) | +9.5% | +6.0% | +3.8pts |
| SMEs (all) | +6.9% | -8.3% | +9.1pts |
SME capex is planned at -8.3% for FY2026 — a sharp contraction. This was already -8.1% in the March survey, confirming weak SME investment appetite. The large revision rate (+9.1pts) reflects that the prior survey’s plan was even worse. This bifurcation between large-firm investment expansion and SME contraction is a structural concern for Japan’s broader economic vitality.
Digital and AI Investment Acceleration
The standout figure in software-inclusive capex is large non-manufacturer at +14.4% (revised up +10.1pts). This likely reflects accelerating digital transformation and AI investment among Japan’s service-sector giants (Level C inference). Large manufacturers also showed solid growth at +7.7%.
Overseas Investment Context
On a consolidated basis, the overseas capex ratio for FY2026 is planned at 32.17% for manufacturers and 22.63% for non-manufacturers. The manufacturing overseas ratio is declining slightly, while non-manufacturer overseas investment is expanding — potentially reflecting service-sector globalization. Total overseas capex growth is planned at +8.2% for FY2026, suggesting Japanese multinationals continue to invest abroad despite domestic capex acceleration.
Deep Dive 4:利益崩壊の解剖 ― 売上増・利益減のパラドックス
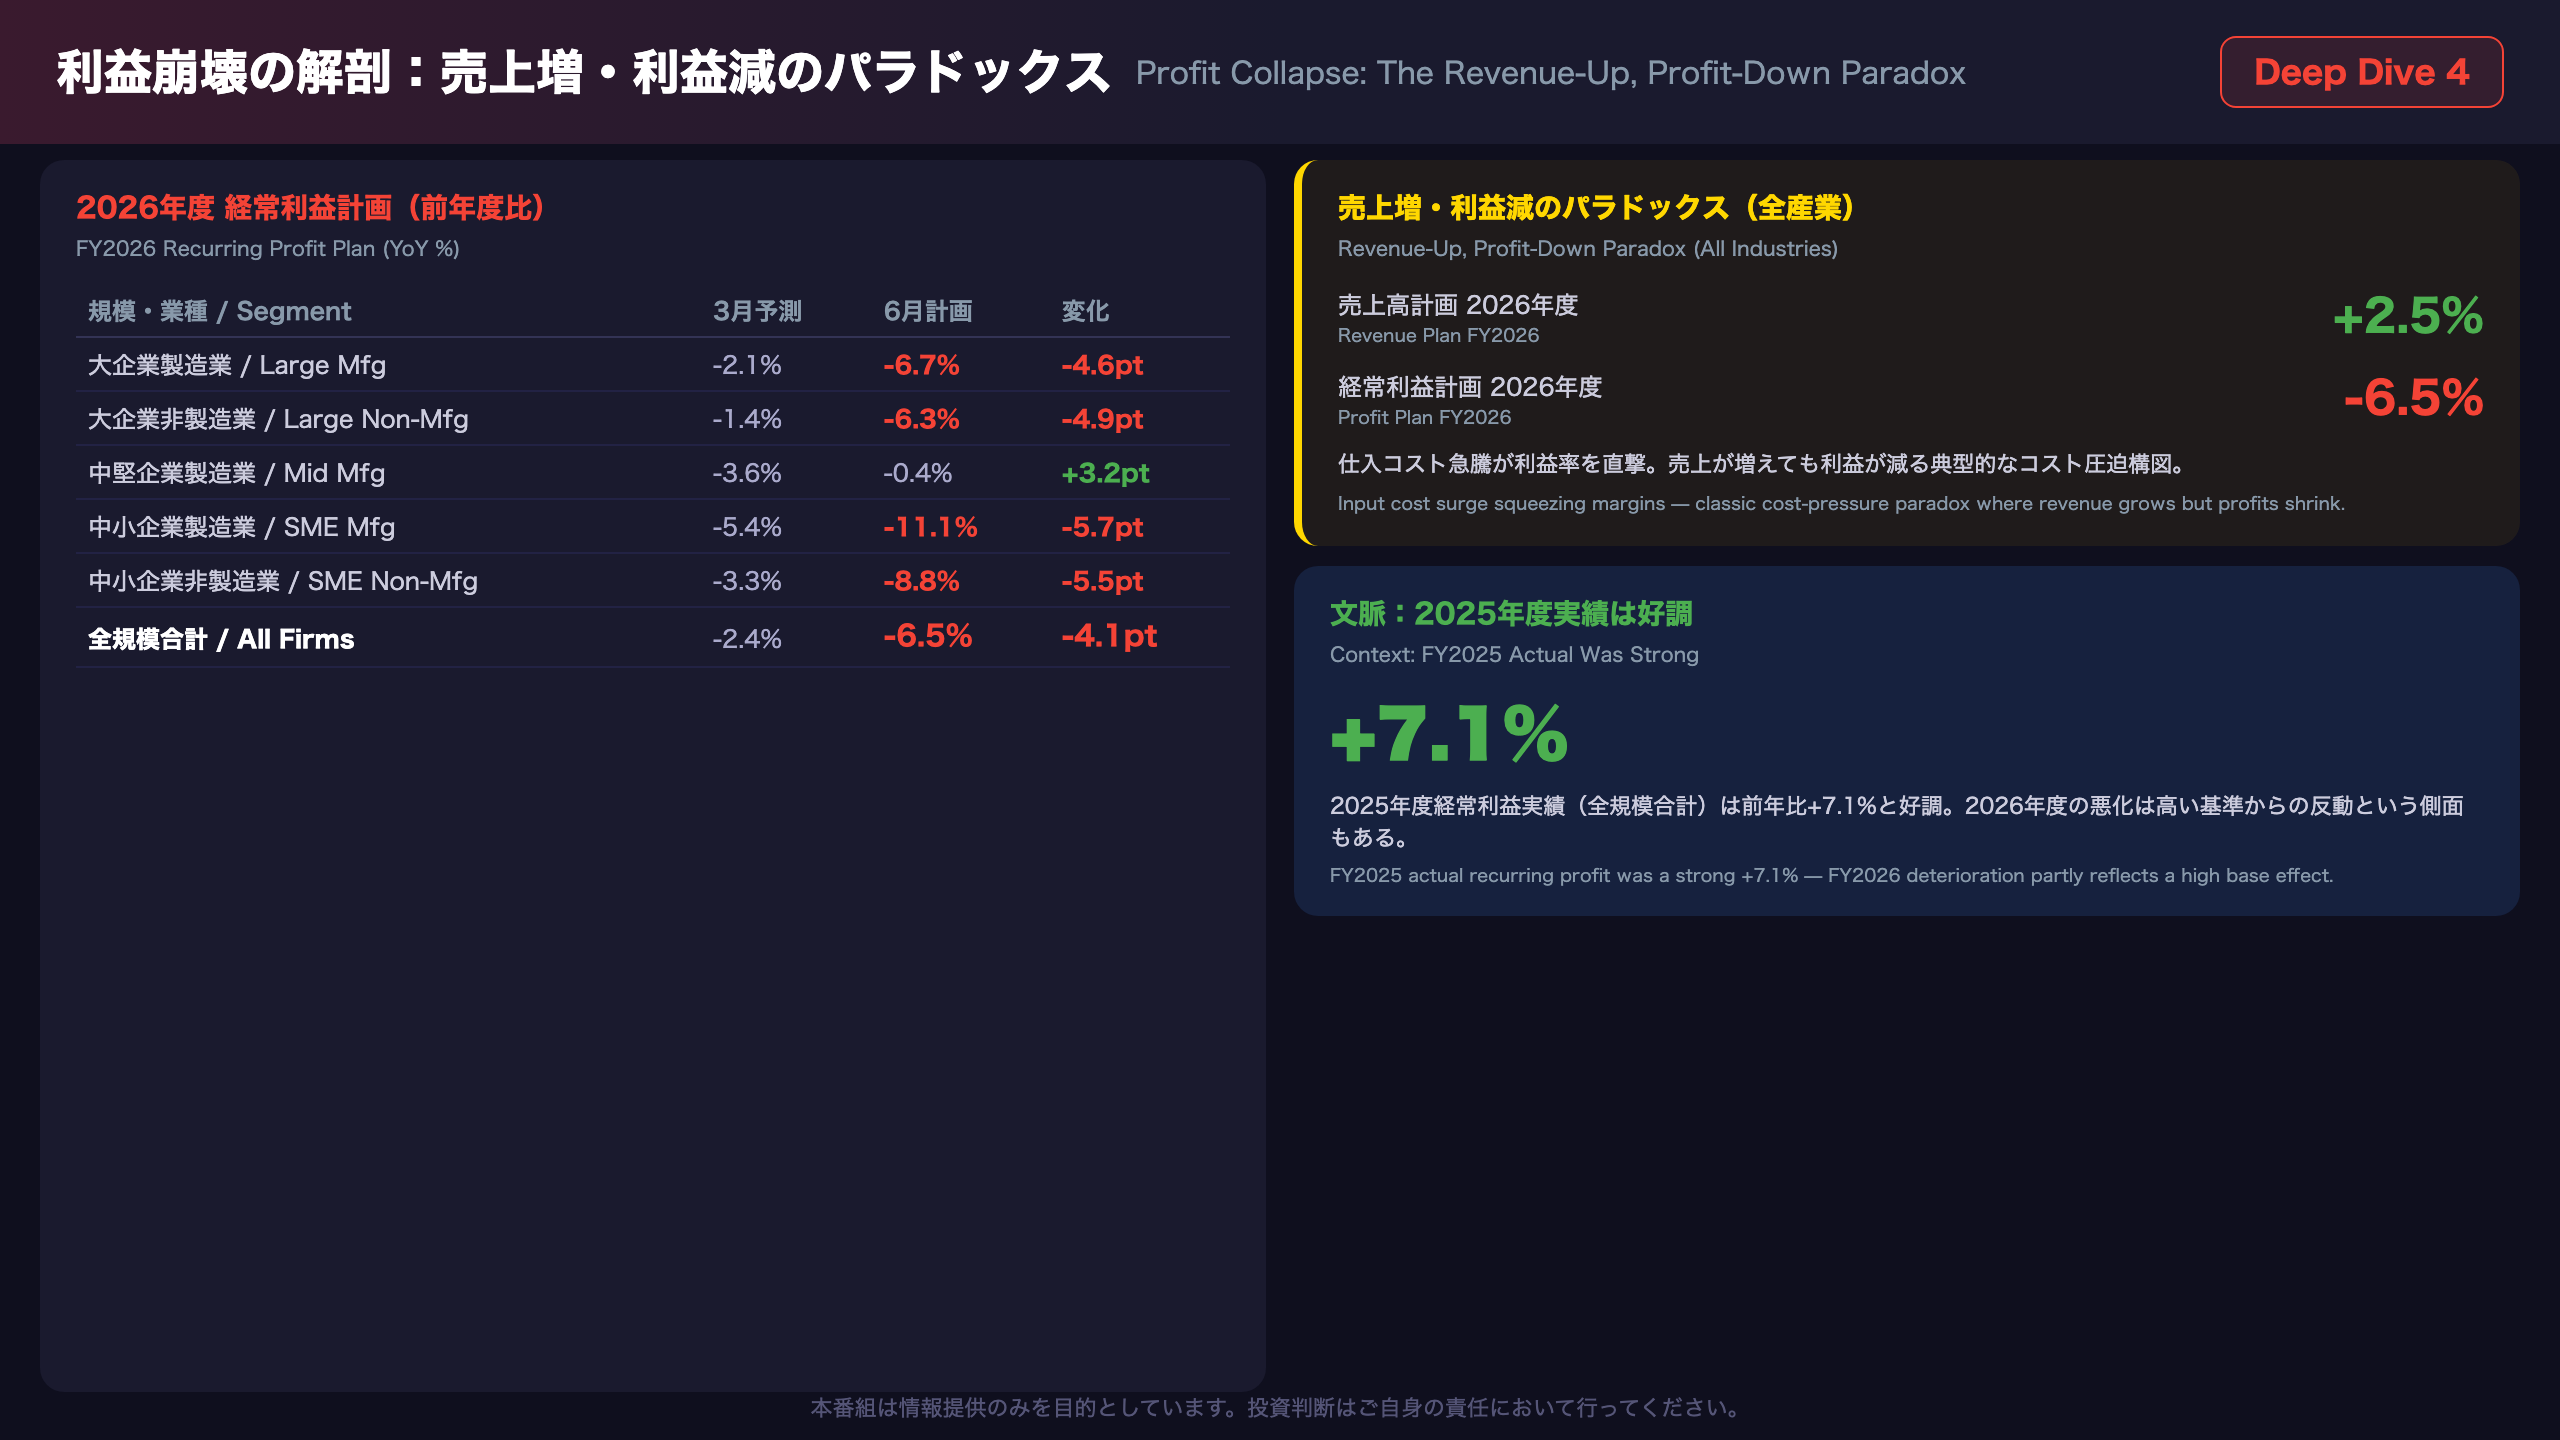
Dissecting the Profit Collapse: The Revenue-Up, Profit-Down Paradox
Full-Scale Profit Plan Deterioration
FY2026 recurring profit plan details:
| Segment | Mar Forecast | Jun Plan | Change |
|———|————-|———|——–|
| Large Mfg | -2.1% | -6.7% | -4.6pts |
| Large Non-Mfg | -1.4% | -6.3% | -4.9pts |
| Mid-size Mfg | -3.6% | -0.4% | +3.2pts |
| Mid-size Non-Mfg | -3.2% | -5.1% | -1.9pts |
| SME Mfg | -5.4% | -11.1% | -5.7pts |
| SME Non-Mfg | -3.3% | -8.8% | -5.5pts |
| All firms | -2.4% | -6.5% | -4.1pts |
Only mid-size manufacturers improved from the March forecast. All other segments deteriorated, with SMEs showing the largest worsening.
Profit Margin Compression
Large firm operating profit margins are expected to compress from 10.6% in FY2025 (manufacturing 12.13%, non-manufacturing 9.17%) to approximately 9.6% in FY2026 (manufacturing 10.88%, non-manufacturing 8.30%). This margin compression directly reflects the input cost surge identified in the price DI data (Level B inference).
Context: Strong FY2025 Baseline
A critical piece of context: FY2025 actual recurring profit came in at a strong +7.1% for all firms — large manufacturers +3.2%, large non-manufacturers +7.0%, SME manufacturers +13.0%. The FY2026 deterioration is partly a reversal from this strong base. This does not eliminate the concern, but it contextualizes the magnitude.
FX Assumption Revision
Firms revised their FY2026 USD/JPY assumption to 152.57 (from 150.10 in March) — a 2.47-yen depreciation. Yen weakness is a double-edged sword: it boosts export revenues but amplifies import cost pressures, contributing to the input price surge documented in the price DI data. The net effect on profits appears negative in aggregate, as the profit plan deterioration despite revenue upward revision suggests.
インプリケーション:日銀政策・市場・生活への示唆
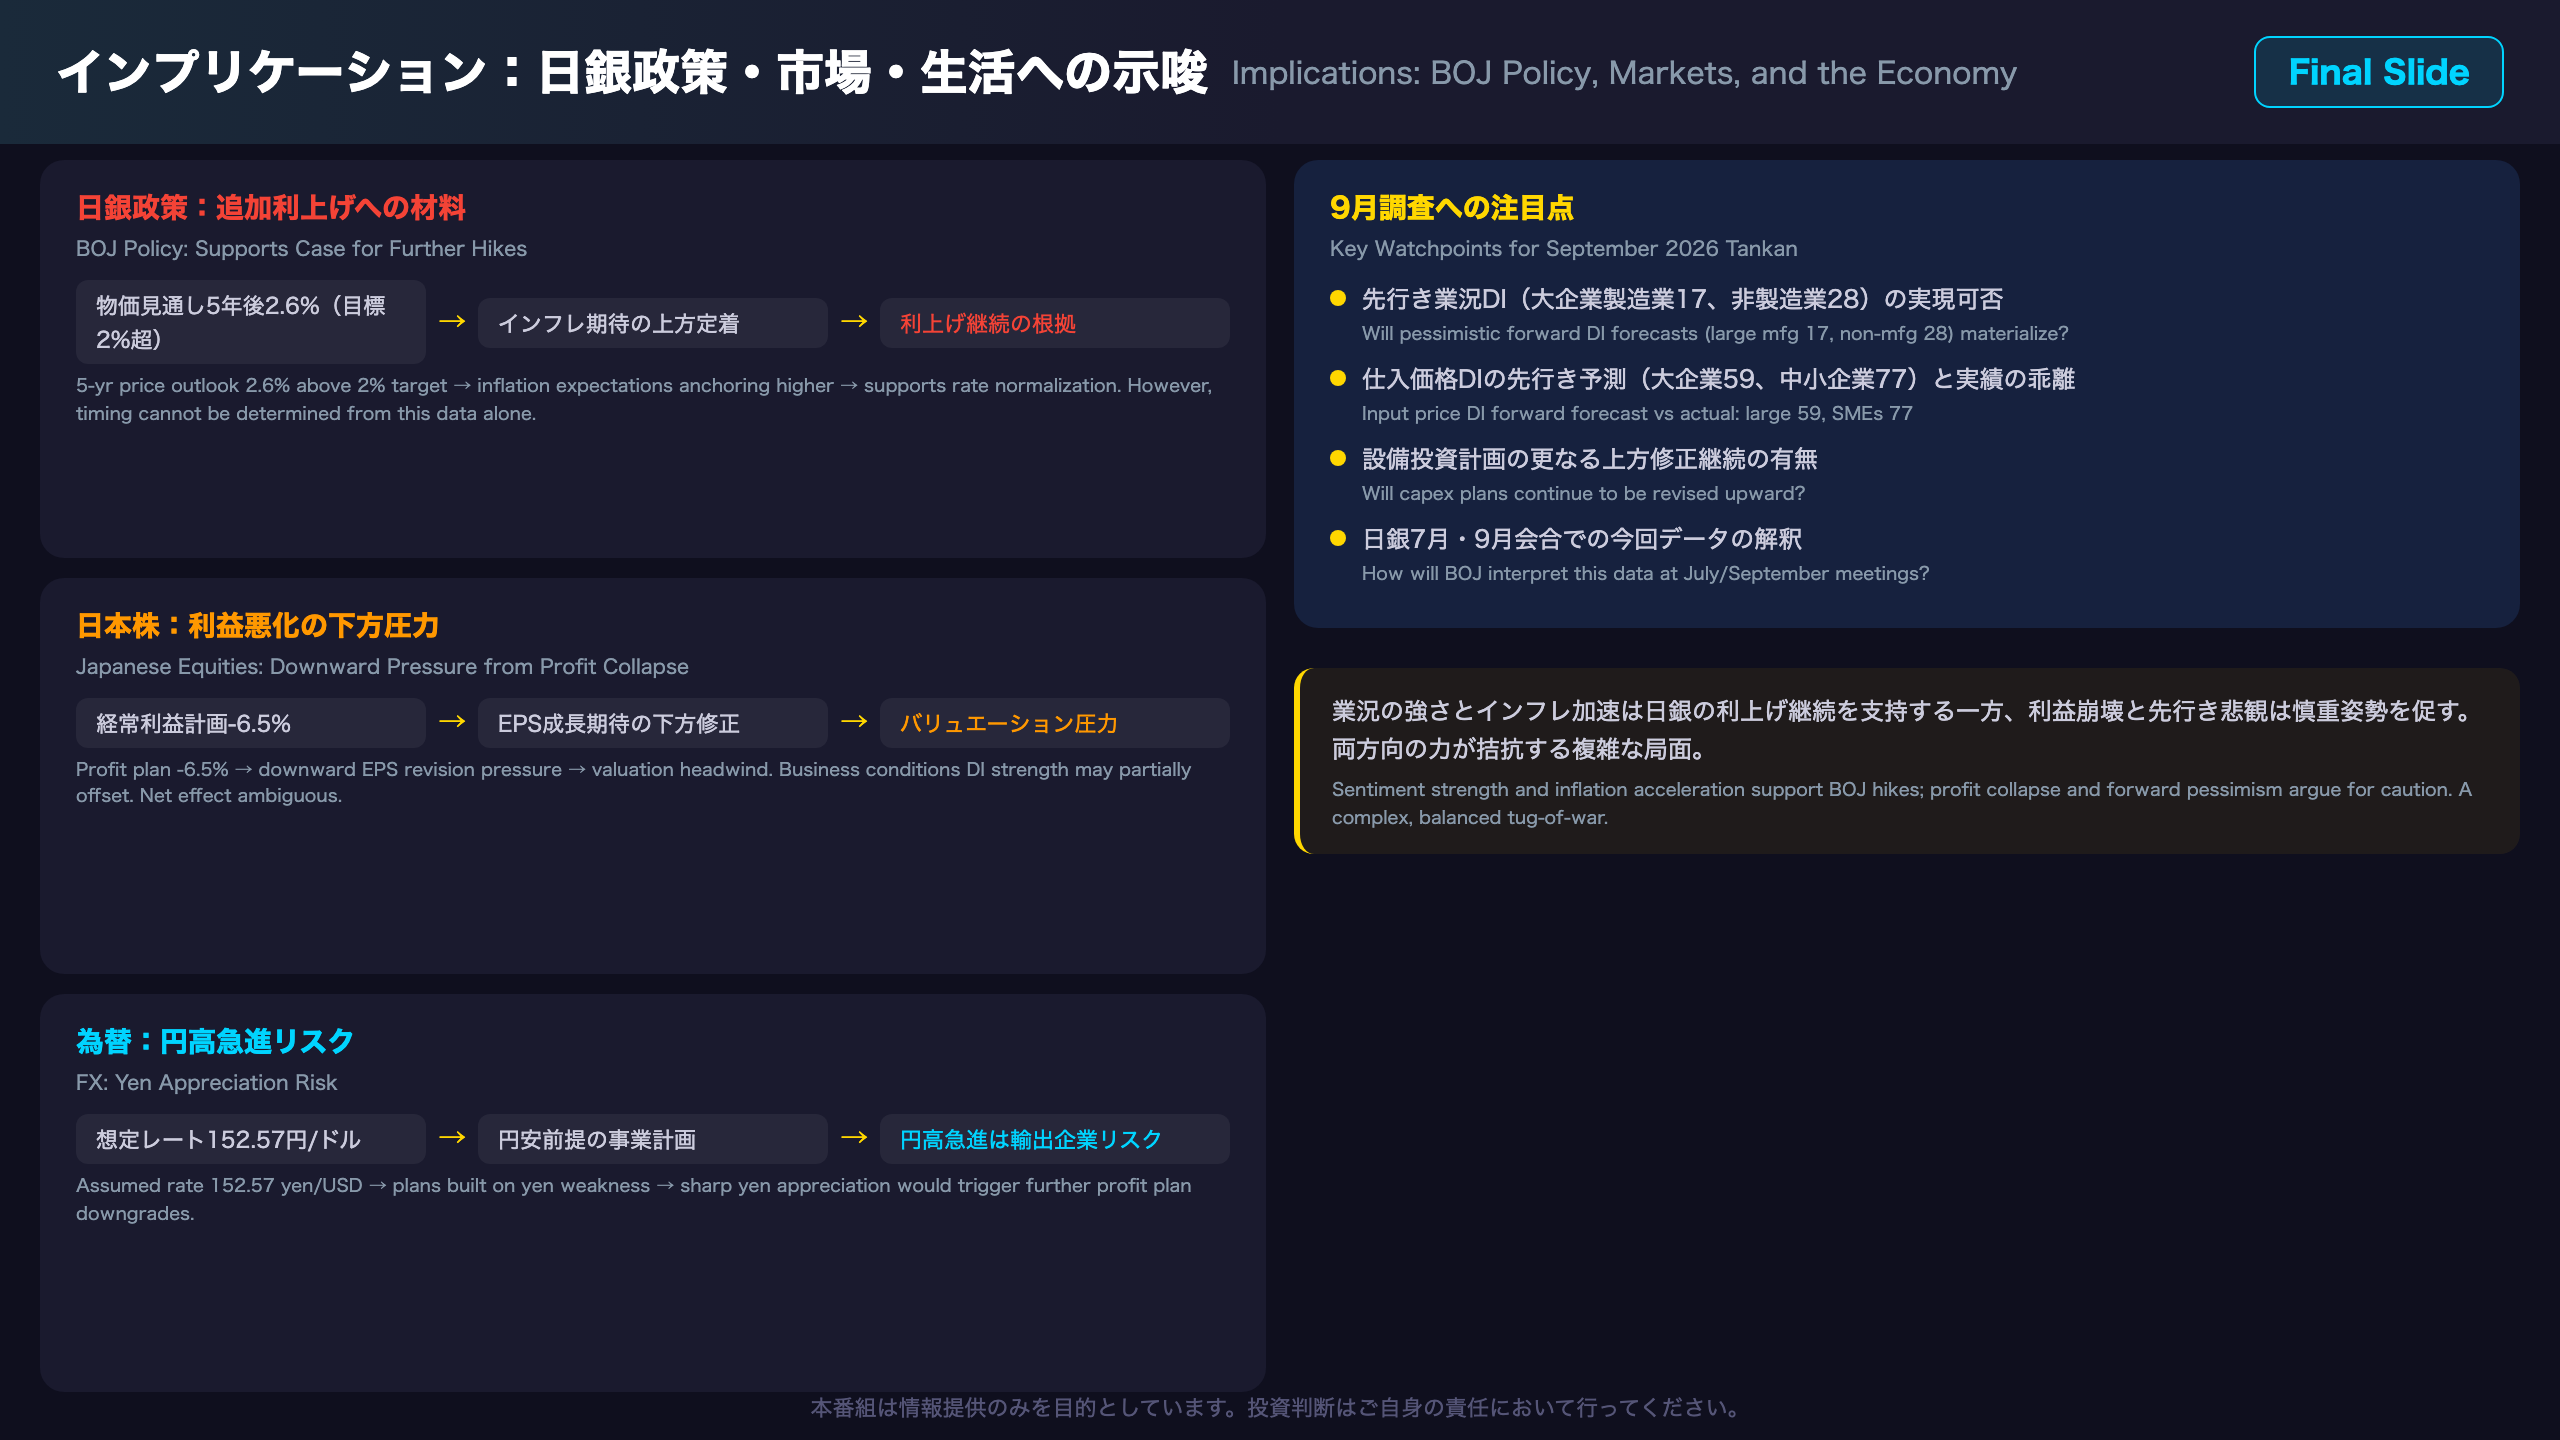
Implications: BOJ Policy, Equity Markets, and FX — The Logical Chains
BOJ Policy Implications
Chain 1 (Inflation Expectations):
5-year general price outlook rose to 2.6% (from 2.5%) → Inflation expectations may be anchoring above BOJ’s 2% target → This is generally considered supportive of continued rate normalization, but this data alone cannot determine the timing of the next hike. The BOJ will also weigh the sharp forward DI deterioration and profit collapse against these inflationary signals.
Chain 2 (Input Cost Surge):
Input price DI surged to 62 (large) and 76 (SMEs) → Accelerating cost pass-through increases pressure on consumer prices → The BOJ could characterize this as an upside inflation risk in its next policy statement.
Equity Market Implications
Chain 3 (Profit Collapse):
FY2026 recurring profit plans revised to -6.5% across all firms → Downward pressure on Japanese equity EPS growth expectations → Generally, profit growth deceleration pressures valuations upward (higher P/E), but the strong business conditions DI could partially offset this. Net effect on Japanese equities is ambiguous from this data alone.
FX Implications
Chain 4 (FX Assumption Revision):
FY2026 assumed USD/JPY revised to 152.57 (from 150.10) → Firms are building plans around current yen weakness → A sharp yen appreciation (e.g., toward 140 yen) would represent a meaningful downside earnings risk for exporters, potentially triggering further profit plan downgrades in the September Tankan.
Key Watchpoints for September 2026 Tankan
- Will the pessimistic forward DI forecasts (large mfg 17, non-mfg 28) materialize?
- Input price DI forward forecast: large firms 59, SMEs 77 — will actual readings match?
- Will capex plans continue to be revised upward?
- How will the BOJ interpret this data in its July/September policy meetings?
Disclaimer: This article is for informational purposes only. All investment decisions are made solely at your own risk.







