
📺 Watch the Full Video Analysis
This article was automatically generated by the NFC Market Live AI analysis system. (Updated: 2026-09-04 21:40 JST)
📄 Primary Source
U.S. Bureau of Labor Statistics
https://www.bls.gov/news.release/empsit.htm
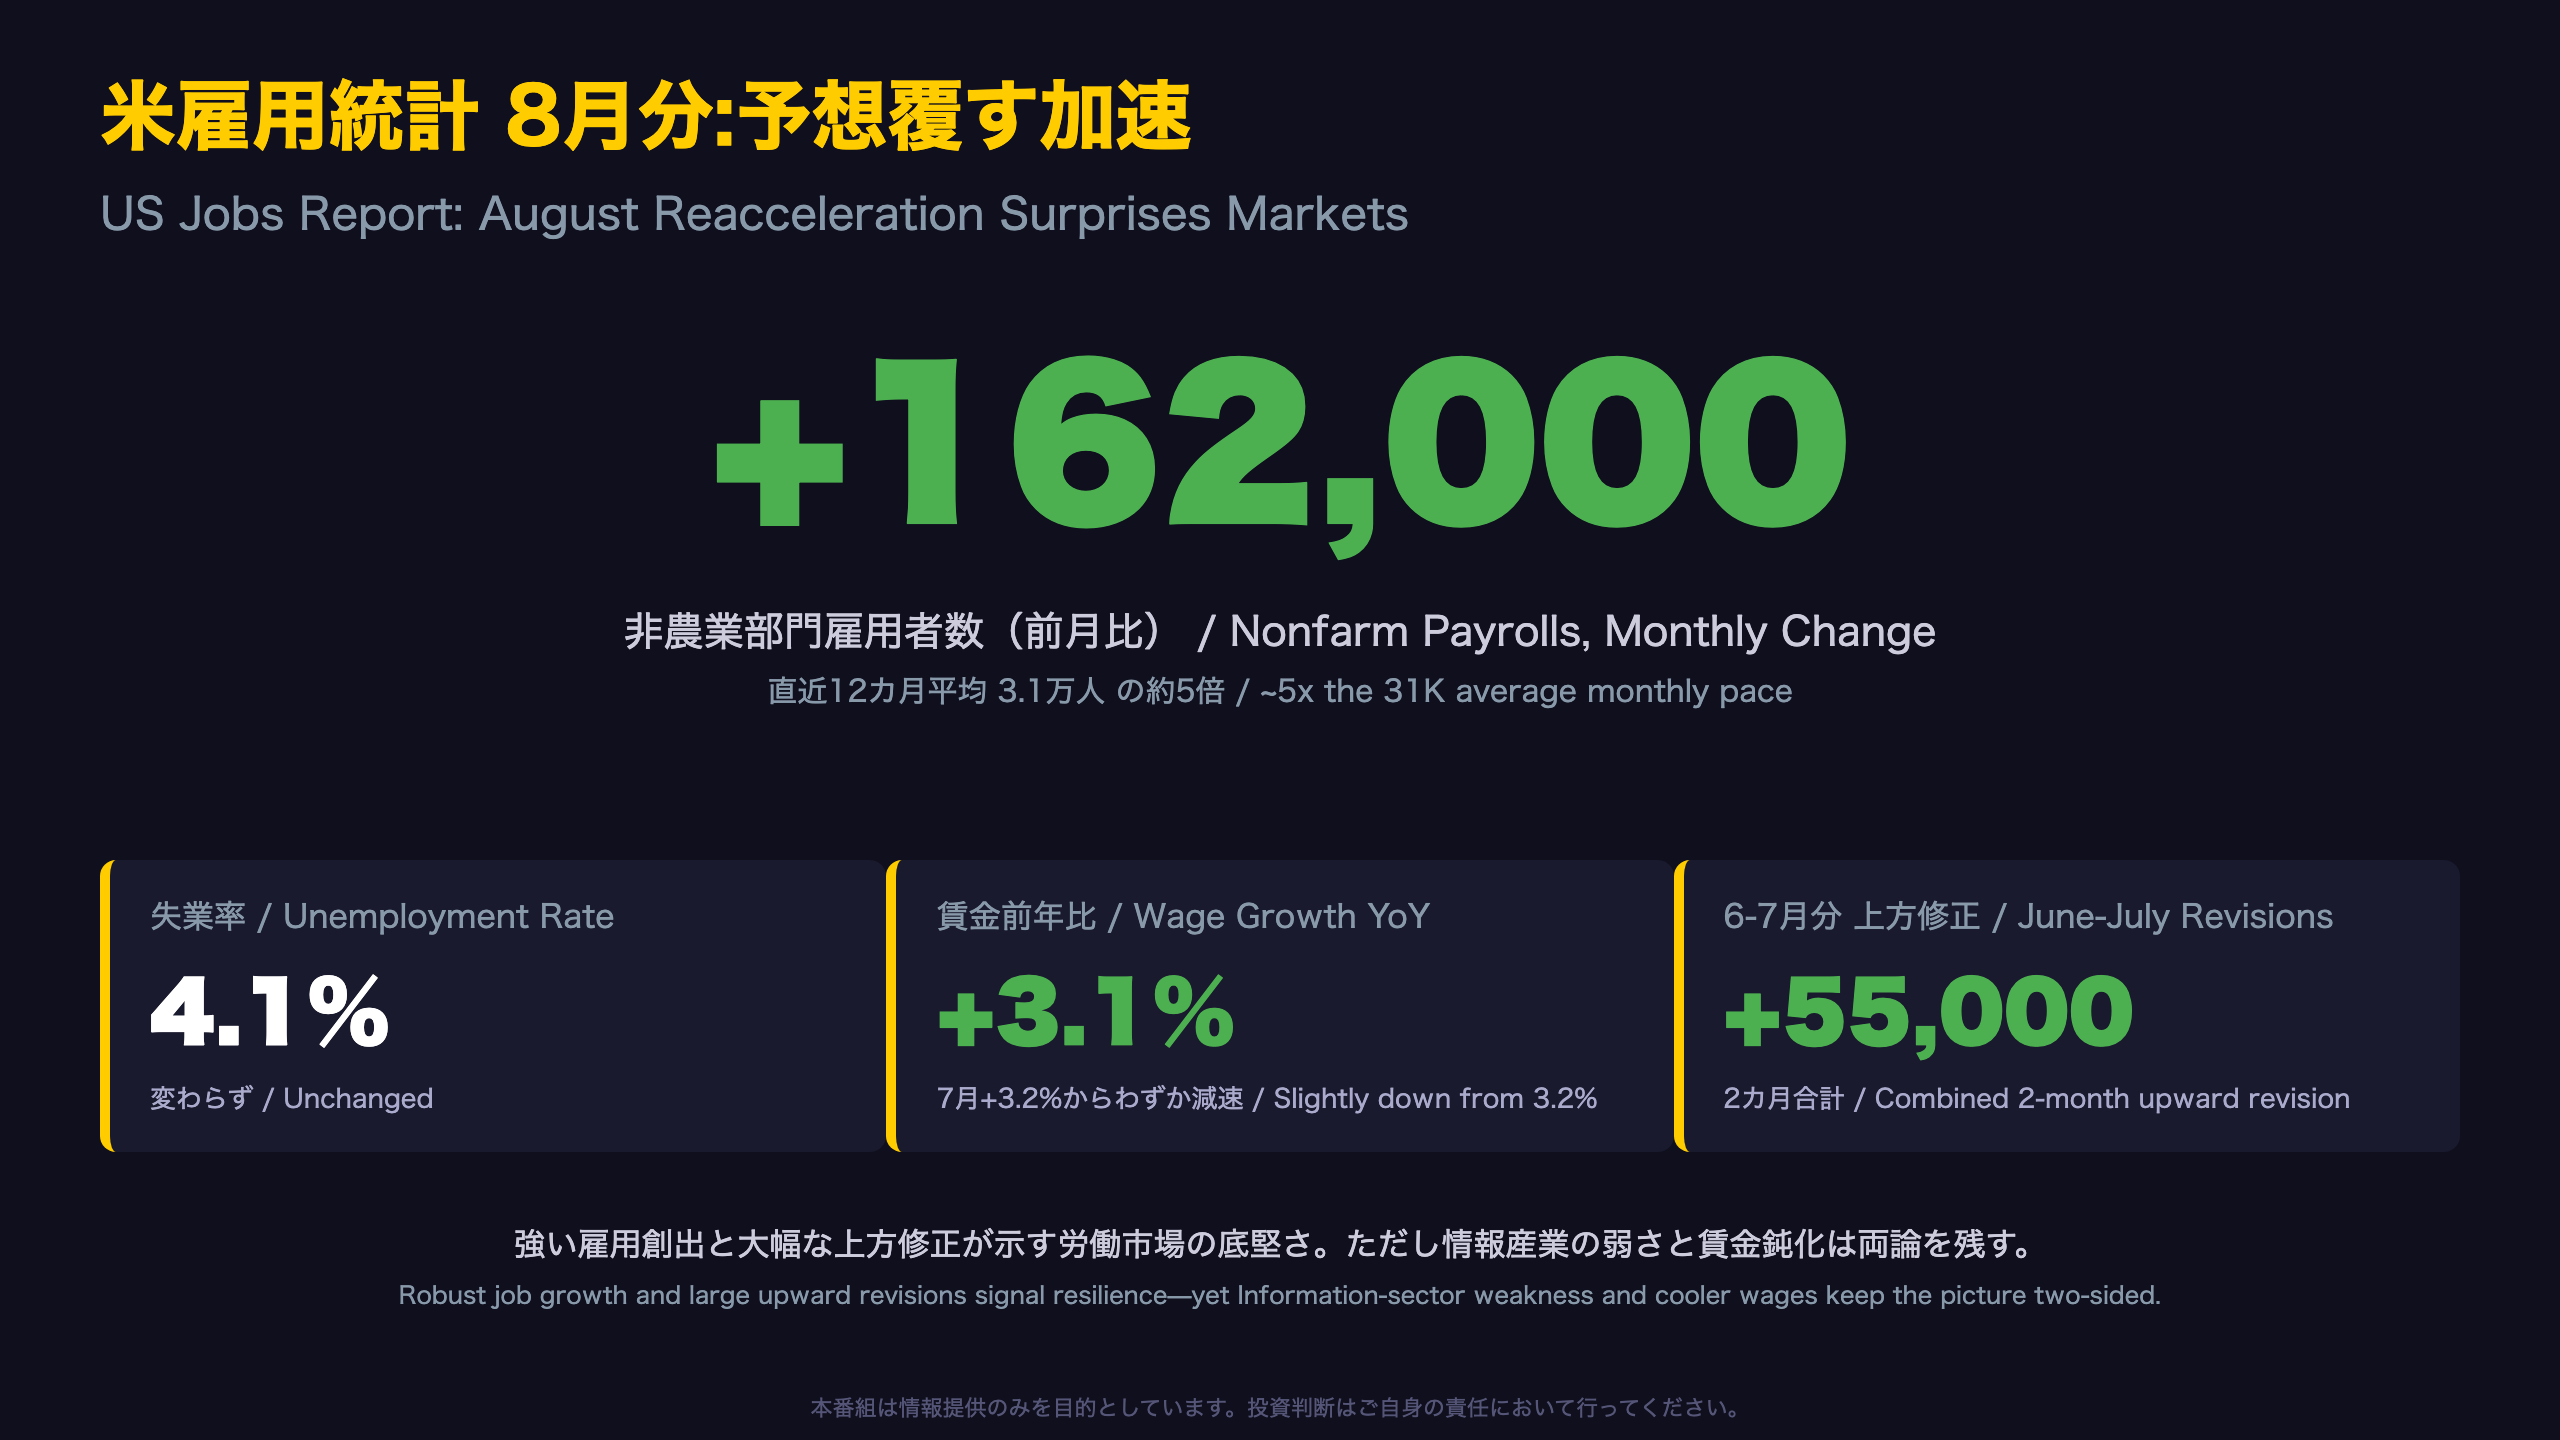
📊 US nonfarm payrolls surged +162,000 in August, far outpacing the prior 12-month average of just 31,000.
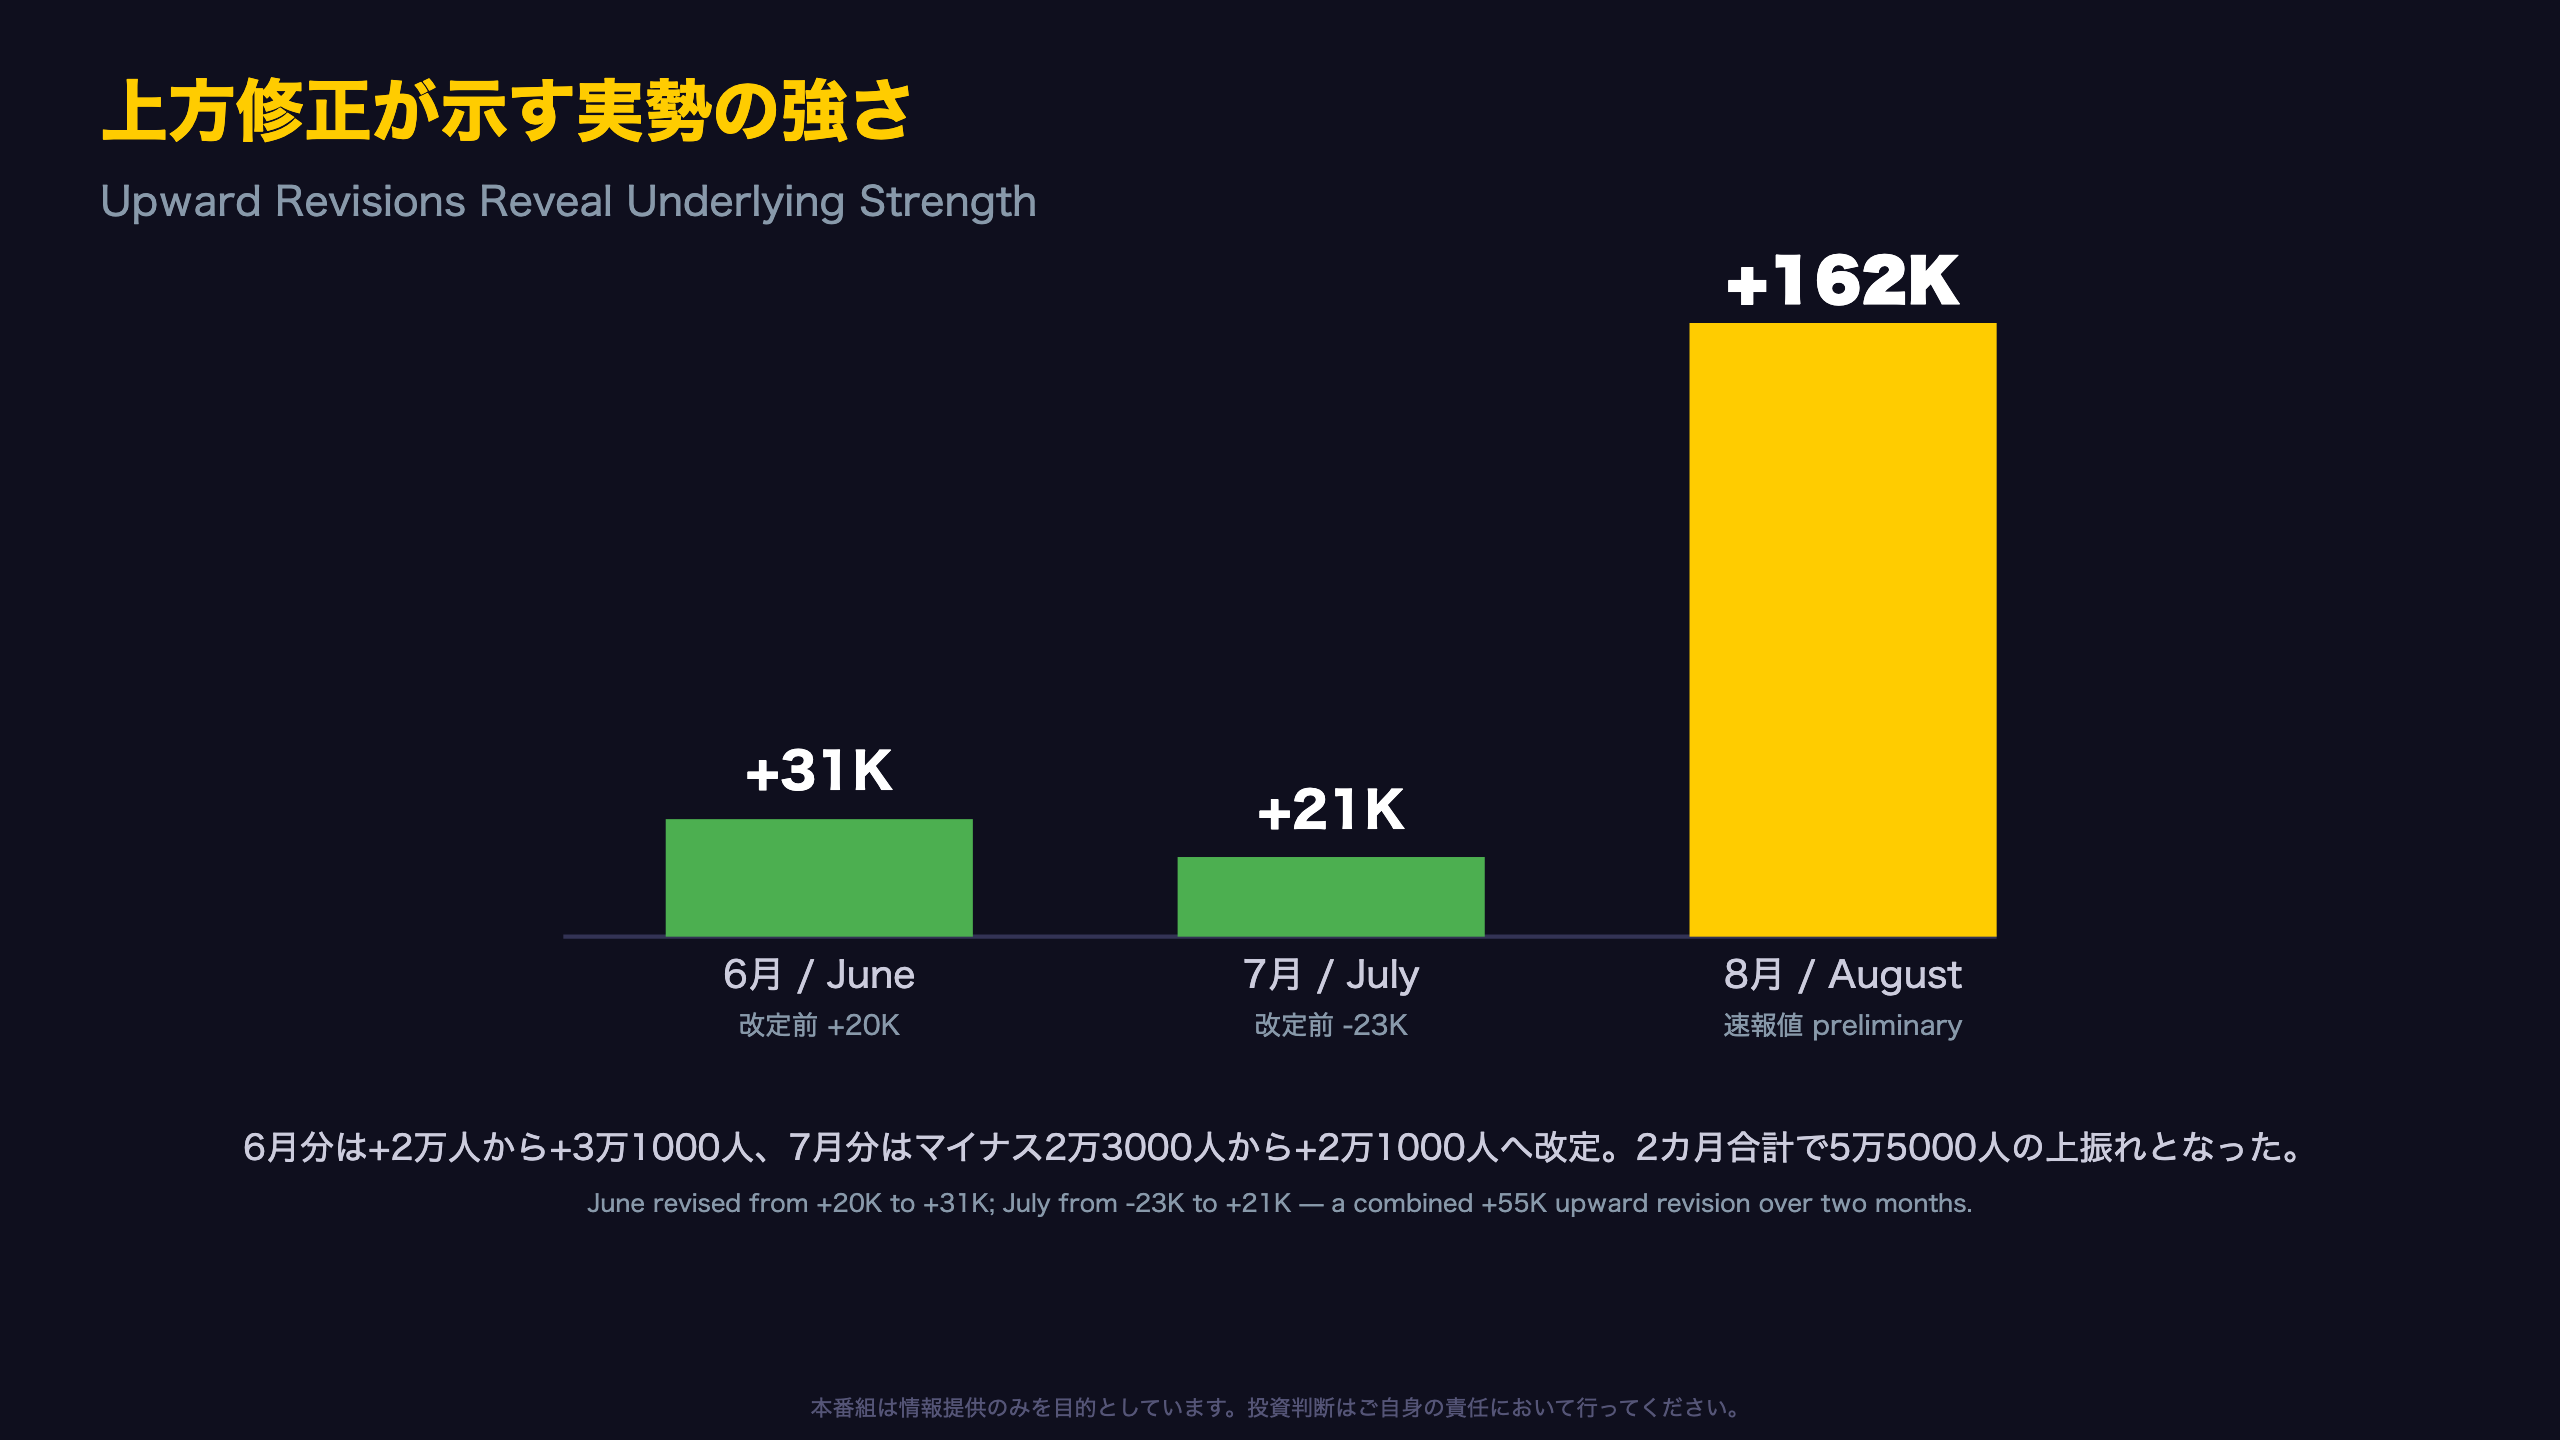
✅ June and July payrolls revised up a combined +55,000
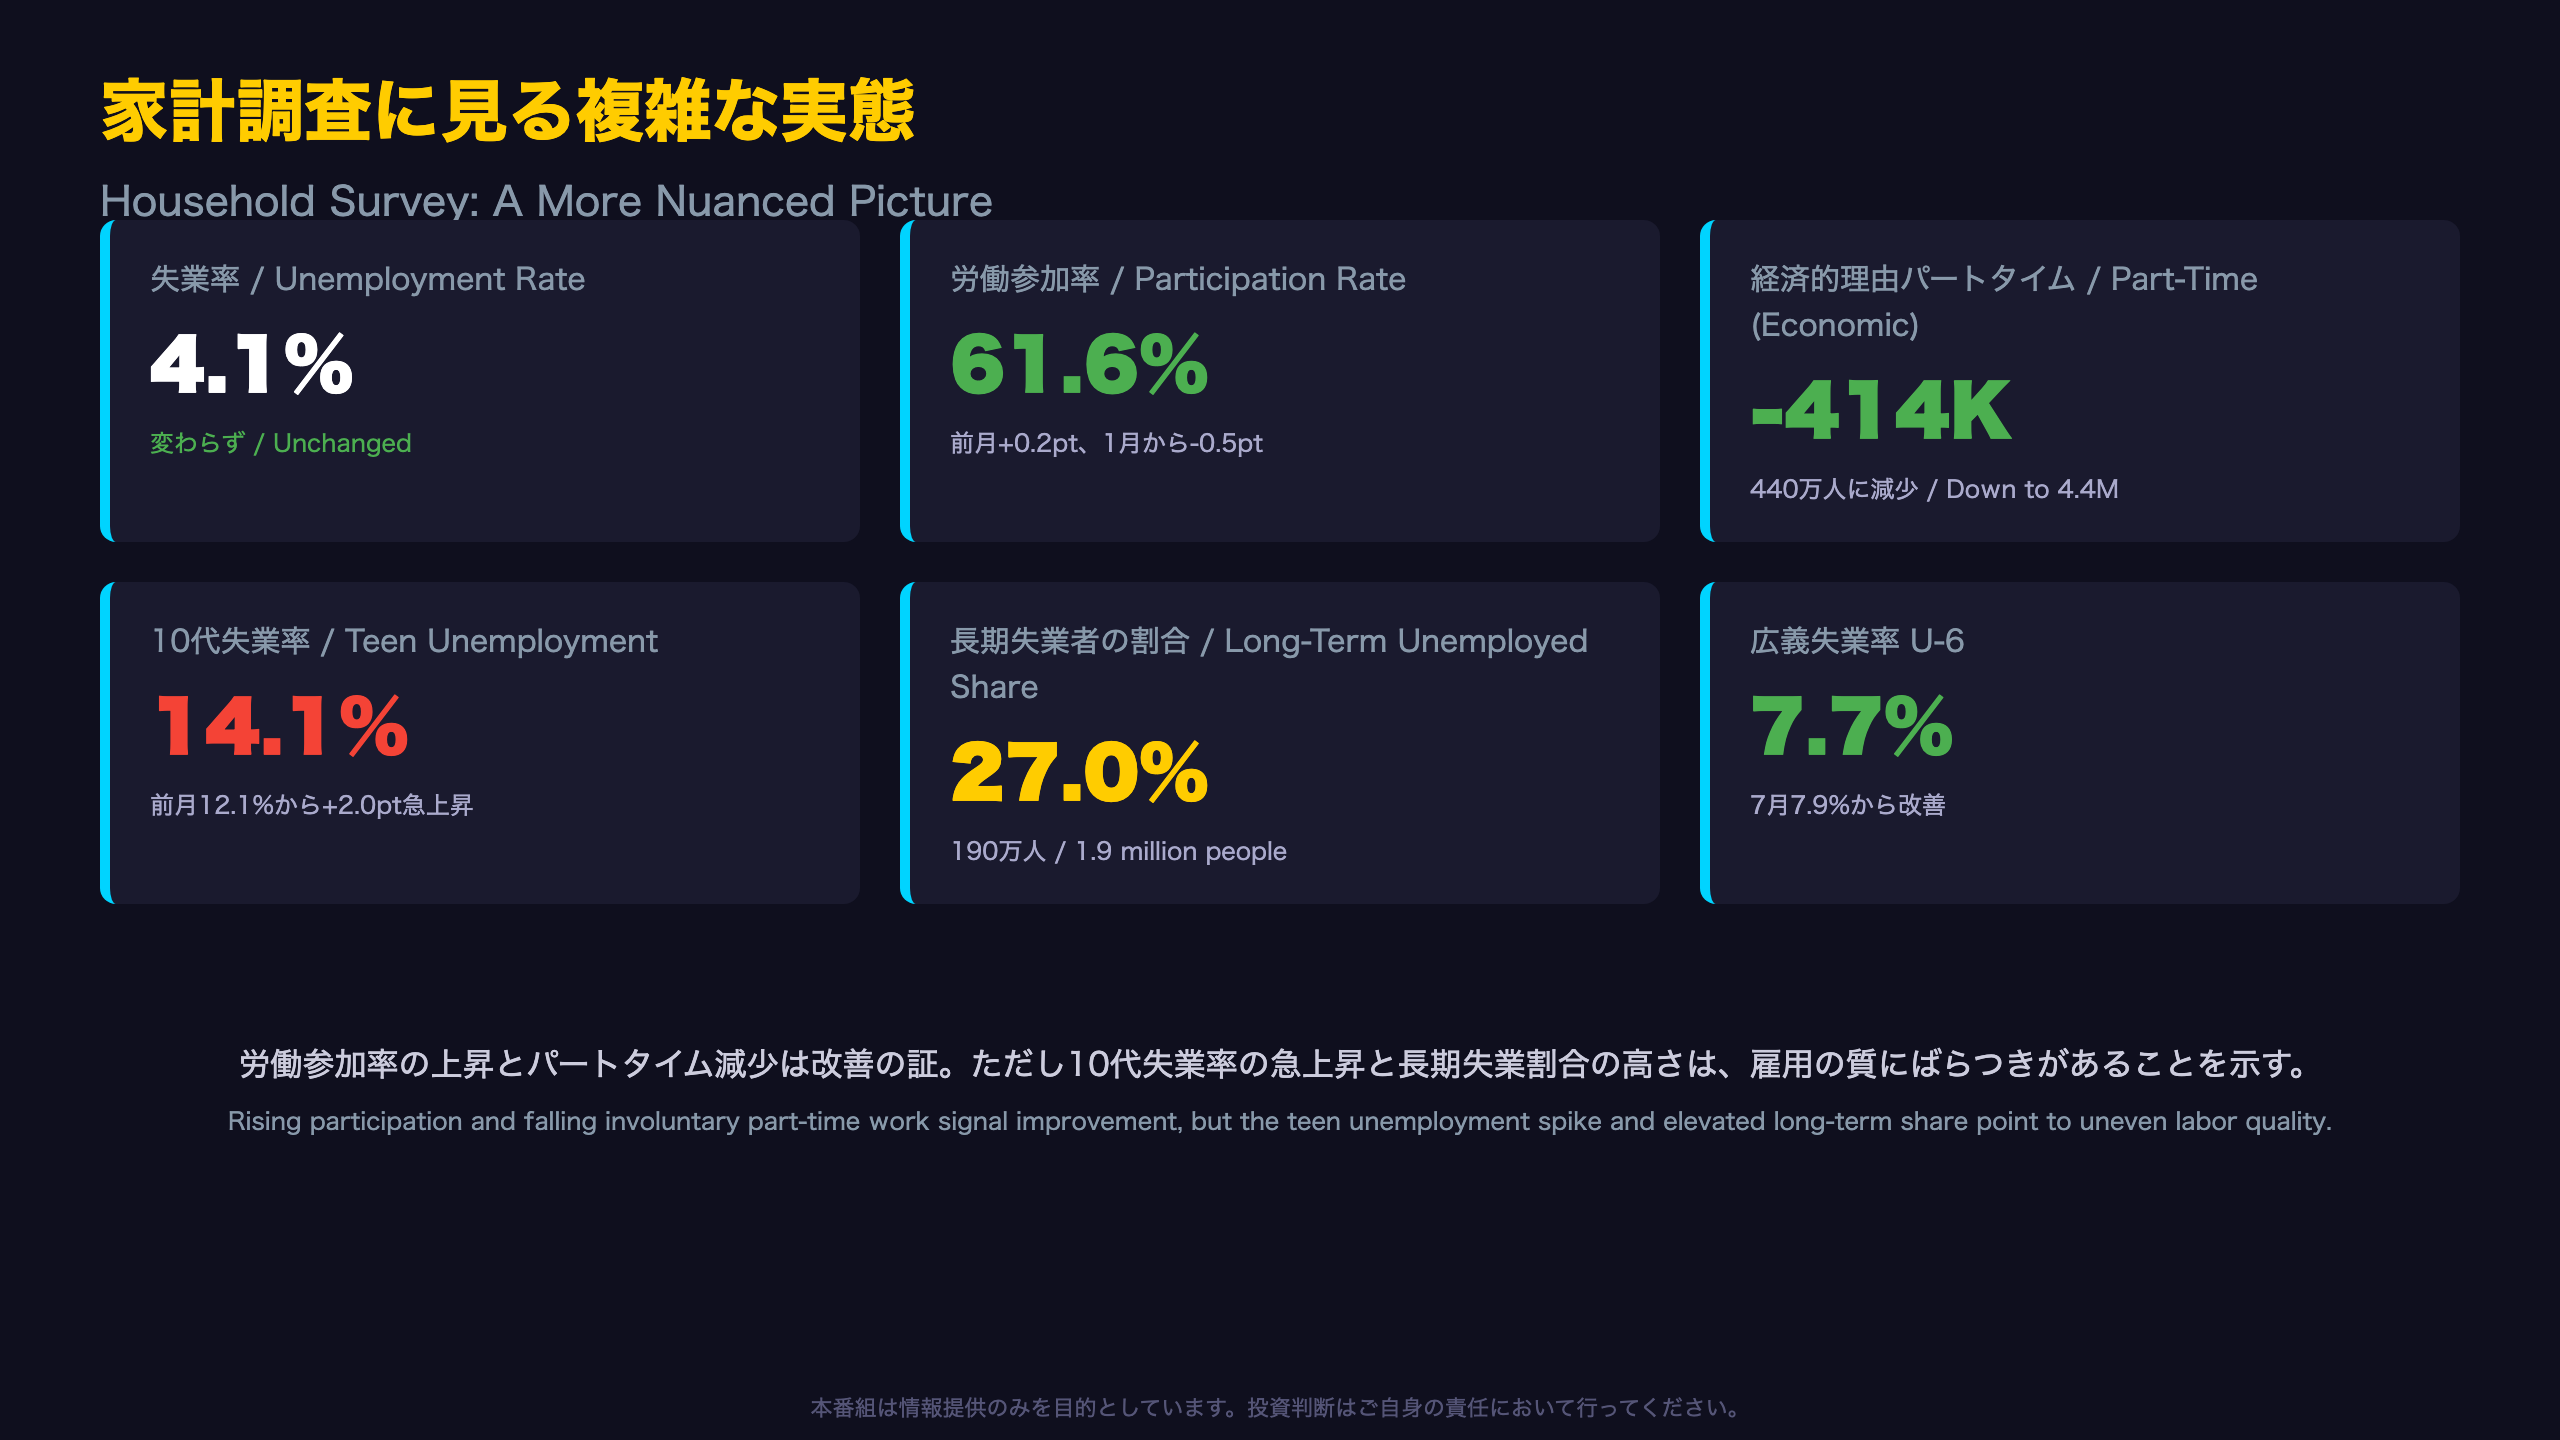
✅ Unemployment held steady at 4.1%, part-time-for-economic-reasons fell 414,000
⚠️ But the Information sector shed 23,000 jobs and teen unemployment jumped to 14.1%
💡 A broadening, resilient labor market—but with pockets of weakness. We break down what it means for the Fed’s rate path.
The Ultimate Summary:予想を覆した雇用加速
Anatomy of a Beat
The US Bureau of Labor Statistics (BLS) is the federal agency that produces monthly employment data through two separate surveys: the Current Employment Statistics (CES), a survey of roughly 119,000 businesses, and the Current Population Survey (CPS), a household survey of about 60,000 families. August’s headline payroll gain of 162,000 came almost entirely from the establishment (CES) side.
Year-over-year context
A striking comparison: August 2025 payrolls actually declined by 70,000, while August 2026 posted a gain of 162,000 — a swing of 232,000 jobs. The three-month average pace also accelerated to 71,000 from 38,000 in July, suggesting this isn’t just a one-month statistical fluke.
Why this matters for markets
Unlike the European labor market (where Eurostat reports unemployment with a one-month lag and less granular revisions) or the UK’s ONS labor force survey, the US report’s rapid two-round revision process means today’s “preliminary” 162,000 figure could still move. Given that June and July were both revised upward, markets may lean toward assuming August’s number understates true strength rather than overstates it. This dynamic typically pushes short-term Treasury yields and the dollar higher as rate-cut expectations get pushed out.
上方修正が示す実勢の強さ
Why Revisions Matter So Much
The BLS’s own technical documentation states that the 90% confidence interval for the monthly change in total nonfarm payrolls is roughly ±122,000. That means July’s originally reported decline of 23,000 sat comfortably inside the margin of statistical noise — which is exactly why the BLS described that month as showing ‘little change’ rather than a decline.
A pattern worth watching
Both June (+20K → +31K) and July (-23K → +21K) were revised upward in this release, adding 55,000 jobs to the two-month total. Because the establishment survey’s two most recent months are always labeled “preliminary” pending additional employer responses, this pattern of repeated upward revisions can be a signal — though not a certainty — that the sample is initially undercounting genuine hiring momentum, similar to how the UK’s ONS revises its Labour Force Survey figures as more responses arrive.
Market read-through
August’s +162,000 print clears the ±122,000 confidence threshold outright, meaning statisticians can say with roughly 90% confidence that employment genuinely rose in August — a materially stronger statistical claim than July’s original release could make. For rate-sensitive assets like 2-year Treasuries, a print that clears the statistical significance bar tends to carry more weight with policymakers than one that doesn’t.
業種別に見る雇用の広がり
A Service-Sector-Led Expansion
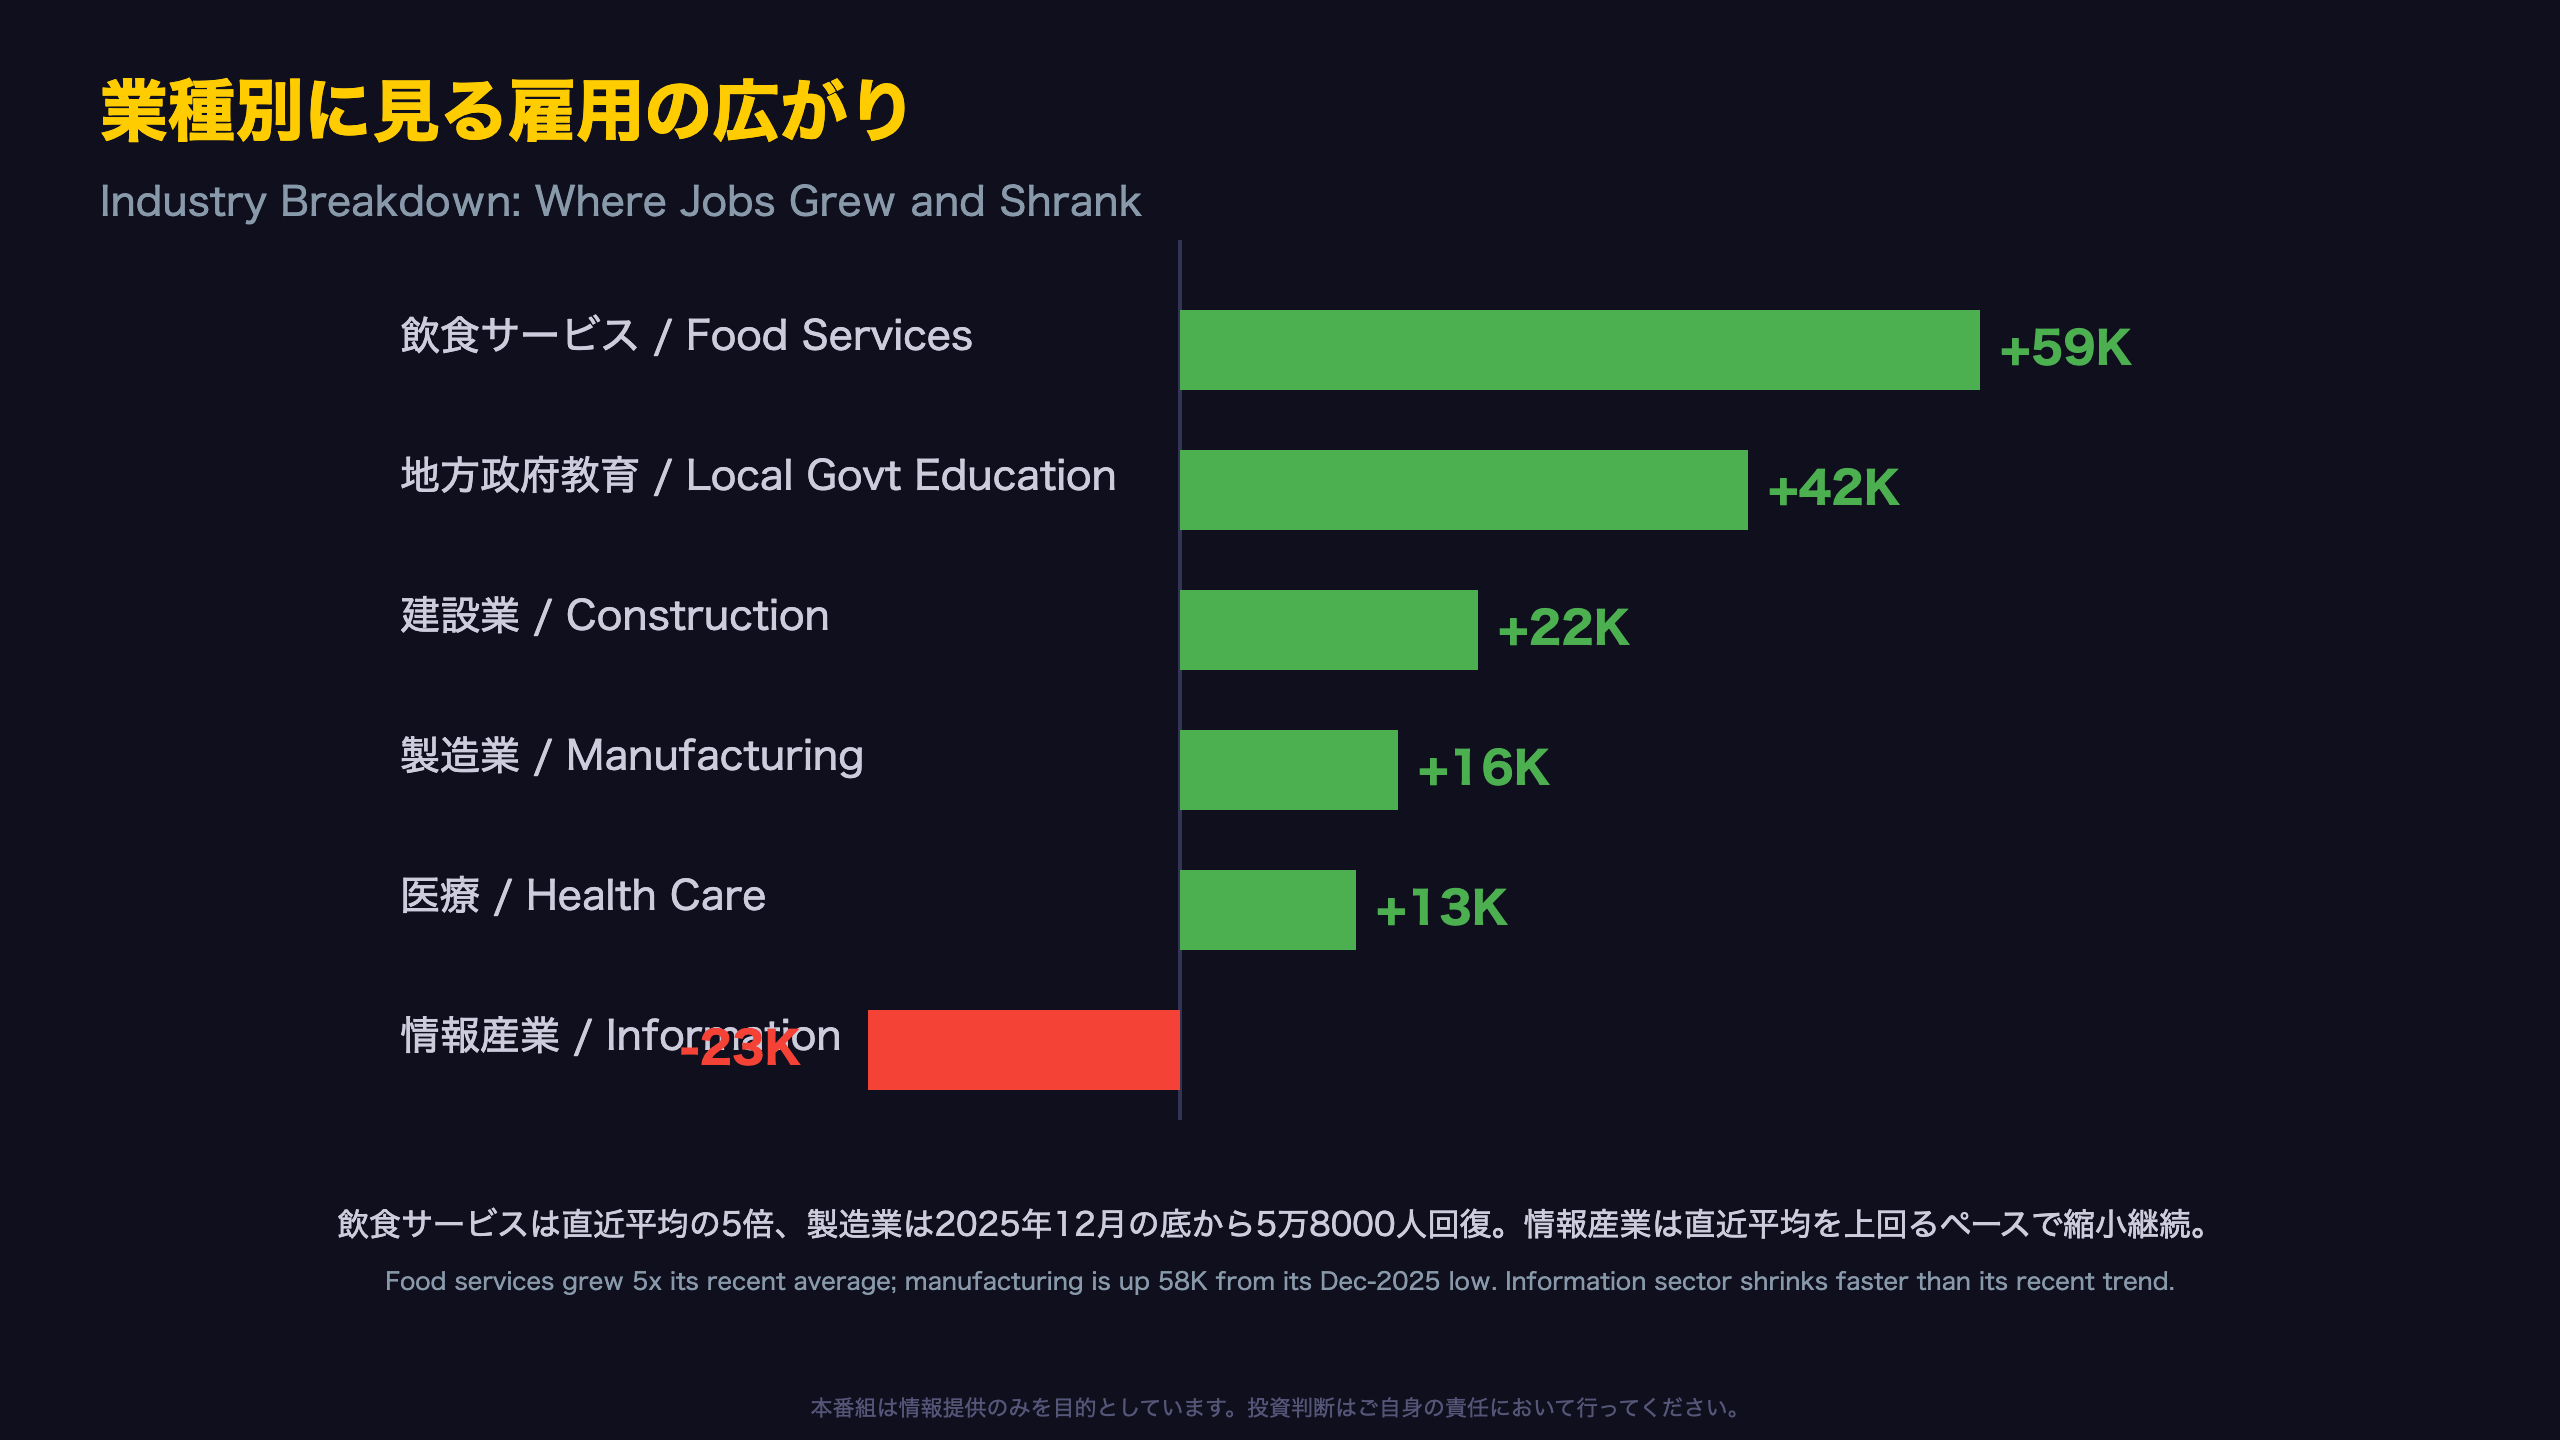
August’s gains were led by food services and drinking places (+59,000), running at roughly five times its 12,000 average monthly pace. Local government education (+42,000) largely reversed July’s 50,000 decline — a reminder that education payrolls, tied to the academic calendar, are among the hardest series to seasonally adjust and can swing sharply month to month.
Manufacturing’s quiet comeback
Manufacturing has now posted three straight monthly gains (June +13K, July +14K, August +16K), cumulating in a 58,000-job recovery since its December 2025 low. Gains concentrated in machinery and fabricated metals hint at resilient capital-goods demand — a data point worth comparing against the ISM Manufacturing PMI or durable goods orders for corroboration.
Information sector’s persistent weakness
By contrast, Information employment fell 23,000 in August, worse than its already-negative 12-month average of -8,000, with losses spread across computing infrastructure/data processing, publishing, and broadcasting.
Two readings, one data point
One interpretation: AI-driven productivity gains are compressing headcount needs in traditional media and IT infrastructure roles, a trend some US tech earnings calls have referenced. A more cautious reading: this is a single month’s data and could reflect idiosyncratic layoffs at a handful of large firms rather than a sector-wide structural shift. Unlike aggregated Eurostat NACE sector data, the BLS breaks Information into granular sub-industries, making this kind of drill-down possible — but caution against over-interpreting single-month swings remains warranted.
家計調査に見る複雑な実態
Beneath the Headline Rate
While the official U-3 unemployment rate (4.1%) captures headlines, the CPS household survey publishes a richer set of underemployment measures — U-1 through U-6 — that international readers may not be familiar with. U-6, the broadest measure, includes discouraged workers, the marginally attached, and those working part time involuntarily. It eased to 7.7% from 7.9%, a genuinely encouraging signal that goes beyond the simple U-3 headline, and is roughly comparable in concept (though not construction) to the EU’s broader labor underutilization indicators published by Eurostat.
The teen unemployment spike, in context
Teen (16-19) unemployment jumped 2.0 percentage points to 14.1%, but the BLS release itself frames this as ‘mostly offsetting a decline in the prior month.’ Because the teen labor force is small, its unemployment rate is inherently volatile month-to-month — a statistical quirk analogous to how small-sample demographic subgroups behave in the UK’s Annual Population Survey.
Long-term unemployment: the sticky part of the story
The long-term unemployed (27+ weeks) share rose to 27.0% of all unemployed, up from 25.5% in July — a gradual but persistent uptrend. This is arguably the household survey’s most bearish data point, since it suggests that once someone loses a job in this economy, reemployment is taking longer, even as headline hiring accelerates.
Bottom line for global investors
The combination of falling U-6, rising participation, and a large drop in involuntary part-time work paints a genuinely resilient labor market — but the rising long-term unemployment share is the one series worth tracking each month as an early-warning indicator of labor market cooling.
賃金・広がりと政策インプリケーション
The Diffusion Index: A Breadth Check
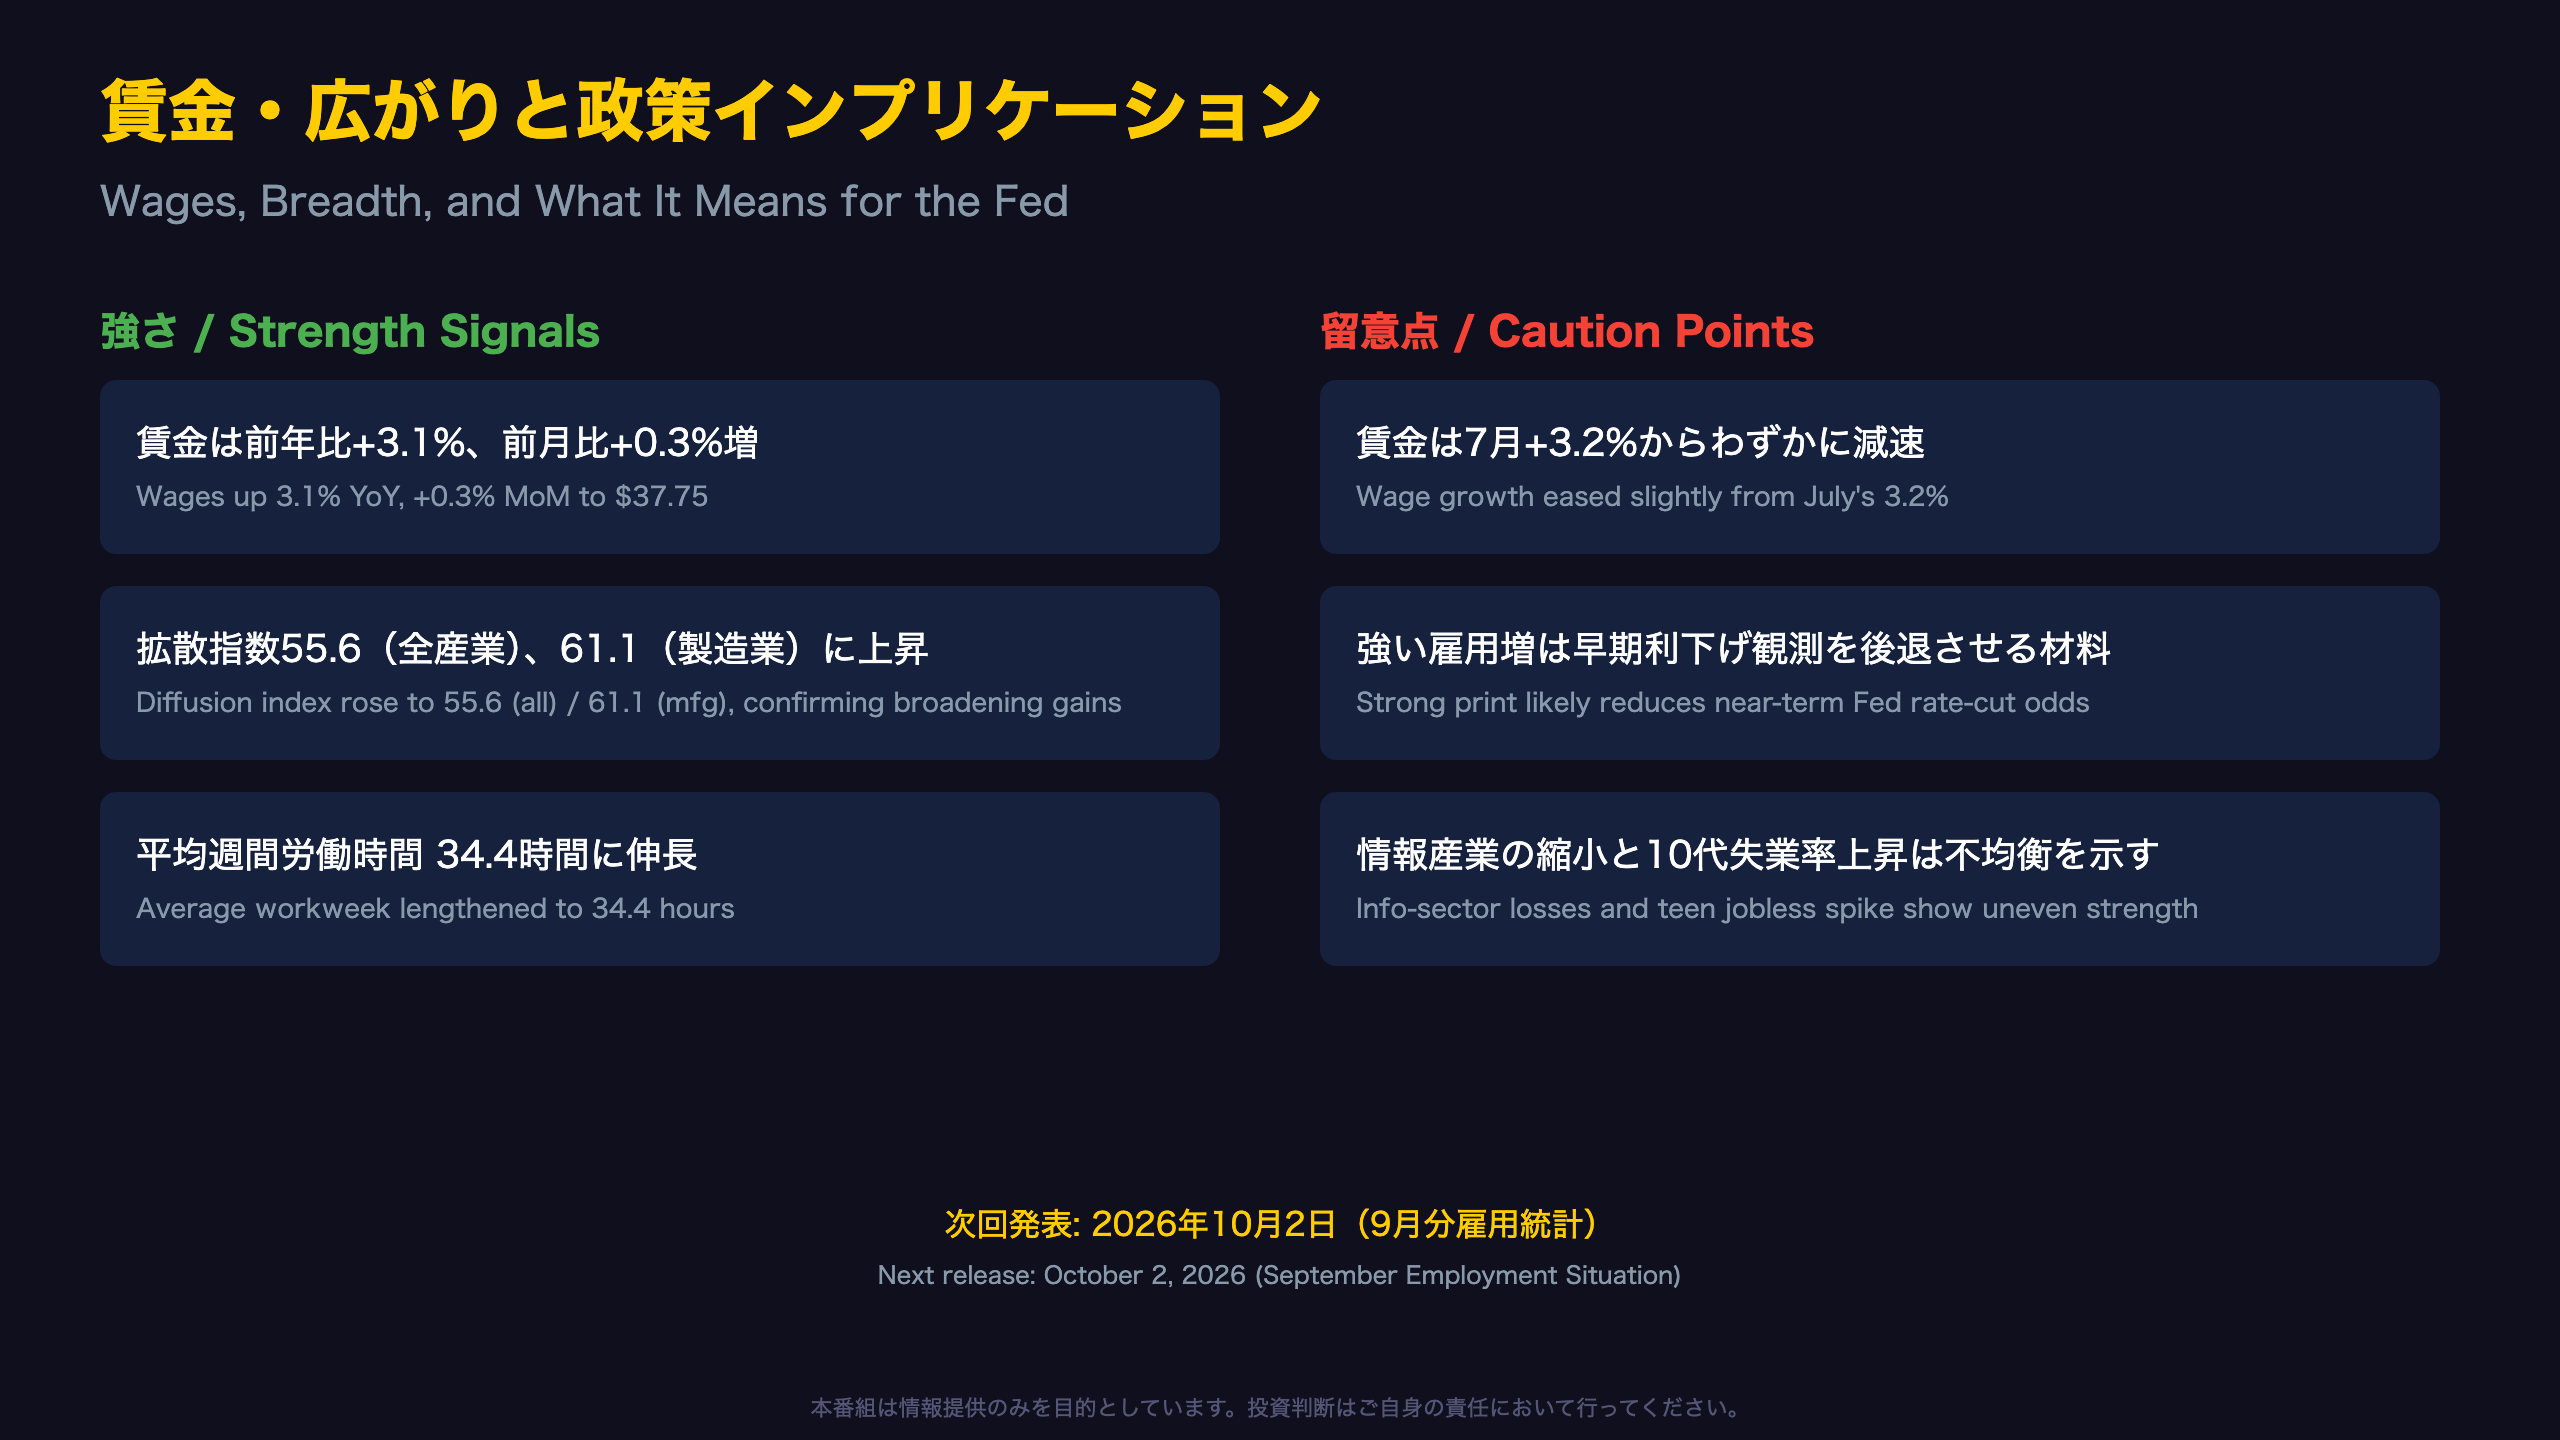
The diffusion index measures the share of roughly 250 tracked industries adding jobs, where a reading above 50 means more than half of industries are expanding. This is somewhat analogous to the ‘breadth’ concepts used in equity markets (e.g., advance-decline lines) — a high reading tells you strength isn’t concentrated in one or two mega-sectors. August’s reading of 55.6 for all private industries (up from 52.8) and 61.1 for manufacturing (up from 52.1) indicates genuinely broad-based hiring, not a single large employer skewing the headline.
Wage growth: still within a comfortable range
At 3.1% year-over-year, average hourly earnings growth decelerated slightly from July’s 3.2%. Compared to the Fed’s 2% inflation target, this remains somewhat elevated, but the direction of travel — cooling, not accelerating — is consistent with a soft-landing narrative rather than a wage-price spiral.
Two-sided policy read
The hawkish case: A 162,000 print combined with two consecutive months of upward revisions gives the Federal Reserve solid grounds to argue the labor market remains resilient, likely pushing back market expectations for near-term rate cuts — somewhat analogous to how a strong UK employment report might delay a Bank of England cut.
The cautious case: Continued Information-sector job losses, the jump in teen unemployment, and a rising long-term unemployment share all suggest pockets of softness beneath the surface.
What’s next
The next Employment Situation report, covering September 2026, is scheduled for release on October 2, 2026. Watch specifically whether the Information sector’s downtrend persists and whether August’s preliminary 162,000 figure gets revised further in either direction.
Disclaimer: This article is for informational purposes only. All investment decisions are made solely at your own risk.