
This article was automatically generated by the NFC Market Live AI analysis system. (Updated: 2026-09-30 21:56 JST)
📄 Primary Source
U.S. Bureau of Economic Analysis
https://www.bea.gov/sites/default/files/2026-09/pi0826.pdf
📊 The BEA released August’s Personal Income and Outlays report.
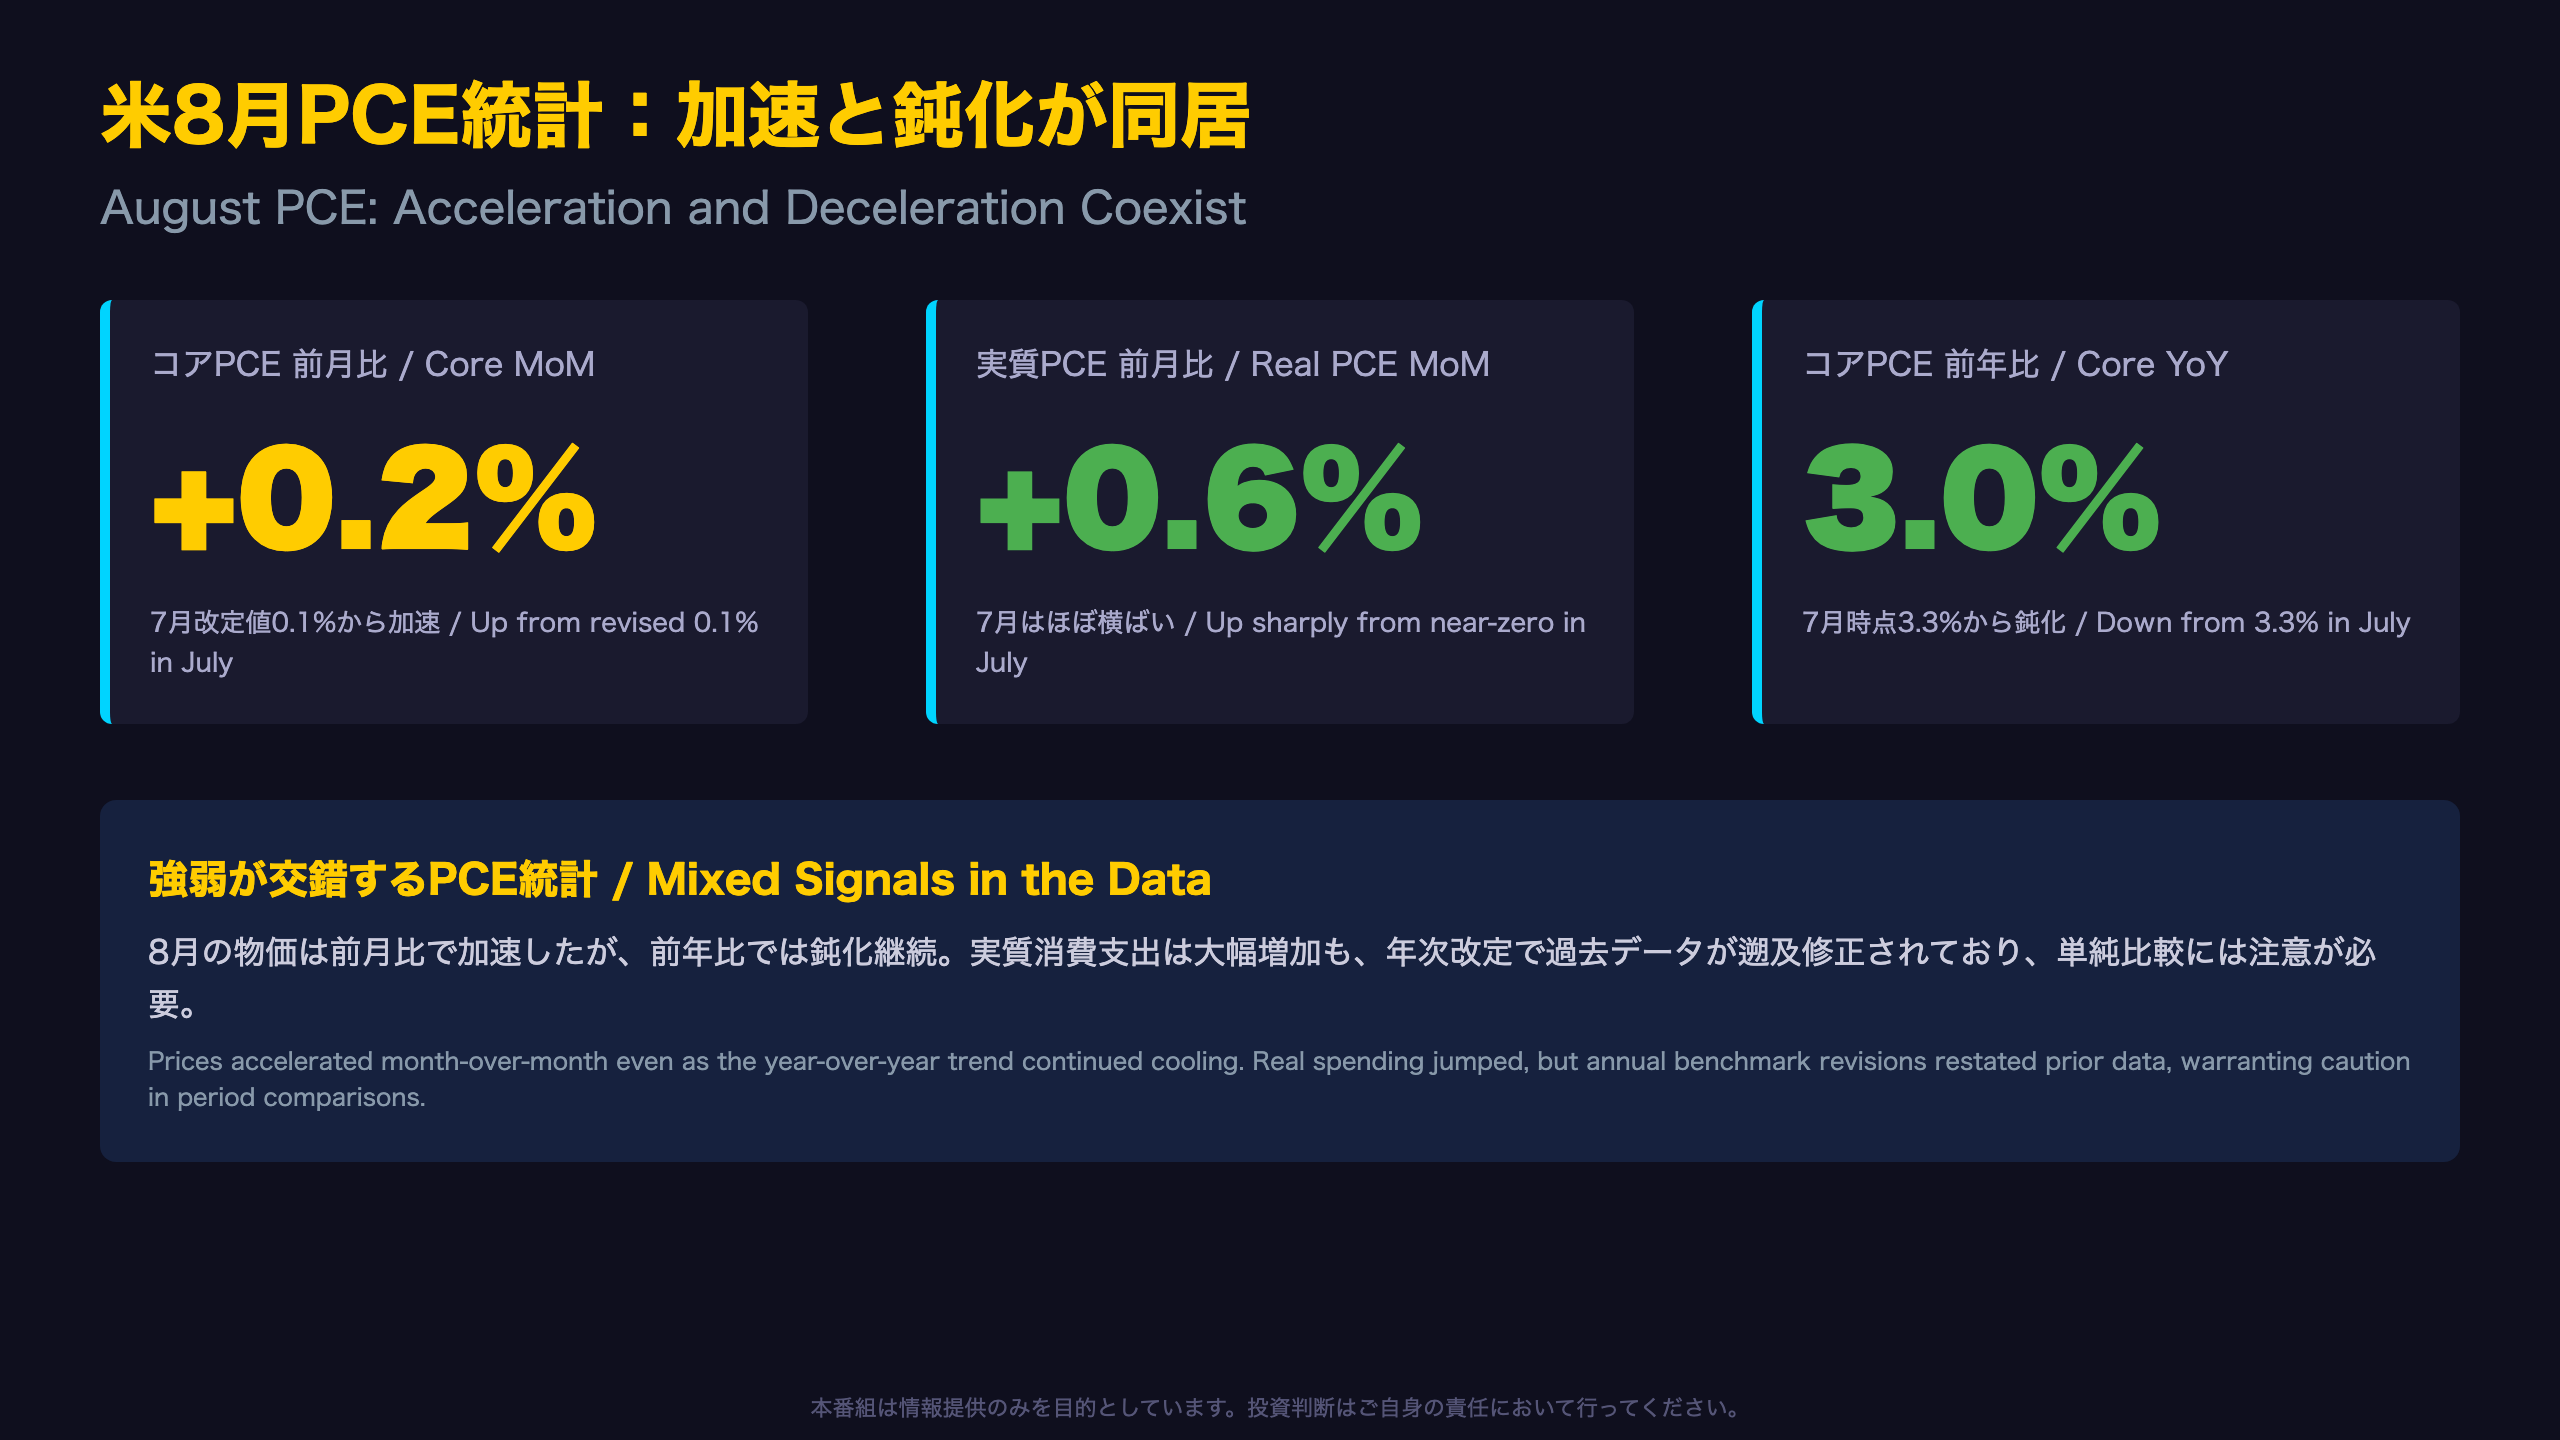
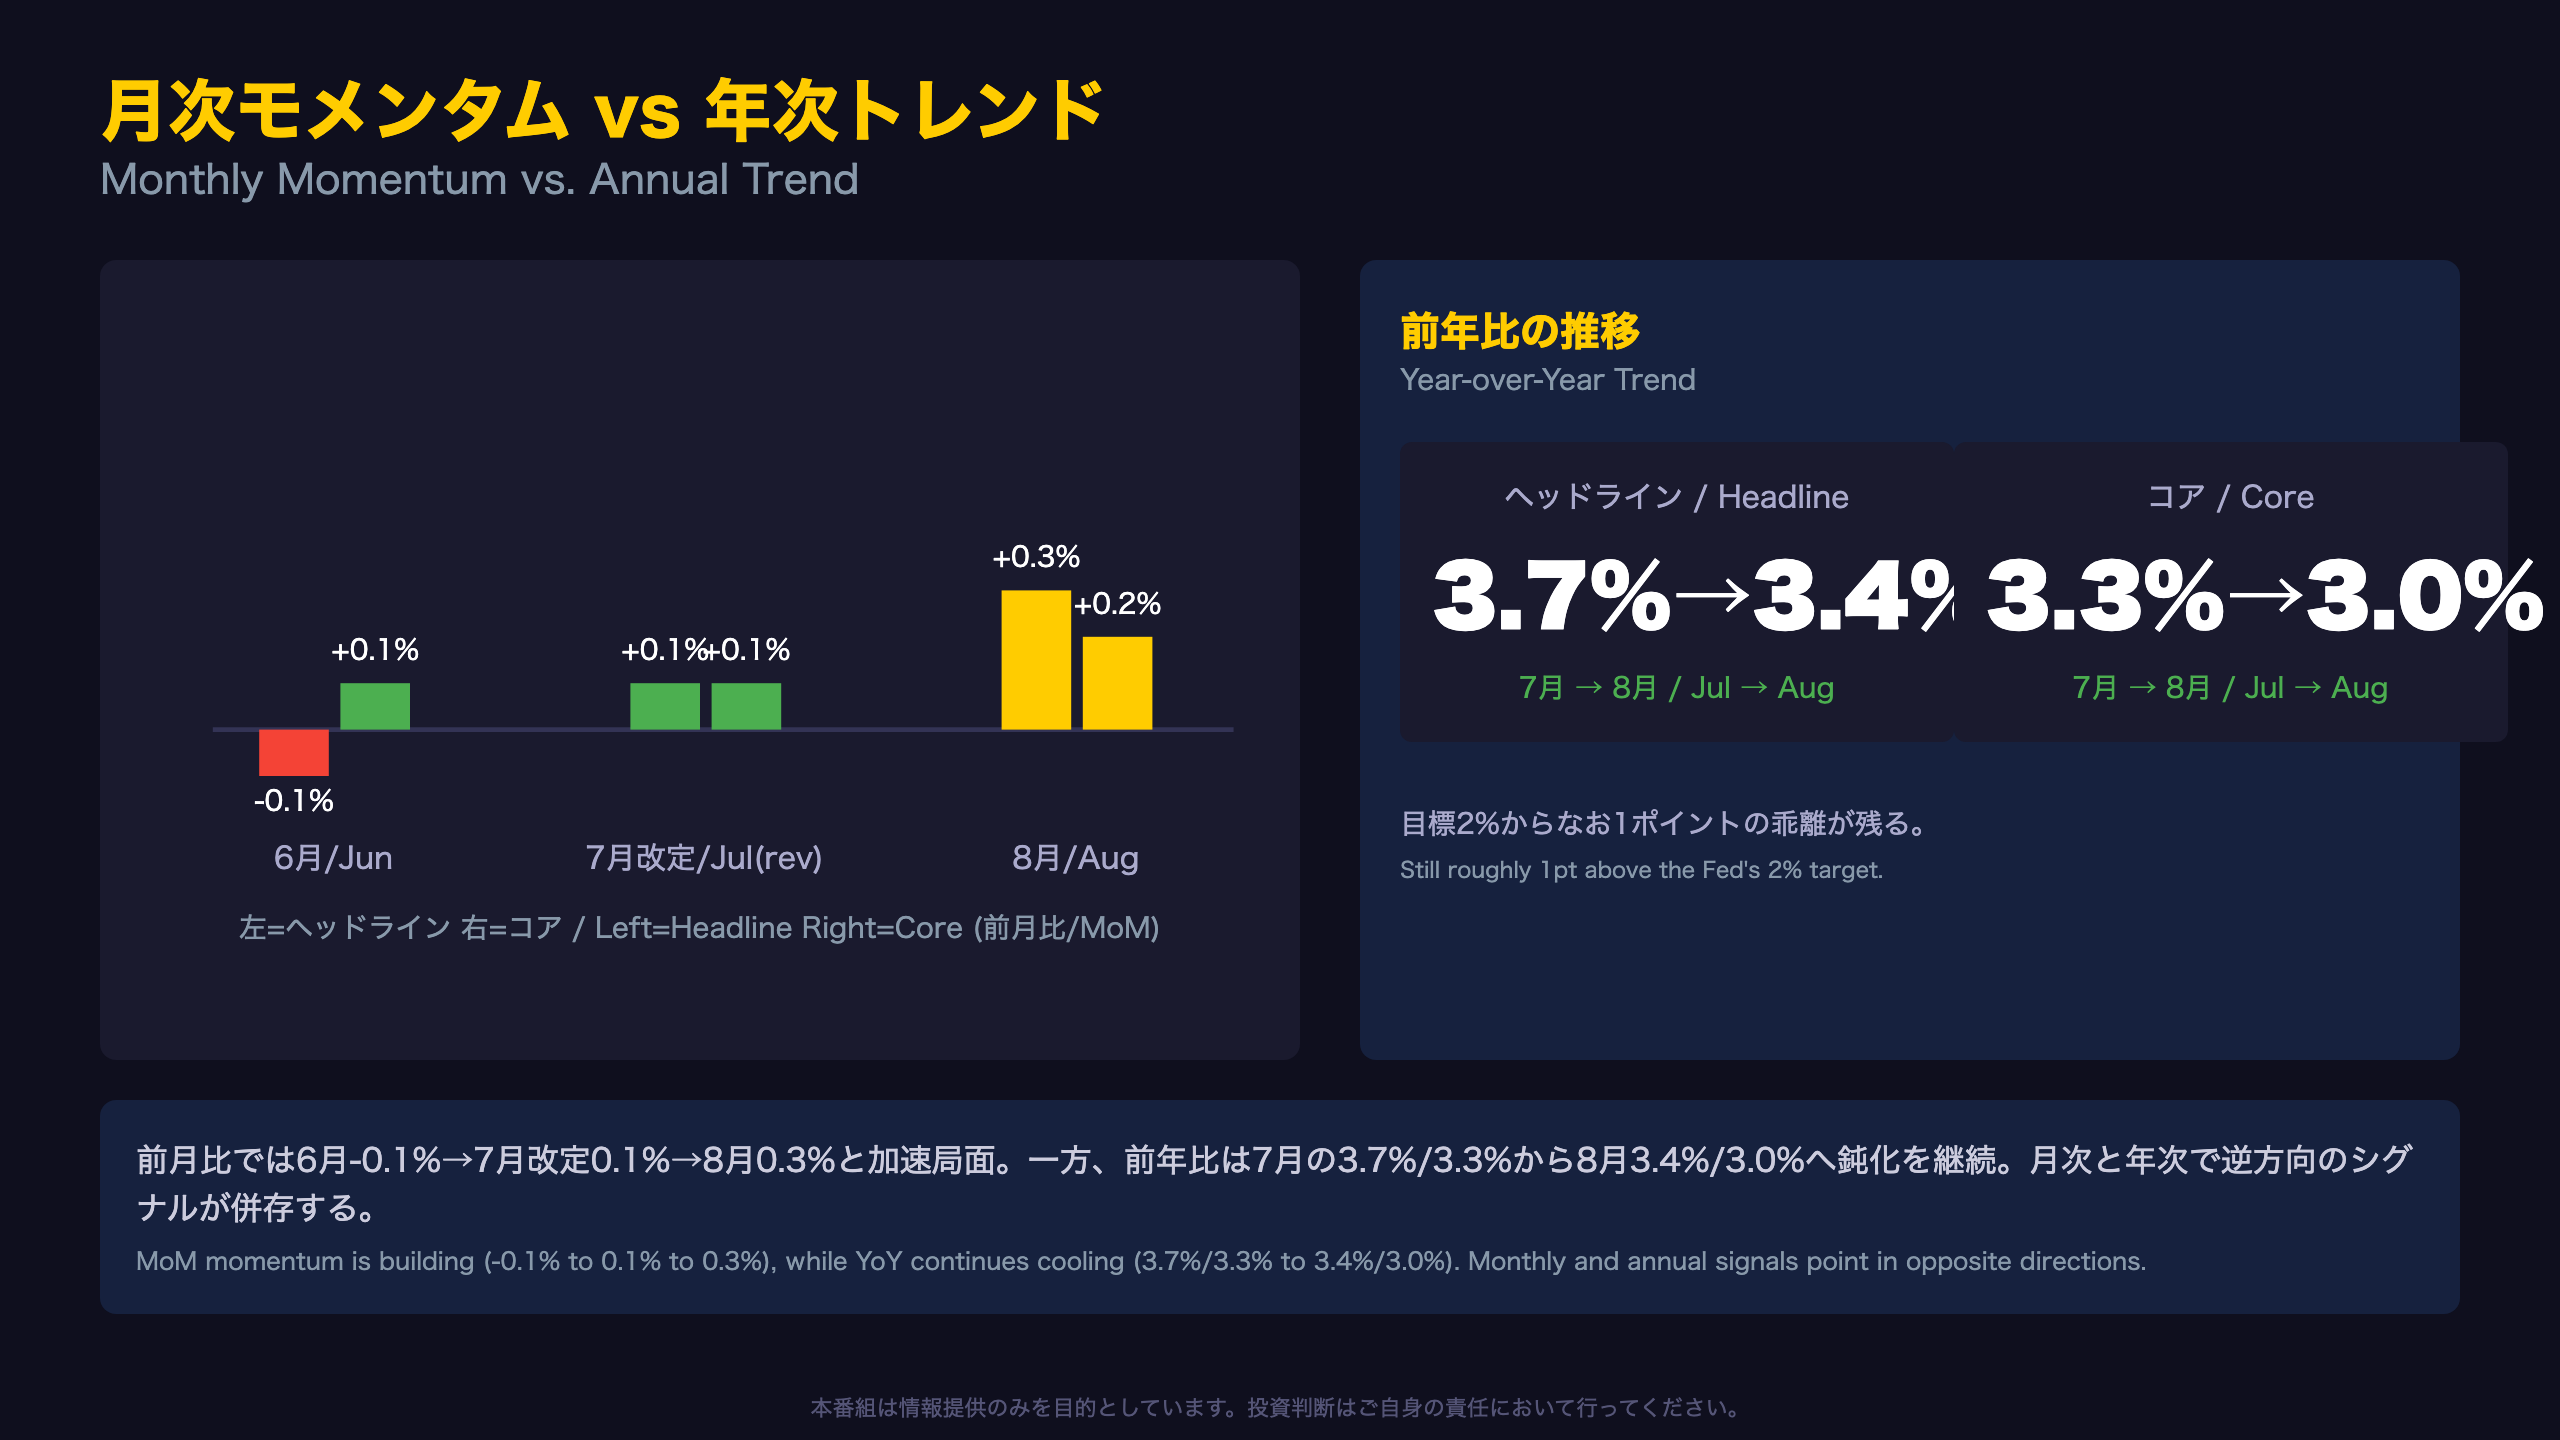
Core PCE rose +0.2% MoM, accelerating from a downwardly revised +0.1% in July.
📈 Real PCE jumped +0.6%, with nominal PCE up a strong +0.9%.
📉 Yet YoY, headline eased to 3.4% and core to 3.0%, down from July’s 3.7%/3.3%.
💡 The savings rate jumped from 3.0% to 4.1%—likely driven by a benchmark revision reaching back to 2021.
⚠️ A genuinely mixed-signal report. Next release: September data on Oct 29.
The Ultimate Summary:加速と鈍化の同居
Understanding the August PCE Report
The Bureau of Economic Analysis (BEA) is the U.S. government agency that compiles GDP, personal income, and the PCE price index — the Federal Reserve’s preferred inflation gauge, as opposed to the more widely known CPI from the Bureau of Labor Statistics. Unlike CPI, PCE uses a chain-weighted methodology that better captures substitution effects, which is why the Fed’s 2% target references PCE, not CPI.
This particular release was unusual: it coincided with BEA’s 2026 annual benchmark revision, which revises the entire National Economic Accounts back to January 2021. As the release states: \”The revisions for estimates of personal income and outlays begin with January 2021.\” This means July’s previously reported +0.2% core PCE reading was revised down to +0.1%, making August’s +0.2% figure look like a reacceleration when it may partly reflect a lower revised base.
Why this matters for markets
For international investors, the PCE report carries more weight for U.S. rate expectations than CPI, since the Federal Reserve’s dual mandate explicitly targets the PCE price index. A reacceleration in the monthly core reading, even a modest one, tends to reduce market pricing for near-term rate cuts, while the continued year-over-year deceleration (core down to 3.0% from 3.3%) offers a partially offsetting dovish signal.
Income composition shift
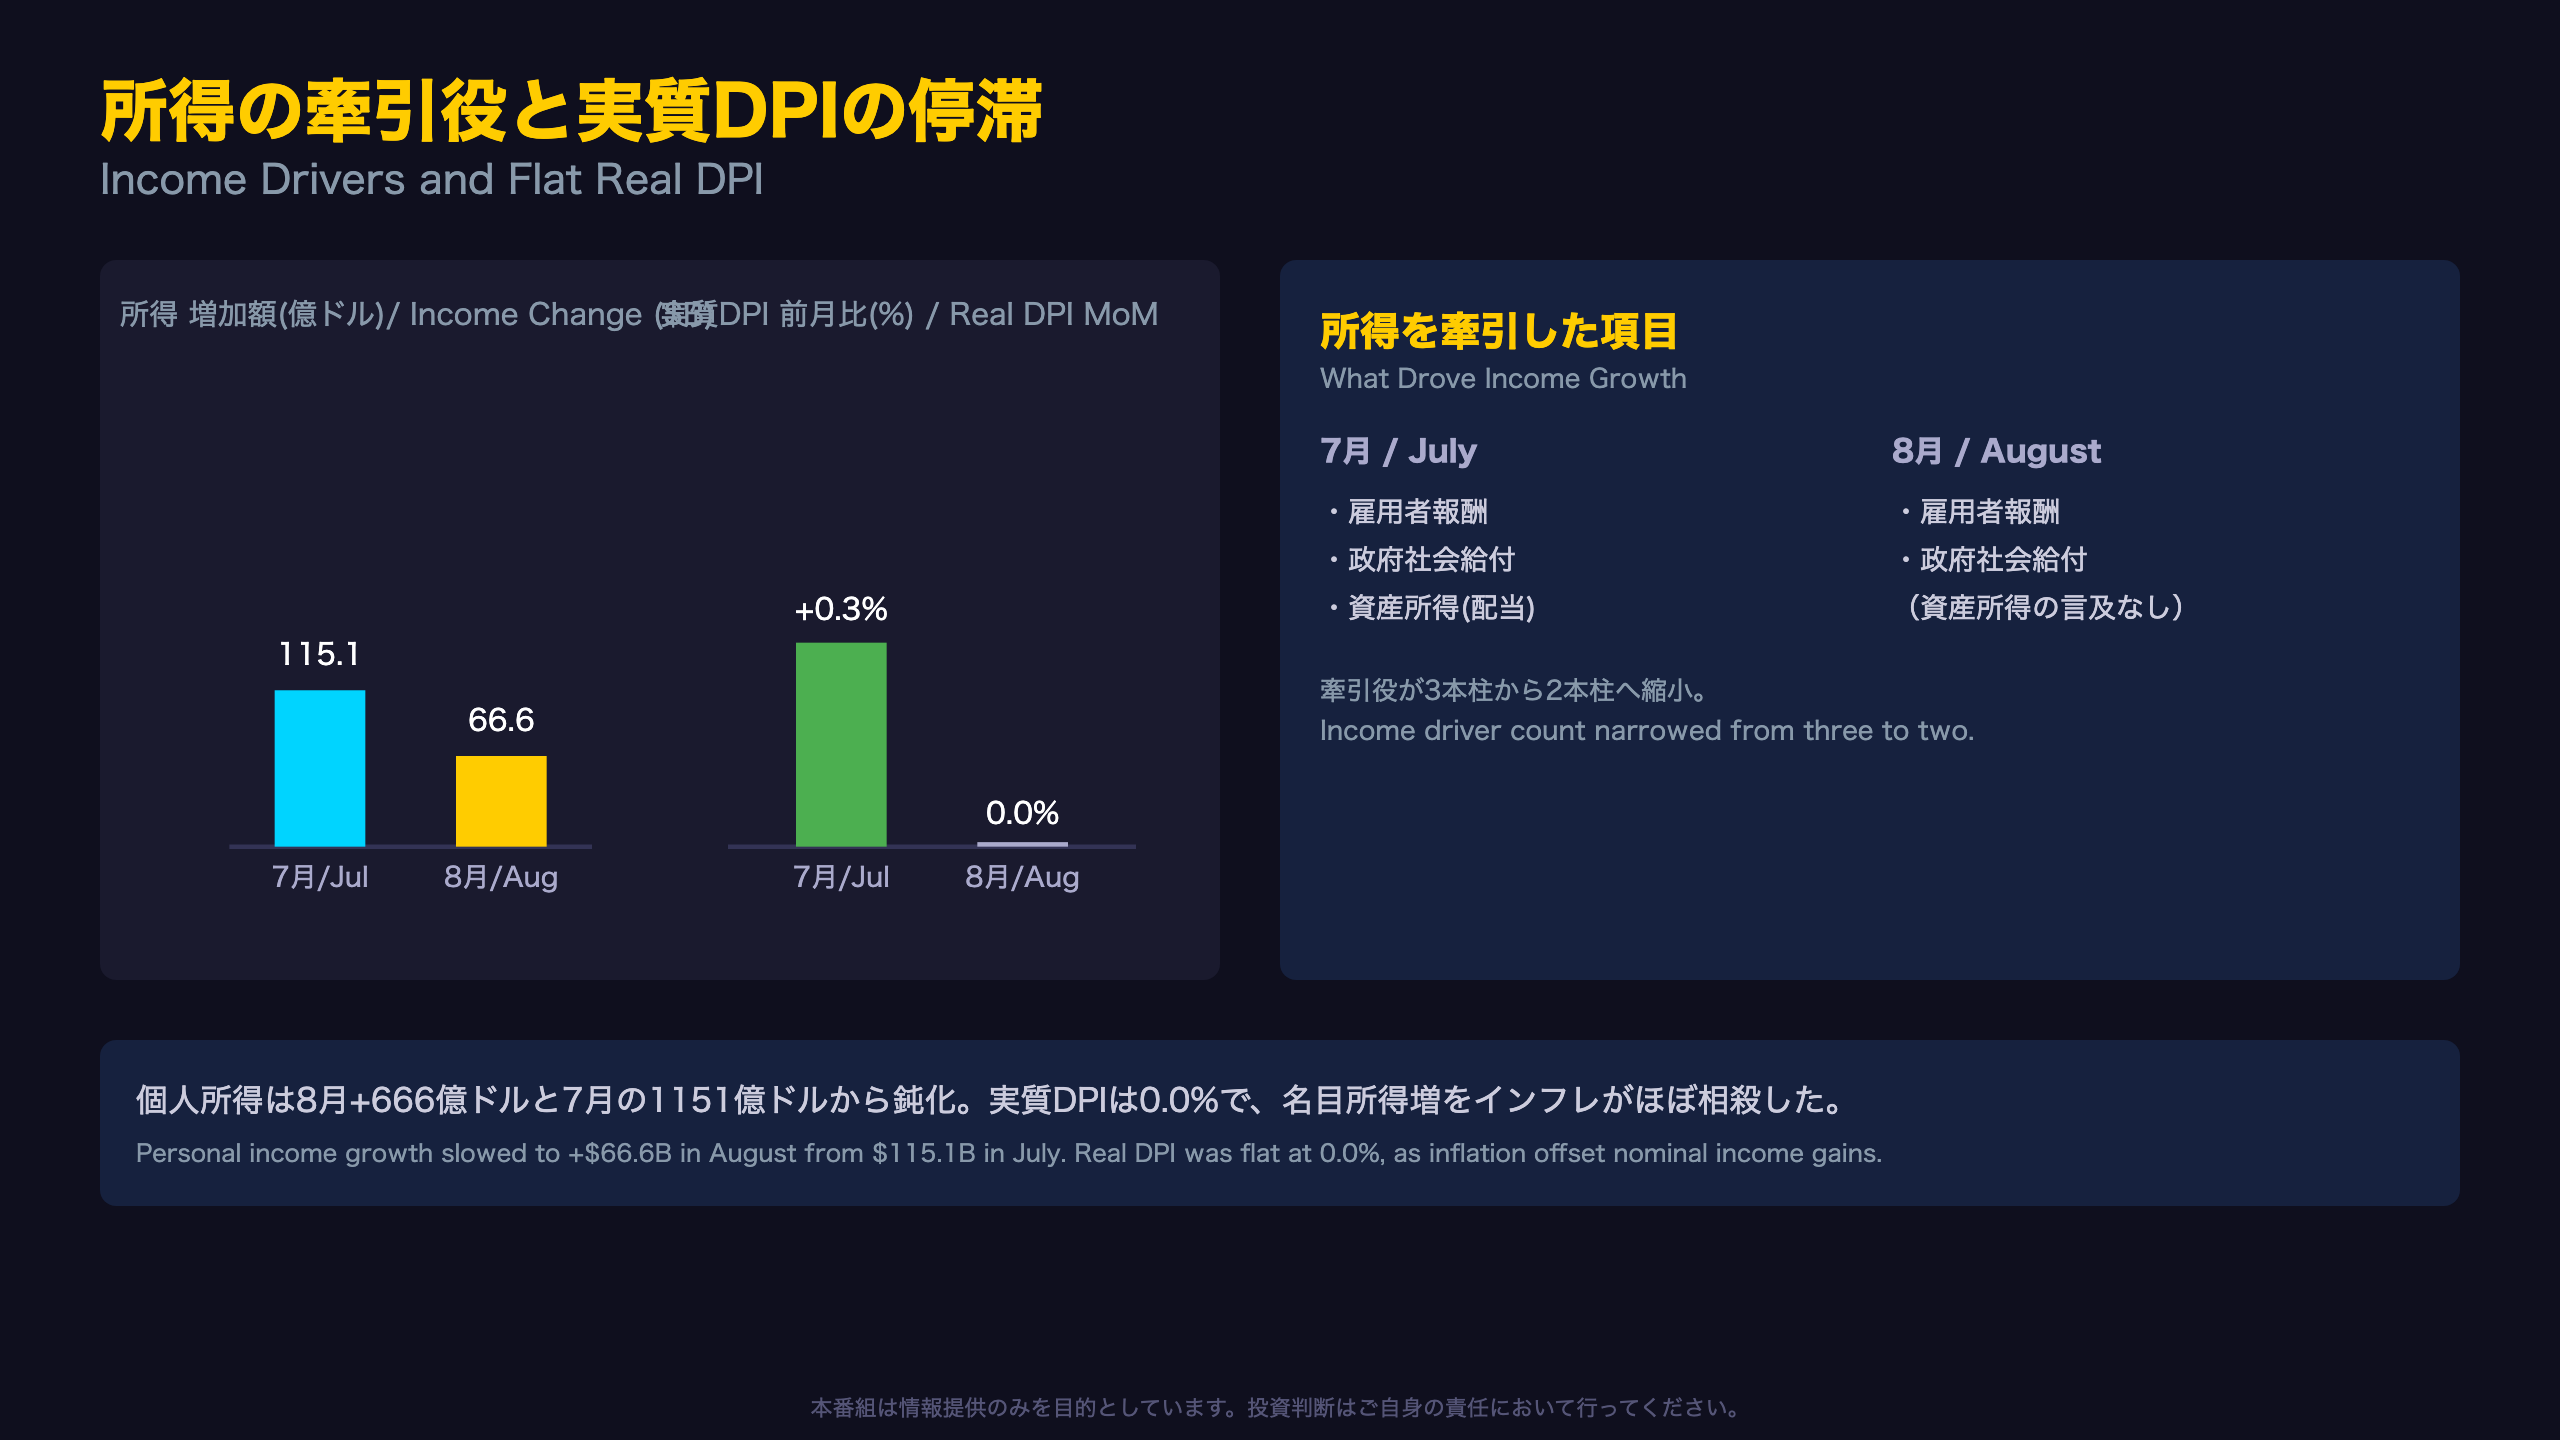
Notably, July’s income growth was supported by three pillars — compensation, government benefits, and asset income (dividends) — while August’s release cites only two: compensation and government benefits. This narrower base is a subtle but relevant data point for the durability of income growth.
月次モメンタム vs 年次トレンド
Core vs Headline: A Transatlantic Comparison
For readers more familiar with the Eurozone’s HICP or the UK’s CPI, it’s worth noting that the U.S. Federal Reserve’s target metric — the PCE price index — behaves differently from the CPI headlines most global media report. Core PCE inflation of 3.0% year-over-year remains a full percentage point above the Fed’s 2% target.
The revision effect
BEA’s own text states: \”From the preceding month, the PCE price index for August increased 0.3 percent. Excluding food and energy, the PCE price index also increased 0.2 percent.\” What is easy to miss is that July’s previously reported +0.2% core reading was revised down to +0.1% in this release, as part of the 2026 annual benchmark update that restates data back to January 2021. Analysts comparing month-over-month momentum across releases should treat single-month comparisons cautiously until the revision cycle settles.
Market implication
A stabilizing-but-still-elevated core PCE combined with continued year-over-year cooling supports a “gradual normalization” narrative rather than either an inflation re-ignition or a rapid return to target — a dynamic that tends to keep Treasury yields range-bound rather than triggering sharp repricing of Fed policy expectations.
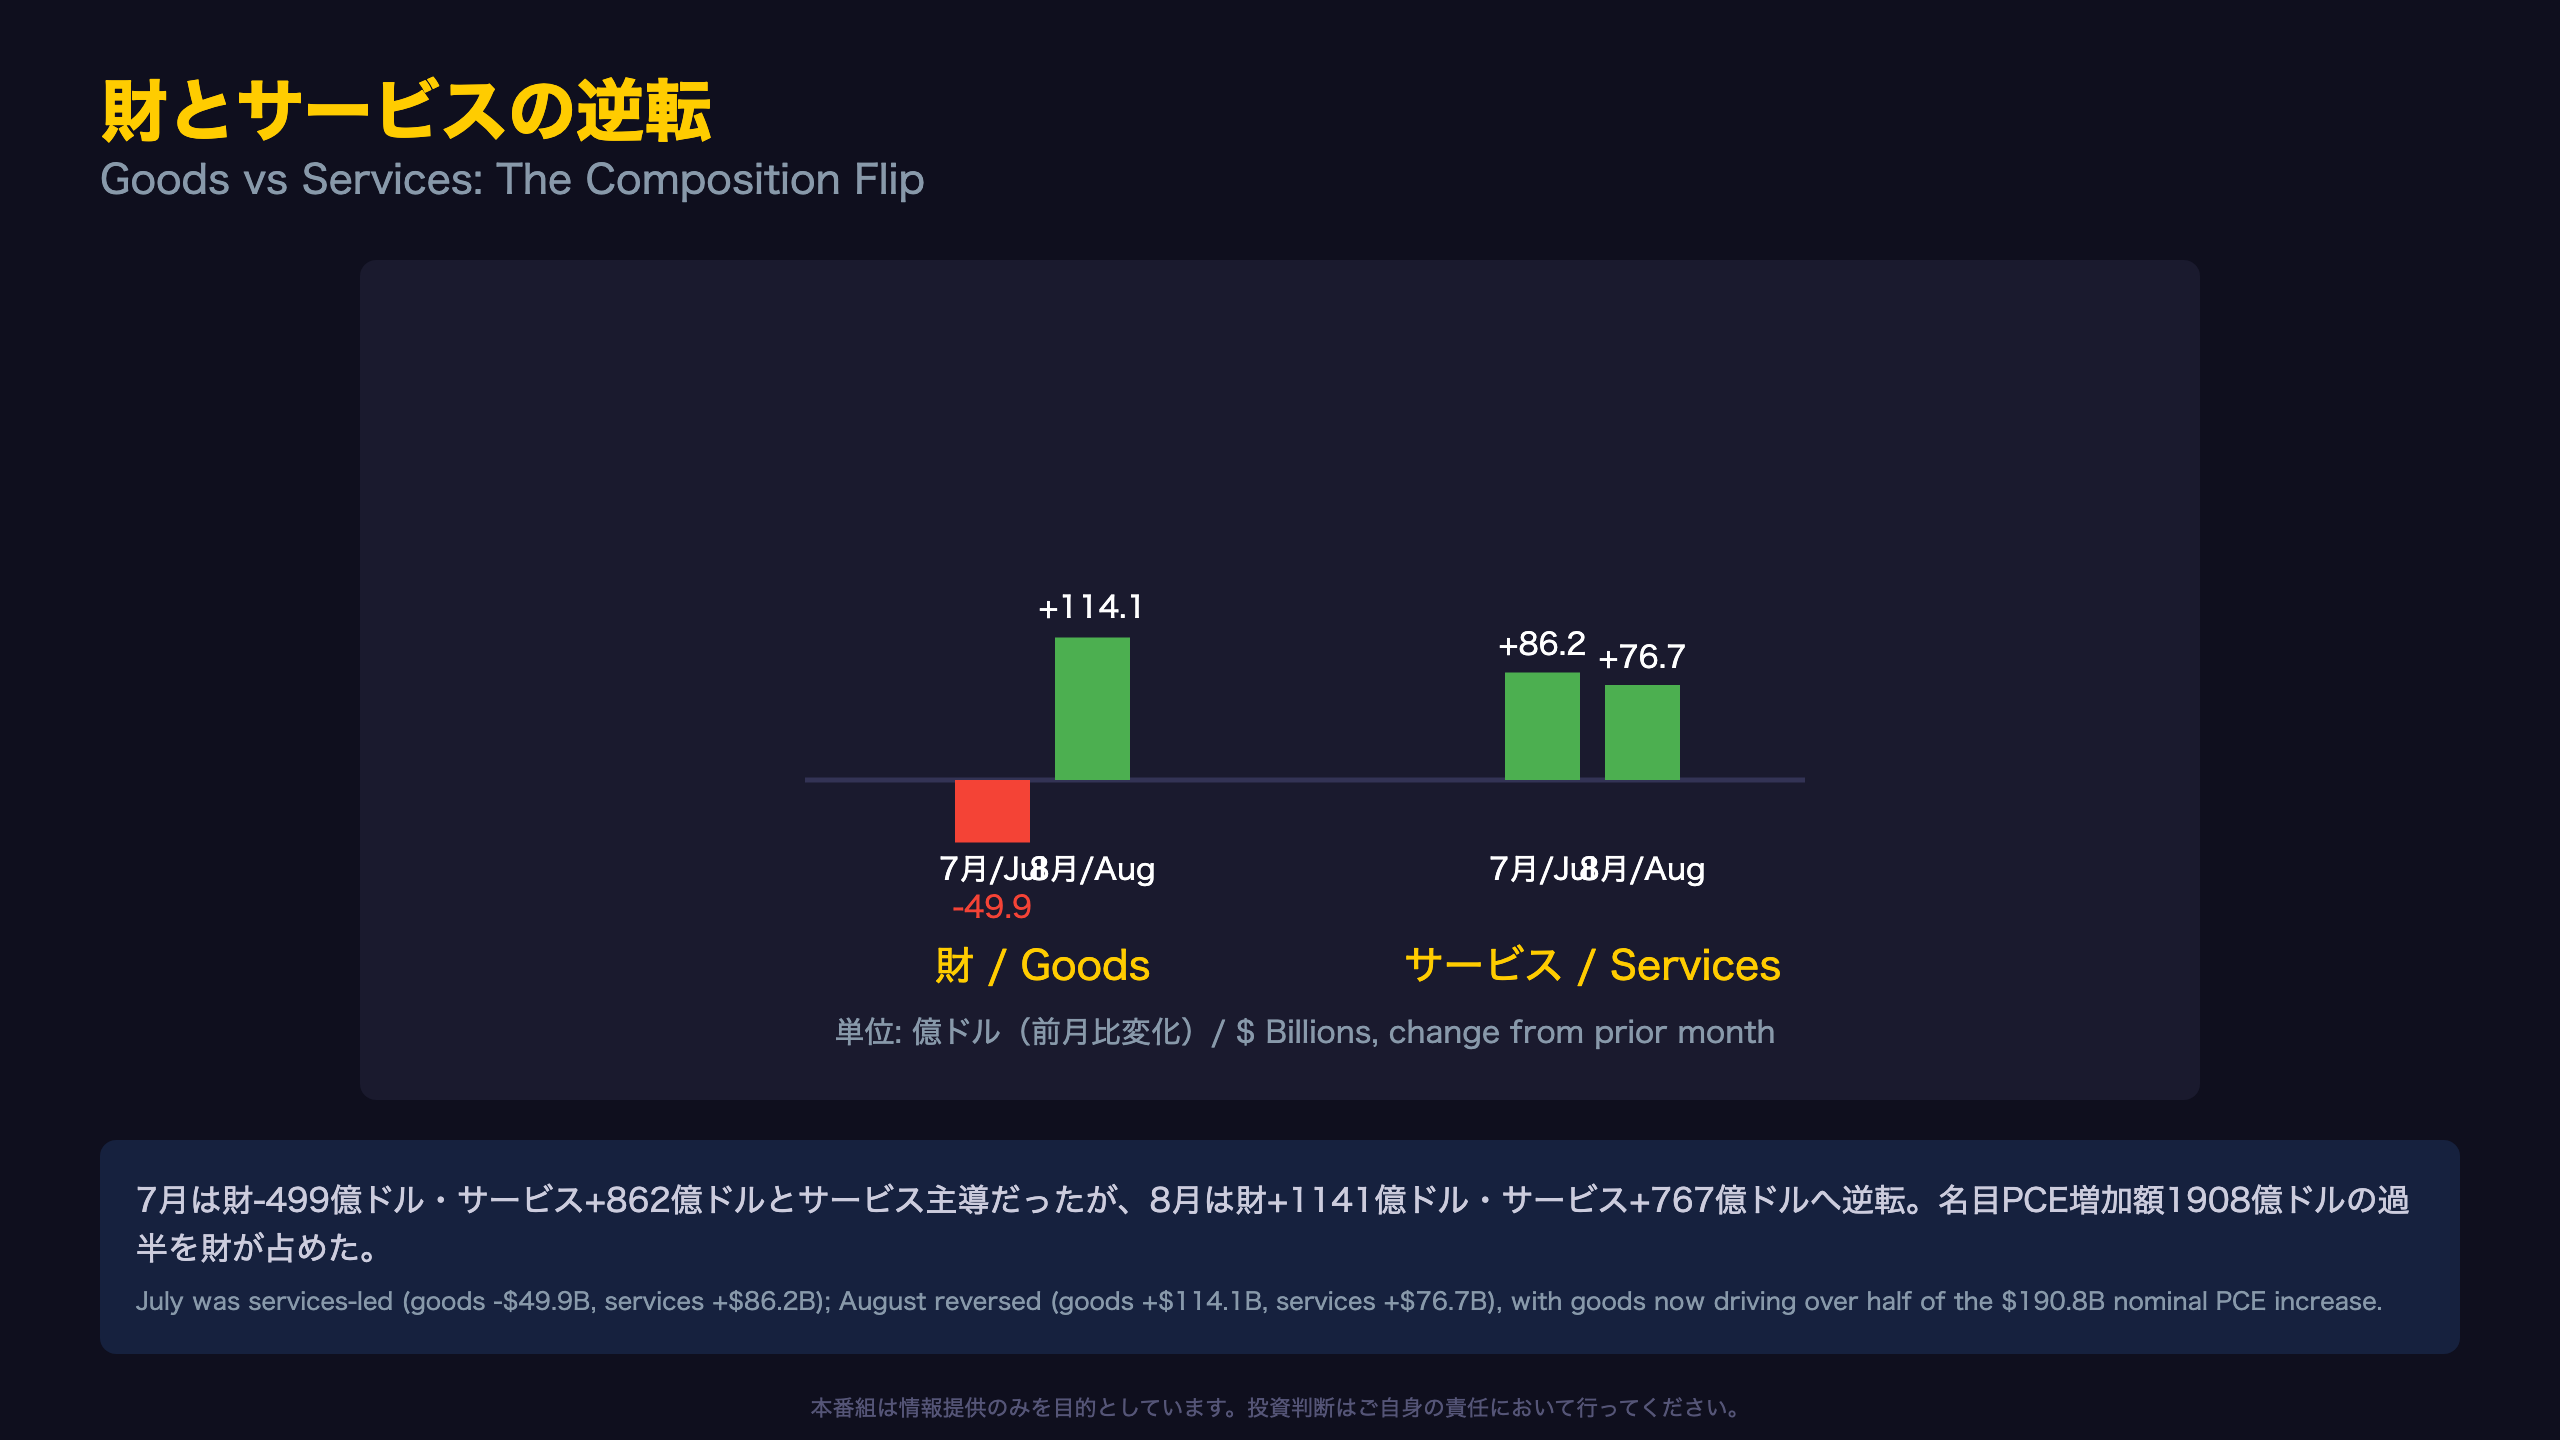
財とサービスの逆転
Durable Goods Volatility: A Familiar U.S. Pattern
For investors unfamiliar with U.S. consumption data quirks, categories like motor vehicles, recreational goods, and gasoline are notoriously volatile month-to-month due to financing conditions, seasonal effects, and energy price swings — unlike, say, more stable eurozone household consumption trackers. July’s pullback in goods spending (-$49.9 billion) was concentrated in exactly these categories: gasoline and energy goods (-$14.0B), recreational goods and vehicles (-$13.6B), and motor vehicles and parts (-$9.4B).
The August reversal
August’s report states plainly: \”The $190.8 billion increase in current-dollar PCE in August reflected increases of $114.1 billion in spending on goods and $76.7 billion in spending on services.\” Goods now represent roughly 60% of total nominal spending growth — a striking reversal given goods had been in outright decline just one month earlier.
Nominal vs. real: the price question
Real PCE rose only $92.8 billion (0.6%) even as nominal PCE rose $190.8 billion (0.9%), implying a meaningful portion of August’s spending increase reflects higher prices rather than higher purchased quantities. Without item-level August detail clearly attributable in this release, it would be an overreach to declare a durable consumer rebound; a one-month payback effect after July’s slump remains equally plausible.
所得の牽引役と実質DPIの停滞
Compensation and Government Transfers: The Two Engines
Unlike many countries where wage data comes from a single source, the U.S. income breakdown draws on multiple federal datasets—BLS’s Current Employment Statistics for wages, and Treasury/budget data for benefits like Medicare, Medicaid, and Social Security. In August, BEA notes the increase \”primarily reflected increases in compensation and government social benefits,\” with Medicare and Social Security singled out as the leading benefit contributors — a shift from July’s Medicaid/Medicare-led pattern.
A narrower income base
A subtle but important observation: July’s release cited three income drivers (compensation, government benefits, and asset income/dividends), while August cited only two. The disappearance of asset income as a stated driver doesn’t necessarily signal weakness — dividend payments are often seasonal — but it is a data point worth monitoring for confirmation of broader income durability.
The real income stagnation
Perhaps the most consequential figure in this slide: real disposable personal income was flat at 0.0% in August, as the 0.3% nominal DPI gain was almost entirely absorbed by the 0.3% rise in the PCE price index. For rate-watchers, this juxtaposition — flat real income against a 0.6% surge in real consumption — sets up the analytical question of whether the consumer is drawing down savings, or whether this is a statistical artifact of benchmark revisions.
貯蓄率急伸の正体とFRBへの含意
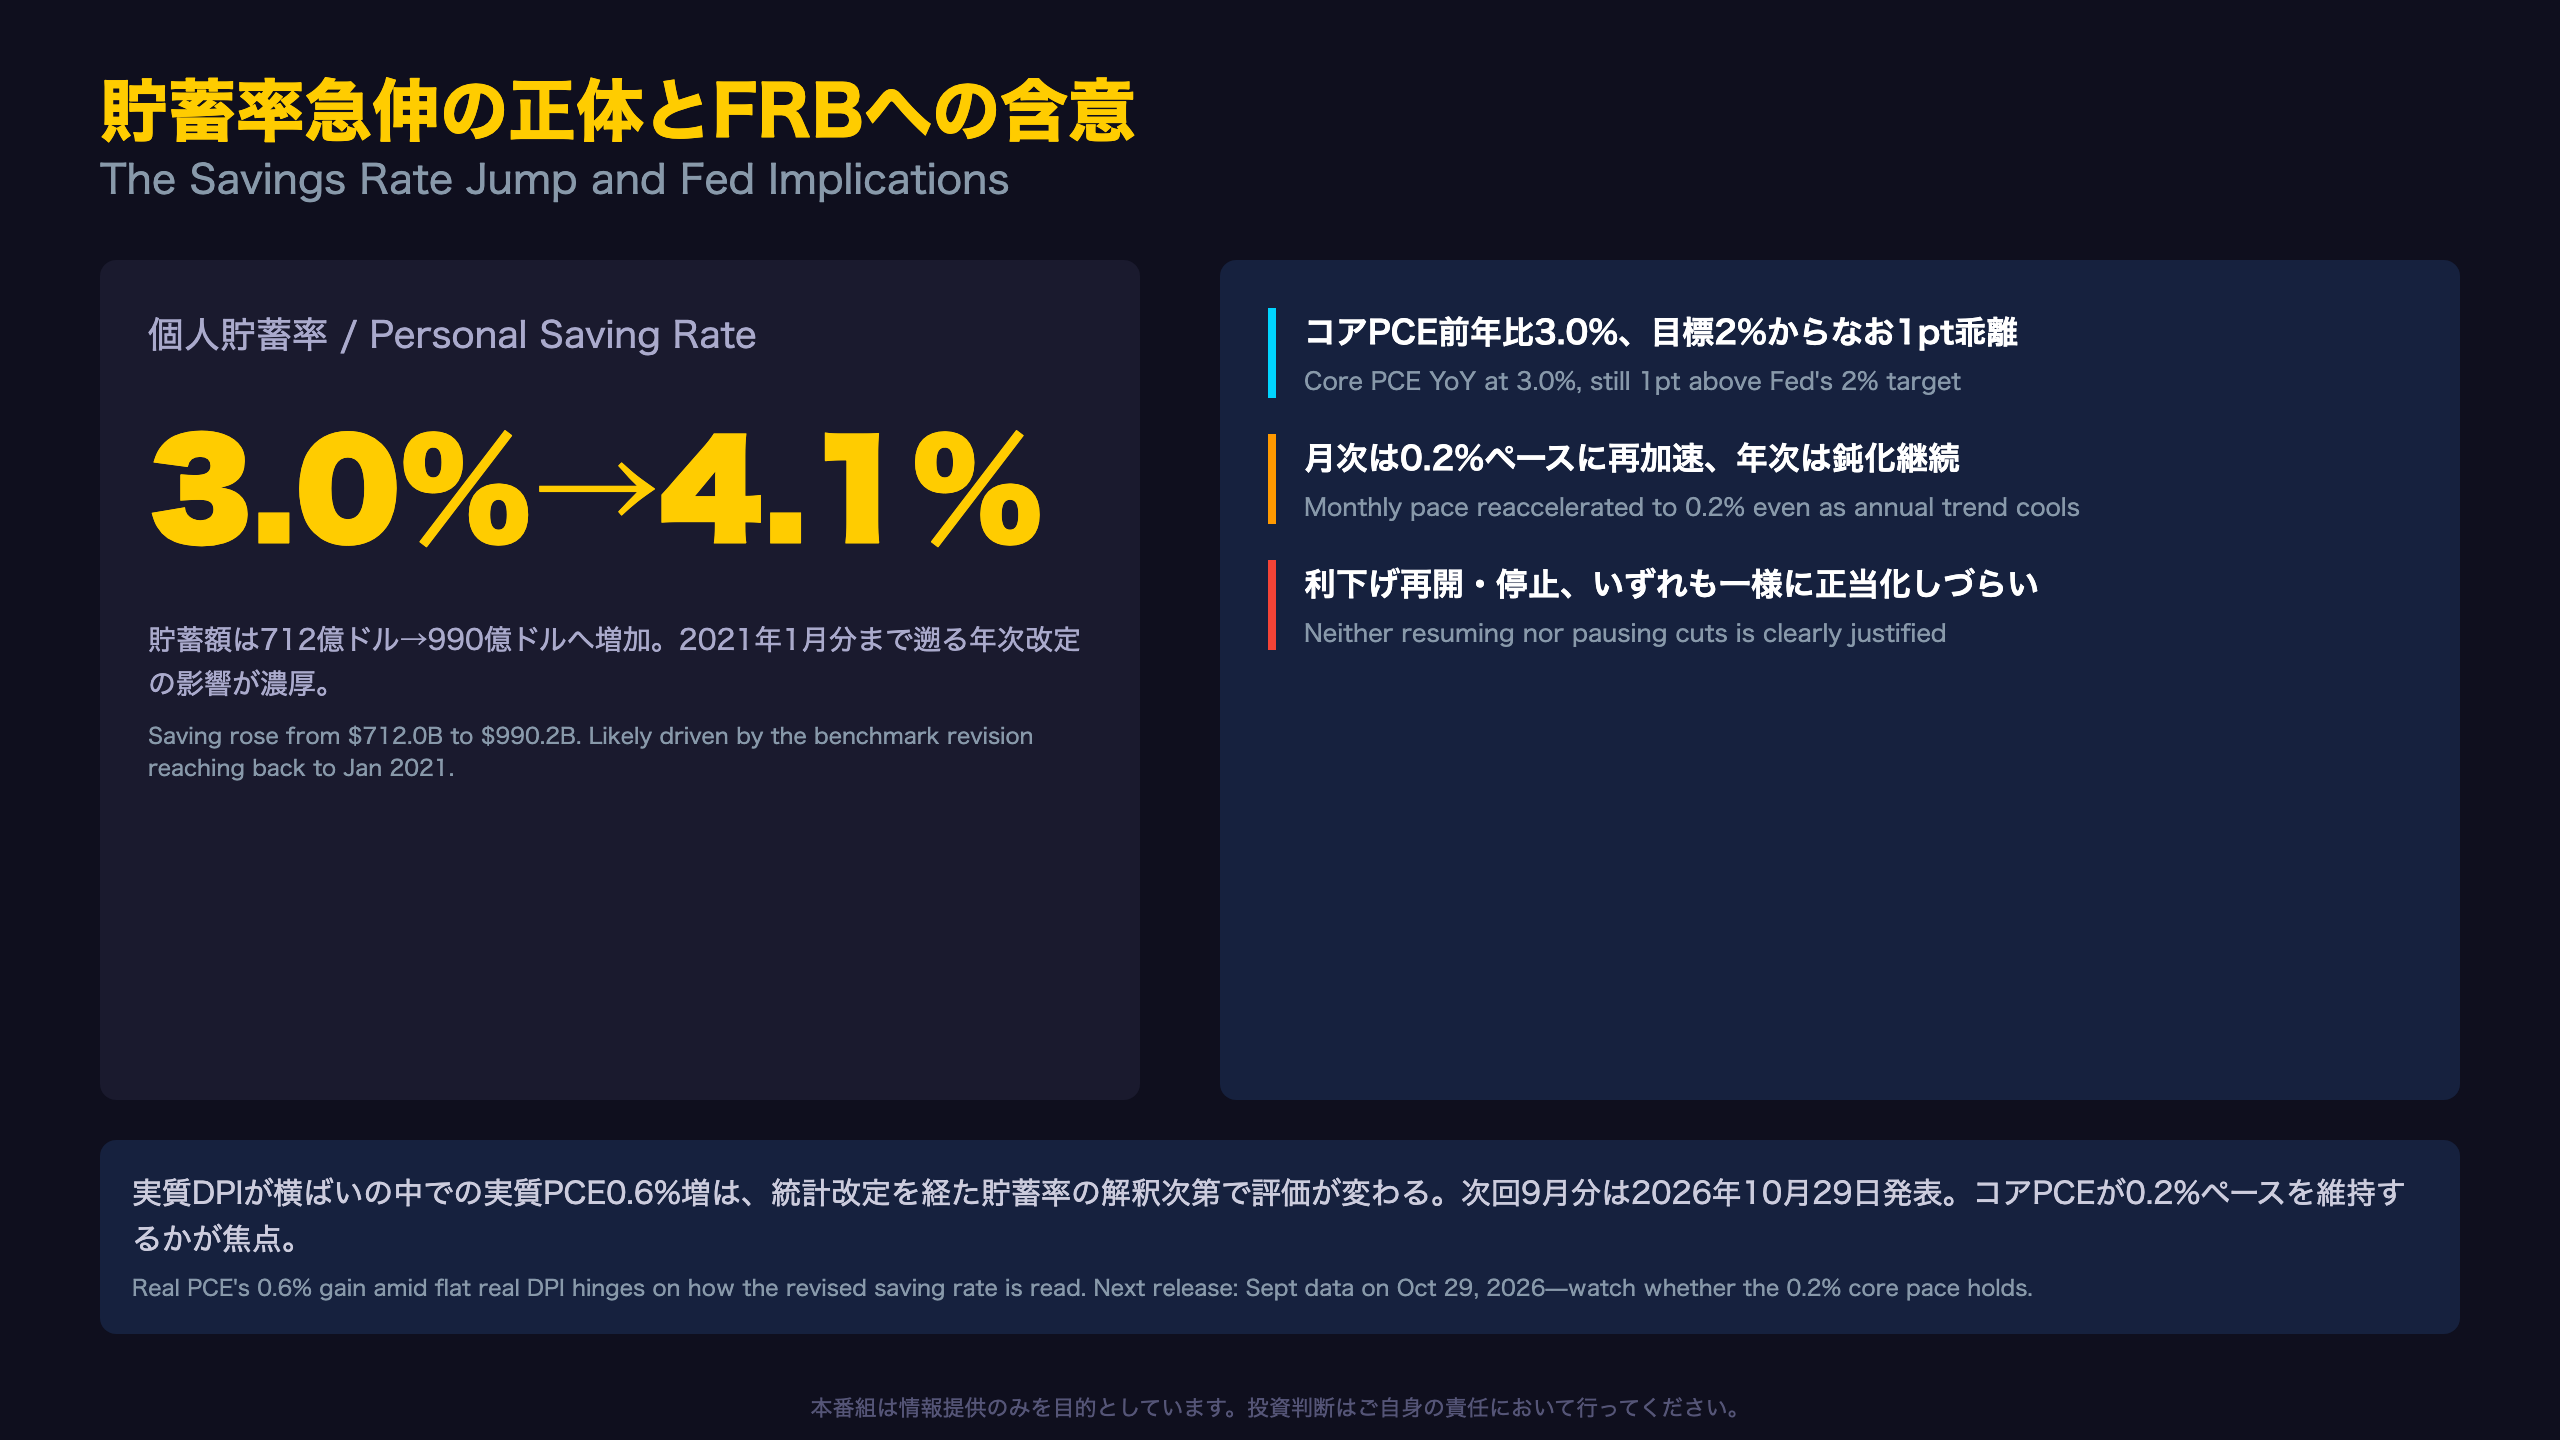
Savings Rate Discontinuities: A Cautionary Tale for Cross-Country Comparisons
International investors comparing U.S. household saving rates to, say, the Eurozone’s (which tend to run structurally higher) should treat this release’s saving rate jump — from 3.0% to 4.1% — with particular caution. The report states: \”The revisions for estimates of personal income and outlays begin with January 2021,\” confirming that this is not a simple month-over-month reading but one spanning a comprehensive historical restatement.
Bull and bear reads
Bull case: If the saving rate genuinely stabilizes near 4%, U.S. households retain meaningful spending capacity, and August’s 0.6% real PCE gain reflects durable, not borrowed, demand.
Bear case: With real disposable income flat at 0.0%, an underlying saving rate closer to July’s pre-revision 3% would imply August’s consumption burst is running ahead of income growth — a pattern that historically proves difficult to sustain over multiple quarters.
Fed policy calculus
Core PCE remains a full percentage point above the Fed’s 2% target on a year-over-year basis (3.0%), while the monthly pace (0.2%) is running above what’s consistent with returning to target on a sustained basis. Neither a resumption of rate cuts nor an extended pause is unambiguously supported by this single report.
What to watch next
The September Personal Income and Outlays report arrives October 29, 2026. A repeat 0.2% core MoM print would reinforce a “sticky inflation” narrative; a drop back to 0.1% would suggest August was noise rather than trend.
Disclaimer: This article is for informational purposes only. All investment decisions are made solely at your own risk.







