
This article was automatically generated by the NFC Market Live AI analysis system. (Updated: 2026-10-29 21:45 JST)
📄 Primary Source
U.S. Bureau of Economic Analysis
https://www.bea.gov/sites/default/files/2026-10/pi0926.pdf
📊 A walk-through of the BEA’s Personal Income and Outlays report for September, released October 29.
📈 The PCE price index rose 0.5% m/m and core (ex food & energy) rose 0.3%. Year over year: headline 3.6%, core 3.1%.
📉 Nominal spending grew 0.5%, but real spending was roughly flat. Real disposable income fell 0.3% and the saving rate was 3.8%.
💡 Service spending rose broadly, and monthly core inflation matched revised August. We balance strengths and weaknesses using only the primary source.
⚠️ Next release: November 25 (October data).
9月PCE:全体像とサマリー
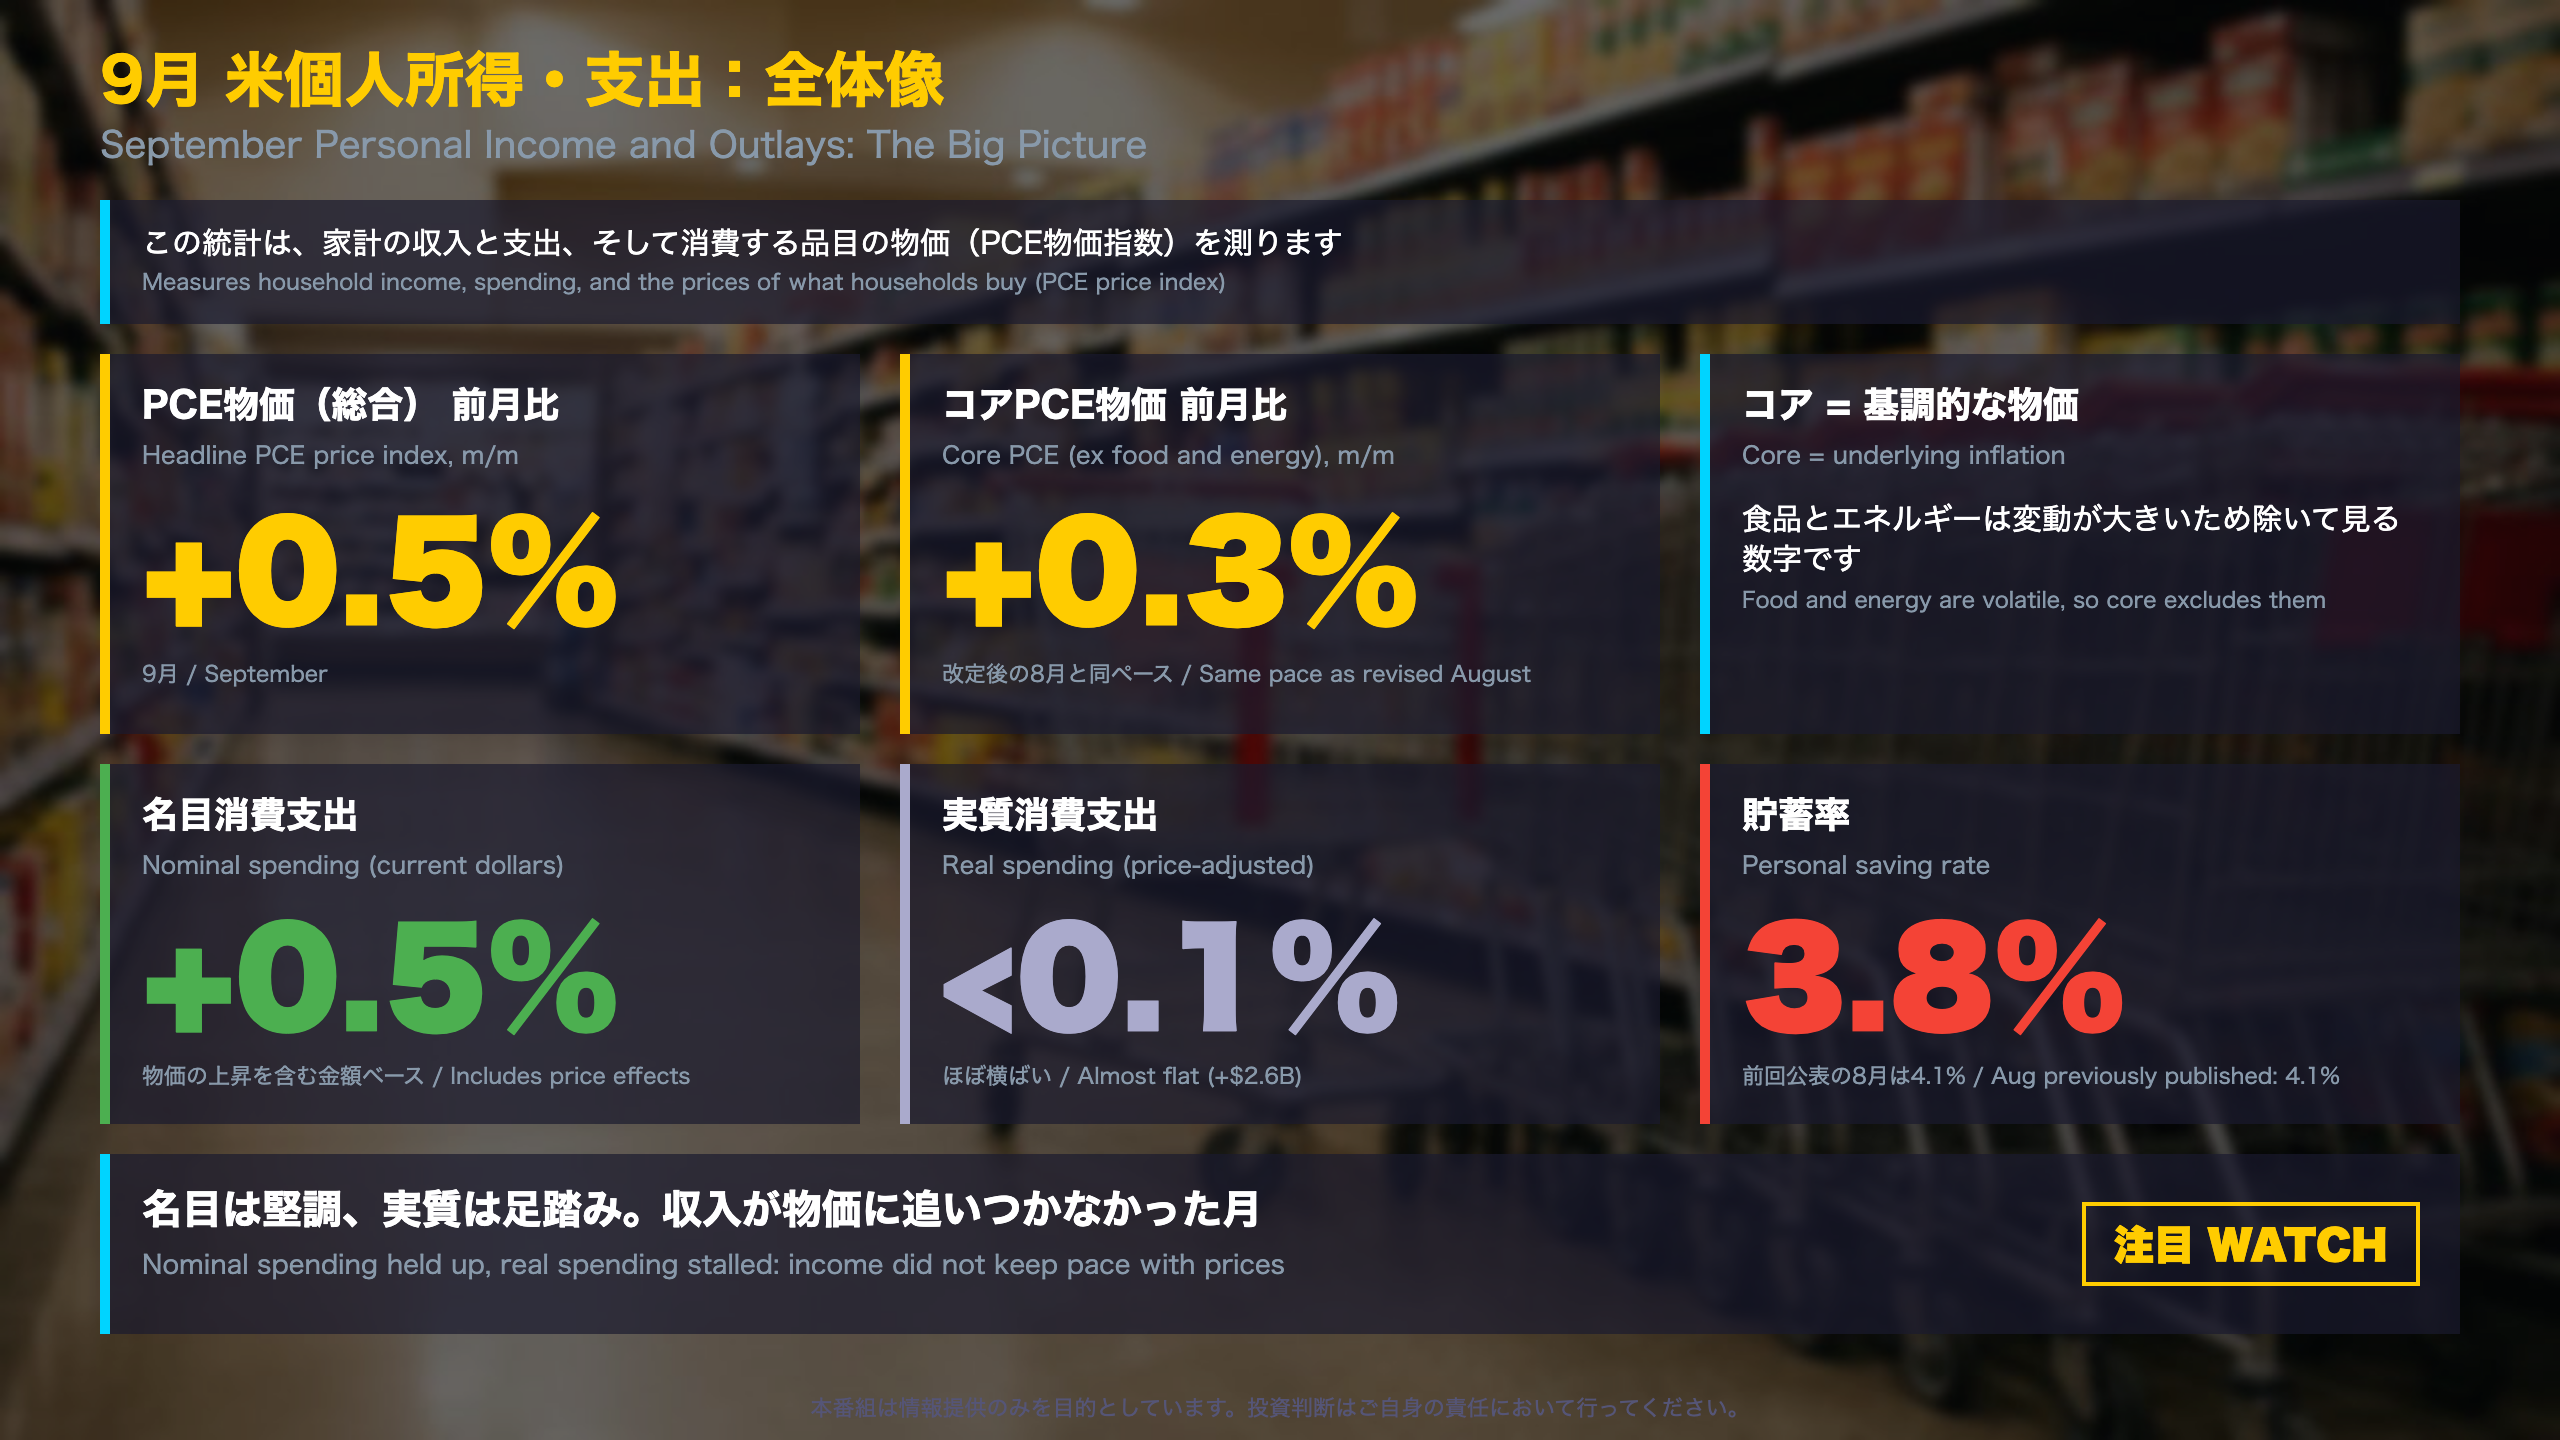
What this report is
The Bureau of Economic Analysis (BEA), part of the U.S. Department of Commerce, publishes Personal Income and Outlays monthly. It combines household income, spending and saving with the PCE price index, a measure of prices paid by households. Japanese readers can think of it as the U.S. counterpart to Japan’s consumer price index, although the basket and weights differ.
September at a glance
- PCE price index: +0.5% m/m; core (ex food and energy): +0.3% m/m
- Year over year: headline 3.6%, core 3.1%
- Nominal PCE +0.5%; real PCE 0.0% (+$2.6 billion)
- Real disposable income -0.3%; saving rate 3.8%
Reading the three-month path
Headline monthly inflation stepped up from 0.1% in July (as previously published) to 0.3% in revised August and 0.5% in September. Real spending moved the other way, from +0.5% in August to flat. The BEA also revised August: core inflation moved from 0.2% to 0.3%, and real PCE from 0.6% to 0.5%.
Balanced view
Resilient side: nominal spending kept rising, services spending increased broadly, and monthly core inflation matched revised August.
Soft side: real disposable income declined, the saving rate fell, and real spending stalled after a strong August.
Why it matters for comparison
Japanese data usually reports consumption and prices separately. This US release links them in one table, which makes it easy to see whether spending growth is real volume or simply higher prices. This report does not discuss monetary policy, and we do not infer it here.
Next release: November 25, 2026, covering October.
物価の中身:総合とコア
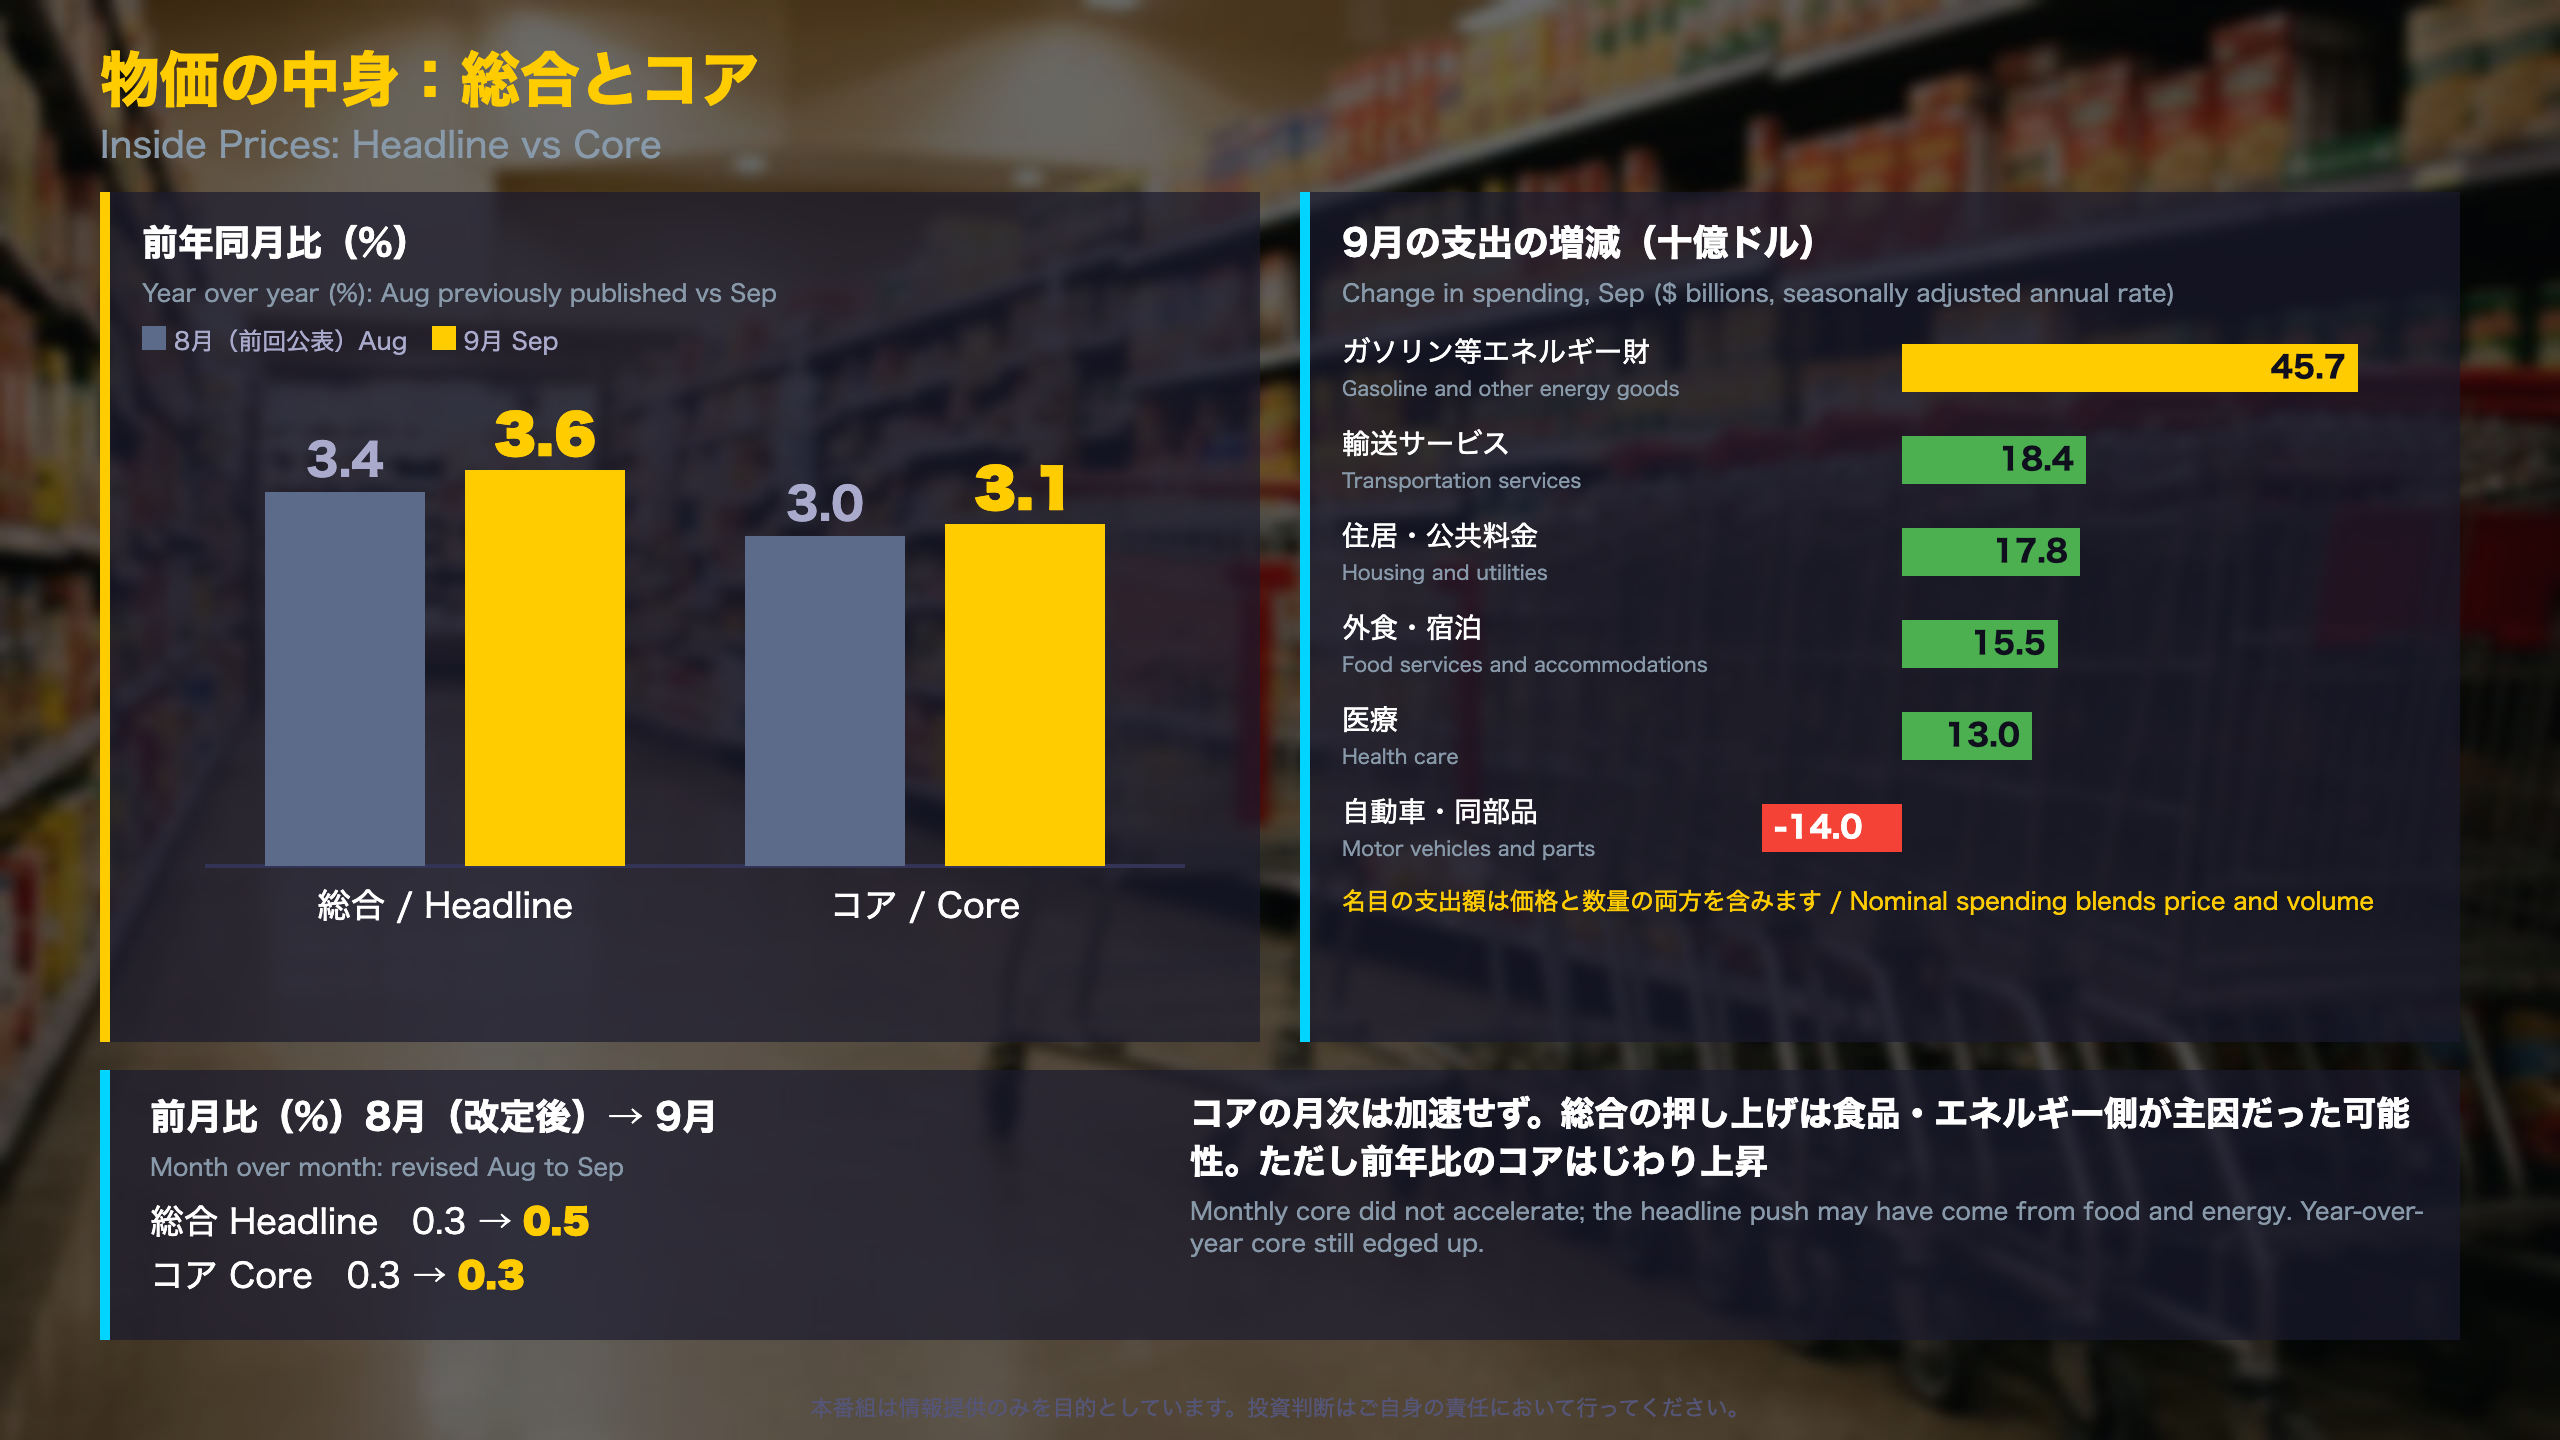
Headline versus core: what the numbers say
The PCE price index is the BEA’s gauge of prices paid by households. Headline includes everything; core strips out food and energy, which swing more from month to month. Japan’s closest equivalent is the CPI excluding fresh food and energy.
Year over year
- Headline: 3.4% (August, previously published) to 3.6%
- Core: 3.0% to 3.1%
Month over month
| Jul* | Aug (rev.) | Sep | |
|---|---|---|---|
| Headline | 0.1 | 0.3 | 0.5 |
| Core | 0.1 | 0.3 | 0.3 |
*July as previously published. August core was revised up from 0.2% to 0.3%.
Spending clues
The largest increase in September spending was gasoline and other energy goods (+$45.7 billion), followed by transportation services (+$18.4 billion) and housing and utilities (+$17.8 billion). Motor vehicles and parts fell $14.0 billion. These are nominal figures, so they blend price and volume.
Two readings
Calmer: monthly core matched revised August, suggesting no acceleration in underlying inflation.
More cautious: the upward revision to August core and the small rise in year-over-year core show a gradual drift higher.
What to watch
The October report on November 25 will show whether monthly core stays near 0.3% and how the gap with headline evolves. A single month cannot establish a trend.
所得と支出:貯蓄率3.8%へ低下
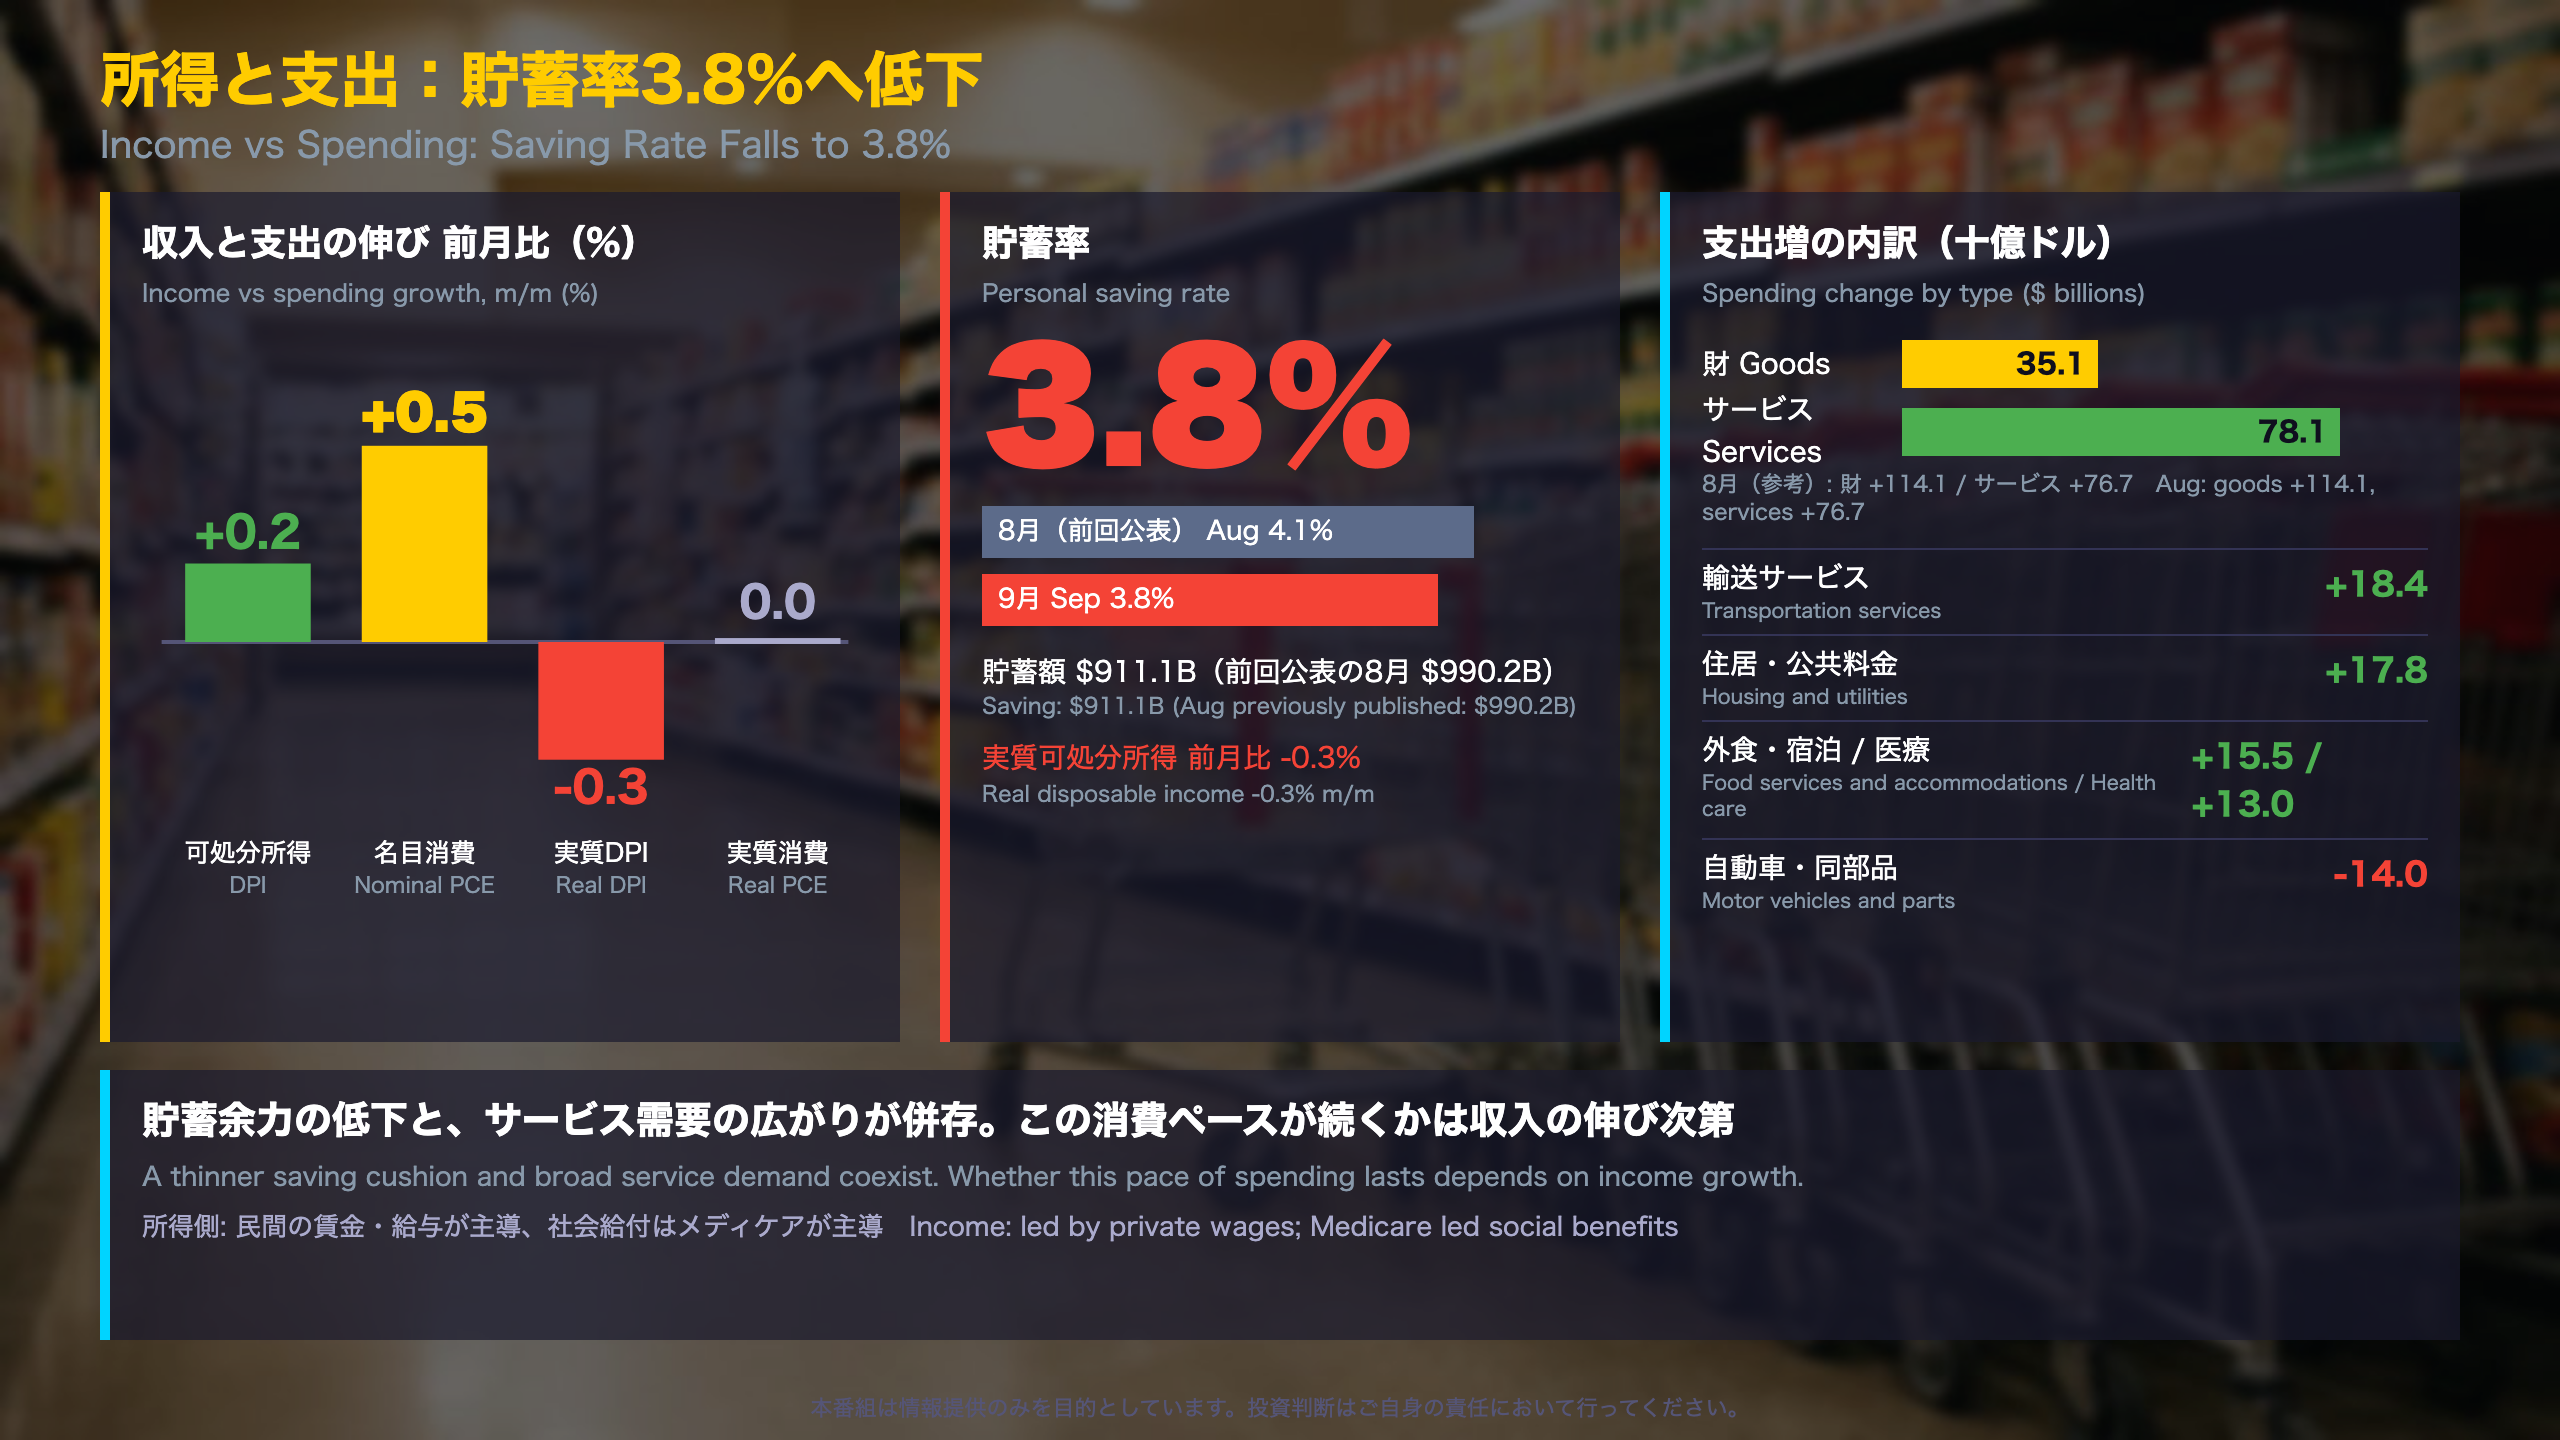
Income versus spending: a three-month view
| m/m, % | Jul* | Aug (rev.) | Sep |
|---|---|---|---|
| Nominal DPI | 0.4 | 0.3 | 0.2 |
| Real DPI | 0.3 | 0.0 | -0.3 |
| Nominal PCE | 0.1 | 0.9 | 0.5 |
| Real PCE | 0.1 | 0.5 | 0.0 |
*July as previously published.
Goods versus services
The rise in nominal spending was $35.1 billion in goods and $78.1 billion in services in September, versus $114.1 billion and $76.7 billion in August. Services were steady at roughly $77-78 billion in both months; the swing came from goods.
Income side
Personal income rose $54.5 billion. The BEA says the increase “was led by private wages and salaries” within compensation, while Medicare led government social benefits. July and August were revised for updated BLS payroll data.
Saving
Saving was $911.1 billion, a rate of 3.8%, versus $990.2 billion and 4.1% in the previously published August report. Personal outlays rose $113.0 billion while disposable income rose $52.7 billion, which explains the move. Note that saving remained positive.
Balanced view
Resilient: nominal income and spending both grew, and service spending broadened across transportation, housing, restaurants and health care.
Soft: real disposable income fell 0.3%, the saving rate declined, and motor vehicles and parts dropped $14.0 billion.
For non-US readers: DPI is income after taxes; the saving rate is saving divided by DPI. This report offers no forecast, and sustainability of spending depends on income growth that future releases will show.
質疑で深める:消費は強いのか弱いのか
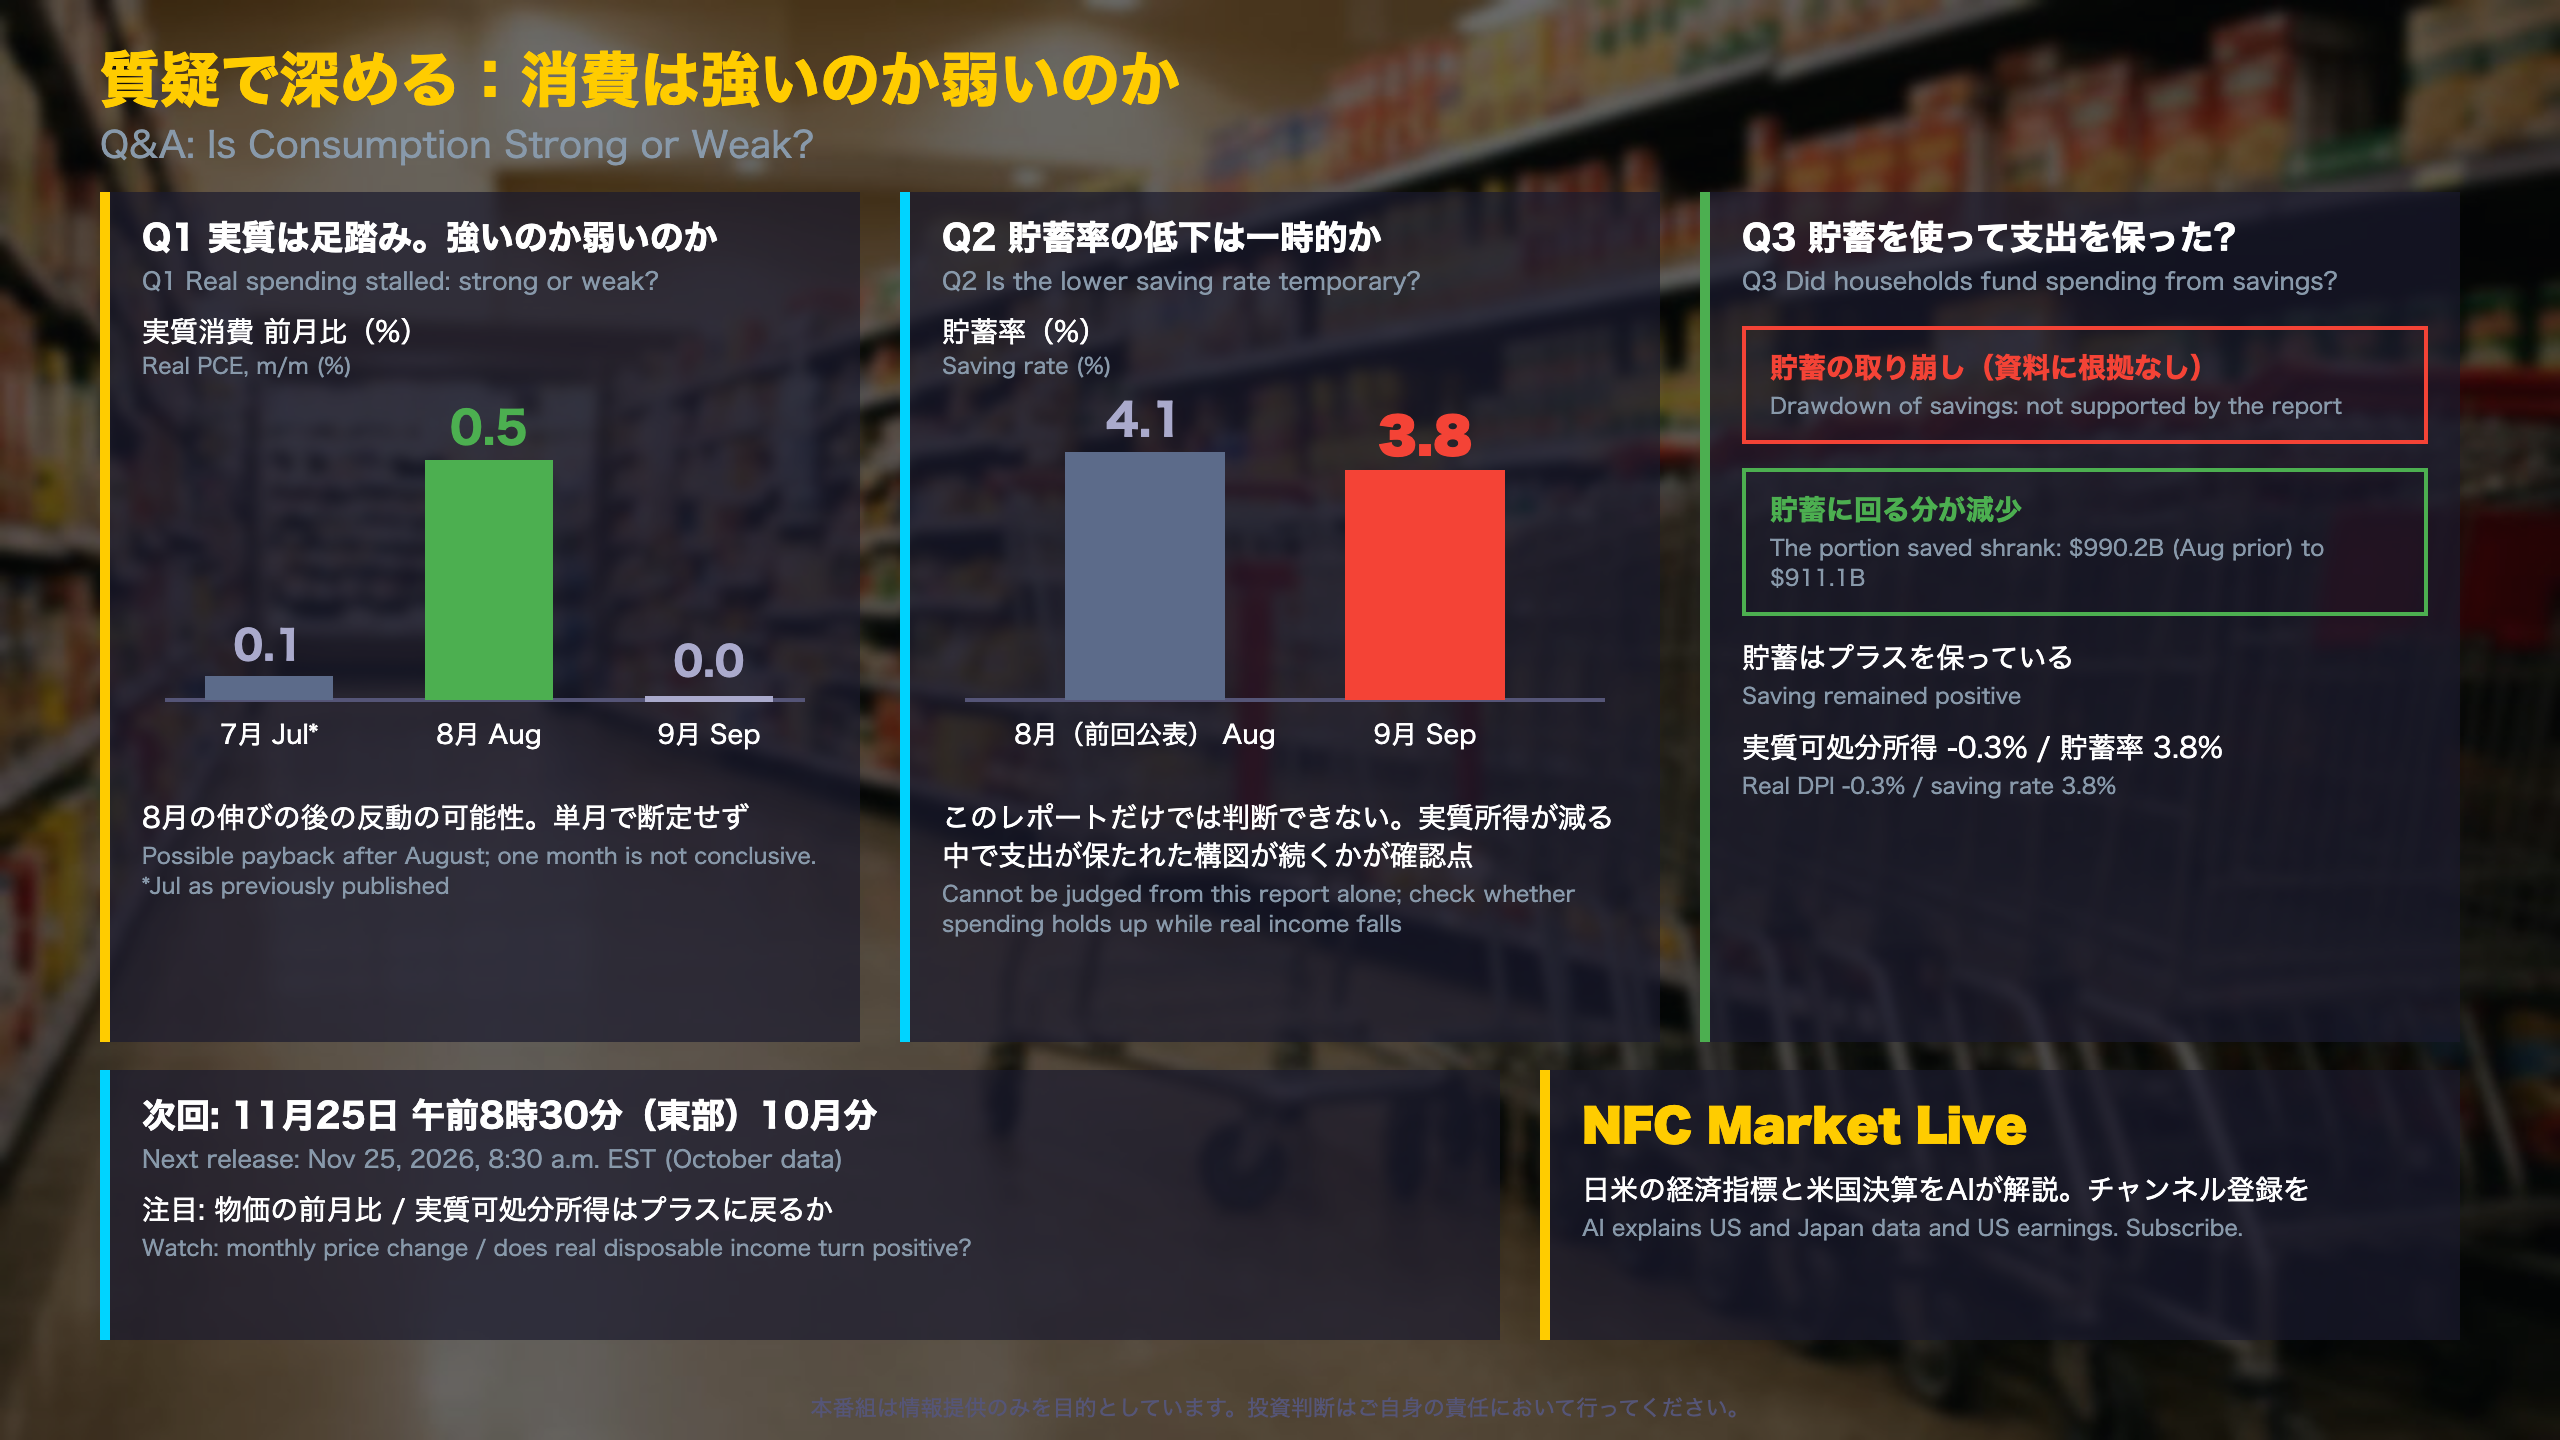
Q&A companion: terms and checkpoints
Nominal versus real
Nominal figures are dollar amounts as they are; real figures strip out price changes and approximate volumes. In September, nominal spending rose 0.5% and real spending 0.0%, so the gap is the price effect. Japanese readers will recognise this as the same split used for Japan’s household spending versus real consumption.
How the saving rate works
Saving is what remains of disposable income after outlays, and the saving rate is that amount divided by disposable income. In September, personal outlays rose $113.0 billion while disposable income rose only $52.7 billion, so saving shrank from $990.2 billion (August, previously published) to $911.1 billion. Saving is still positive: households did not draw down savings, they saved less.
Checklist for the next report
| Item | Aug (rev.) | Sep |
|---|---|---|
| Real PCE m/m | +0.5% | 0.0% |
| Real DPI m/m | 0.0% | -0.3% |
| Saving rate | 4.1% (prior) | 3.8% |
| Core PCE m/m | 0.3% | 0.3% |
Two interpretations
A payback view: after a strong August, a pause in real spending is not unusual, so September’s weakness may be limited.
A cautious view: falling real income and a lower saving rate arriving together deserve attention.
Both rest on a single month, so neither is conclusive. The BEA states: “Next release: November 25, 2026, at 8:30 a.m. EST.” The October data will show how each line in the table moves. This report contains no policy guidance, and we do not infer any.
Disclaimer: This article is for informational purposes only. All investment decisions are made solely at your own risk.