📺 Watch the Full Video Analysis
This article was automatically generated by the NFC Market Live AI analysis system. (Updated: 2026-10-15 22:09 JST)
📄 Primary Source
NFC Market Live
https://www.newyorkfed.org/medialibrary/media/survey/empire/empire2026/2026_10_empire-state-manufacturing-survey.pdf
A deep dive into the latest NY Fed Empire State Manufacturing Survey, with the AI extracting the key sub-indexes and trend changes.
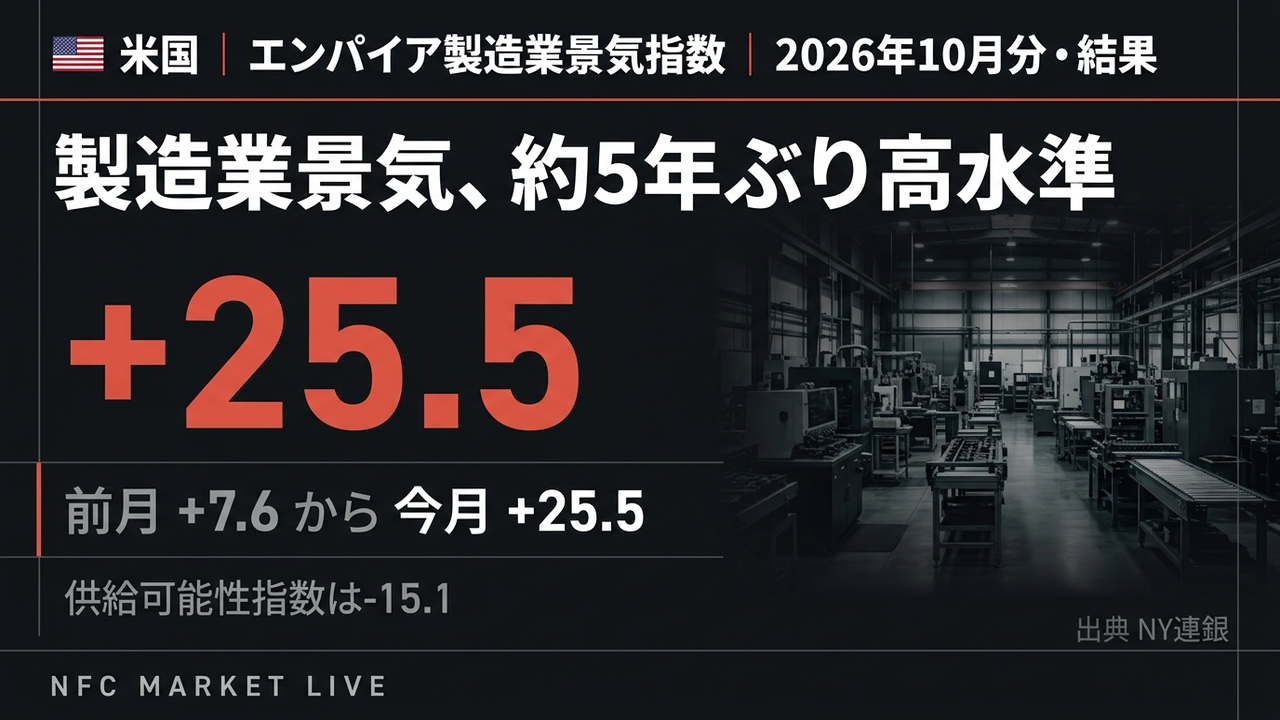
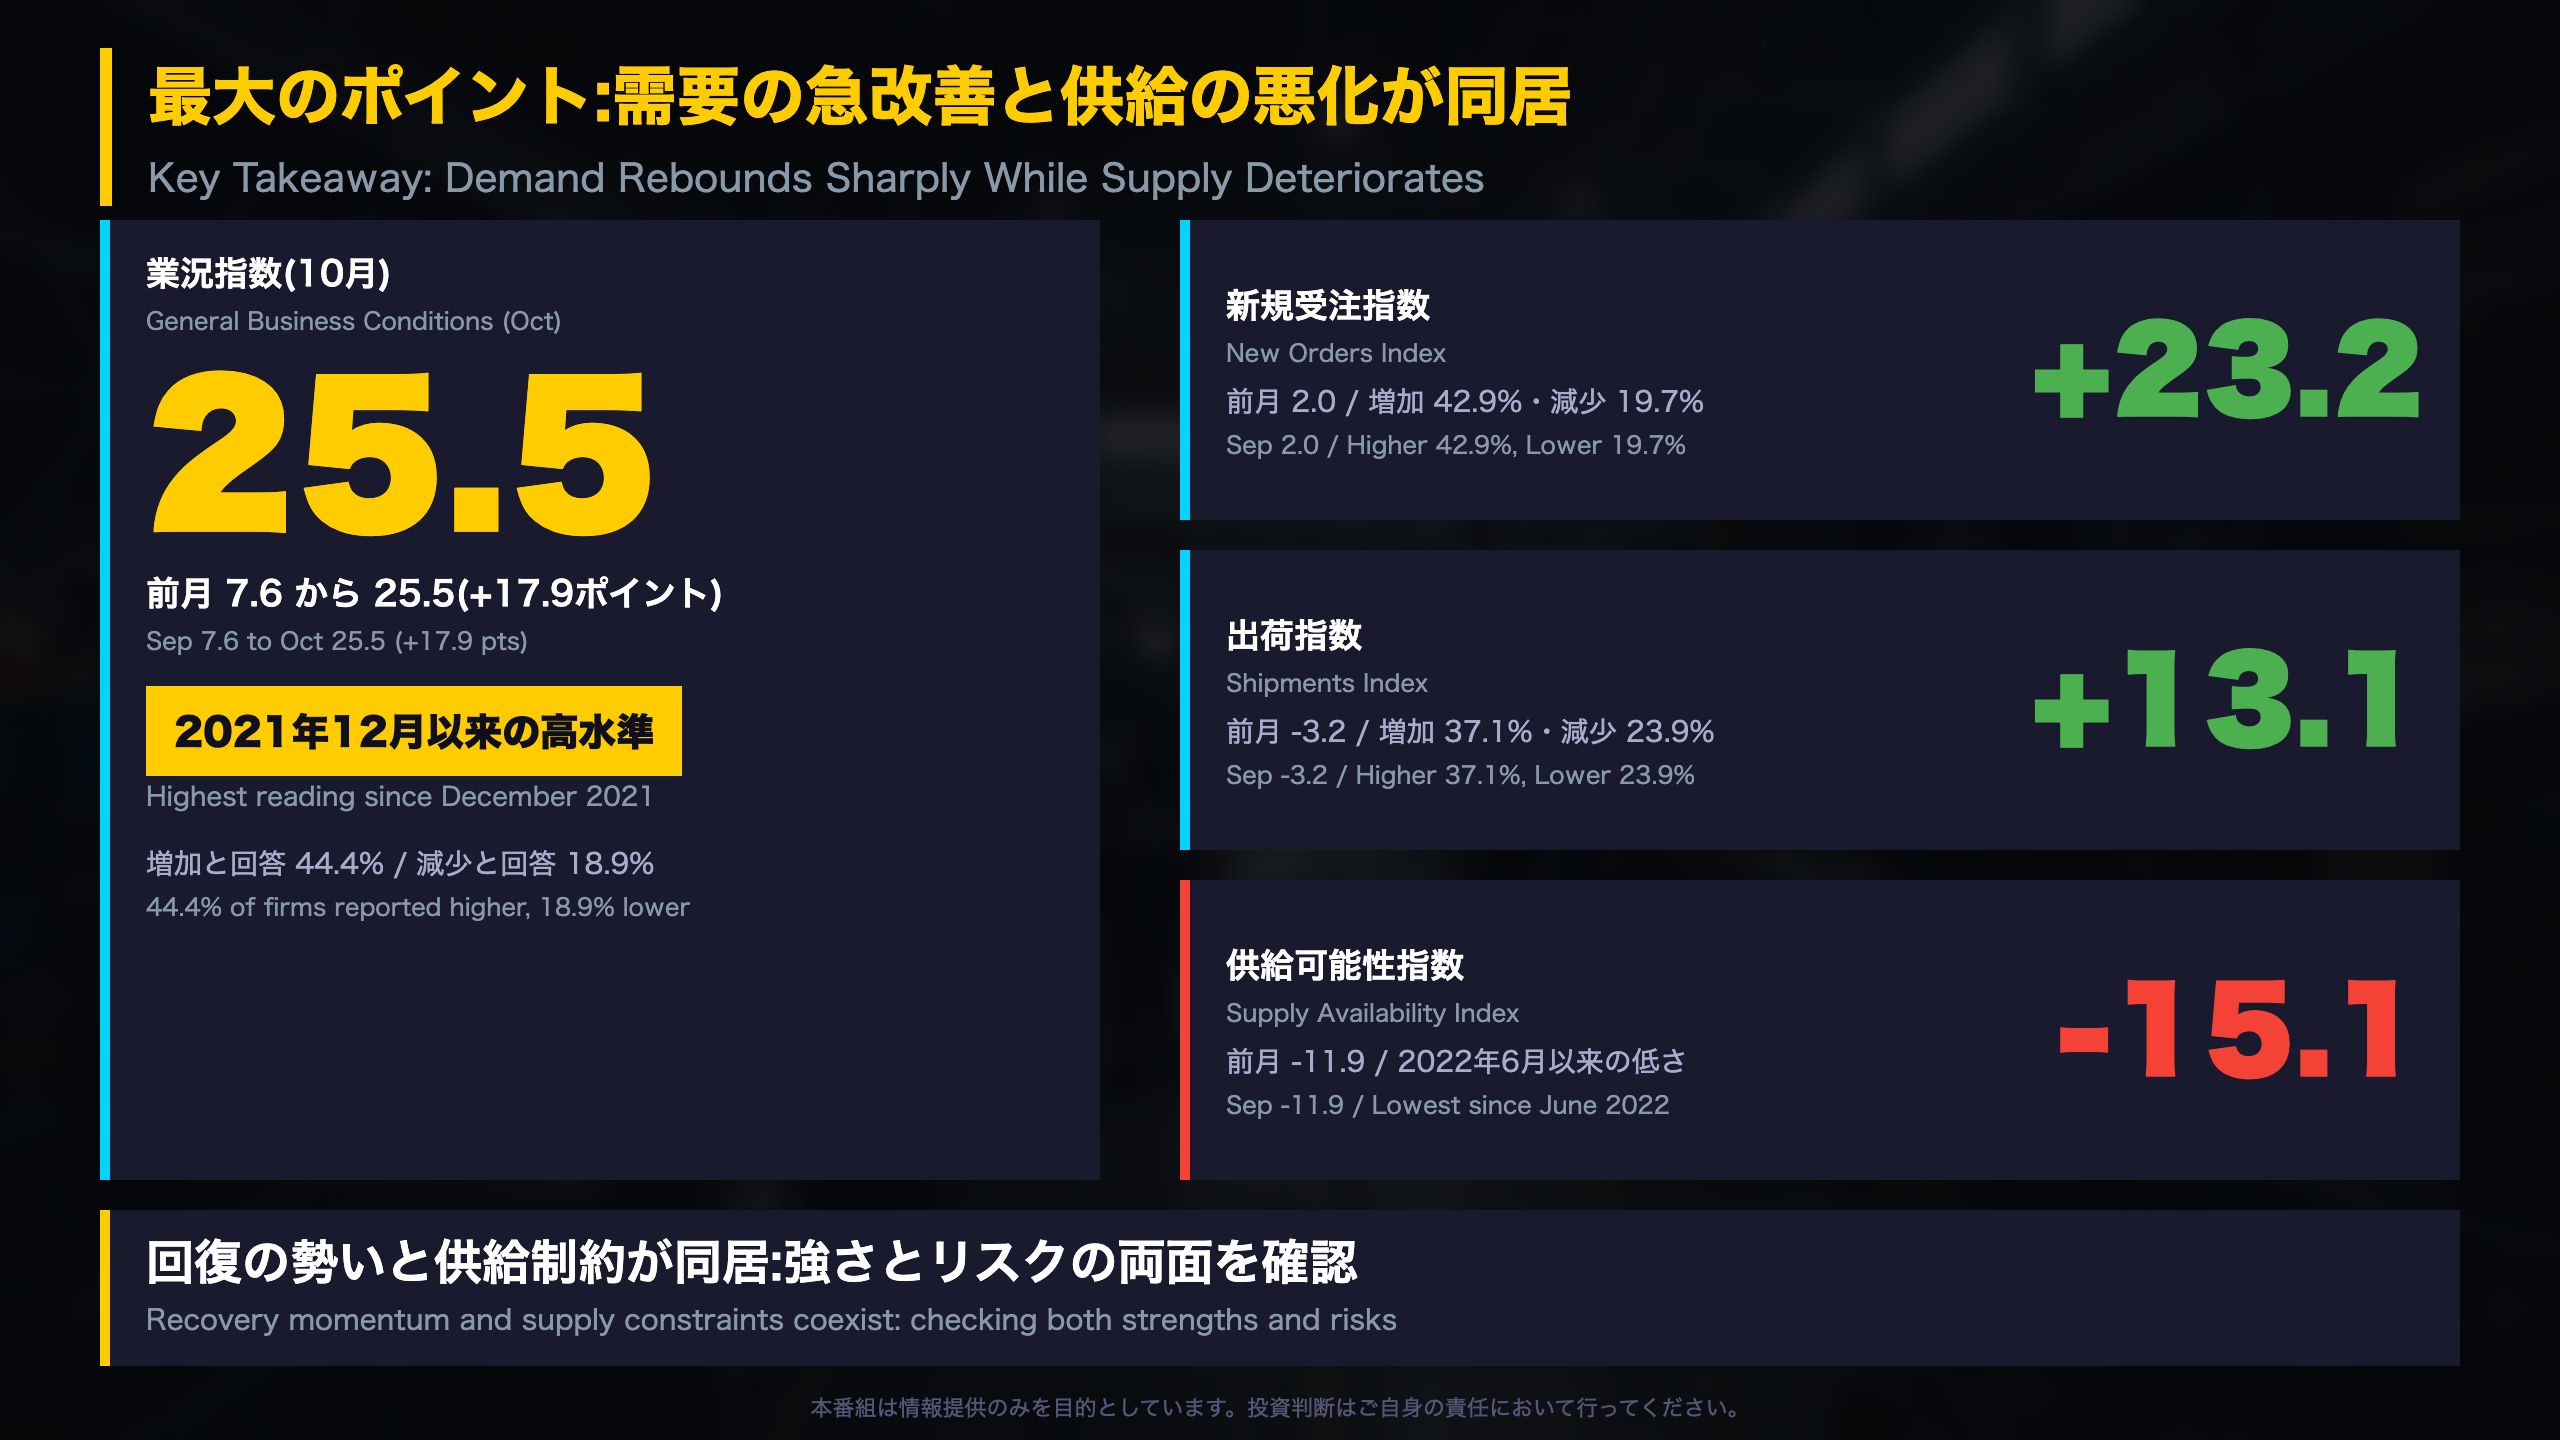
📊 The headline index rose 17.9 points to 25.5 from 7.6, the highest since December 2021.
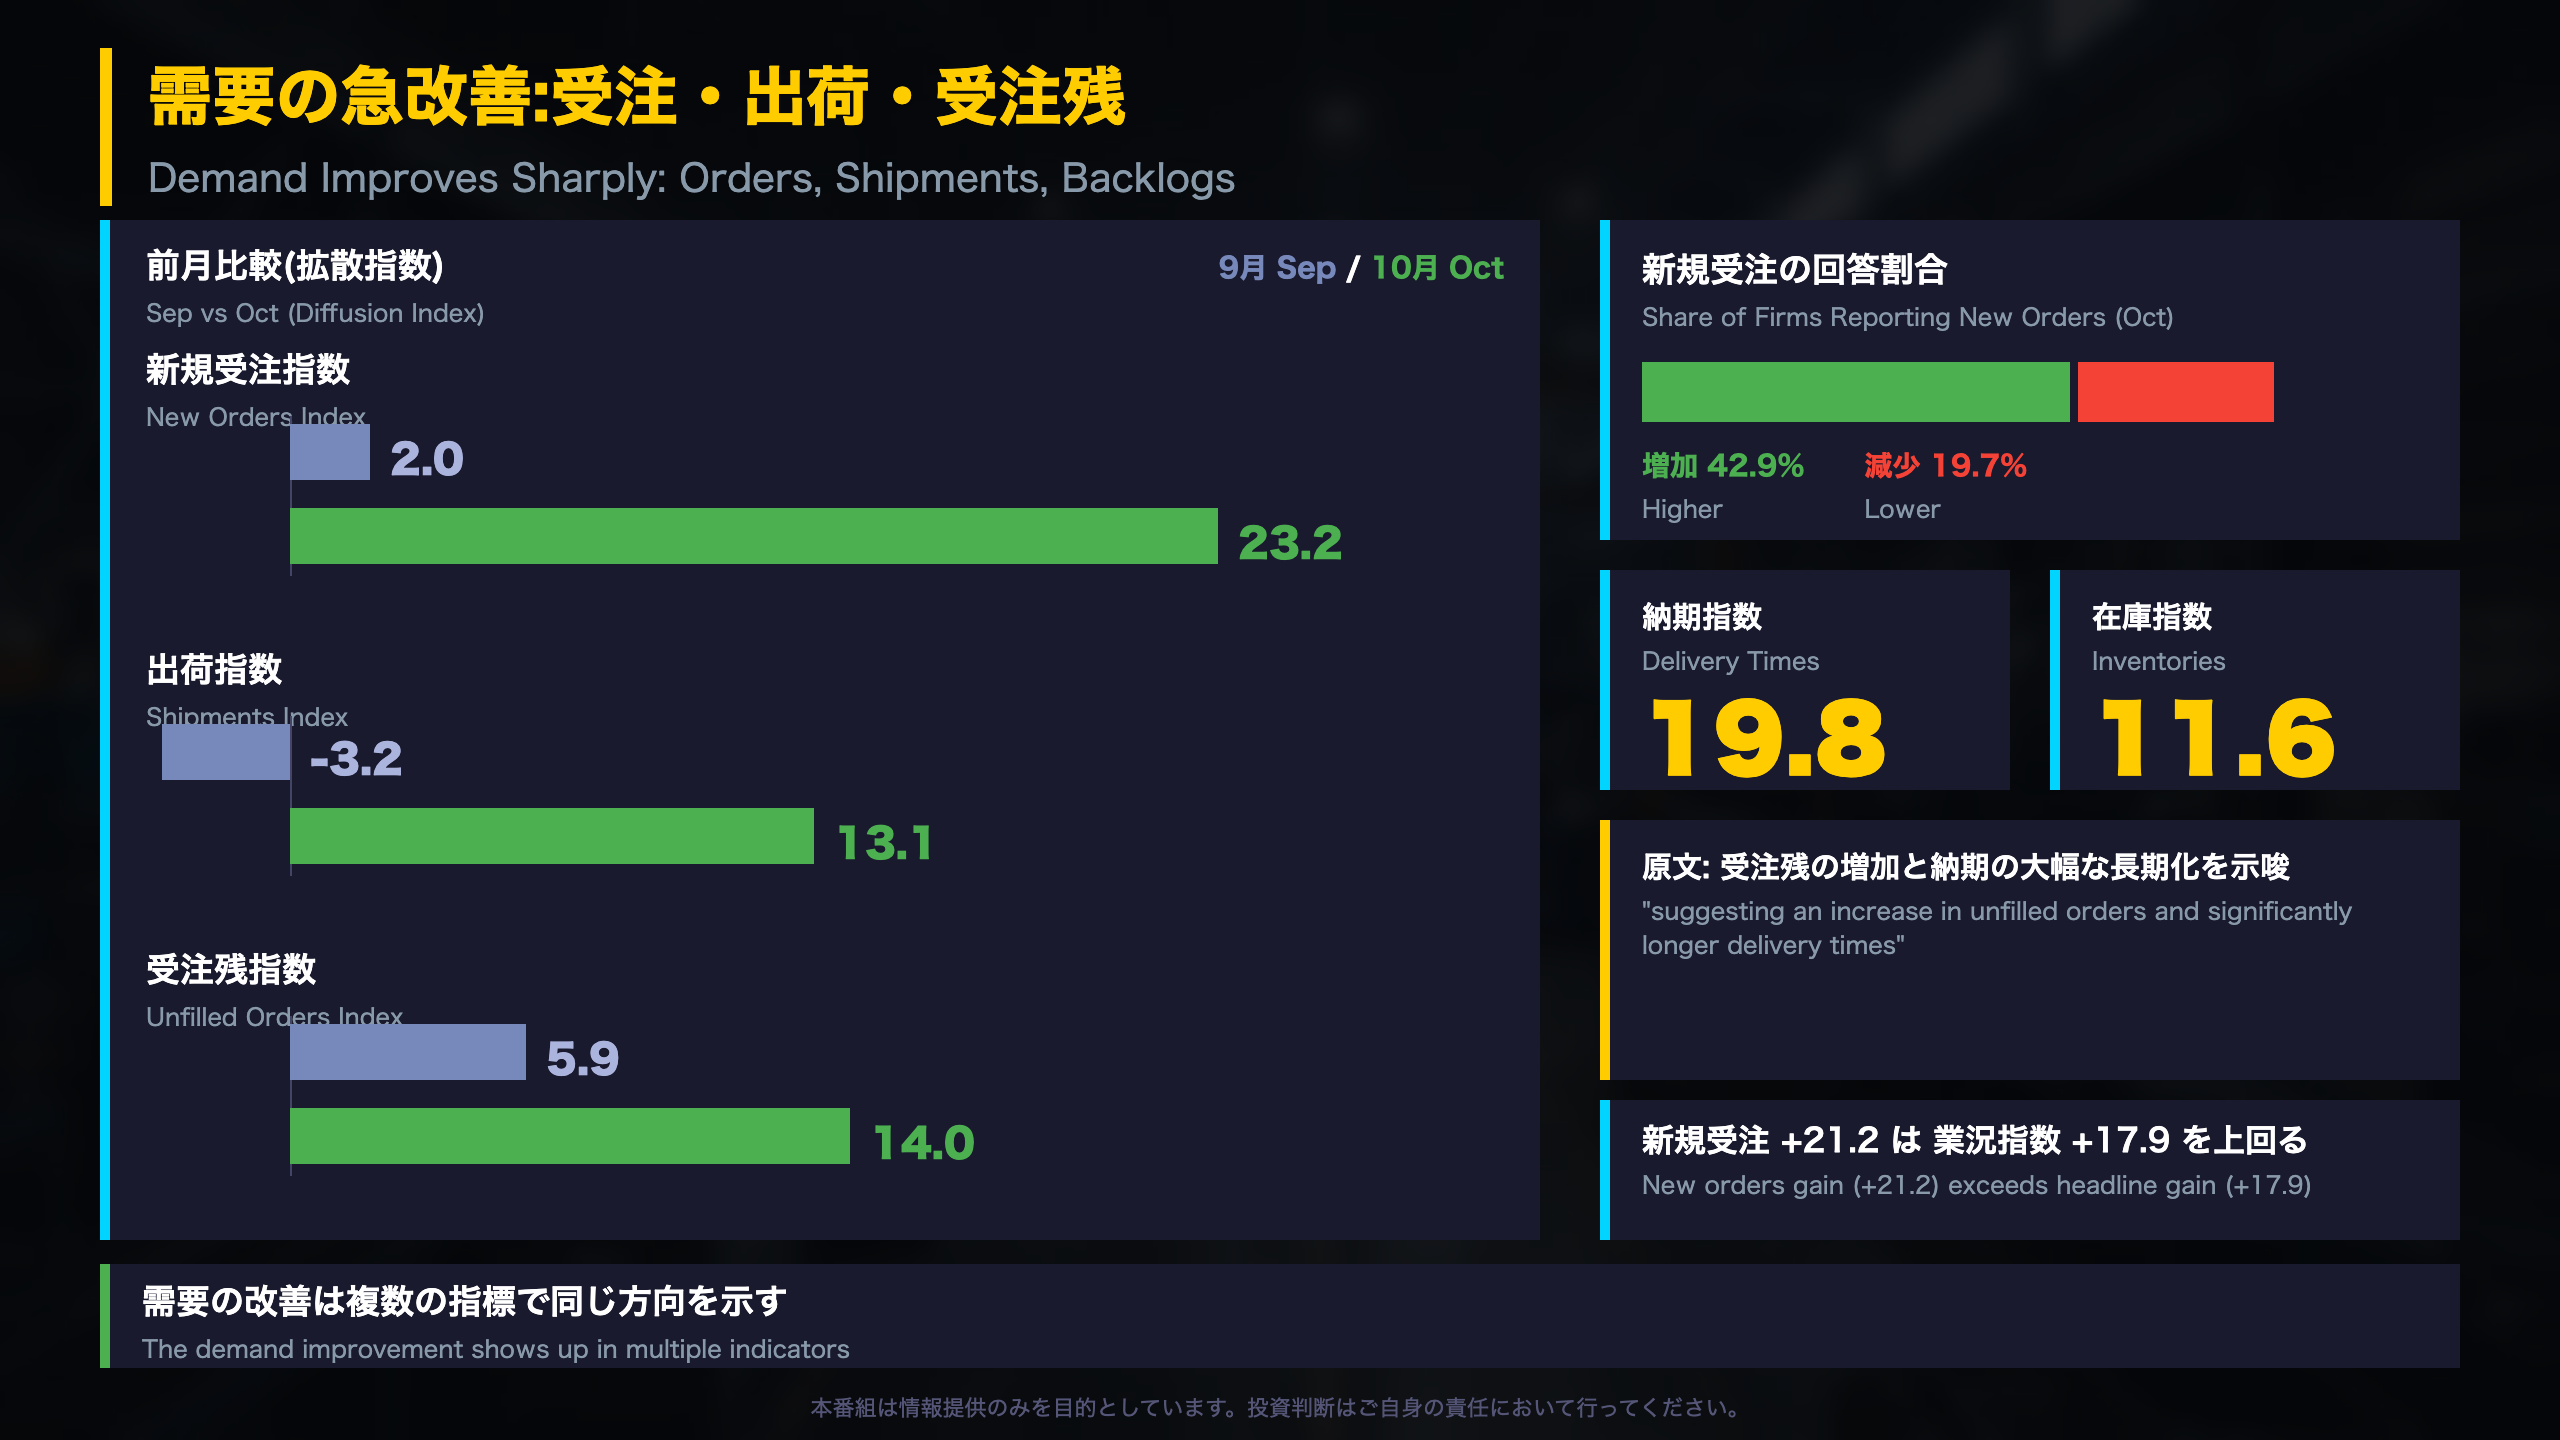
📈 New orders (23.2), shipments (13.1) and unfilled orders (14.0) all improved.
⚠️ Supply availability fell to -15.1, the lowest since June 2022, and prices paid stayed elevated at 59.5.
💡 The six-month outlook index eased to 21.0 from 29.0.
We review both the strengths and the risks, strictly within the published data.
最大のポイント:需要の急改善と供給の悪化が同居
The Empire State Survey in Context
The Empire State Manufacturing Survey is a monthly poll of manufacturers in New York State, run by the Federal Reserve Bank of New York. Because it is released early in the month, it is one of the first hard-to-ignore reads on US factory conditions, and it is often compared with other regional Fed surveys. Responses for this edition were collected between October 2 and October 9.
How to read the number
The headline is a diffusion index: the share of firms reporting better conditions minus the share reporting worse conditions. Zero is the neutral line, unlike the ISM manufacturing PMI, where 50 is the dividing point. In October, 44.4% of firms reported better conditions and 18.9% worse, giving +25.5. In September the split was 33.9% versus 26.3%, giving +7.6.
What stands out
- The 17.9-point gain brought the index to its highest level since December 2021.
- New orders (+21.2 points) and shipments (+16.3 points) rose by even more than the headline.
- Supply availability slipped to -15.1, its lowest since June 2022.
“New York State manufacturing activity rose sharply in October, with the headline index reaching its highest level in nearly five years.” – Richard Deitz, NY Fed
Two readings, one survey
The optimistic reading is that demand indicators are improving together. The cautious reading is that supply constraints and still-elevated price pressures coexist with that demand strength. Neither view requires a forecast: the survey itself shows both.
Limits
This is a single-month, regional, sentiment-based survey, so it describes the direction of responses rather than output volumes. The next releases will show whether the pattern persists.
需要の急改善:受注・出荷・受注残
Inside the Demand Side of the Survey
Breadth matters: the share of firms
A diffusion index can rise because many firms improve slightly or a few improve a lot, so the underlying split is worth checking:
| Indicator | Sep (higher / lower) | Oct (higher / lower) |
|---|---|---|
| New orders | 27.8% / 25.8% | 42.9% / 19.7% |
| Shipments | 28.7% / 32.0% | 37.1% / 23.9% |
| Unfilled orders | 16.8% / 10.9% | 26.7% / 12.8% |
In September more firms reported falling shipments than rising ones. In October that reversed, and the share of firms reporting higher new orders jumped by roughly 15 percentage points.
Delivery times and inventories
- The delivery times index edged up from 18.8 to 19.8. The survey says it points to “significantly longer delivery times.”
- The inventories index rose from 8.9 to 11.6.
The forward-looking readings
Six months ahead, expected new orders eased to 22.4 (from 25.3) while expected shipments ticked up to 26.2 (from 25.5). The expected unfilled orders index rose to 14.0 from 5.9. All stay in positive territory.
Why this is not a simple ‘strong demand’ story
Longer delivery times and rising backlogs can reflect strong orders, but they can also reflect bottlenecks in supply. The survey text cannot separate the two, so a balanced reading keeps both possibilities open. Compare with the ISM-style PMIs, where supplier deliveries are likewise treated as a signal that can mix demand and supply effects.
The next survey will show whether new orders and shipments keep moving together.
供給制約と価格:強さの裏側
Supply and Prices: The Other Side of the Strong Headline
A short series, a notable low
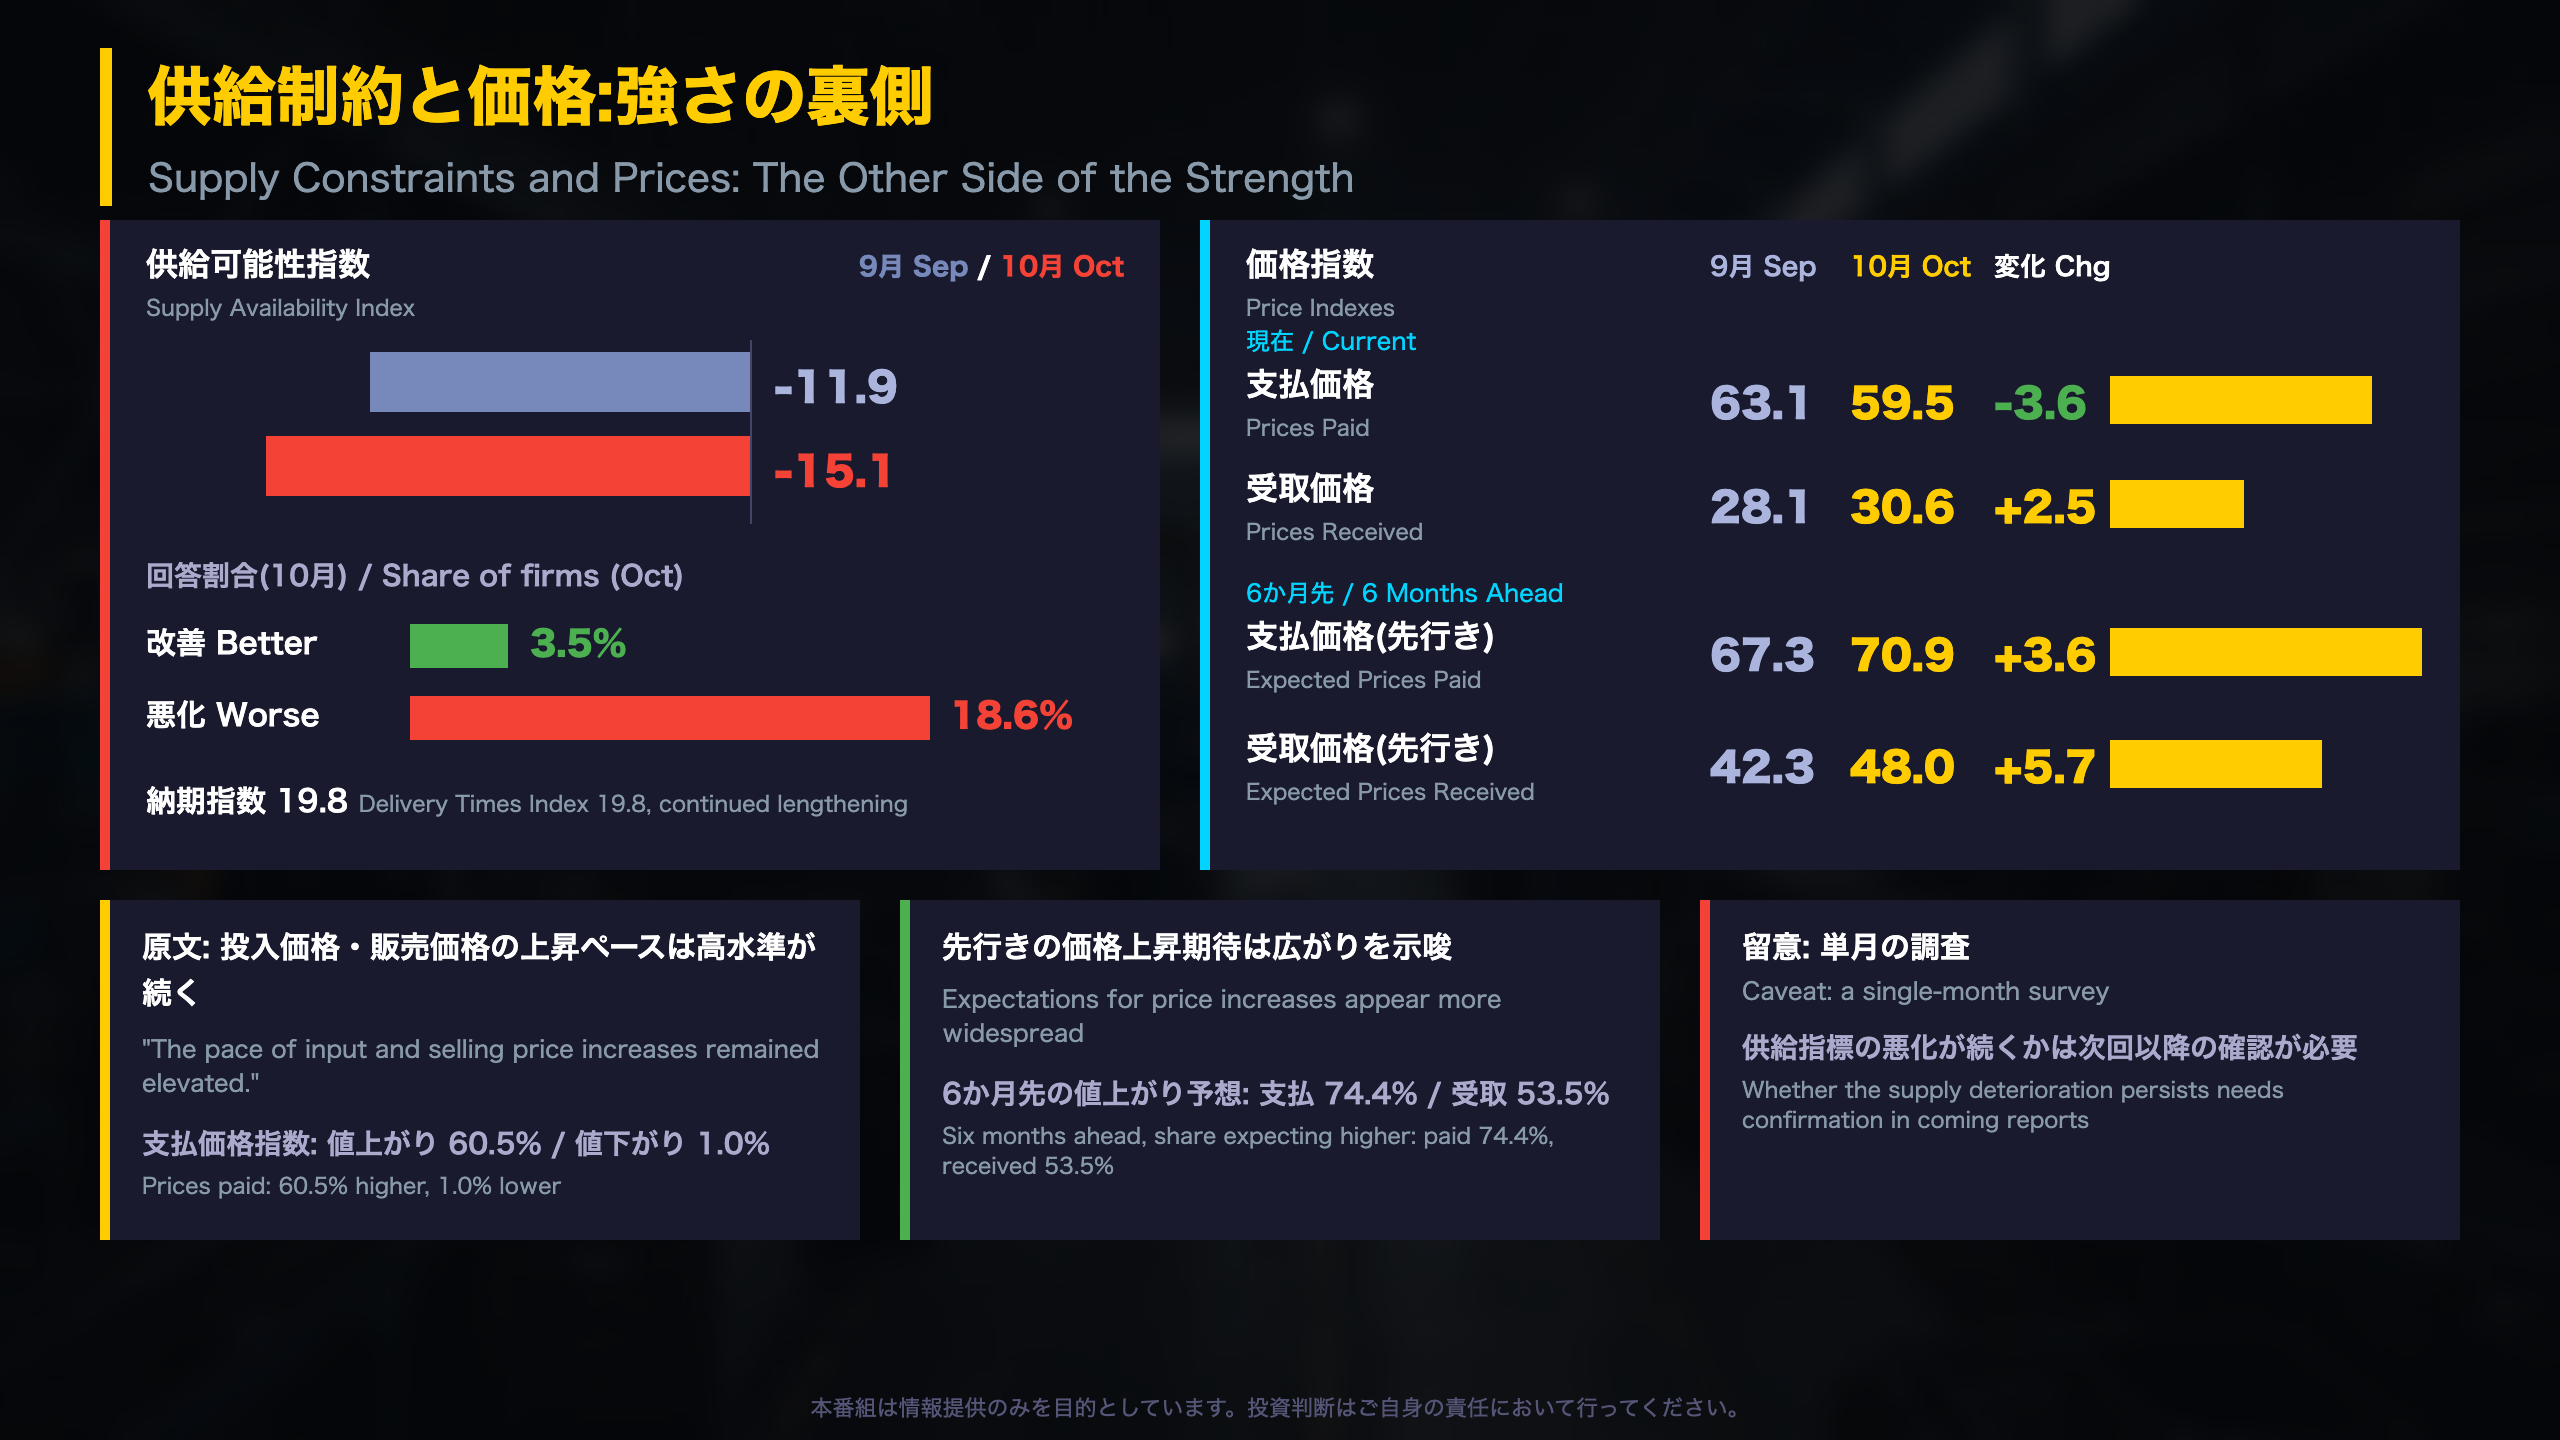
The supply availability index was added to the Empire State report in June 2024, with history provided back to 2021. It moved from -11.9 to -15.1, the lowest since June 2022. Of the firms surveyed, 18.6% reported worse availability versus 3.5% reporting better. The six-month-ahead version also weakened, to -11.6 from -8.9. Because the series is relatively short, the ‘lowest since’ comparison covers a limited window.
Price pressures: easing at the margin, still broad
| Measure | Sep | Oct |
|---|---|---|
| Prices paid | 63.1 | 59.5 |
| Prices received | 28.1 | 30.6 |
| Expected prices paid (6M) | 67.3 | 70.9 |
| Expected prices received (6M) | 42.3 | 48.0 |
Even after falling 3.6 points, prices paid is near the top of its recent range: 60.5% of firms reported paying more, and only 1.0% less. On the expectations side, 74.4% expect to pay more and 53.5% expect to receive more.
International and policy context
Unlike US CPI, which measures consumer prices, these are survey-based input and output price diffusion indexes for manufacturers. They describe how widespread price increases are, not how large they are. They are best compared with the ‘prices paid’ components of ISM-type surveys rather than with headline inflation data.
Balanced reading
The dip in prices paid is a modest positive. The rise in both expected price indexes and the weaker supply readings are cautionary. The survey does not tell us whether the supply deterioration is persistent, so the next releases matter.
雇用と先行き期待:楽観はやや後退
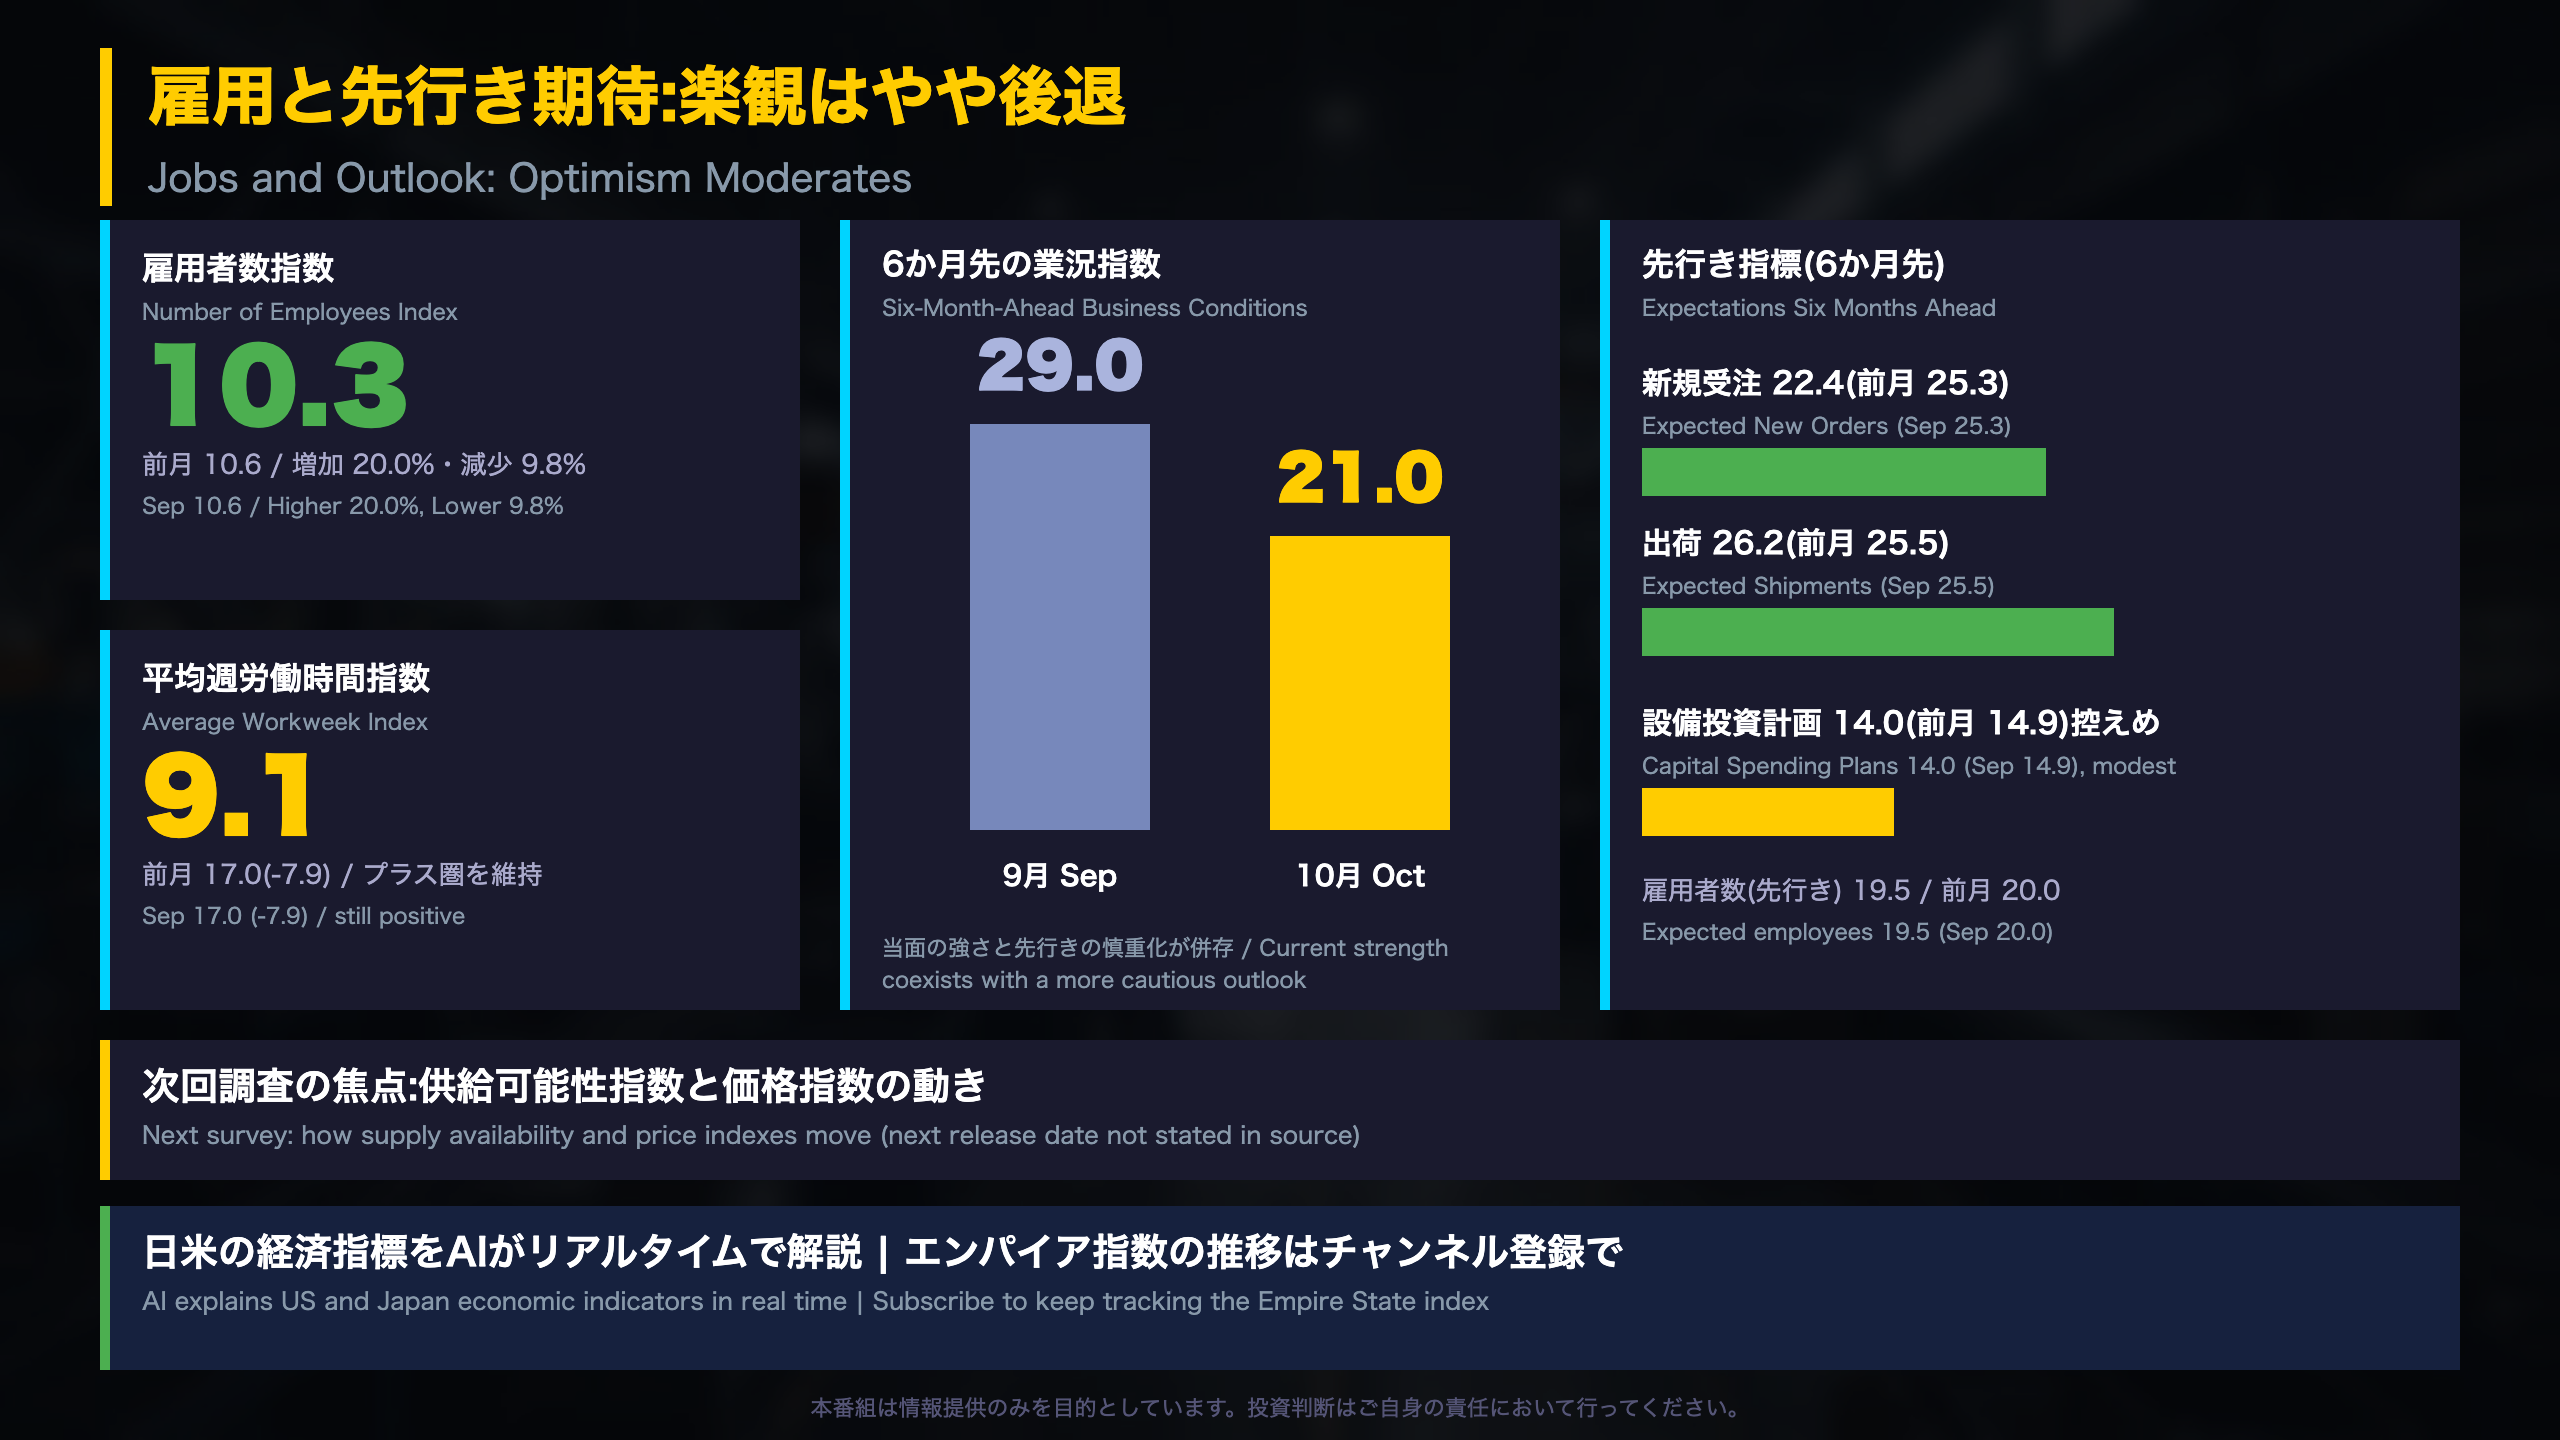
Jobs, Hours and the Six-Month Outlook
Current labor readings
The employment index held steady at 10.3 (September: 10.6), with 20.0% of firms reporting higher headcount and 9.8% lower. The average workweek index fell to 9.1 from 17.0 as the share reporting longer hours dropped from 23.8% to 17.1%. The survey describes this as “ongoing modest growth in employment and an increase in hours worked,” so the signal is steady rather than accelerating.
Expectations six months ahead
| Indicator | Sep | Oct |
|---|---|---|
| General business conditions | 29.0 | 21.0 |
| New orders | 25.3 | 22.4 |
| Shipments | 25.5 | 26.2 |
| Employees | 20.0 | 19.5 |
| Capital expenditures | 14.9 | 14.0 |
The survey says firms still expect conditions to improve, “though they are not as optimistic as in recent months.” Capital spending plans are described as modest. The technology spending index was discontinued when the report was revised in June 2024.
How this differs from hard data
These are survey-based sentiment gauges for New York State manufacturers. They are not payrolls or industrial production, so they should be read alongside official activity data rather than in place of it. Within this report, the contrast is clear: current conditions jumped, while forward-looking sentiment cooled from a higher base.
Balanced takeaway
Strong current orders and shipments sit next to a more measured outlook and unchanged hiring momentum. Neither the optimistic nor the cautious reading dominates the survey itself.
What to watch
The next survey will show whether supply availability and price indexes keep moving as they did this month, and whether the outlook index stabilizes. The next release date is not stated in the source text.
Disclaimer: This article is for informational purposes only. All investment decisions are made solely at your own risk.