📺 Watch the Full Video Analysis
This article was automatically generated by the NFC Market Live AI analysis system. (Updated: 2026-10-16 22:30 JST)
📄 Primary Source
Federal Reserve
https://www.federalreserve.gov/releases/g17/current/g17.pdf
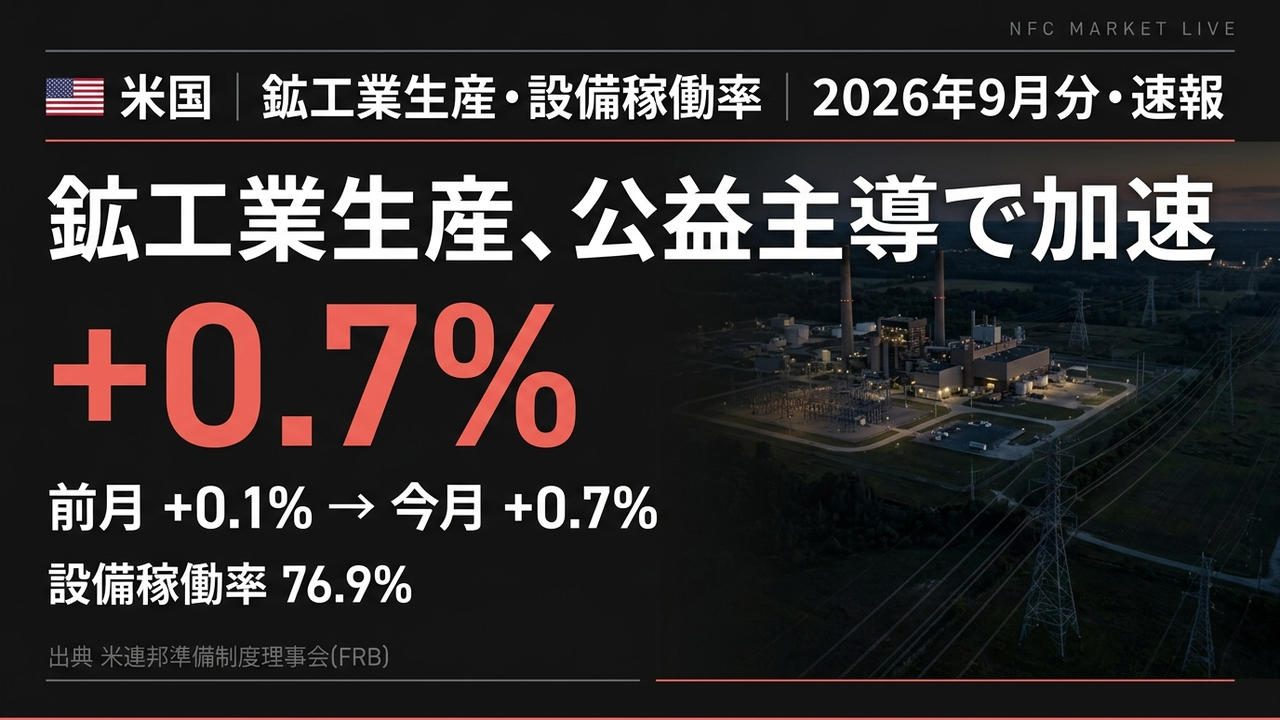
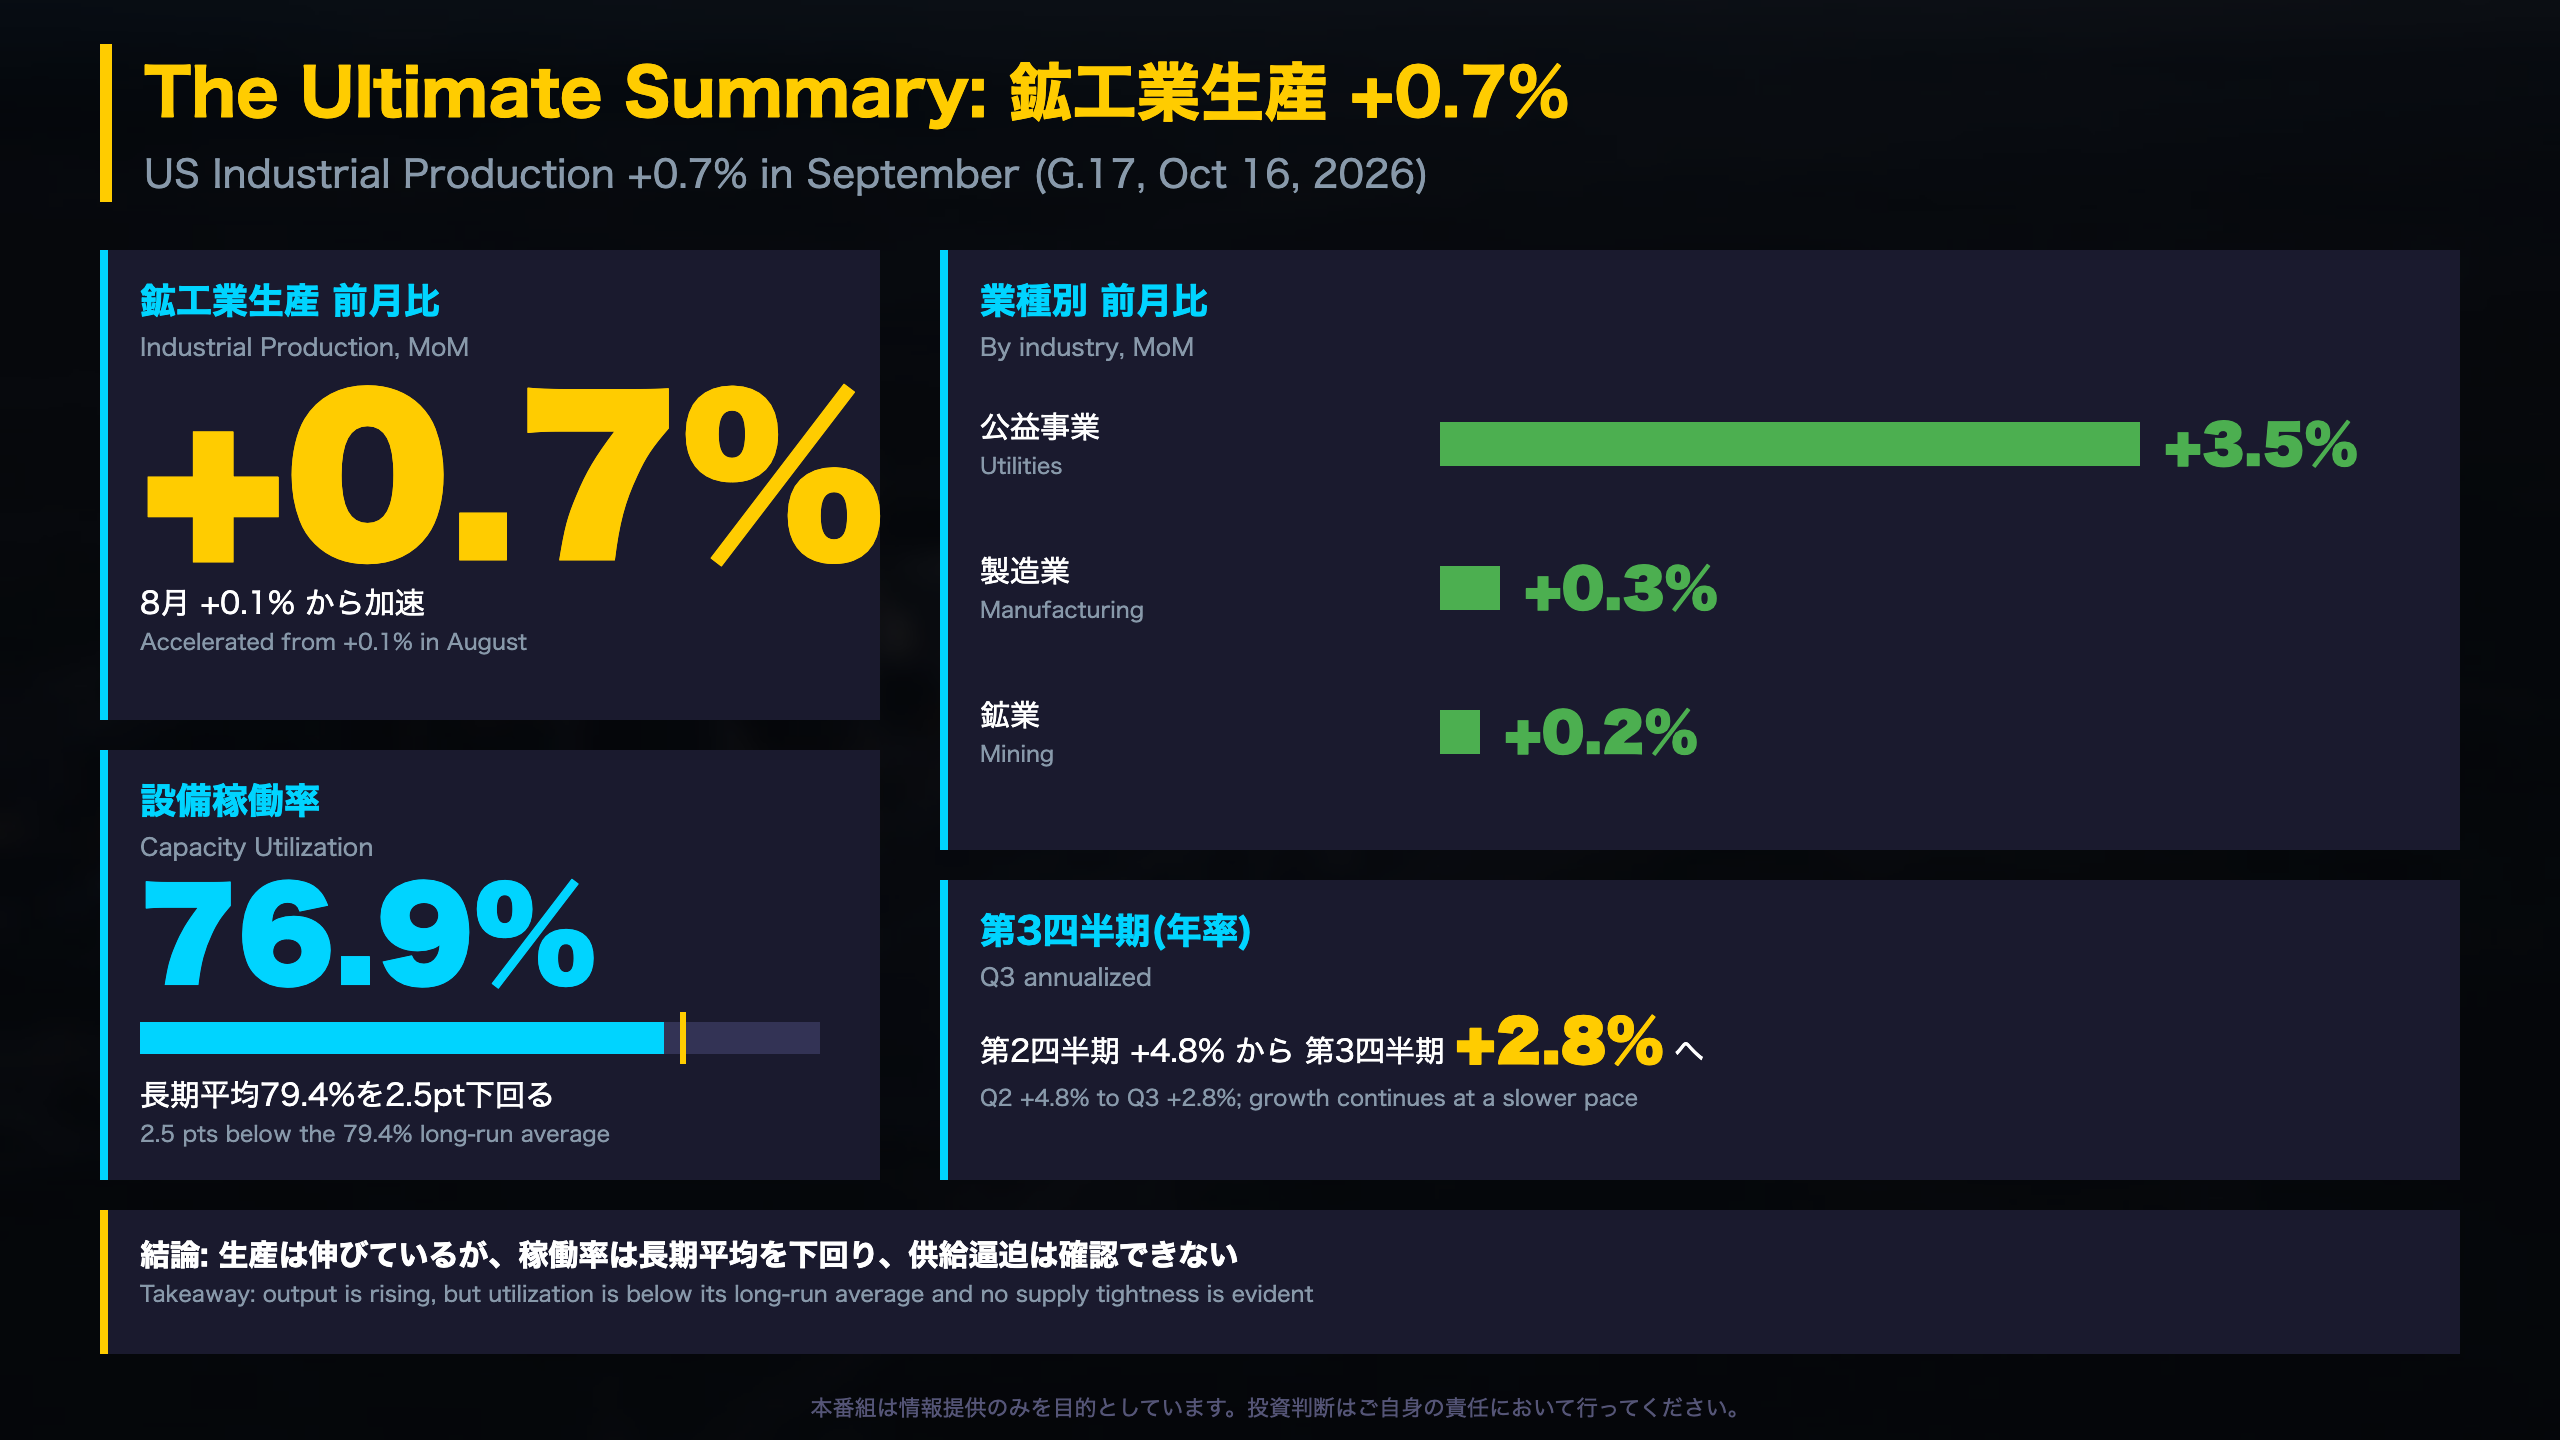
📊 The Fed’s G.17 release on Oct 16 shows US industrial production up 0.7% in September, with capacity utilization rising to 76.9%.
📈 Utilities (+3.5%) led the gain, while manufacturing rose 0.3% and mining 0.2%. Q3 output grew 2.8% annualized.
⚠️ Utilization remains 2.5 pts below its 79.4% long-run average, so the data show no clear sign of supply tightness. Motor vehicles and parts fell 3.0%.
💡 Semiconductors and related components surged 28.4% annualized in Q3, highlighting uneven strength across industries.
🗓 Next release: Nov 17 (October data); annual revision on Nov 24.
The Ultimate Summary: 鉱工業生産+0.7%、牽引は公益事業
Where this release fits
The G.17 release is published by the Federal Reserve Board and measures real output in manufacturing, mining, and electric and gas utilities. It is a hard-data counterpart to survey gauges such as the ISM manufacturing index, which track sentiment rather than physical output.
The headline
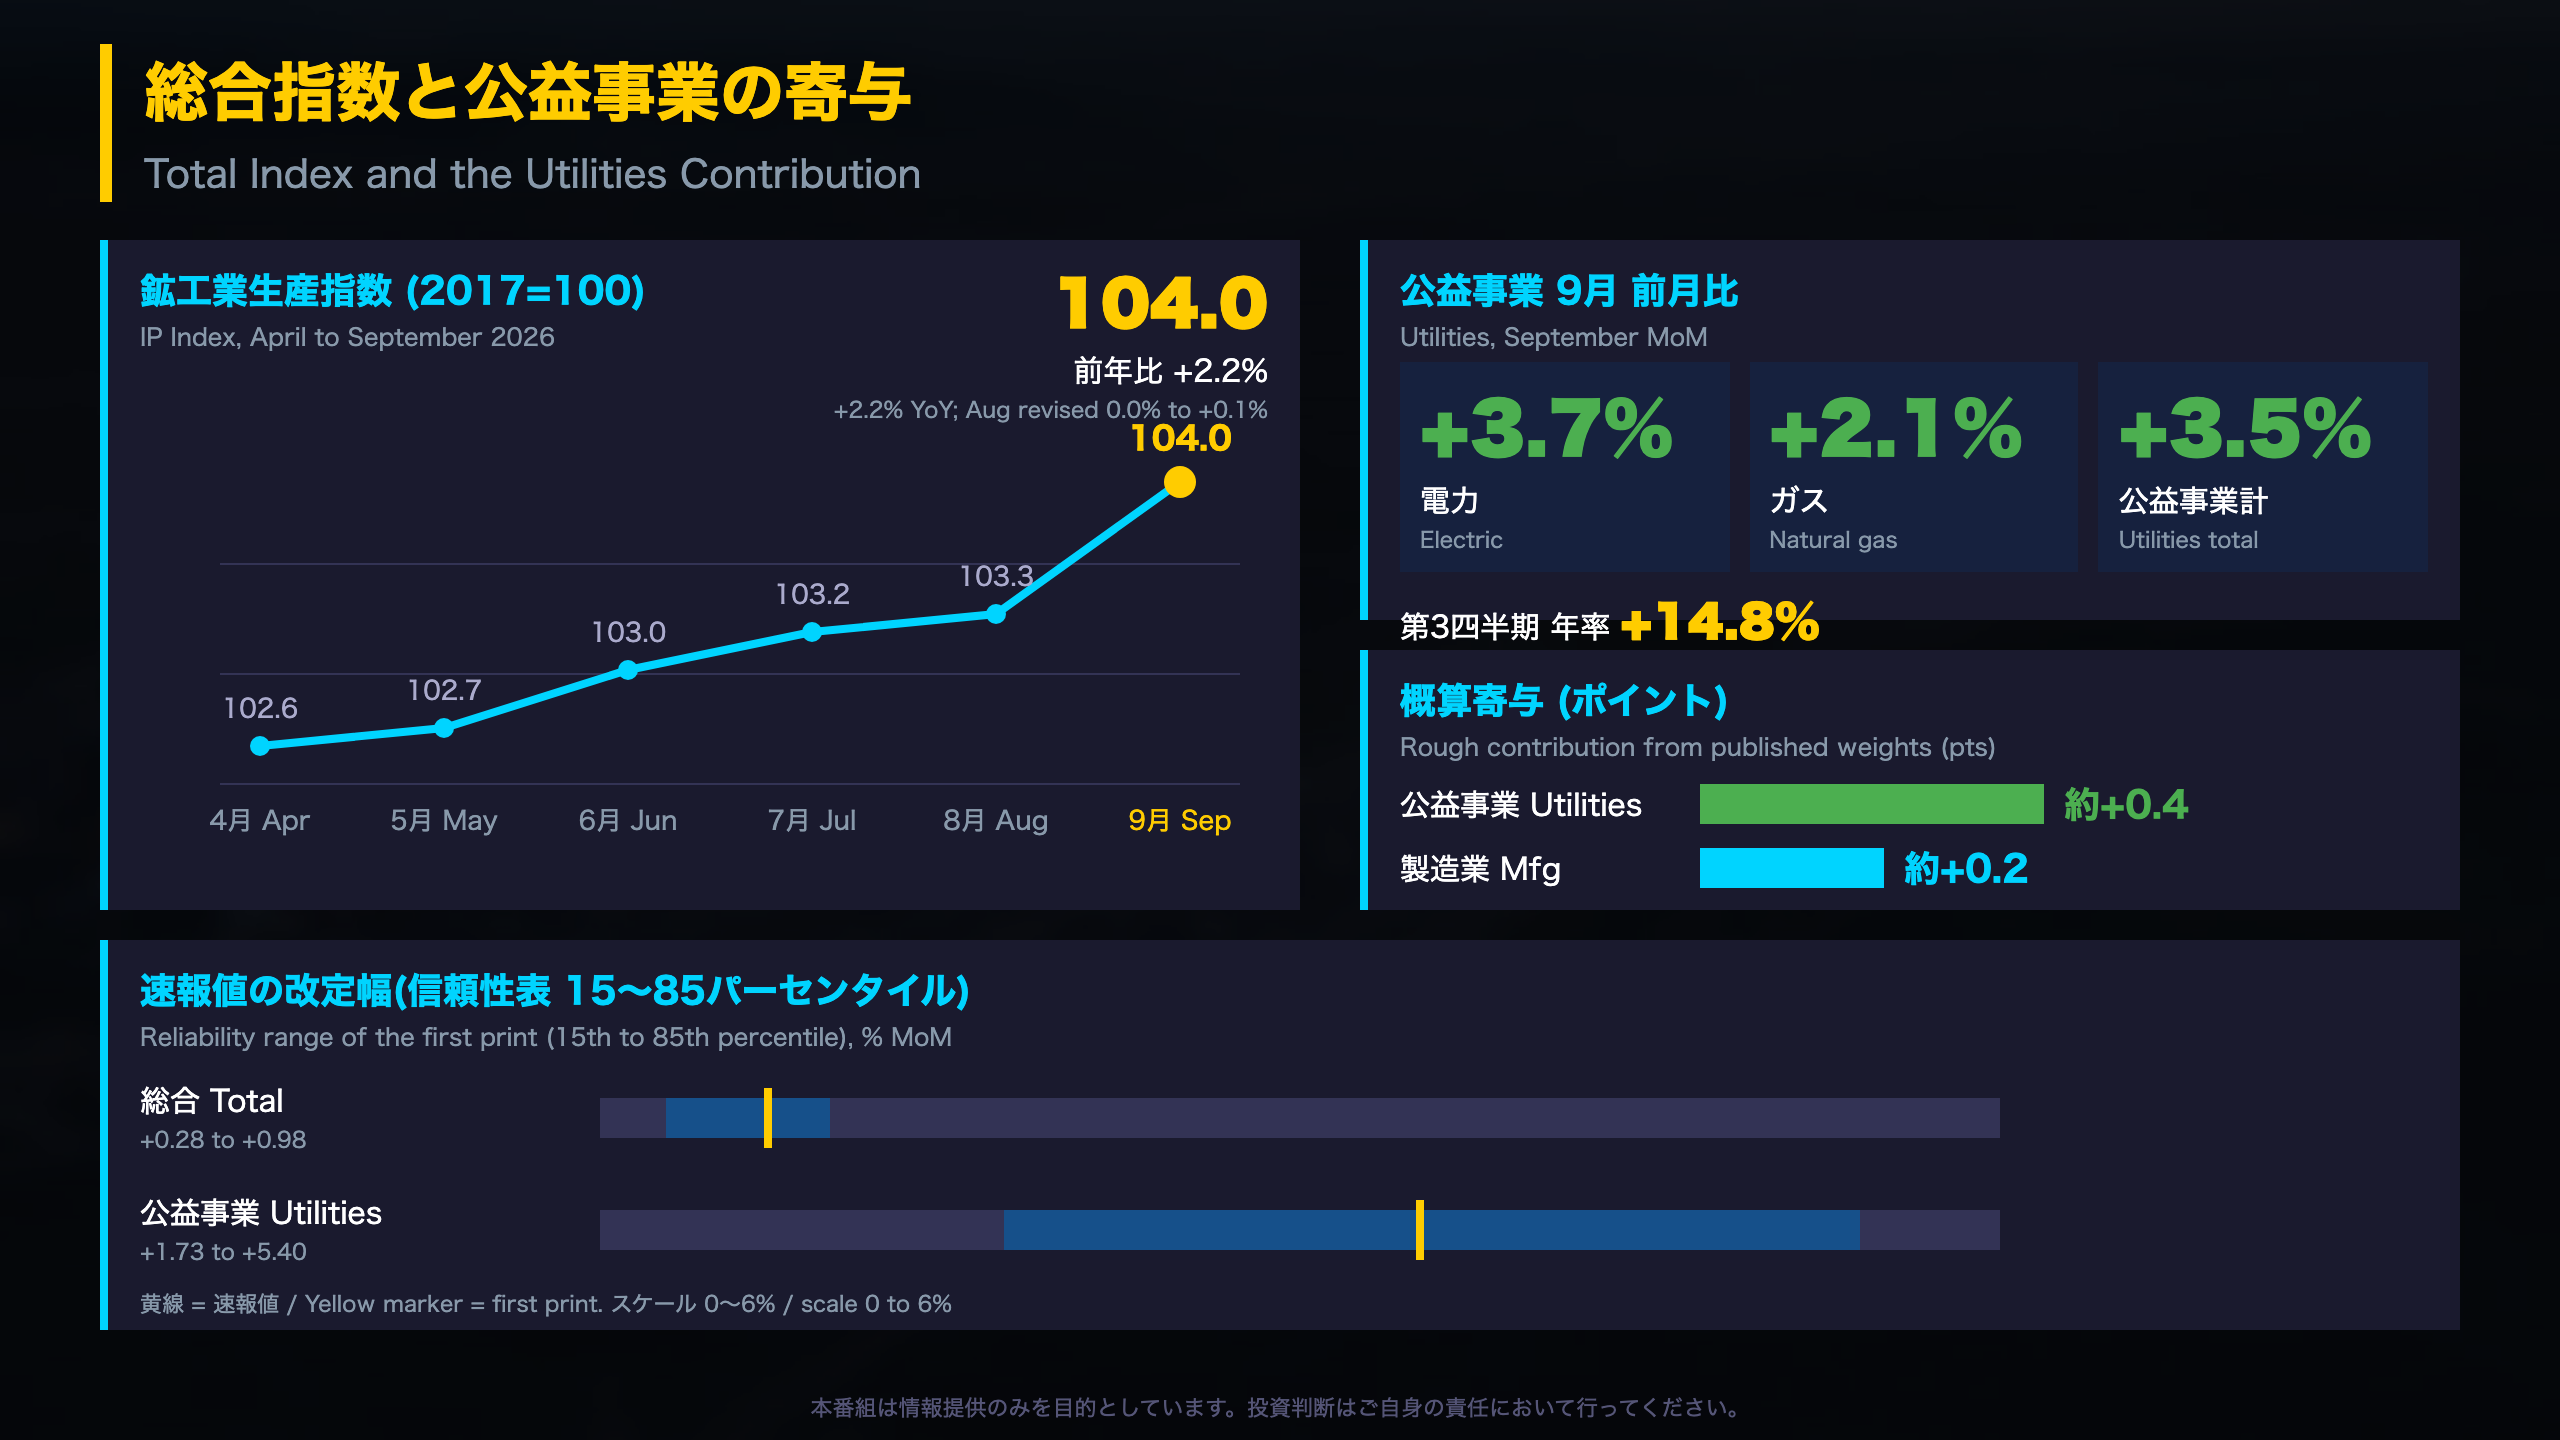
Industrial production (IP) rose 0.7% in September after +0.1% in August, lifting the index to 104.0 (2017=100), the highest reading in 2026 so far. Capacity utilization climbed to 76.9%.
Strength and weakness side by side
- Resilience: IP is up 2.2% from a year earlier; business equipment output is up 6.7% year over year; Q3 output grew at a 2.8% annual rate.
- Caveats: Utilities (+3.5%) did most of the lifting while manufacturing gained only 0.3%. Q3 growth is slower than Q2’s revised 4.8% annualized pace.
“Industrial production (IP) increased 0.7 percent in September after edging up 0.1 percent in August.” – Federal Reserve G.17
Why capacity utilization matters
Utilization compares output with sustainable maximum capacity. At 76.9%, it remains 2.5 points below the 1972-2025 average of 79.4%, which means the release does not show the kind of capacity strain typically associated with supply-driven price pressure. That is a reading of the data, not a forecast.
What the release does not say
G.17 contains no commentary on monetary policy or the dollar. This program therefore sticks to what the source supports: a gradual manufacturing recovery with uneven sector strength.
総合指数と公益事業の寄与
Reading the utilities jump
In the G.17 report, utilities cover electric and natural gas providers. Their index moved from 111.7 in July to 113.3 in August and 117.3 in September. Electric output rose 3.7% and natural gas 2.1% in September. The release does not state a cause, so any weather explanation would be speculation.
A rough contribution estimate
The Fed publishes relative weights: manufacturing 75.89%, mining 11.71%, utilities 12.40%. Multiplying weight by monthly change gives roughly +0.43 points from utilities, +0.23 from manufacturing, and +0.02 from mining, consistent with the +0.7% total. This is an approximation, not a Fed-published decomposition.
How firm is a first print?
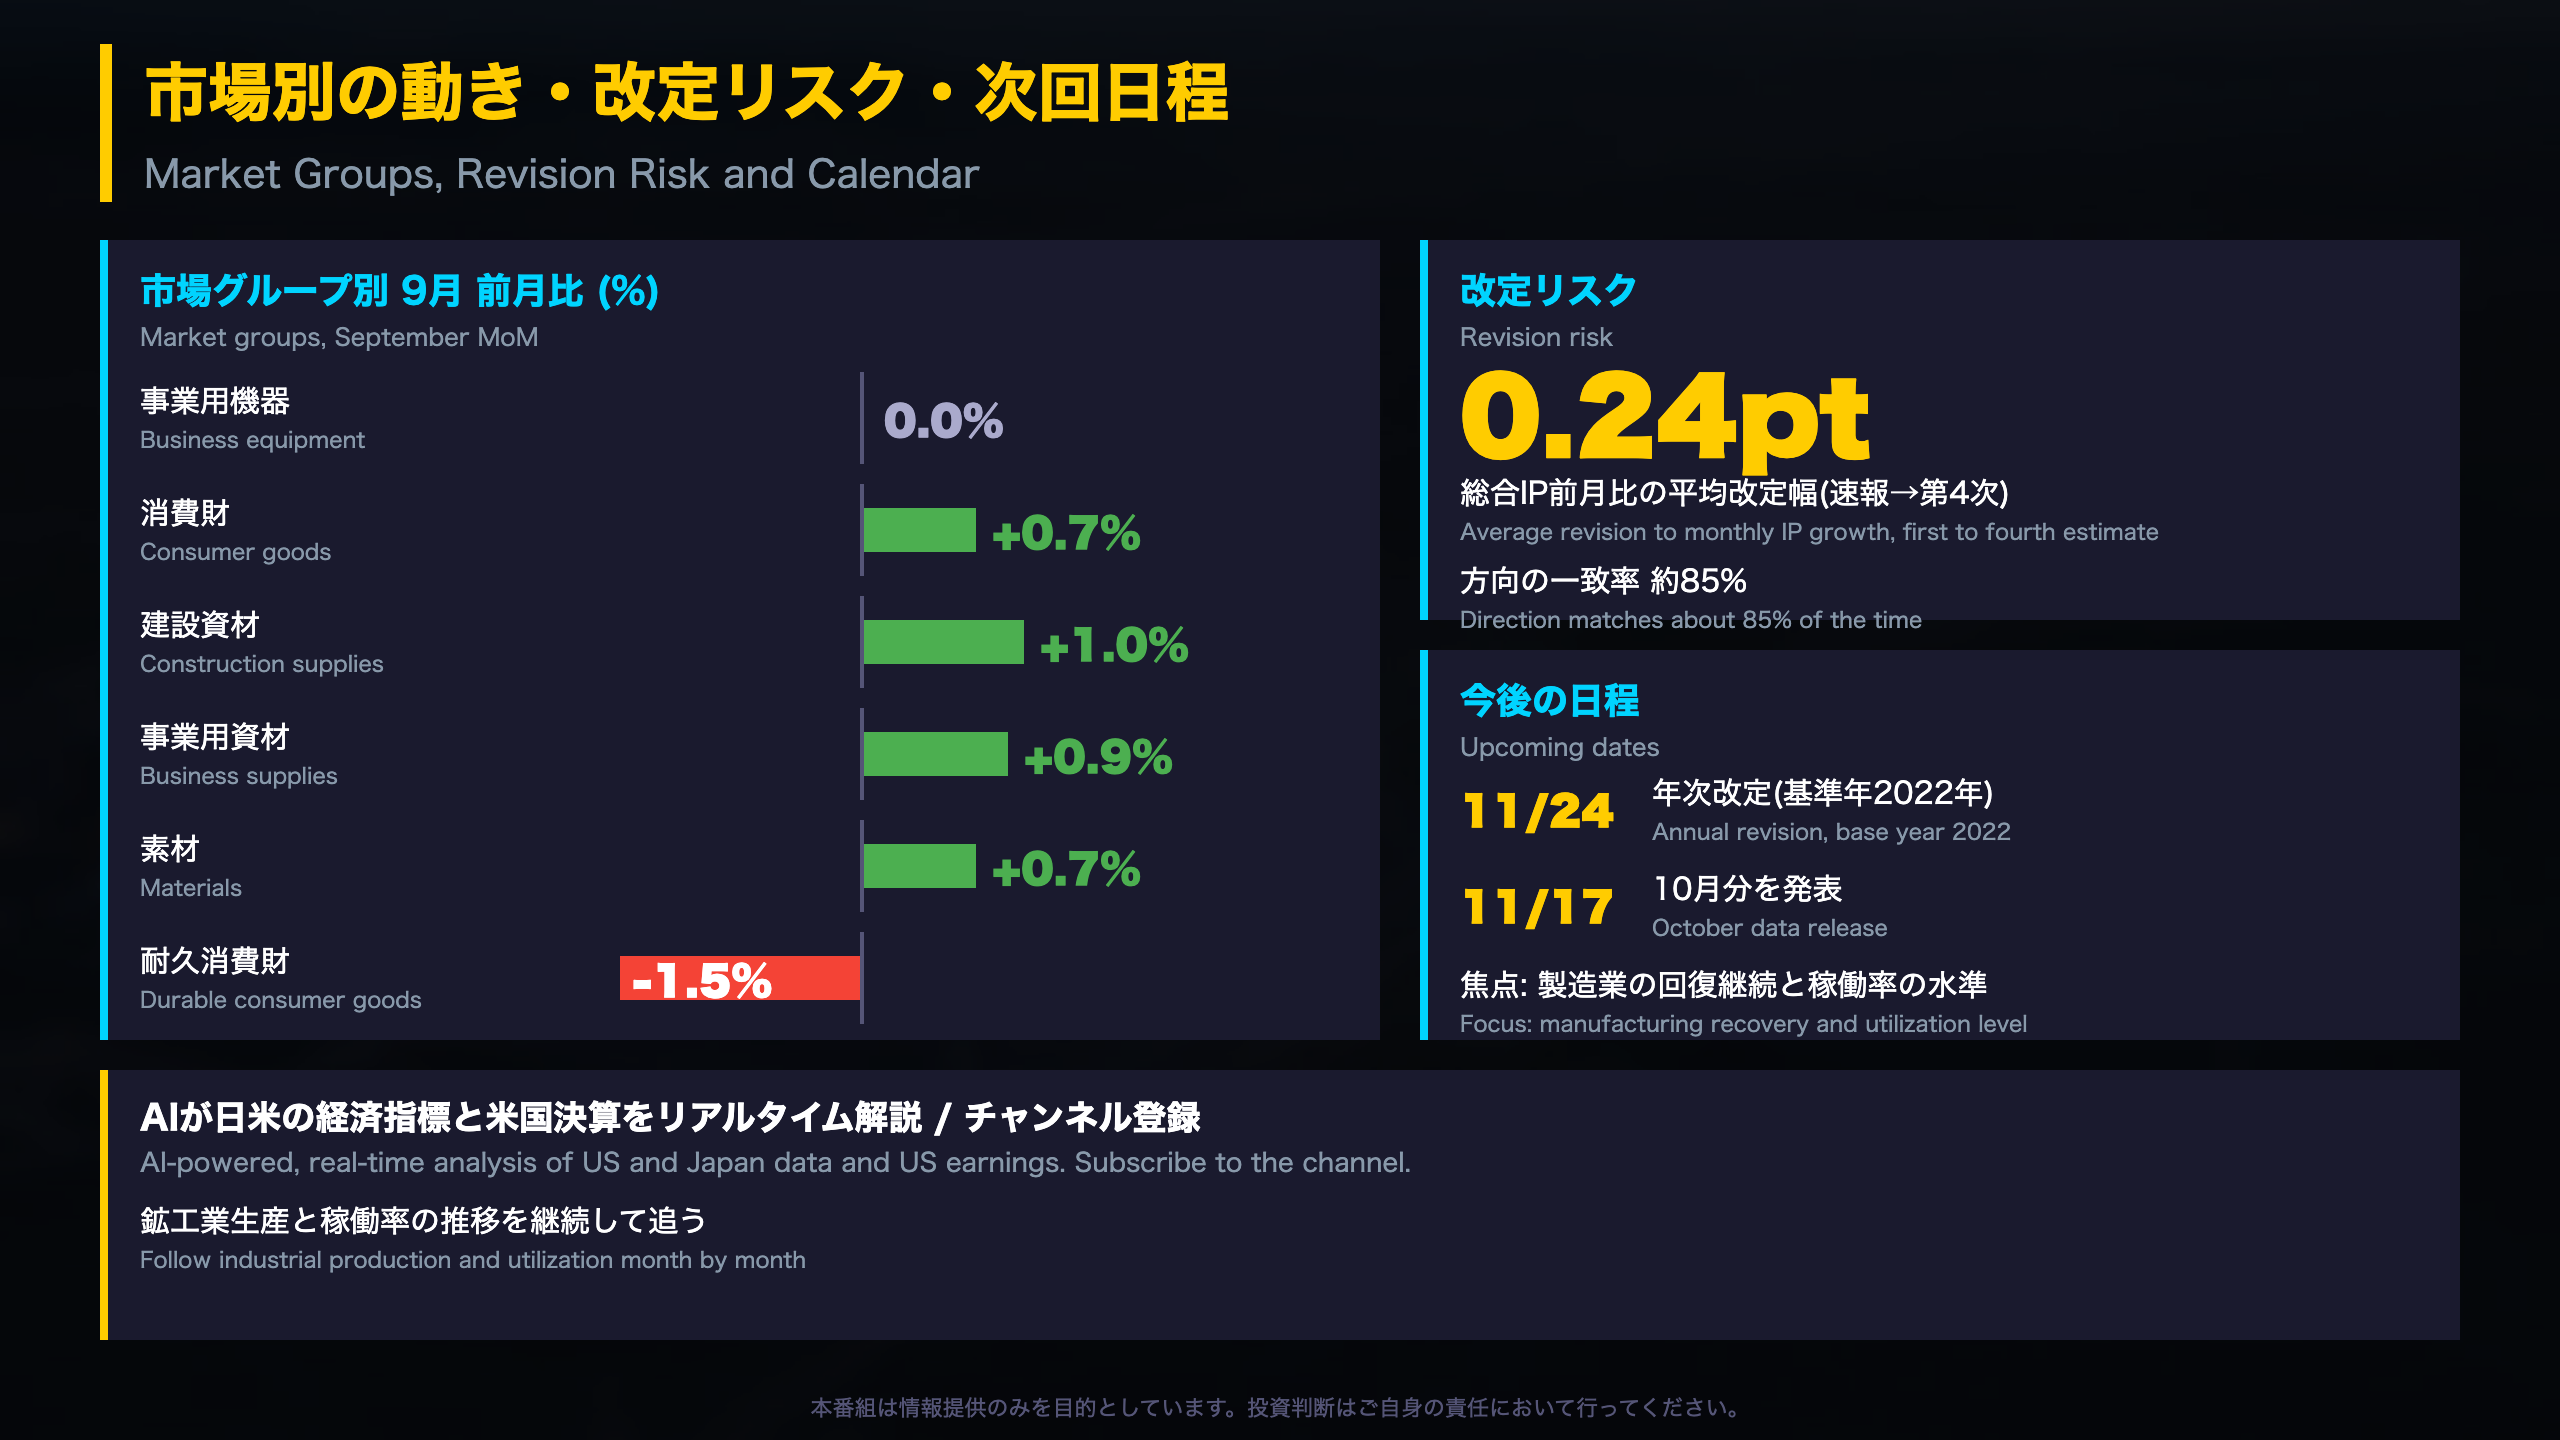
The Fed’s reliability table gives 15th-to-85th percentile ranges for the final revised value: total IP +0.28% to +0.98%, utilities +1.73% to +5.40%. The average absolute revision to total IP monthly growth between first and fourth estimates is 0.24 percentage point (1987-2025). By comparison, the US CPI is not revised after release, whereas G.17 routinely is, so users should treat first prints as provisional.
“In most cases (about 85 percent), the direction of the change in output indicated by the first estimate for a given month is the same as that shown by the fourth estimate.”
What to watch
The October data on Nov 17 will show how much September is revised. A large downward revision to utilities would change the composition story; an upward one would reinforce it. The Fed also schedules an annual revision for Nov 24, which can alter history back to 1972.
製造業の内訳: 自動車の弱さと半導体の突出
Inside the manufacturing numbers
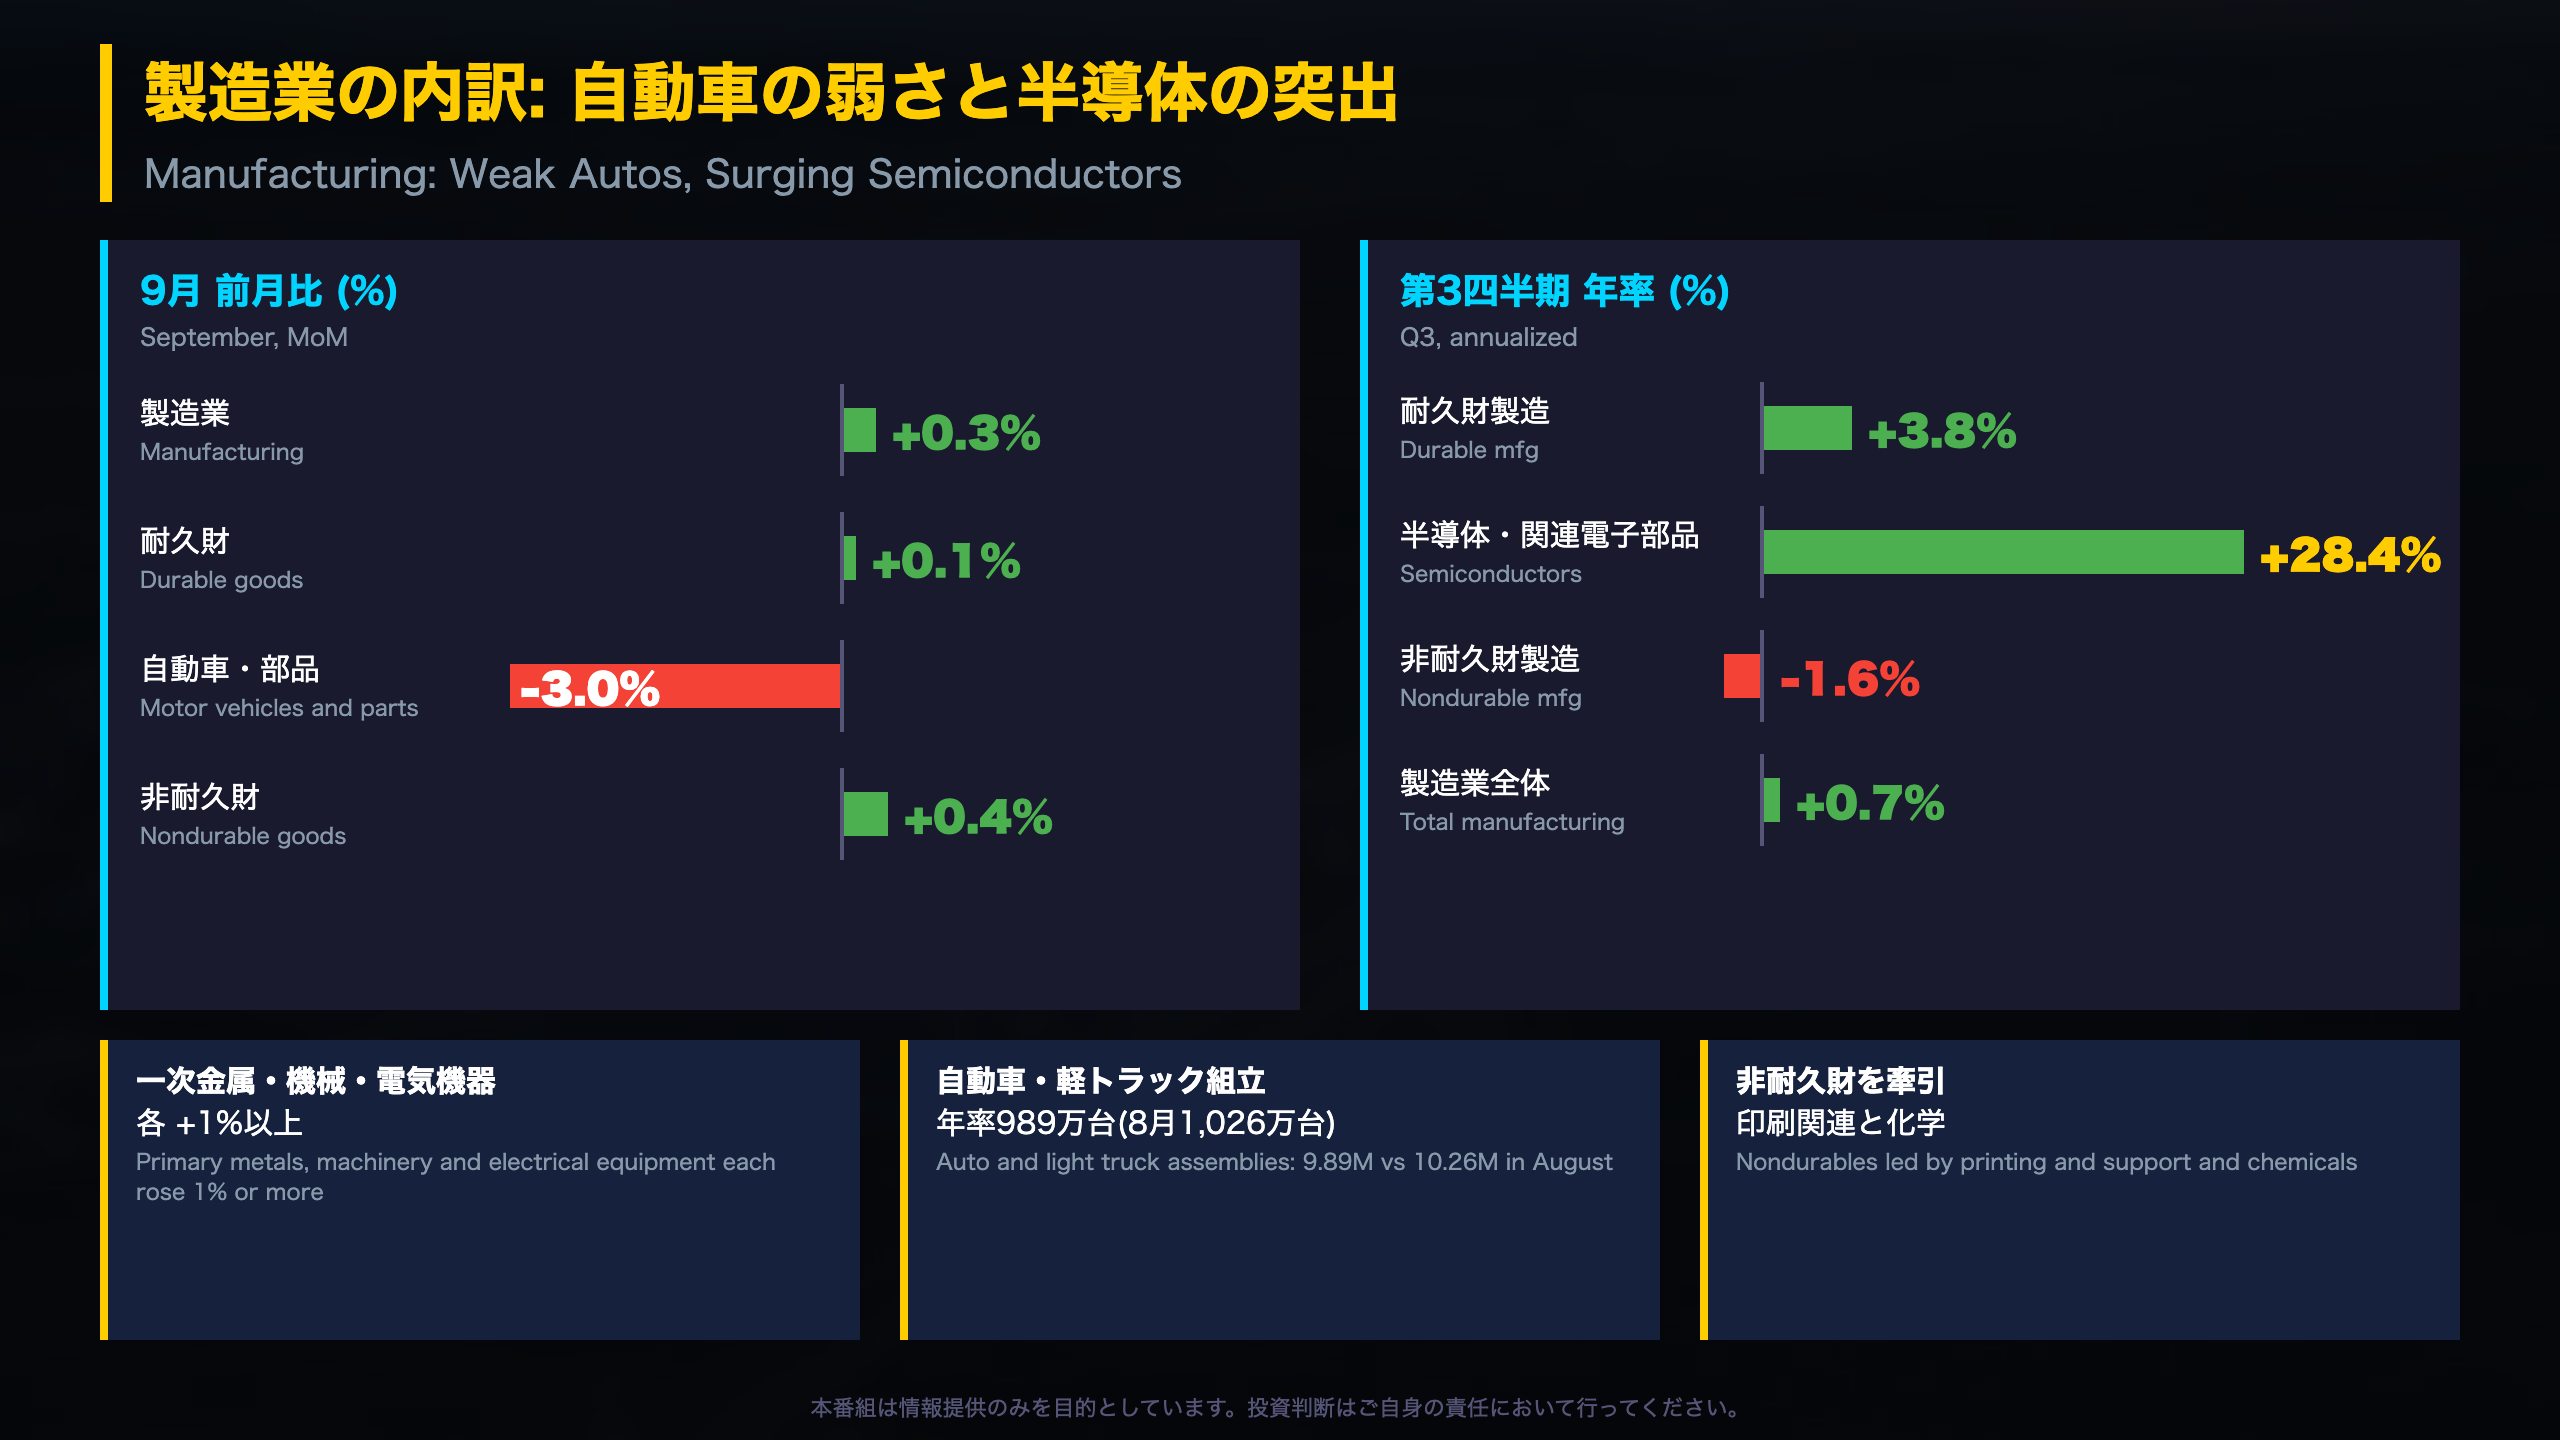
Manufacturing output (index 98.4) rose 0.3% in September after eight months of mostly gains was interrupted by an August decline. The Fed notes that August ended a seven-month run of increases, so September is a modest rebound.
Durable goods: winners and losers
Based on the published indexes, primary metals (about +1.5%), machinery (about +1.5%) and electrical equipment (about +1.3%) each gained more than 1%. Motor vehicles and parts, however, fell 3.0%. Assemblies of autos and light trucks dropped to a 9.89 million annual rate from 10.26 million in August, after running at 10.5-10.7 million in April-June.
Nondurables
Nondurable output rose 0.4%, led by printing and chemicals. Yet over Q3 as a whole nondurables fell at a 1.6% annual rate, so September’s improvement has not yet offset the quarter’s weakness.
The semiconductor effect
Semiconductors and related components rose 28.4% annualized in Q3, helping durable manufacturing to a 3.8% annualized gain. The broader computer and electronic products index was roughly flat from July to September (139.8, 139.5, 139.6), which suggests the quarterly gain reflects a higher level reached earlier rather than a September surge. This is an inference from limited data.
“In the third quarter as a whole, durable manufacturing output rose at an annual rate of 3.8 percent – driven in part by a 28.4 percent gain in the output of semiconductors and related electronic components.”
International context
Unlike the ISM or S&P Global PMIs, which survey purchasing managers, G.17 estimates real output from physical product data and production-worker hours. It is also the US analogue of Japan’s METI index of industrial production. Recoveries in both are often led by electronics, so sector composition matters when reading the headline.
Takeaway
Breadth in metals and equipment is a positive; autos and nondurables are the soft spots.
設備稼働率: 長期平均を下回る水準
Placing 76.9% in historical context
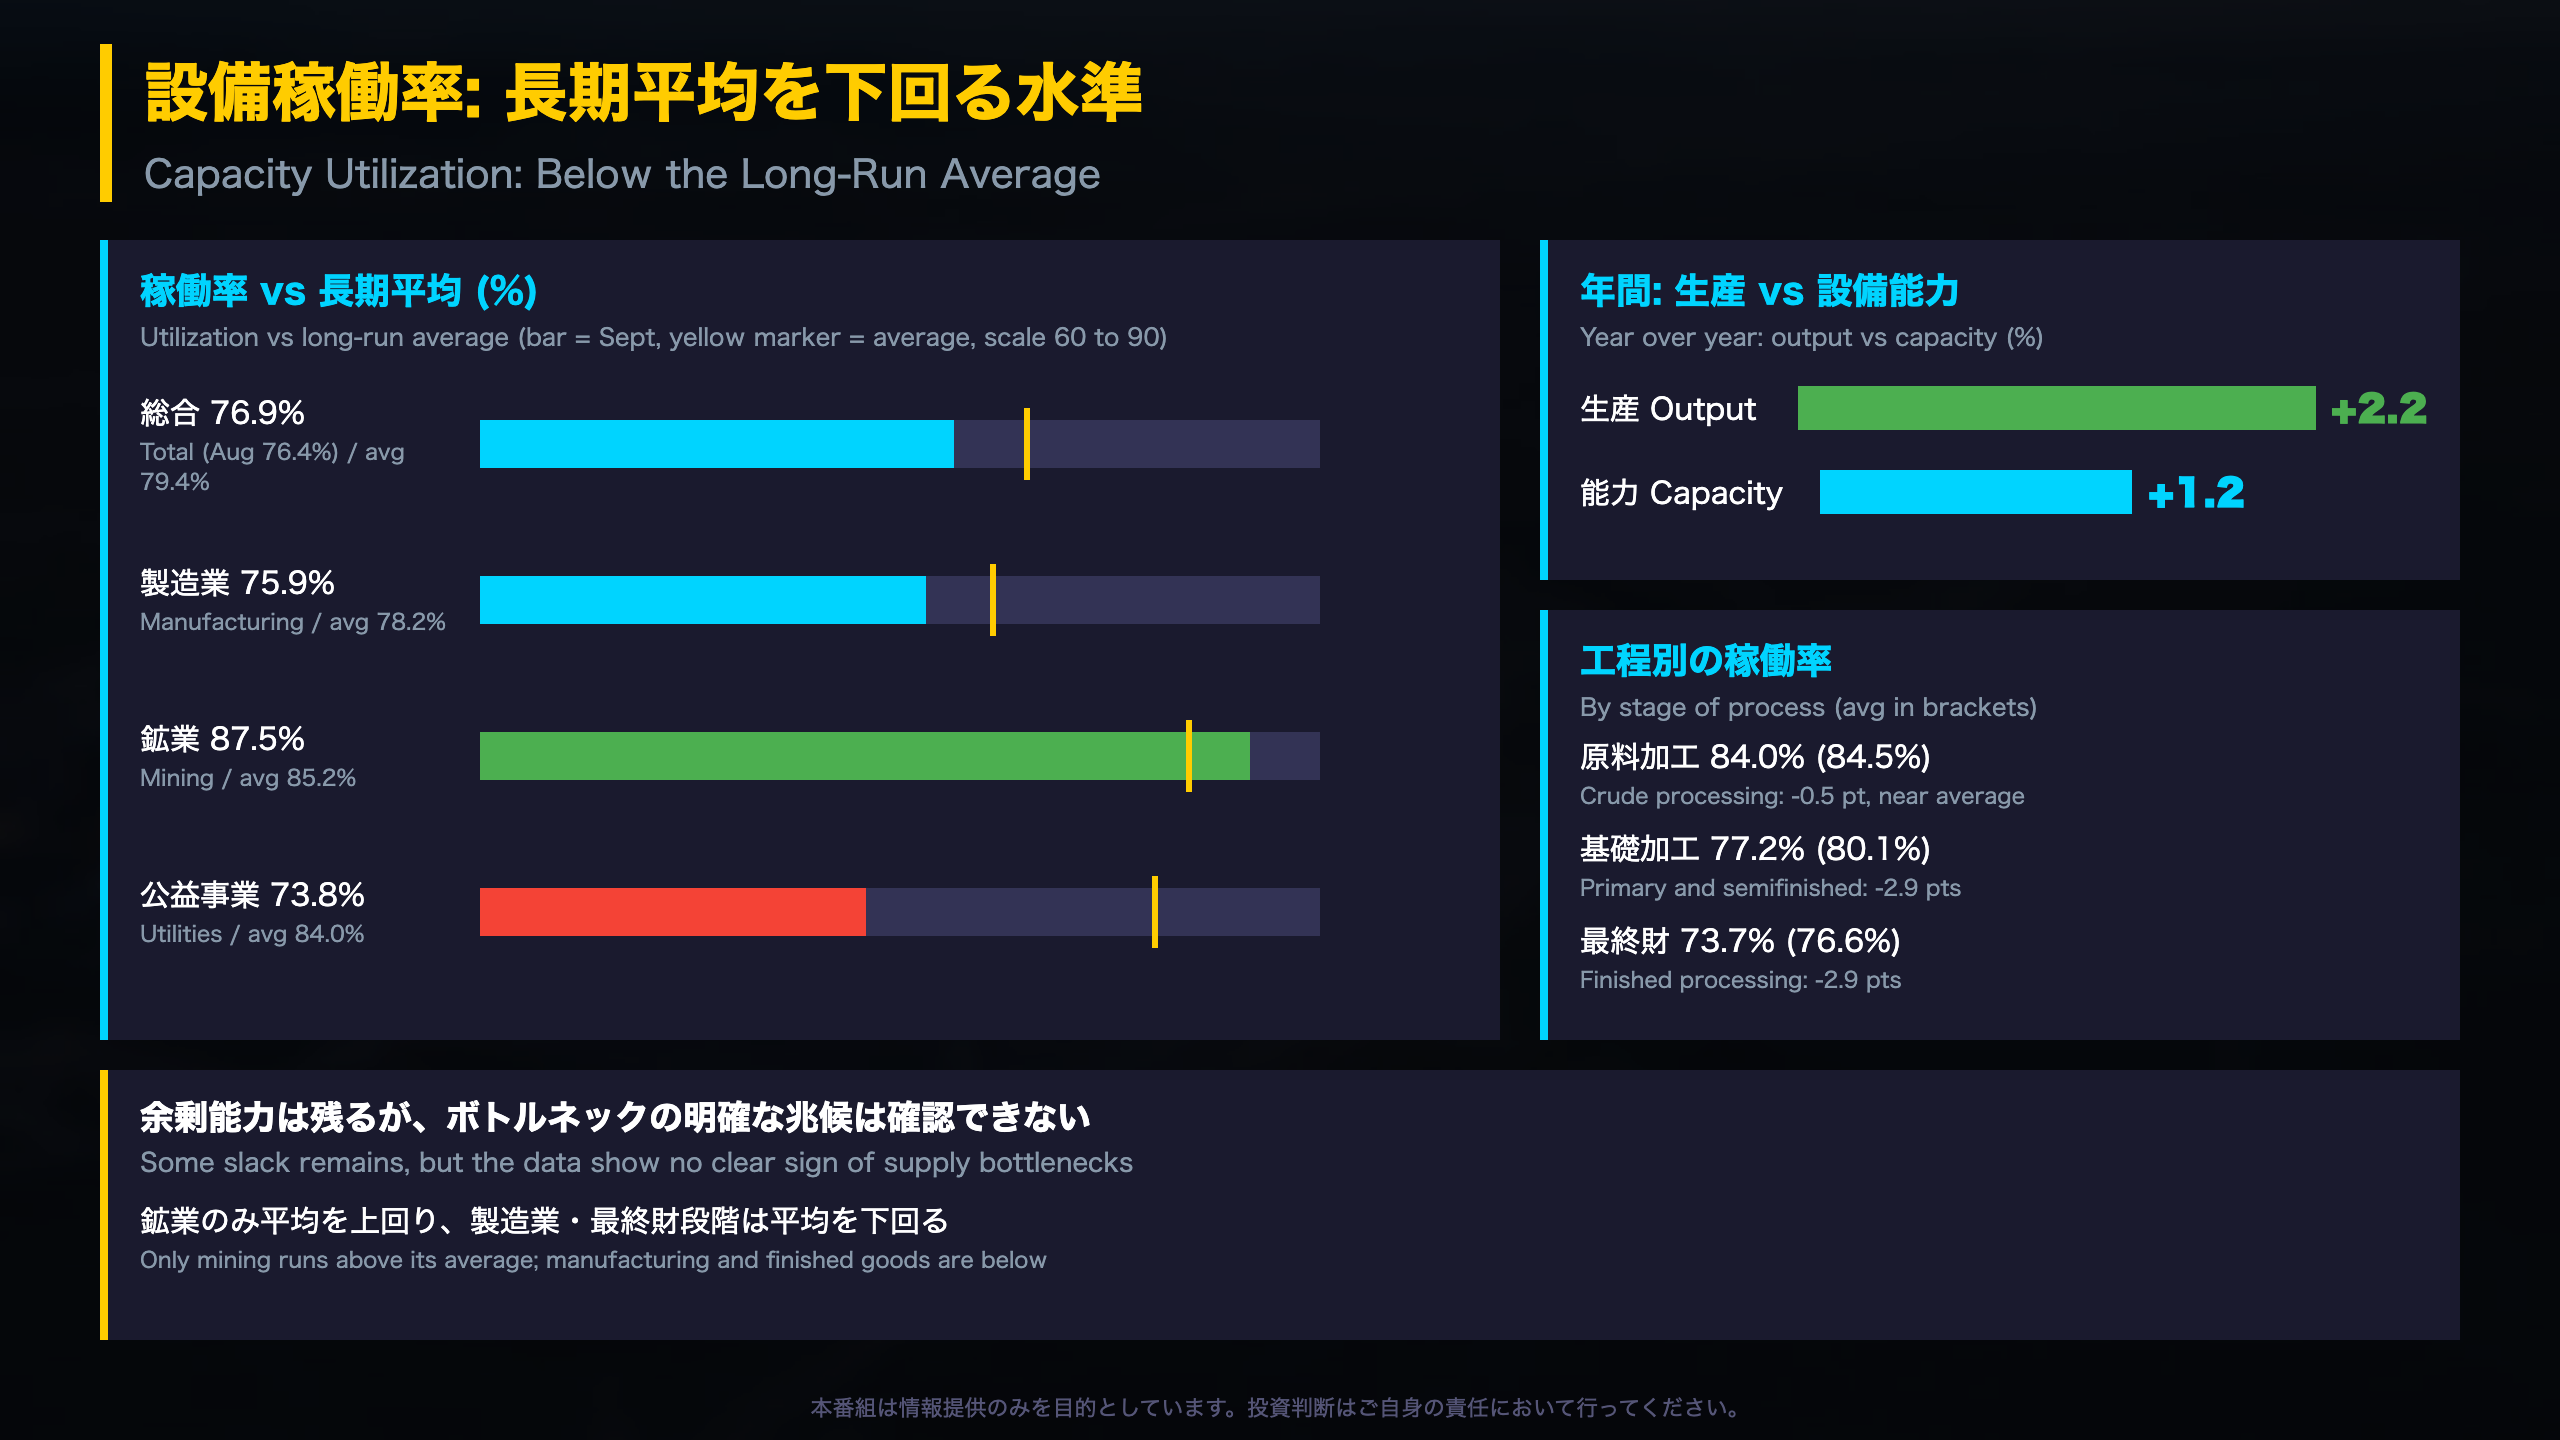
The Fed defines capacity utilization as output divided by sustainable maximum output (a realistic work schedule after normal downtime). The 1972-2025 average is 79.4%, the 2009 low was 66.5%, and the 1994-95 high was 85.0%. At 76.9%, the economy sits in the middle of that range, 2.5 points below average.
By sector (September vs. long-run average)
- Total: 76.9% vs 79.4% (-2.5)
- Manufacturing: 75.9% vs 78.2% (-2.3)
- Mining: 87.5% vs 85.2% (+2.3), the only major group above average
- Utilities: 73.8% vs 84.0% (-10.2) despite a 2.3-point monthly jump
Output versus capacity
Capacity grew 1.2% year over year while output grew 2.2%, which mechanically lifts utilization (from 76.0% a year ago). In manufacturing, the gap is narrow: output +1.1% versus capacity +1.0%, and the utilization rate is essentially unchanged from a year ago (75.8% to 75.9%). Most of the aggregate improvement therefore comes from utilities and mining.
Stage-of-process view
Crude processing runs at 84.0%, close to its 84.5% average, while primary and semifinished (77.2% vs 80.1%) and finished goods (73.7% vs 76.6%) are each about 2.9 points below average.
“A rate of 85 percent means about the same degree of tightness that it meant in the past.” – Federal Reserve, G.17 explanatory note
Comparison and caveats
The Fed’s rates run higher than Census survey-based rates because they are calibrated to the older McGraw-Hill survey, so cross-source comparisons need care. The annual revision on Nov 24 will update capacity with Census Quarterly Survey of Plant Capacity data through Q4 2025, so levels can shift.
The release shows remaining slack in manufacturing and finished goods, and no broad capacity strain outside mining.
市場別の動き・改定リスク・次回日程
Market groups in detail
In September every major market group rose except business equipment, which was unchanged. Consumer goods gained 0.7%, but durable consumer goods fell 1.5% (down 2.8% year over year). Construction supplies rose 1.0%, business supplies 0.9% and materials 0.7%. The notable divergence is between consumer goods (-0.1% YoY) and business equipment (+6.7% YoY).
Why first prints are revised
Only about 78% of source data (by value added) is available for the first estimate, rising to 86% at the second and 98% by the fifth and sixth. The remainder is estimated, which is why revisions are routine. For reference, the Bureau of Labor Statistics revises payrolls through a similar multi-stage process, but G.17 revisions can run over six months.
“The base year for the revised indexes will be 2022.” – Federal Reserve, G.17
Calendar
- Nov 17, 2026: October G.17, with possible revisions to September.
- Nov 24, 2026: Annual revision. It rebases to 2022, incorporates Census benchmark data for manufacturing in 2023-2024, updates seasonal factors, and can change the series back to 1972. Capacity and utilization will incorporate Census plant-capacity survey data through Q4 2025.
How to use this
The annual revision matters for comparisons: year-over-year growth rates and utilization levels quoted today may look different after it. Watch whether the October print confirms a manufacturing recovery rather than a utilities-driven gain. We make no forecast; the Fed release contains no policy or currency commentary.
For investors unfamiliar with the series, G.17 is the main hard-data gauge of US goods-producing activity, complementing PMI surveys.
Disclaimer: This article is for informational purposes only. All investment decisions are made solely at your own risk.