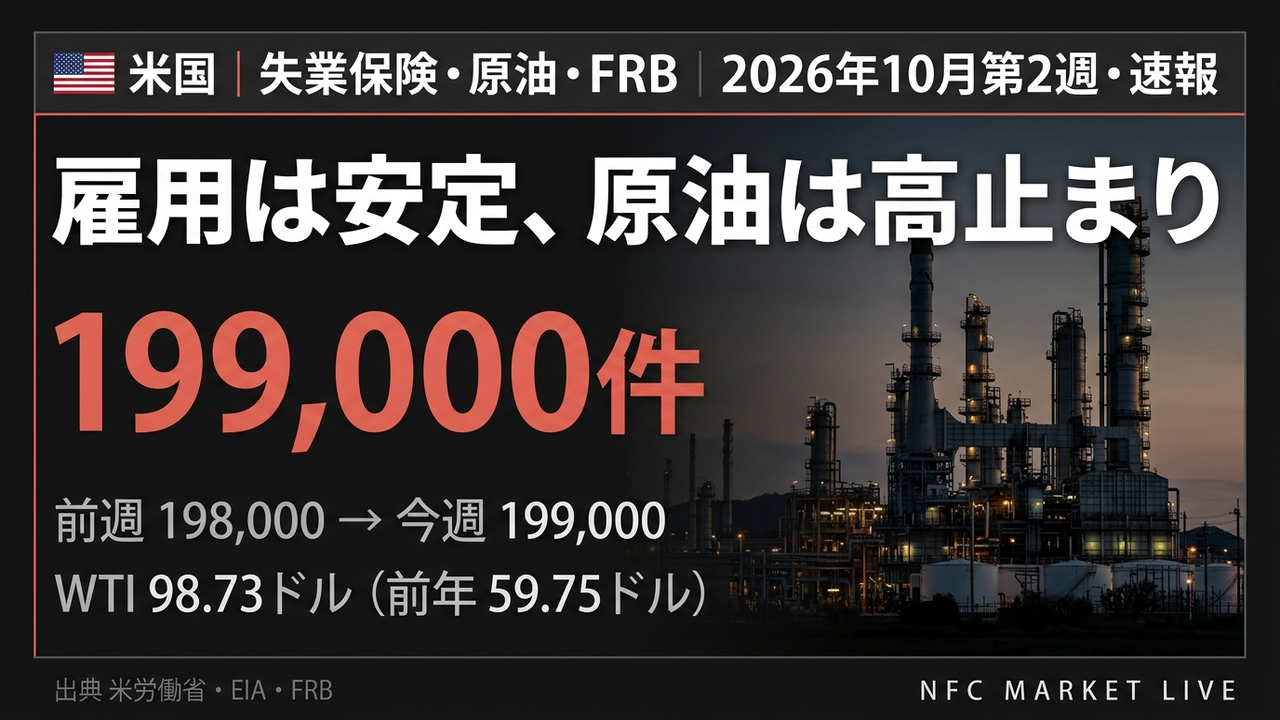
📺 Watch the Full Video Analysis
This article was automatically generated by the NFC Market Live AI analysis system. (Updated: 2026-10-17 07:12 JST)
📄 Primary Source
米国労働省(DOL)— 新規失業保険申請件数
https://www.dol.gov/node/186182
米国エネルギー情報局(EIA)— 週間石油状況レポート
https://www.eia.gov/petroleum/supply/weekly/pdf/highlights.pdf
連邦準備制度理事会(FRB)— H.4.1 バランスシート
https://www.federalreserve.gov/releases/h41/current/h41.htm
📊 A weekly look at three US macro indicators: labor, energy and liquidity.
📈 Labor: initial jobless claims were 199,000 and the four-week average was 198,500, a low and stable level.
⛽ Energy: WTI was 98.73 dollars versus 59.75 a year earlier, while New York Harbor spot gasoline fell from 3.398 to 3.020 dollars.
💧 Liquidity: Fed reserve balances averaged 3.022 trillion dollars, roughly flat year over year, while the Treasury General Account grew to 883.4 billion dollars.
⚠️ The three readings point in different directions, and we cover both sides.
💡 The next weekly releases are expected on October 22. The focus is whether claims stay near 200,000.
今週のアルティメット・サマリー
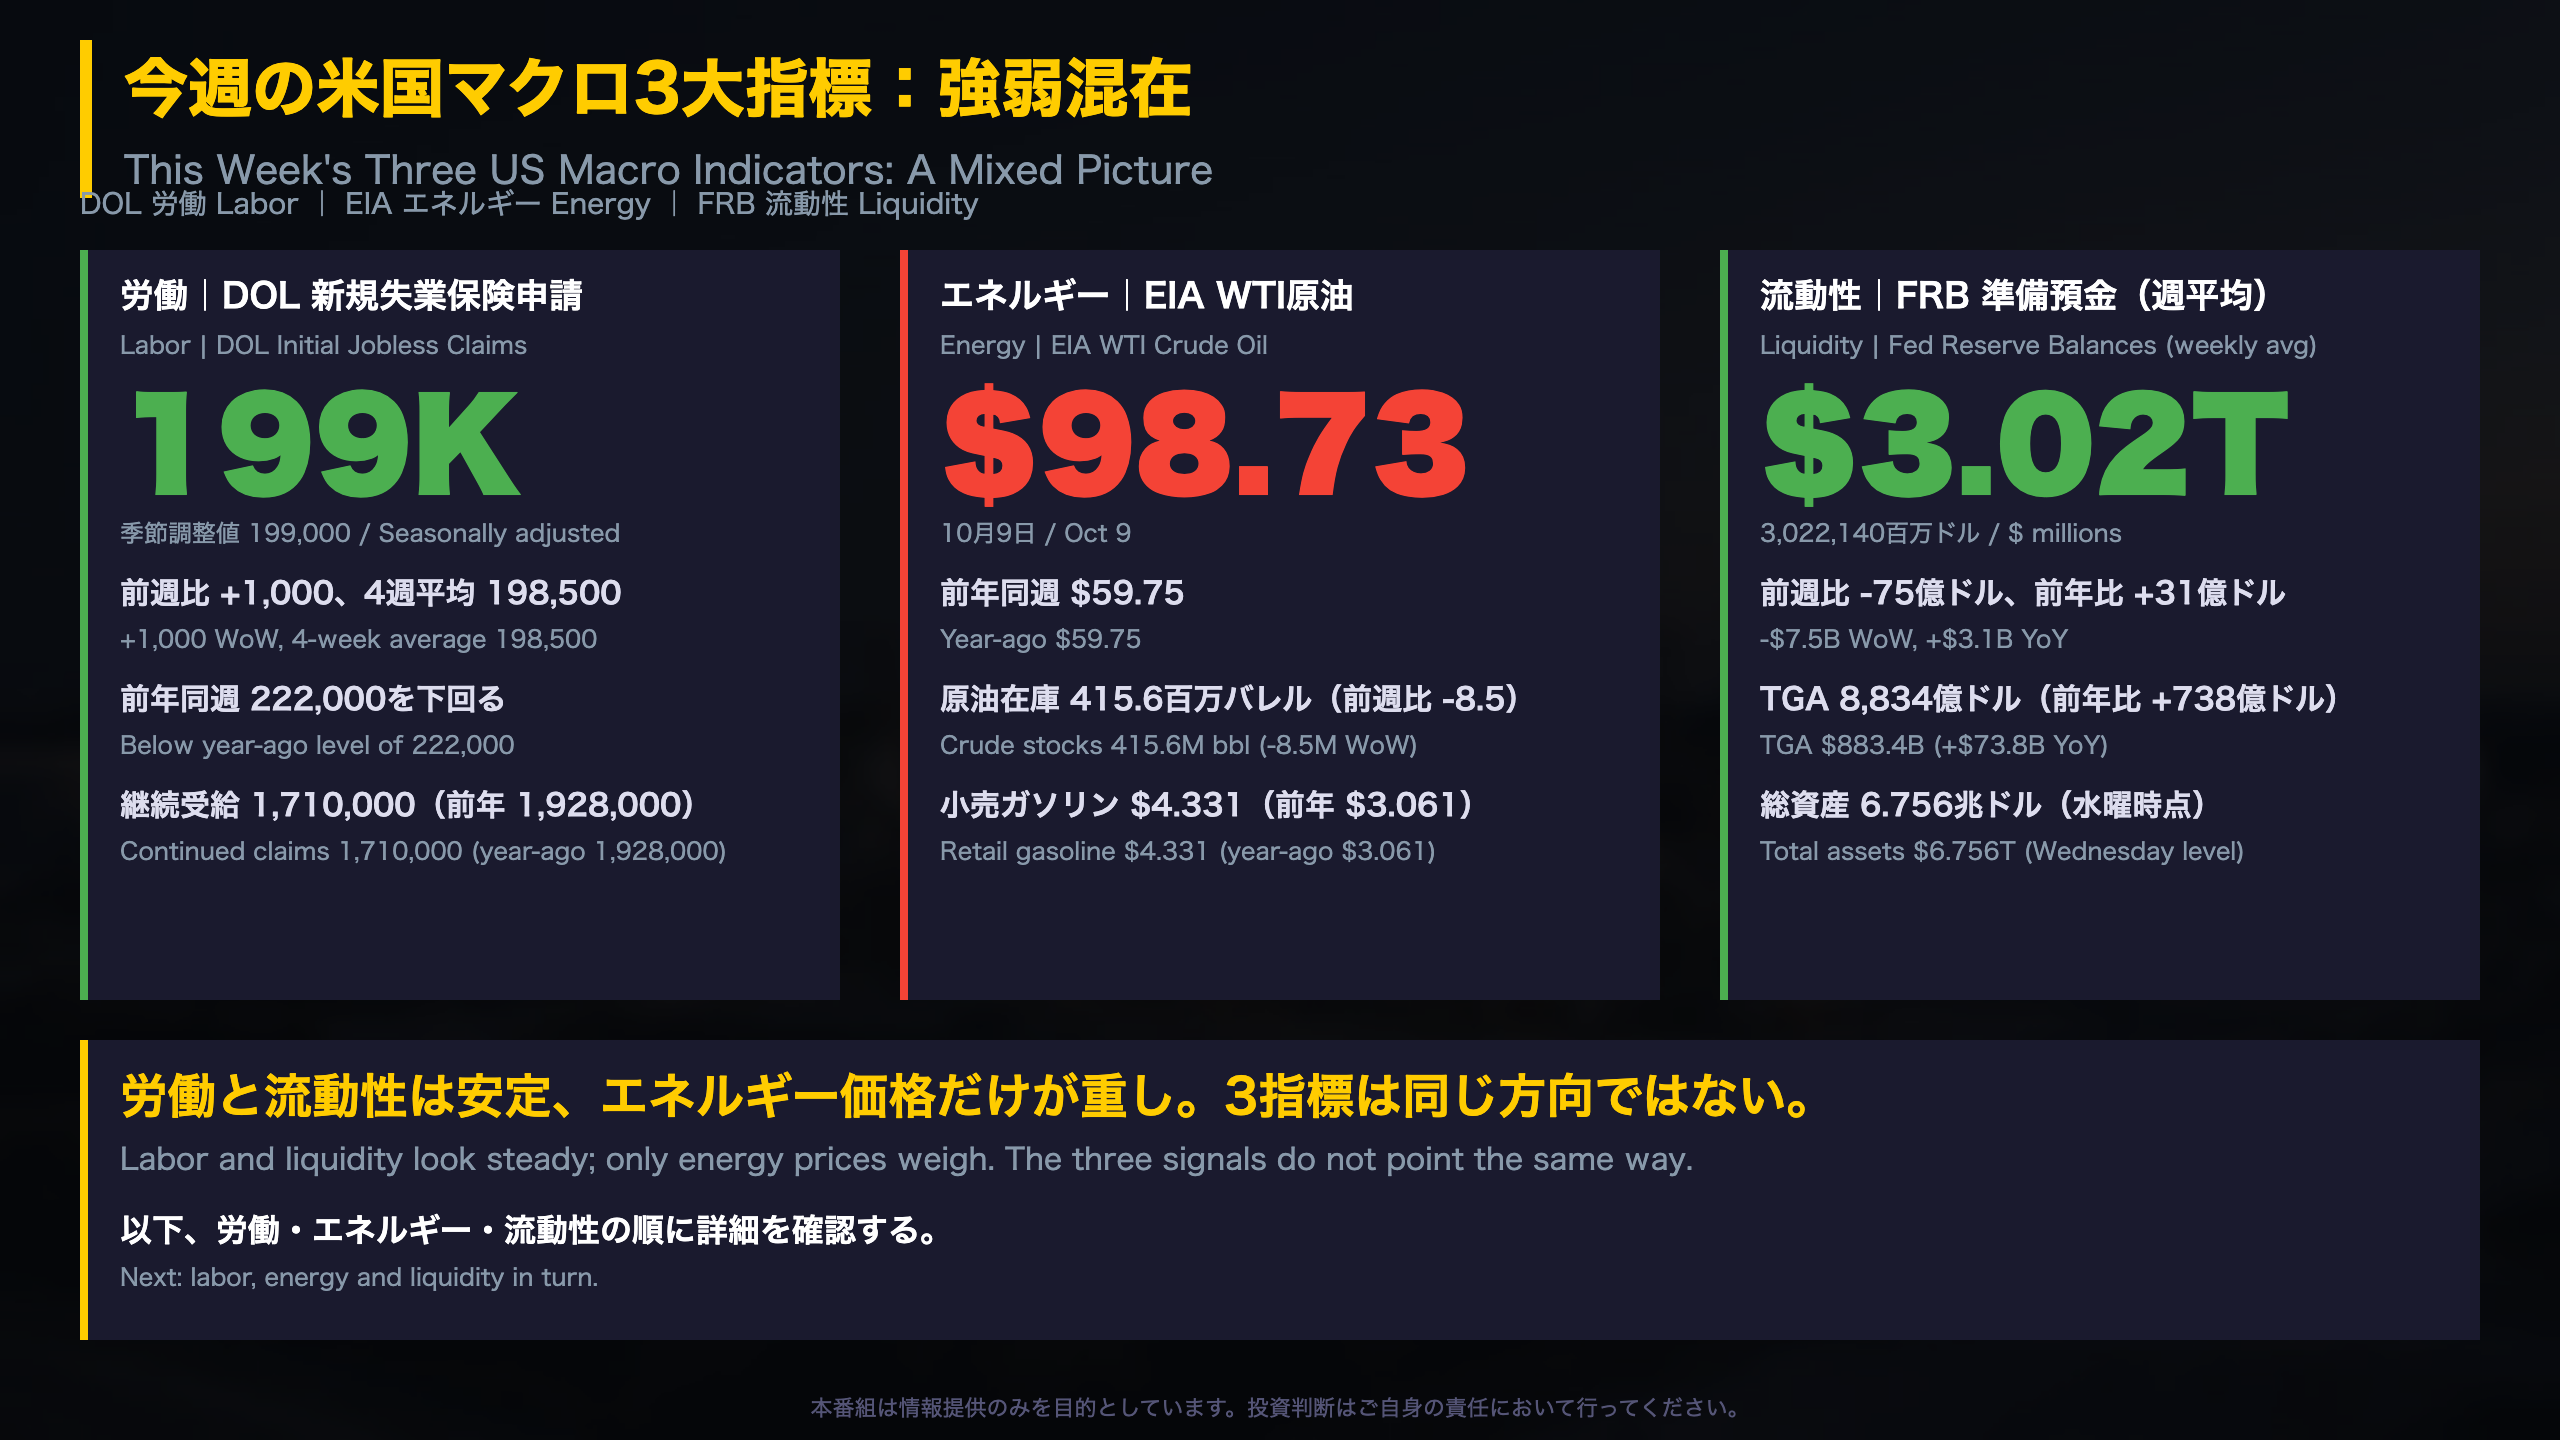
Reading three US weekly releases together
Who publishes what. The Department of Labor (DOL) releases jobless claims each Thursday. The Energy Information Administration (EIA) publishes the Weekly Petroleum Status Report. The Federal Reserve’s H.4.1 shows the central bank’s balance sheet and the factors that move bank reserves.
Where the strength is
- Initial claims of 199,000, inside a 198,000 to 199,000 band for five weeks
- Continued claims of 1,710,000 versus 1,928,000 a year ago
- Reserve balances near 3.02 trillion dollars (weekly average), roughly flat year over year
Where the pressure is
- WTI at 98.73 dollars versus 59.75 a year earlier; retail regular gasoline at 4.331 versus 3.061
- The Treasury General Account, the government’s cash account at the Fed, averaged 883.4 billion dollars, up 73.8 billion year over year
Cautions
The DOL notes that weekly claims are “difficult to seasonally adjust, making the series subject to some volatility.” The headline text of the EIA source also covers the week ending September 11, so this program relies on the October 9 table figures.
Why read them together
Low claims, ample reserves and high oil prices carry different messages for growth and inflation, so the three releases are best read side by side.
Next weekly releases are expected on October 22.
労働市場の現在地(DOL 新規失業保険申請)
What the jobless claims data actually measure
Context. The Department of Labor’s weekly report is one of the most timely US labor indicators. Initial claims count people newly filing for unemployment insurance after a job separation. Continued claims count those still receiving benefits, and the DOL describes them as roughly coinciding with economic cycles at peaks and lagging at troughs.
The trend
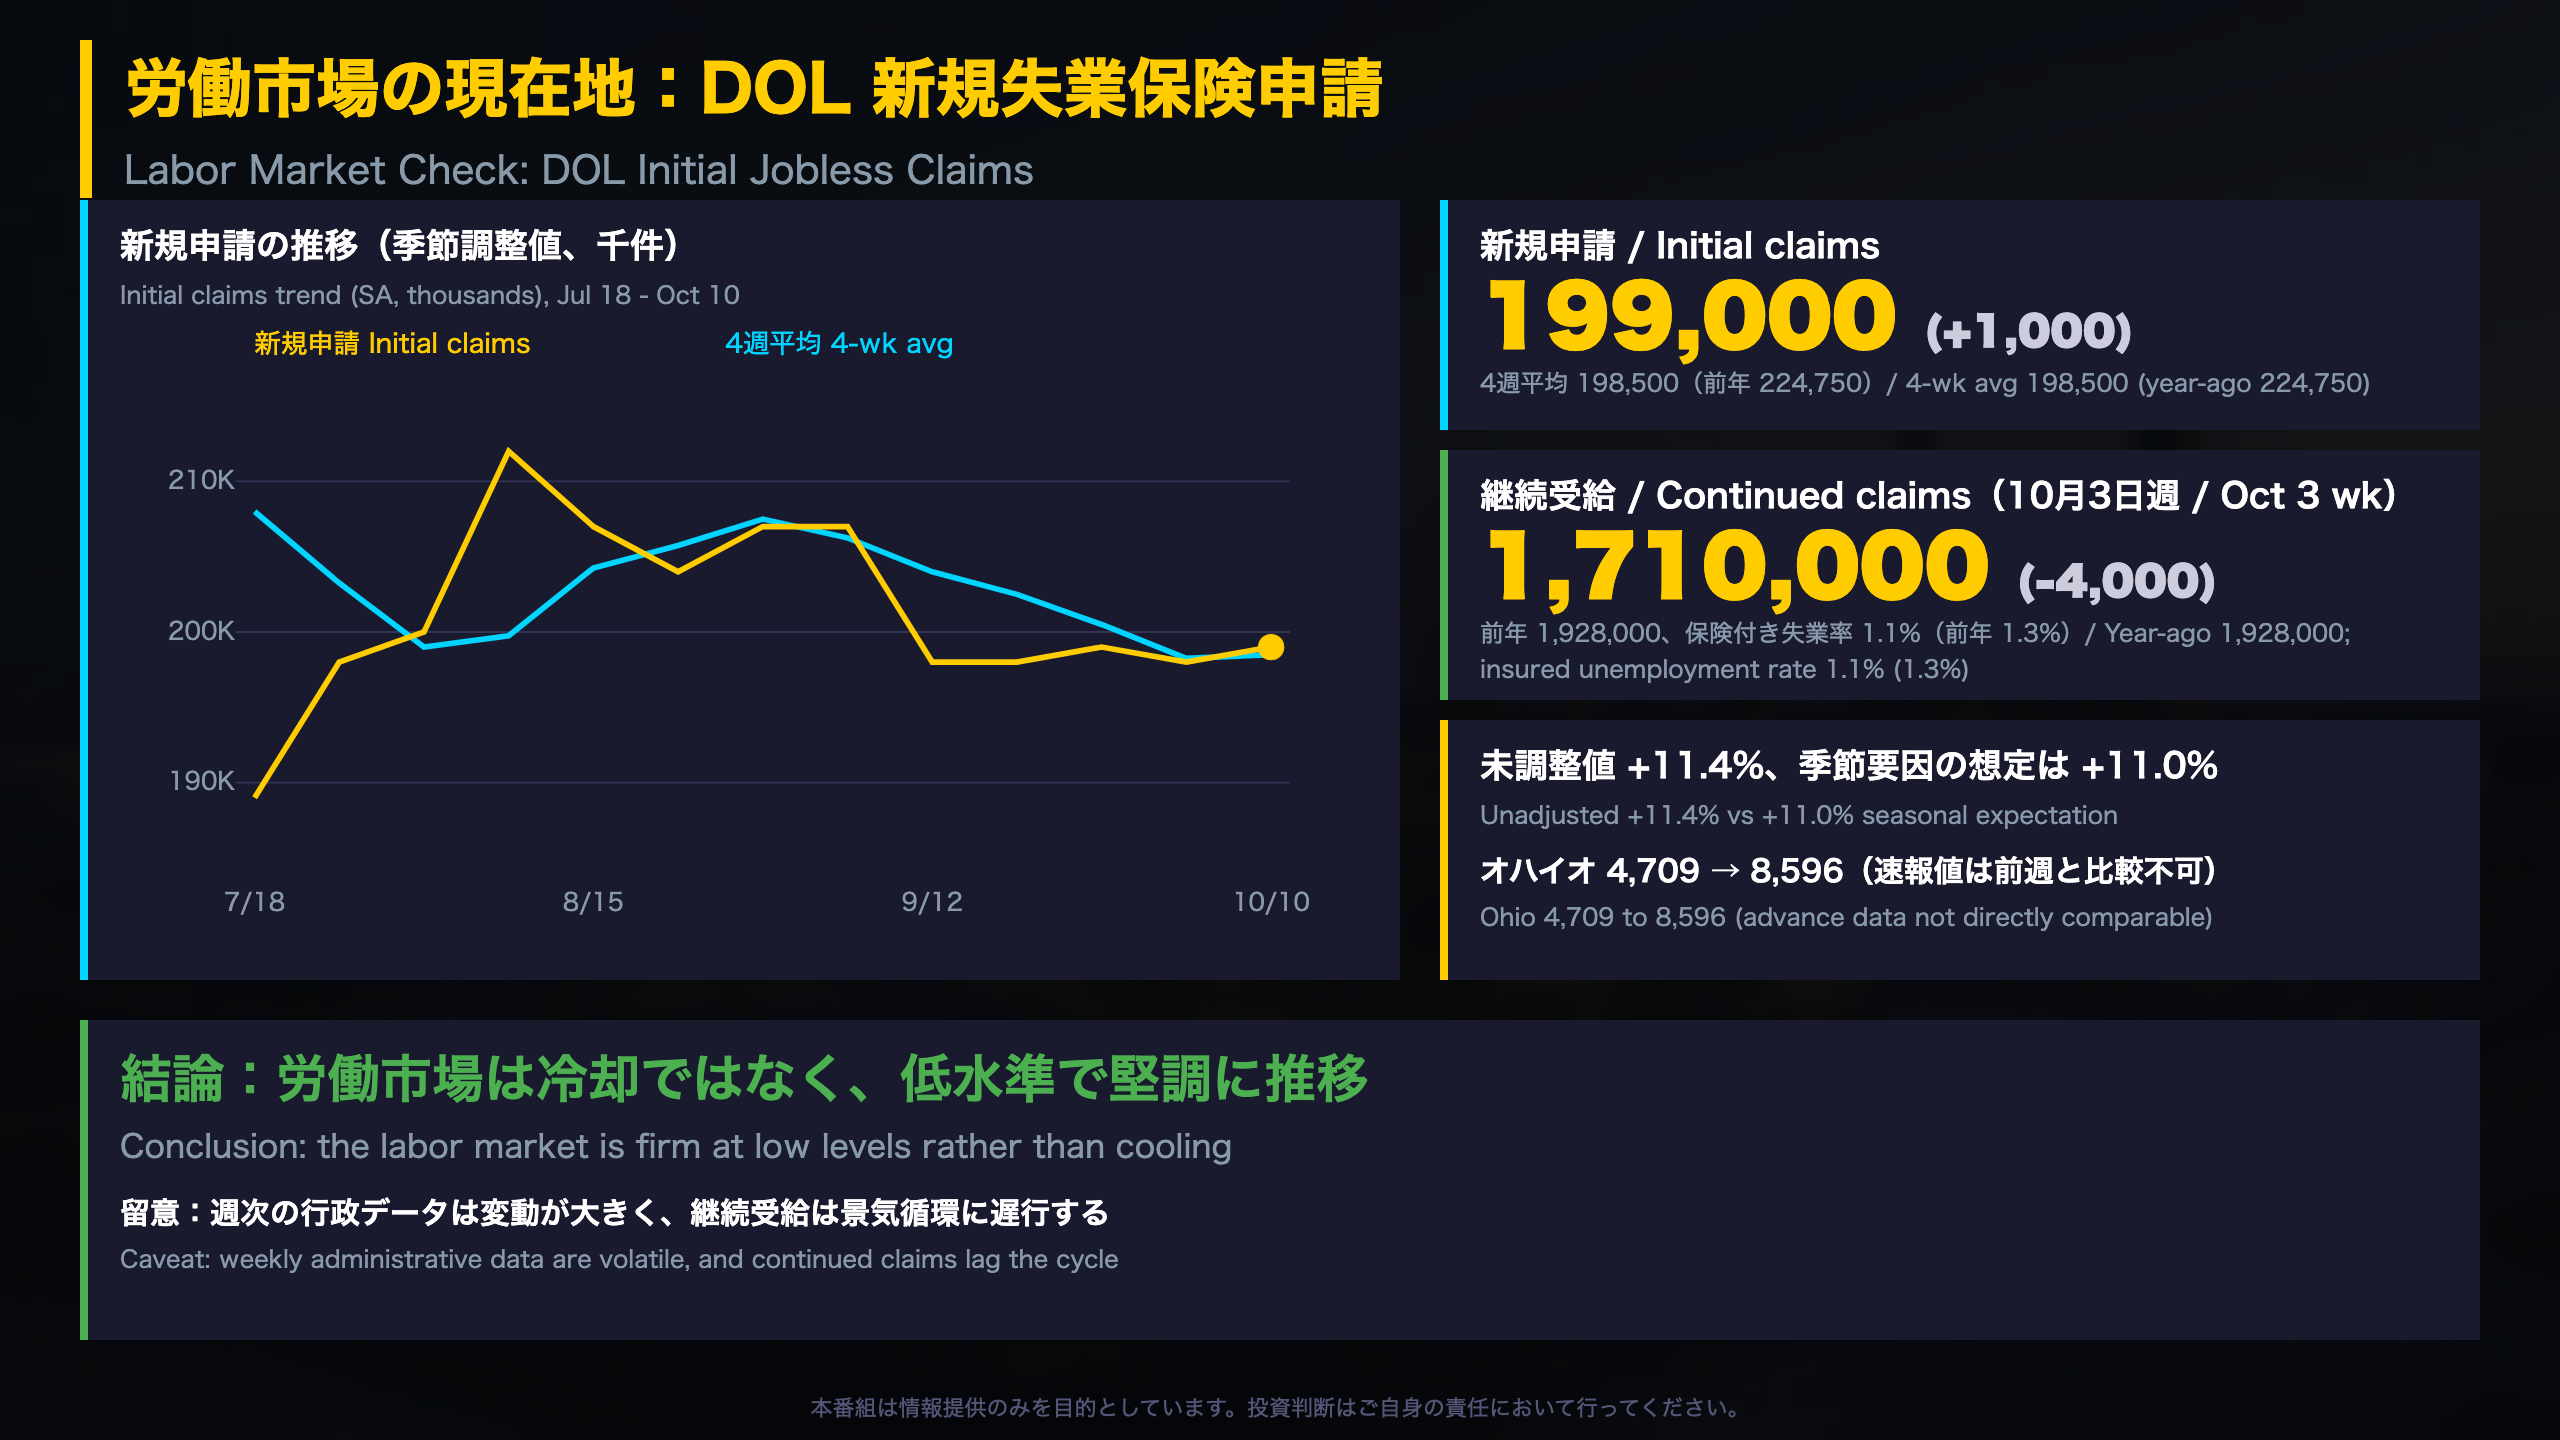
- Initial claims: 199,000, with a four-week average of 198,500, versus 224,750 a year earlier
- The four-week average peaked at 224,500 in the week of June 20 and has drifted lower since
- Continued claims: 1,710,000 versus 1,821,000 in late June and 1,928,000 a year ago
- Insured unemployment rate: 1.1 percent versus 1.3 percent a year earlier
State detail
The highest insured unemployment rates were in New Jersey (2.0), Massachusetts (1.8), Washington (1.8) and California (1.7). California added 4,295 initial claims and Illinois 1,108 in the week ending October 3. In the October 10 advance data, Ohio rose from 4,709 to 8,596 and Tennessee from 2,350 to 5,834, but the DOL warns that advance state claims are “not directly comparable to claims reported in prior weeks.”
Two readings
The constructive reading is that layoffs remain contained. The cautious reading is that weekly administrative data are noisy and continued claims lag the cycle, so a single week cannot confirm a trend.
What to watch
The next release is expected on October 22. A four-week average staying near 198,500 would extend the current pattern.
エネルギー需給の現在地(EIA 週間石油状況)
The EIA Weekly Petroleum Status Report in context
Who is the EIA? The Energy Information Administration is the statistical arm of the US Department of Energy. Its weekly report, released on Wednesdays, is the market’s main high-frequency read on US crude, gasoline and distillate stocks, refinery runs and product demand.
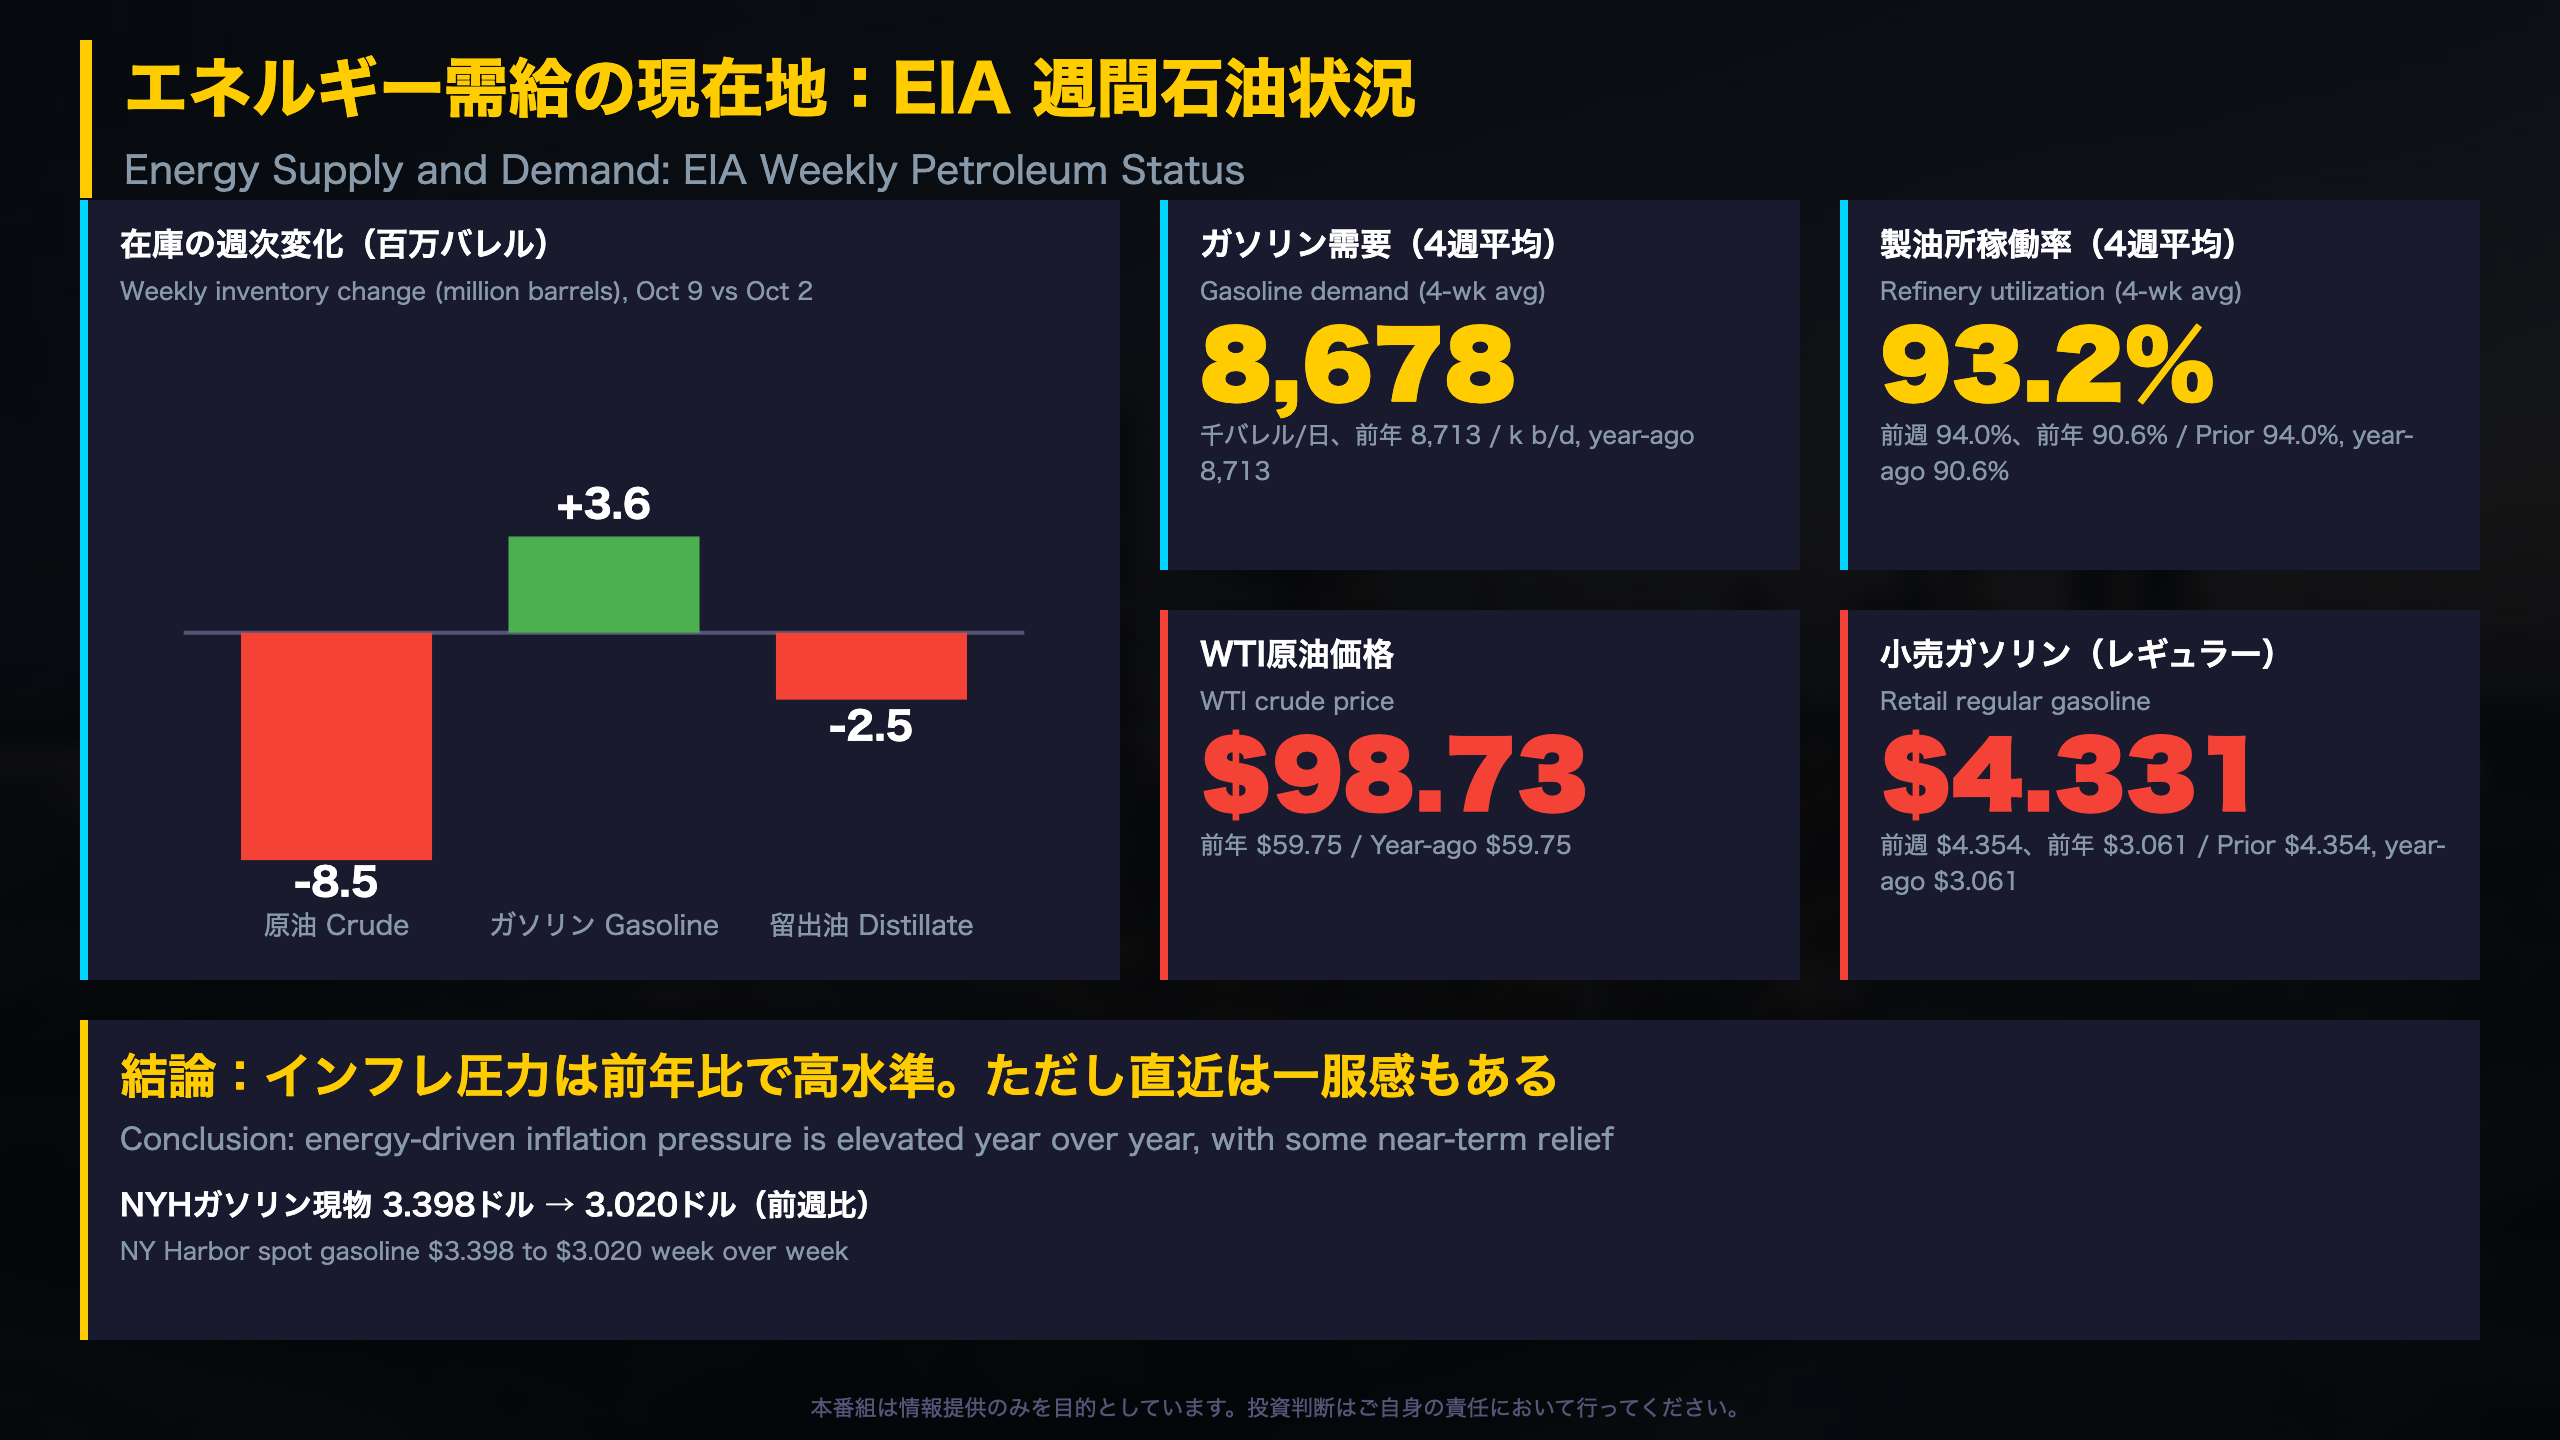
Inventories (million barrels, Oct 9 vs Oct 2 vs year-ago)
- Commercial crude: 415.6 / 424.1 / 423.8
- Gasoline: 208.3 / 204.7 / 218.8
- Distillate: 102.6 / 105.1 / 117.0
- Strategic Petroleum Reserve: 283.0 / 283.0 / 407.7
The reserve is 124.7 million barrels below a year ago, while commercial crude is about flat.
Demand and refining
Four-week total product supplied was 21,077 thousand barrels per day versus 20,669 a year earlier. Gasoline supplied was 8,678 (8,713 a year ago) while distillate supplied rose to 3,974 from 3,769 the prior four-week period. Refinery utilization averaged 93.2 percent versus 90.6 percent a year earlier.
Prices
WTI at Cushing was 98.73 dollars (59.75 a year ago). New York Harbor ultra-low sulfur diesel was 4.910 dollars per gallon, and retail diesel was 6.179 versus 3.665 a year earlier.
Data caveat
The highlights text in the source describes the week ending September 11 (utilization of 96.8 percent, WTI at 101.27 dollars), so this program uses the October 9 table. Compared with the US CPI energy components, which are monthly, these weekly prices give an earlier but noisier read on pass-through to consumers.
FRB流動性の現在地(H.4.1 バランスシート)
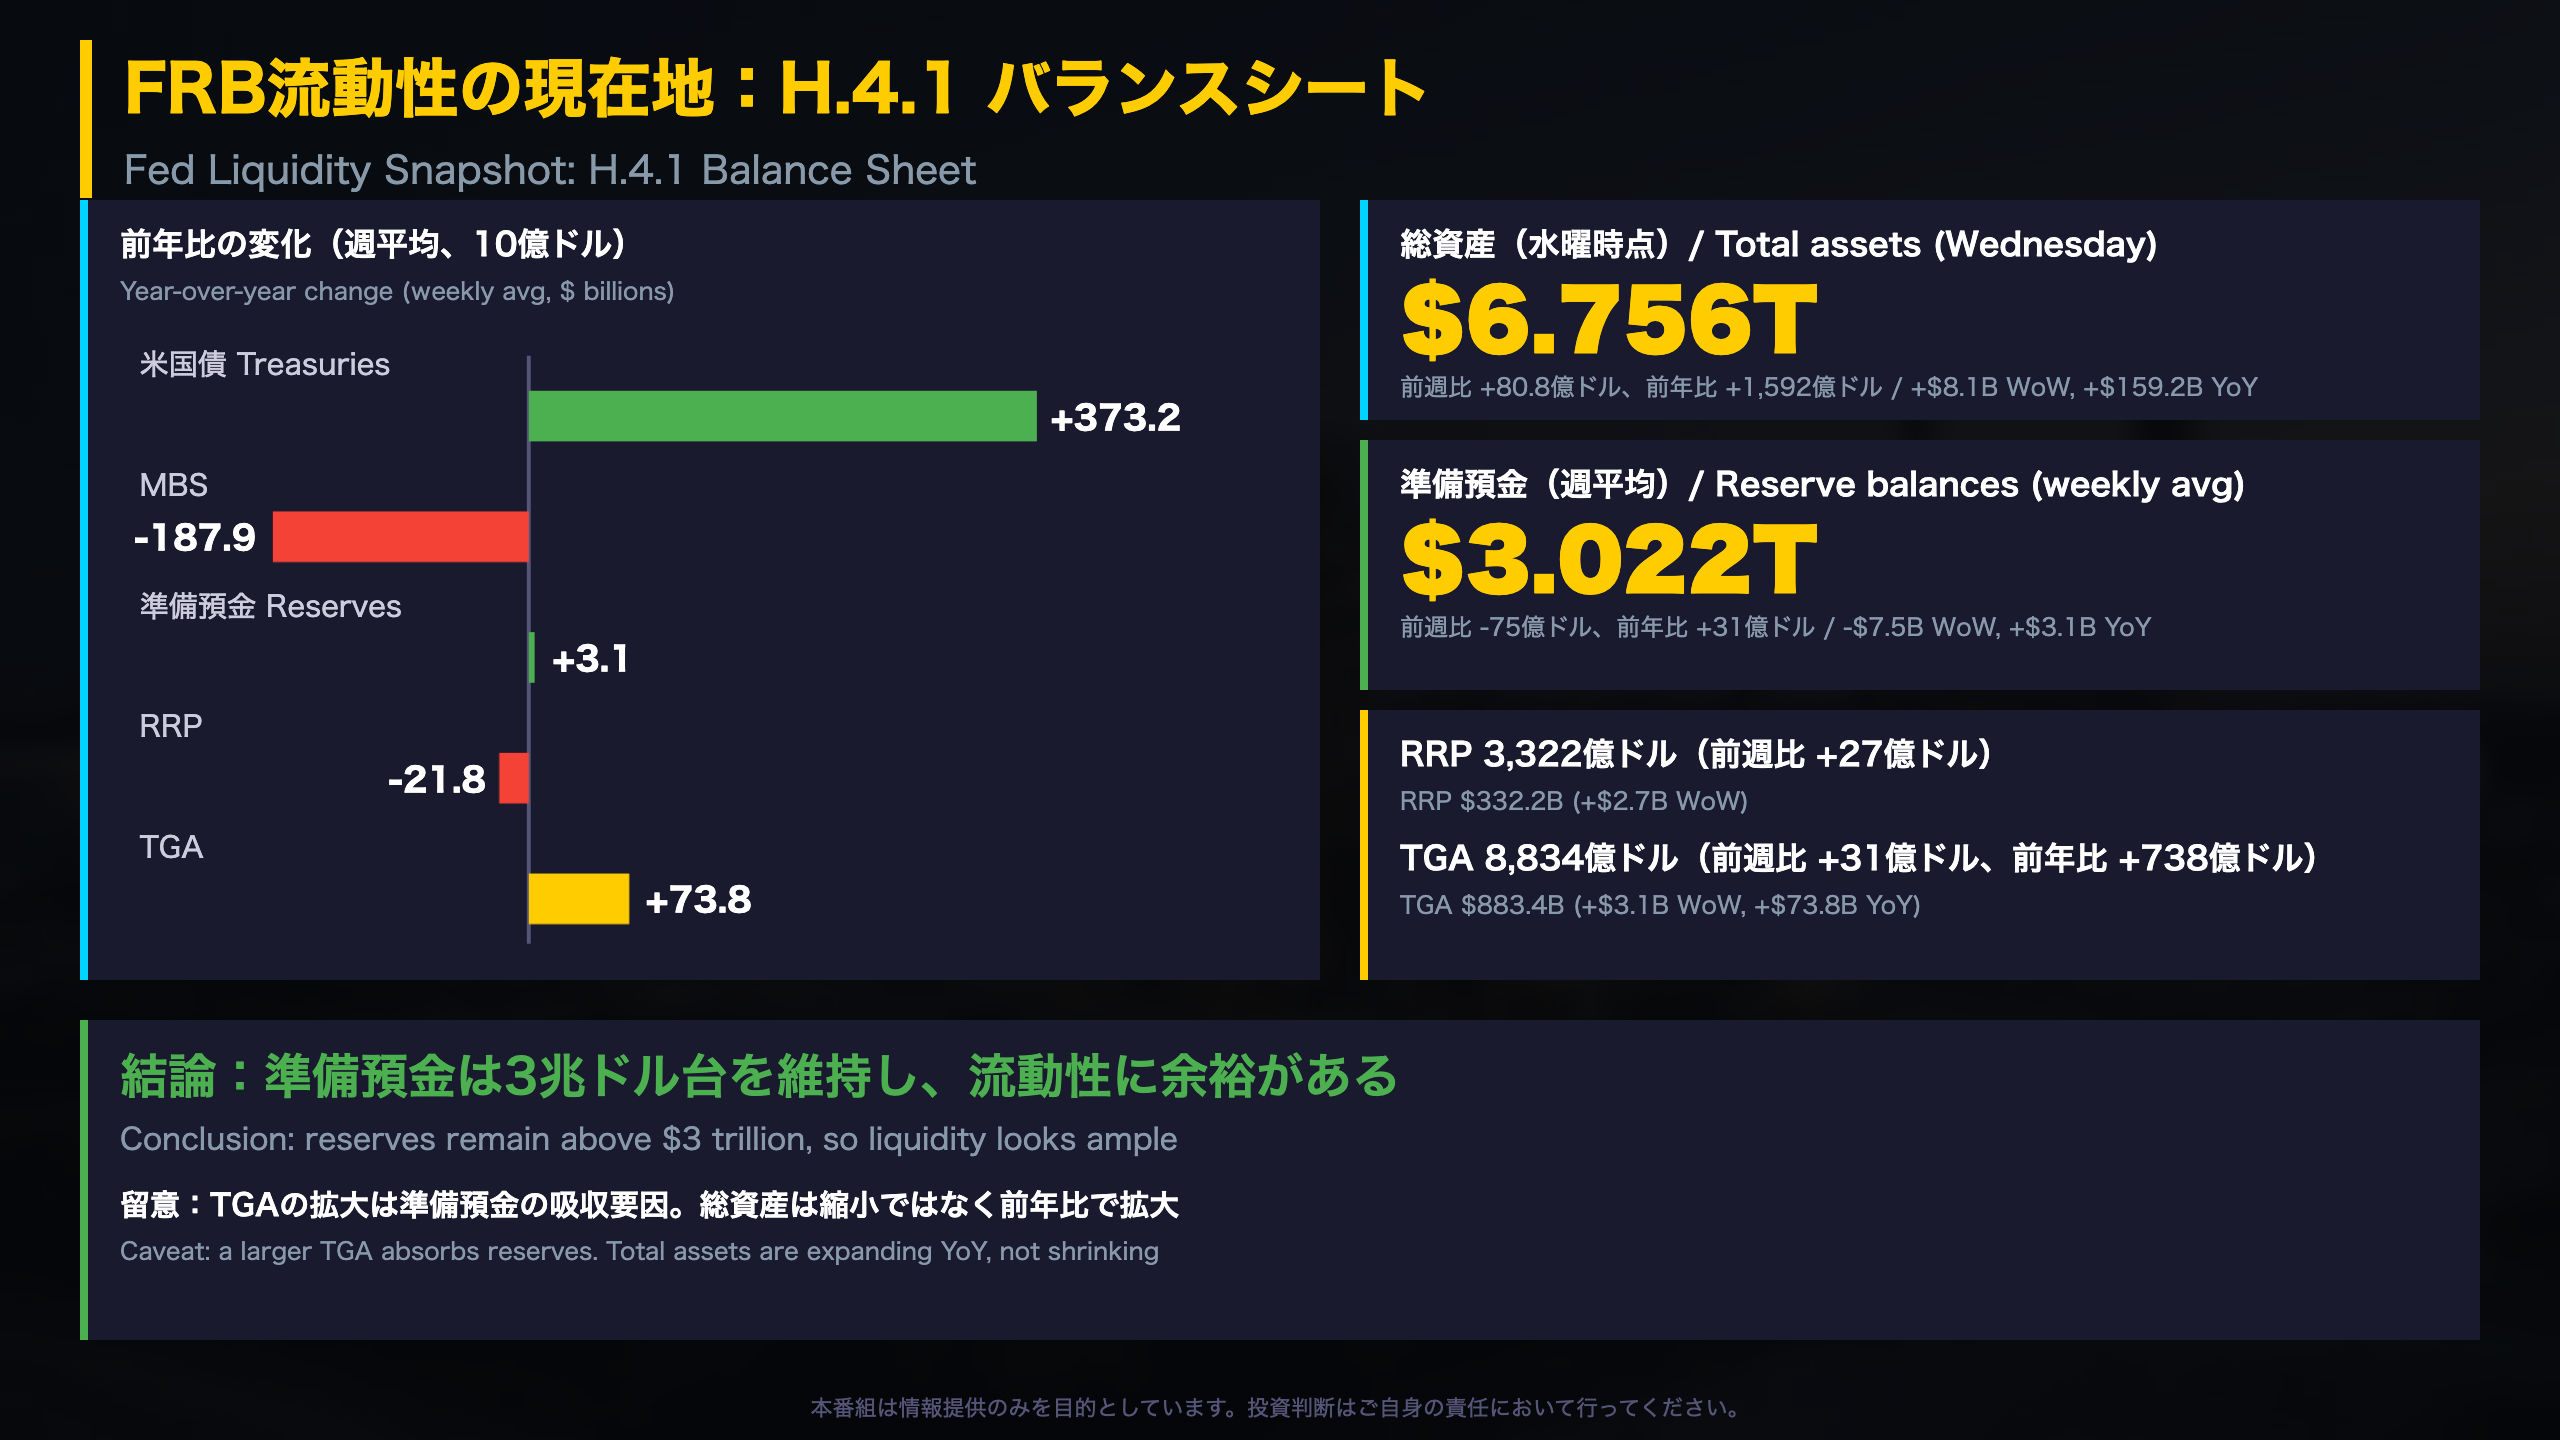
Inside the Fed’s H.4.1: why reserves dipped slightly
What is H.4.1? The Federal Reserve publishes this weekly statement of its balance sheet and the “factors affecting reserve balances.” Reserves are the deposits banks hold at the Fed, and they rise or fall with items such as the Treasury’s cash account and reverse repos.
Reserve bridge (weekly average, change from prior week, million dollars)
- Factors supplying reserve funds: +11,598
- Factors absorbing reserve funds: +19,116, including currency +4,443, deposits other than reserves +9,272 (Treasury General Account +3,120) and reverse repos +2,665
- Net effect on reserve balances: -7,519
Averages versus Wednesday
Reserves averaged 3,022,140 but stood at 3,030,854 on Wednesday, a reminder that one-week moves can be noisy.
Reverse repos
Of the 332,191 average, foreign official and international accounts held 331,904, while other counterparties held just 287.
Composition
Treasuries rose 373.2 billion year over year while mortgage-backed securities fell 187.9 billion. Foreign official custody holdings of marketable Treasuries averaged 2.549 trillion dollars, down 202.4 billion year over year.
Two readings
Bullish: total assets are higher and reserves exceed 3 trillion dollars. Cautious: a larger Treasury account absorbs reserves. Next release is expected on October 22.
ストラテジスト総括:3指標の連関と注目点
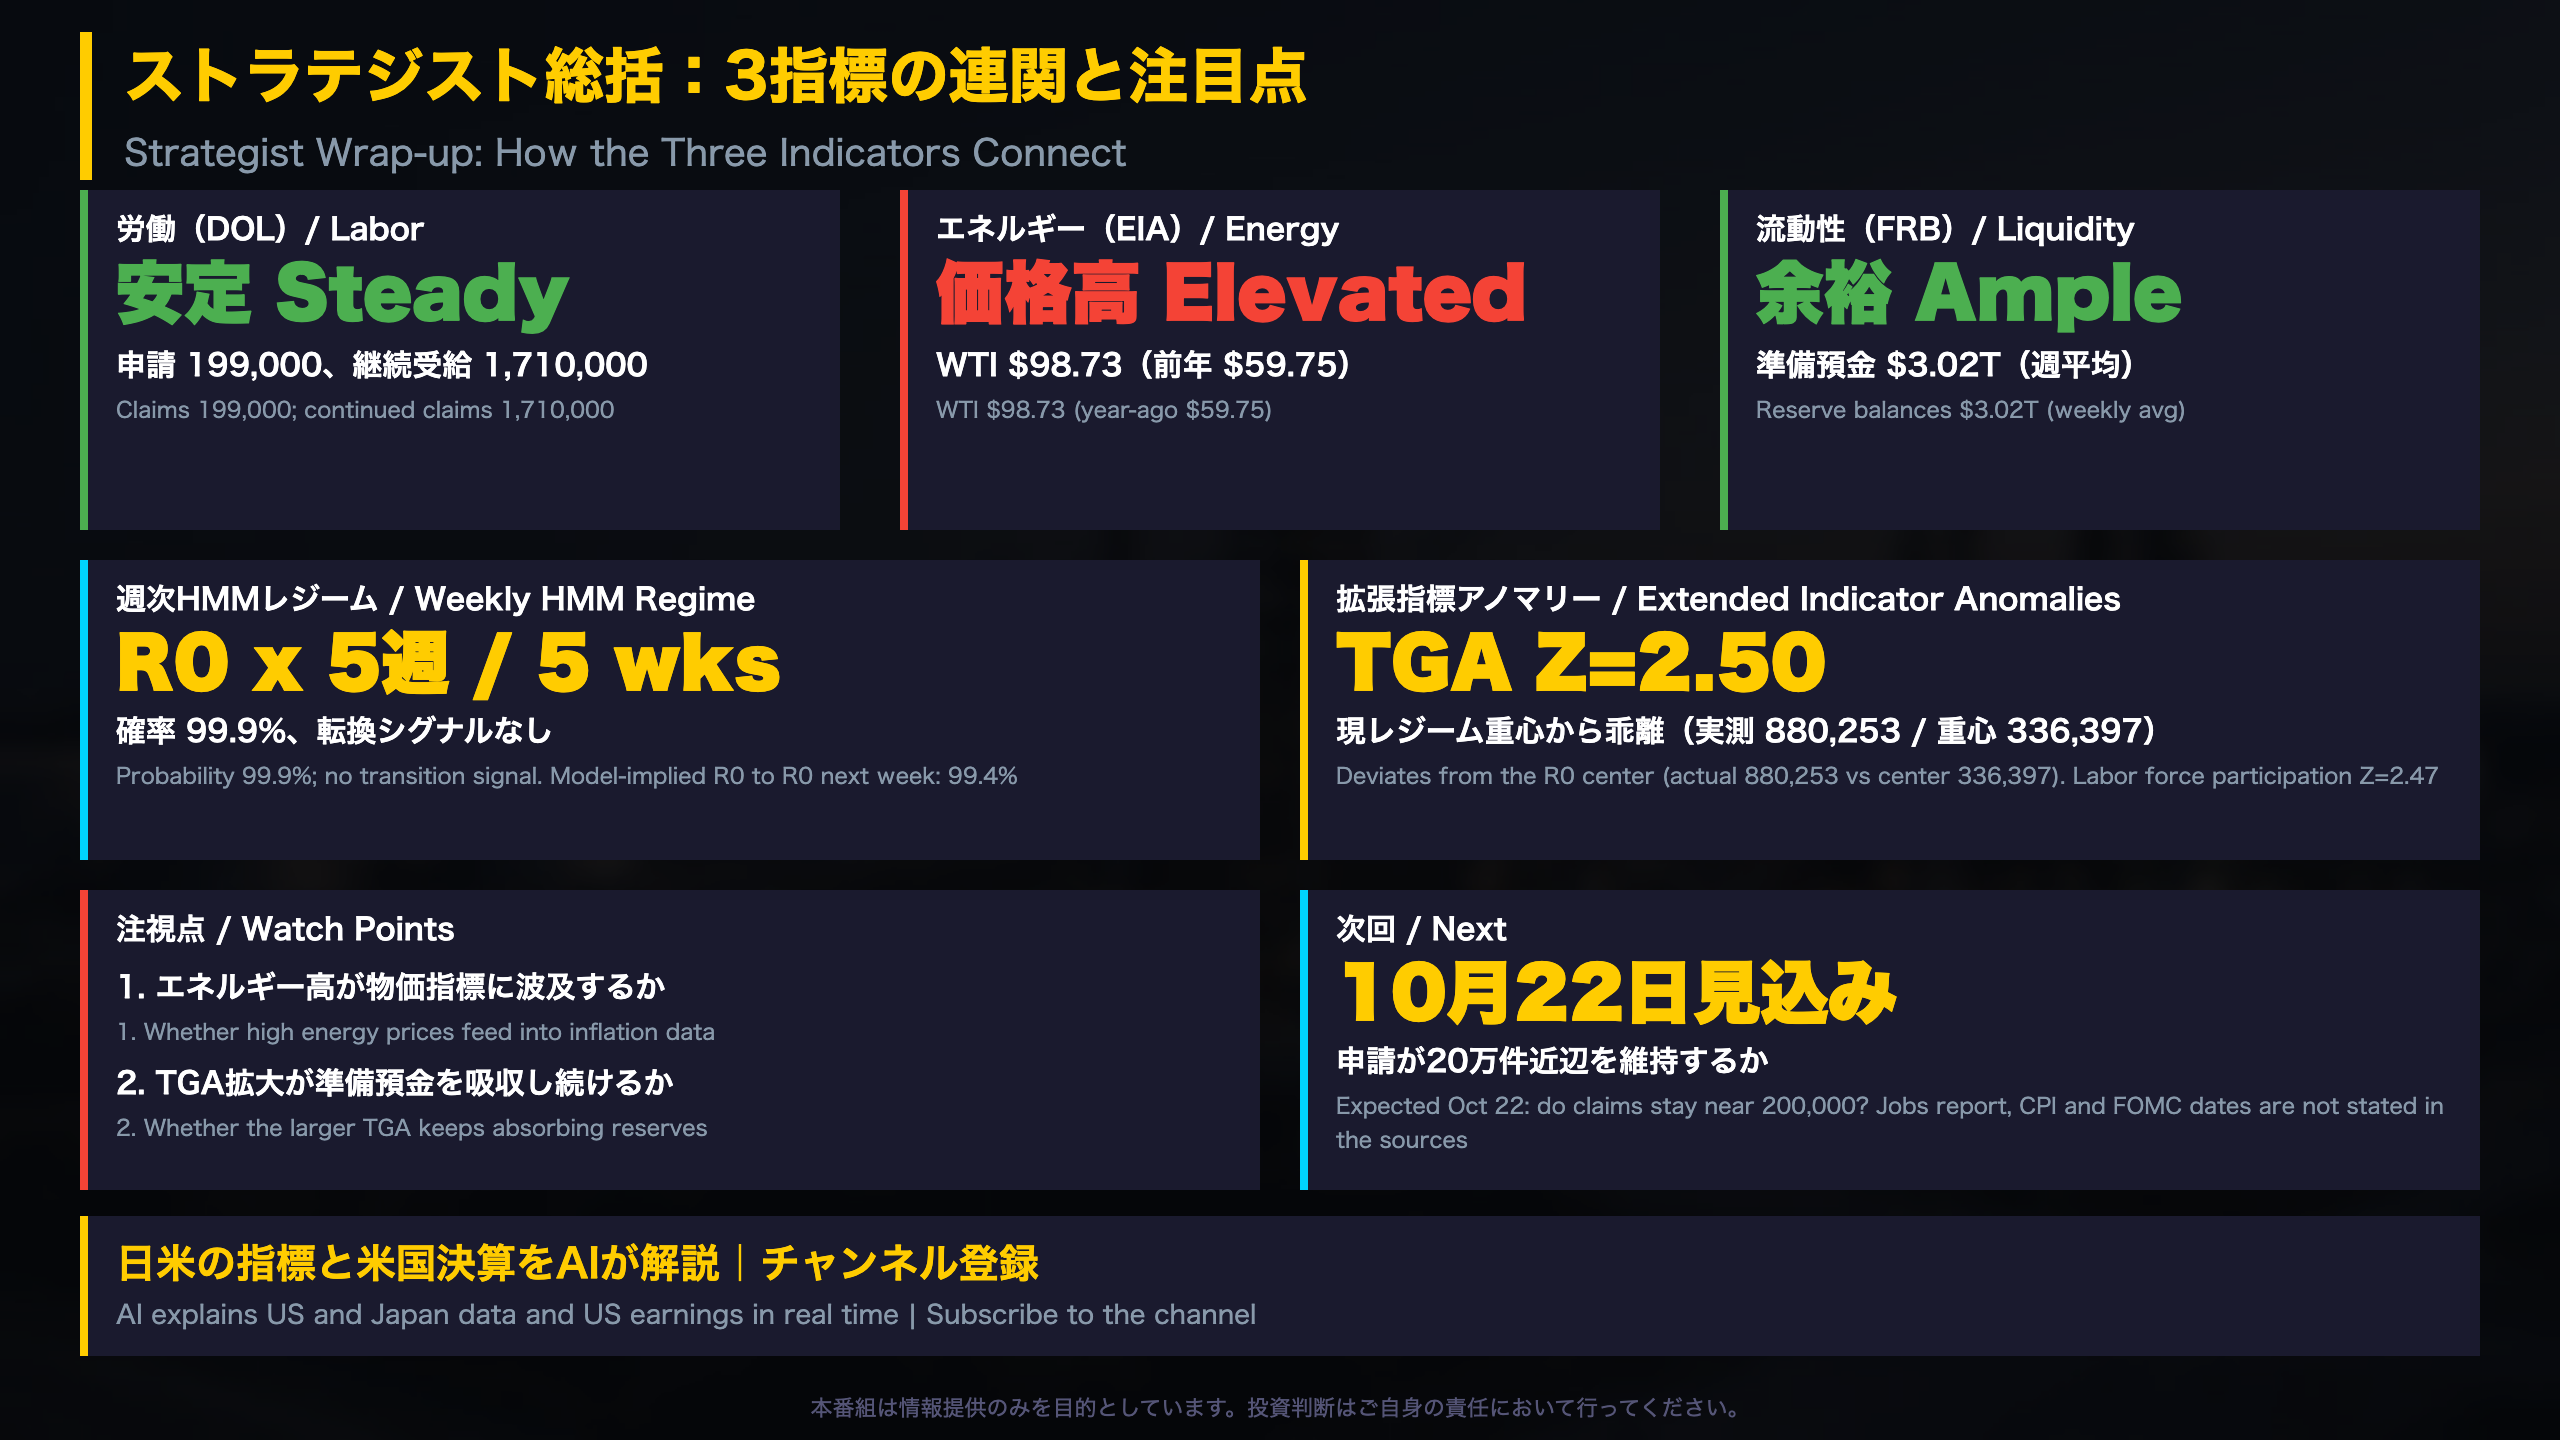
Connecting the three indicators
Framework. The DOL claims report tracks labor, the EIA report tracks the physical energy market, and the Fed’s H.4.1 tracks dollar liquidity. Reading them together shows whether growth, prices and financial plumbing point the same way.
Signal summary
- Labor: steady, with claims at 199,000 and continued claims at 1,710,000
- Energy: elevated, with WTI at 98.73 dollars versus 59.75 a year earlier
- Liquidity: ample, with reserves of about 3.02 trillion dollars
The signals are not aligned: two look steady, and one adds price pressure.
Quant overlay
The weekly hidden Markov regime model has read R0 for five consecutive weeks, with 99.9 percent probability and a 99.4 percent model-implied chance of staying in R0 next week. Among indicators outside the model, the Treasury General Account shows a Z-score of 2.50 against the R0 center, and the labor force participation rate shows 2.47 (61.8 versus a 62.731 center). Lower participation can be consistent with low claims, but one reading cannot confirm that link. No indicator exceeds the Z of 3.0 warning level.
What to monitor
- Whether high energy prices show up in inflation data
- Whether the Treasury account keeps absorbing reserves
The sources do not give dates for the jobs report, CPI or FOMC. The next weekly claims, EIA and H.4.1 releases are expected on October 22.
Disclaimer: This article is for informational purposes only. All investment decisions are made solely at your own risk.