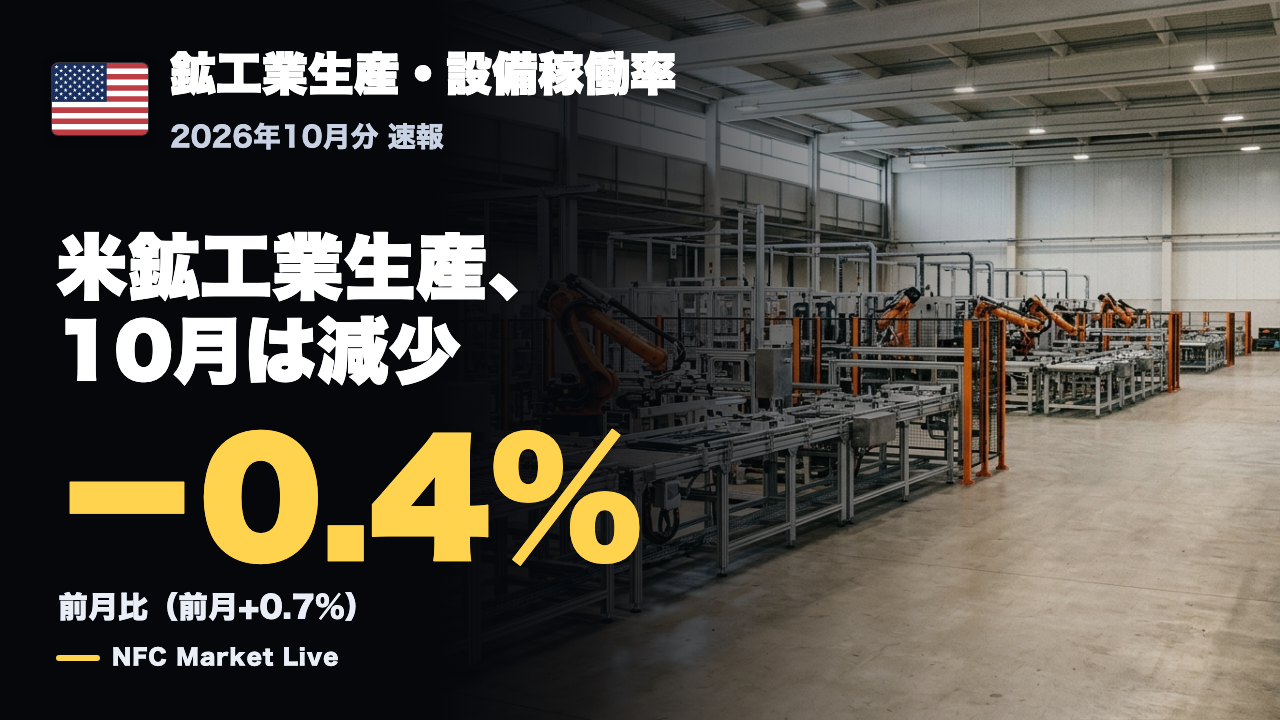
This article was automatically generated by the NFC Market Live AI analysis system. (Updated: 2026-11-17 23:30 JST)
📄 Primary Source
Federal Reserve
https://www.federalreserve.gov/releases/g17/current/g17.pdf
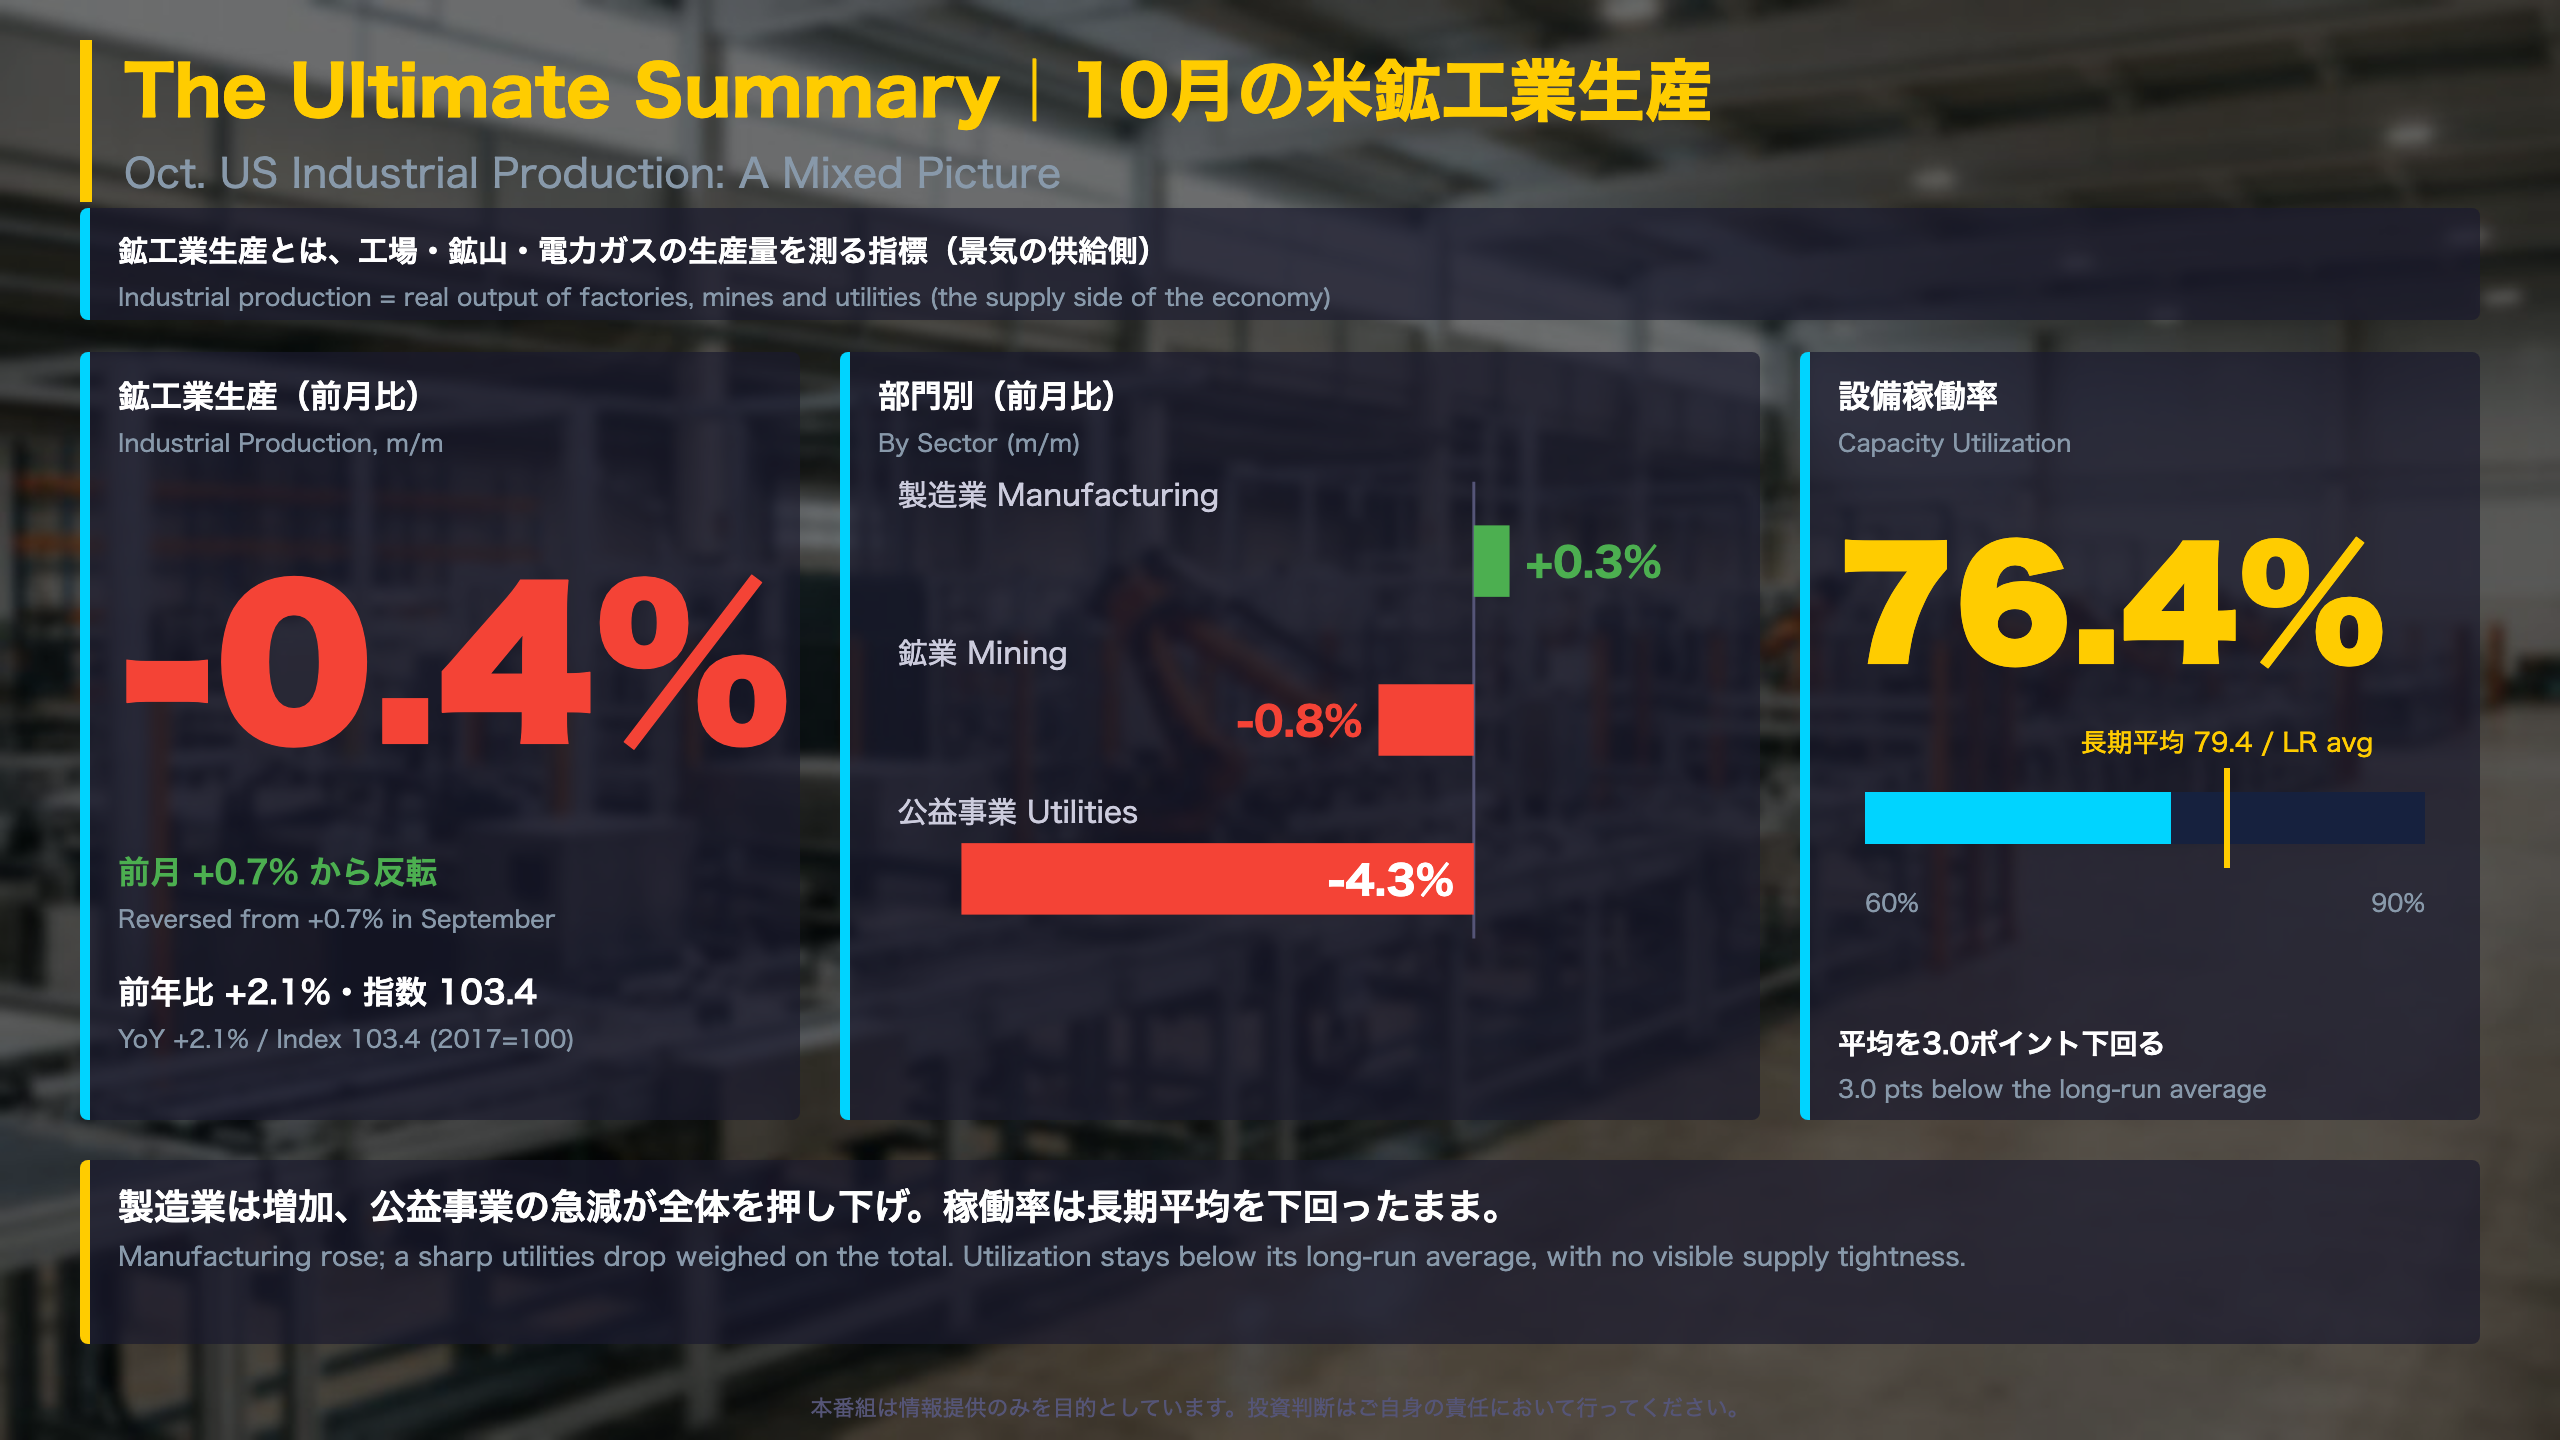
📊 A walkthrough of the Fed’s G.17 release on October industrial production (Nov 17). Total output fell 0.4% m/m after a 0.7% gain in September, and is up 2.1% y/y.
📉 Utilities dropped 4.3%, while manufacturing rose 0.3% and business equipment rose 1.0%.
💡 Manufacturing excluding motor vehicles and parts edged down 0.1%, so the gain was concentrated in autos.
⚠️ Capacity utilization was 76.4%, below its 79.4% long-run average. The release shows no sign of supply tightness.
📅 Annual revision on Nov 24; next regular release on Dec 16.
The Ultimate Summary|10月の米鉱工業生産
What is the G.17 release?
The G.17 is the Federal Reserve Board’s monthly statistical release on industrial production (IP) and capacity utilization. IP measures the real output of manufacturing, mining, and electric and gas utilities, indexed to 2017 = 100. It differs from the ISM manufacturing survey, which is a diffusion index of business sentiment, and from Japan’s METI index of industrial production, which uses a similar concept but a different industry coverage.
October at a glance
- Total IP: -0.4% m/m to 103.4, after +0.7% in September; +2.1% y/y
- Q3 annualized: +2.5%
- Manufacturing: +0.3%; excluding motor vehicles and parts, -0.1%
- Mining: -0.8%; Utilities: -4.3% after +4.4%
- Capacity utilization: 76.4% vs. 76.8% in September (revised), 3.0 points below the 1972-2025 average of 79.4%
“Industrial production (IP) decreased 0.4 percent in October after increasing 0.7 percent in September.”
Balanced reading
The positives are real: factory output grew, business equipment rose 1.0%, and the year-over-year pace is still +2.1%. The negatives are also real: consumer goods fell 0.7%, and the factory gain leaned heavily on motor vehicles. Because utilities swing widely with little link to underlying demand in a given month, the headline decline should be read together with the sector breakdown.
What to watch
The Fed will publish its annual revision on November 24 (base year moving to 2022), which can change past levels and growth rates. The next regular release is December 16. This program does not forecast markets; the points above are drawn from the release itself.
公益事業の反動と、製造業の底堅さ
Utilities: a large, noisy swing
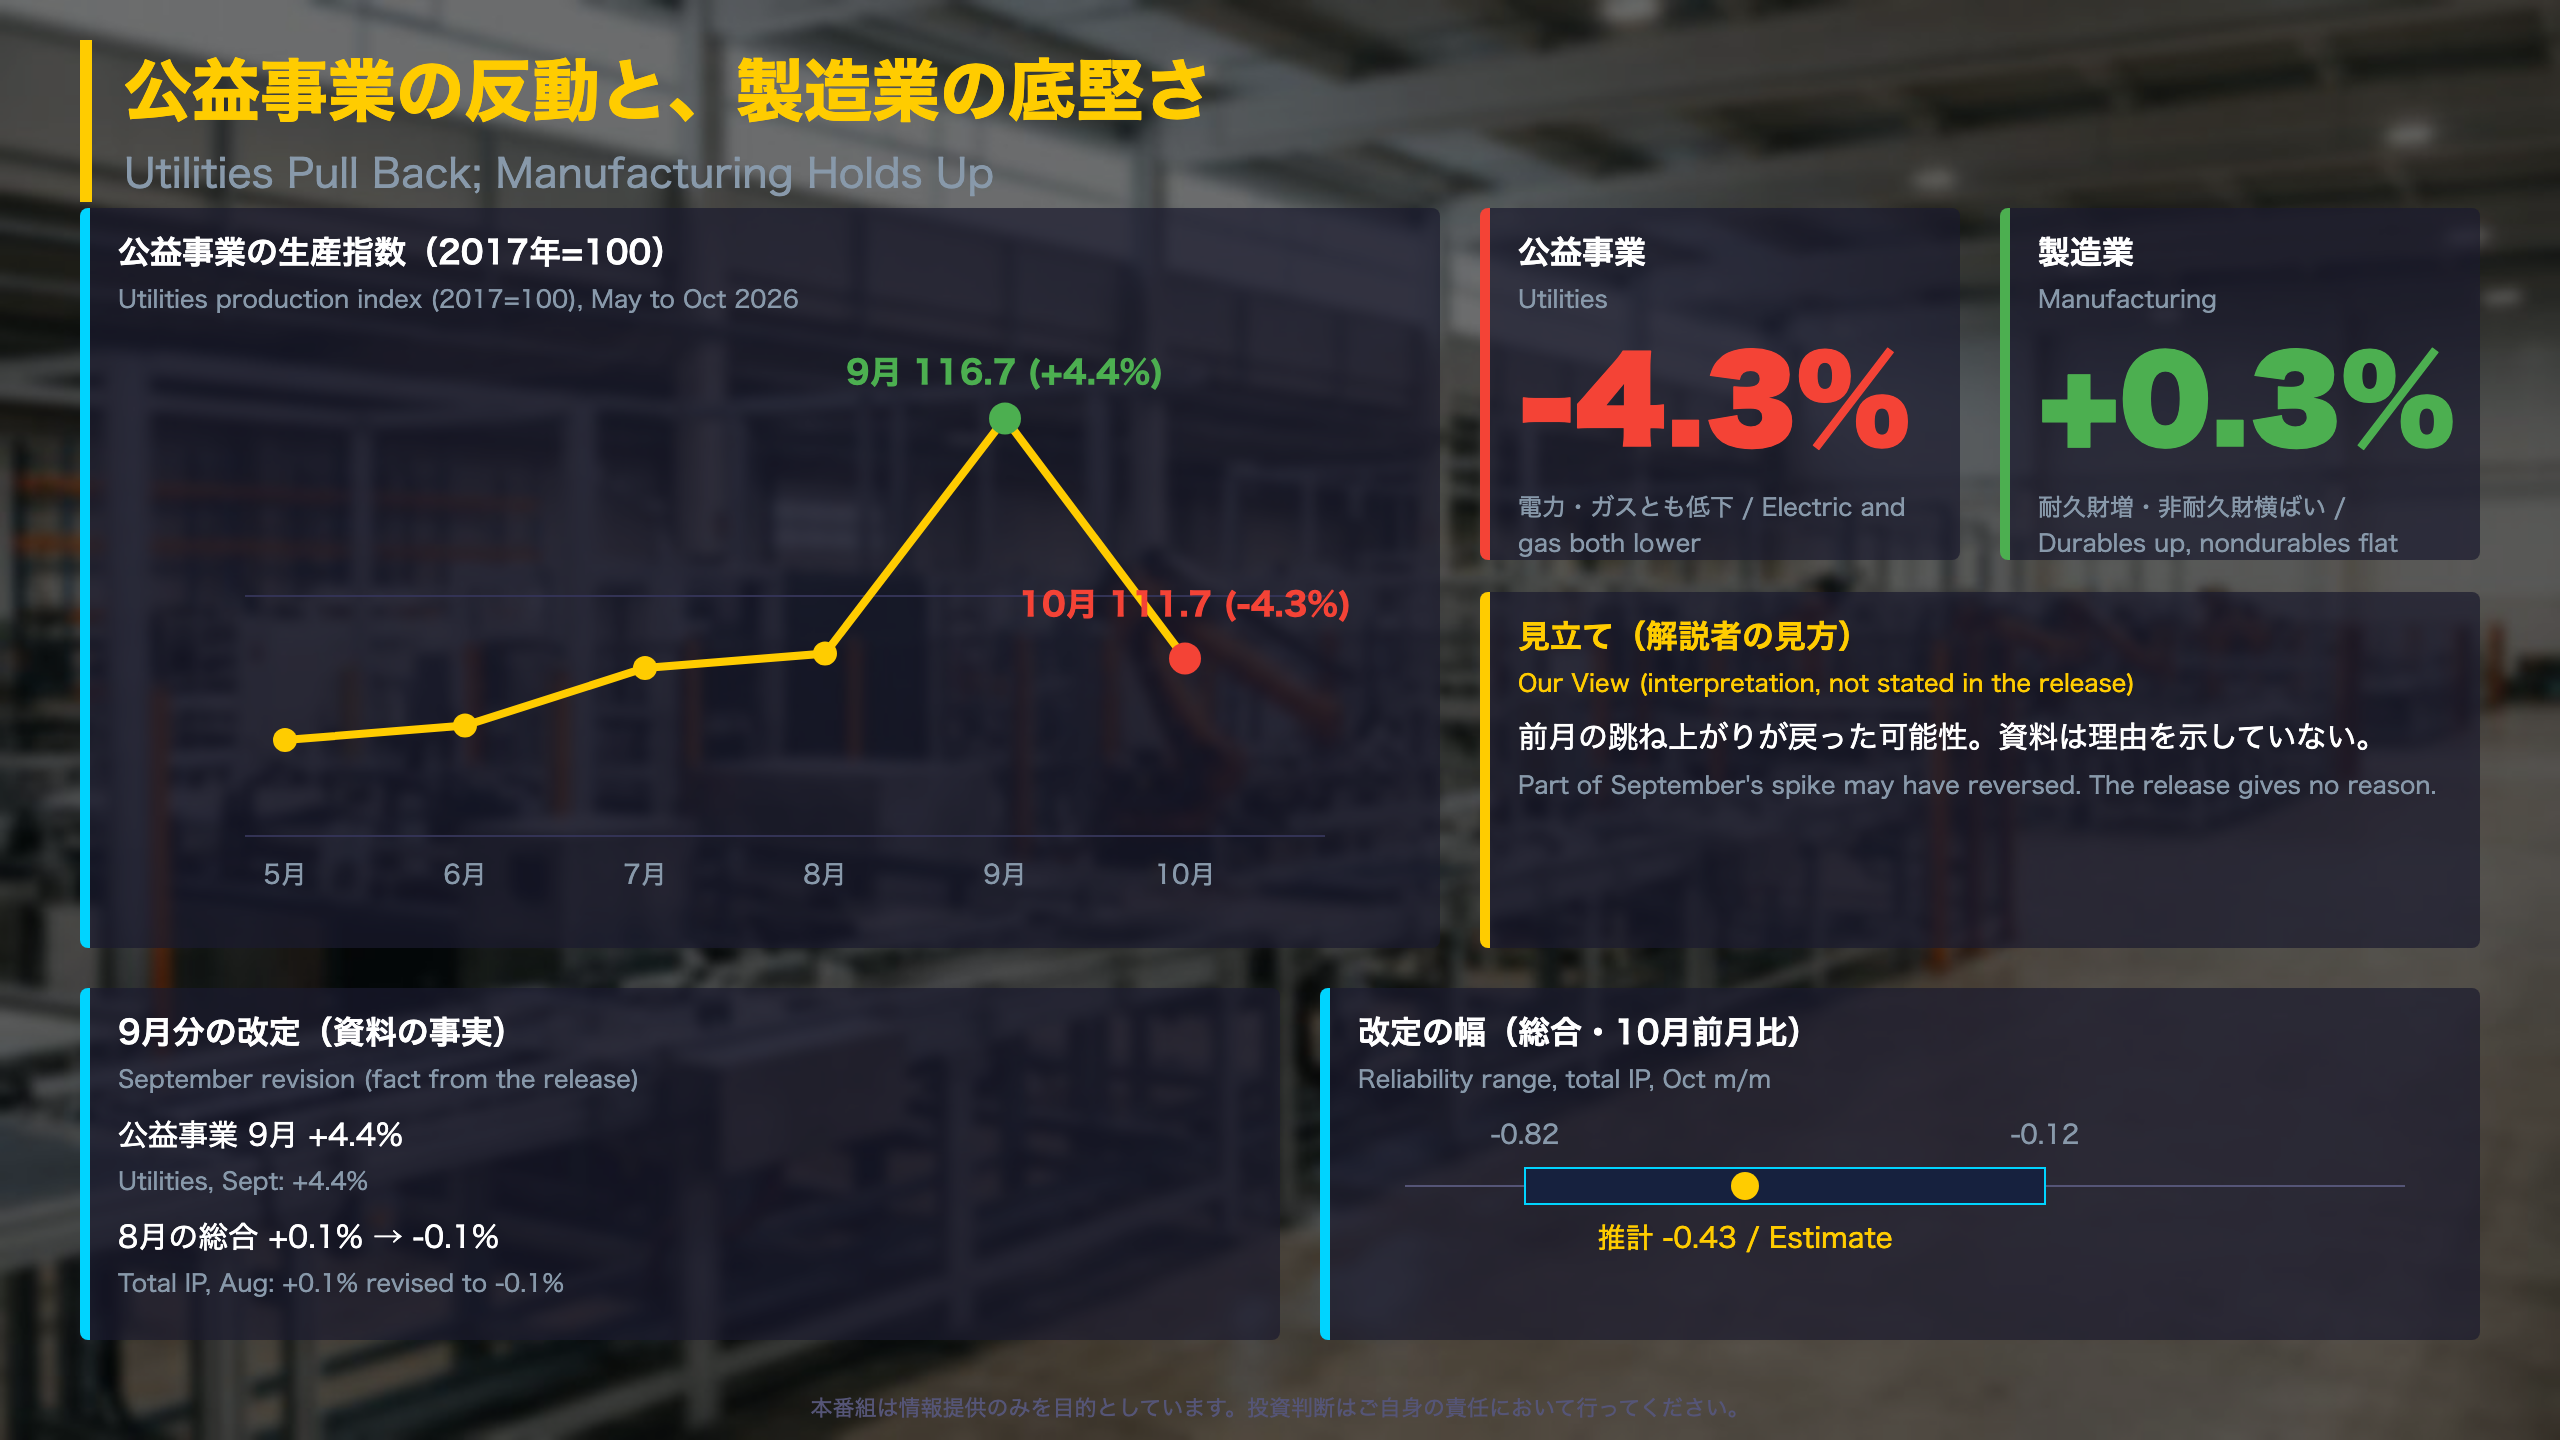
The utilities index (2017 = 100) ran 110.0, 110.3, 111.5, 111.8, 116.7 and 111.7 from May through October. After the September jump, October returned roughly to the July-August range.
Revisions matter here
September’s utilities gain was 3.5% in the previous release and is now 4.4%. Interestingly, September’s index level was revised down (117.3 to 116.7), but August was revised down more (113.3 to 111.8), which lifted the growth rate. This is the kind of revision pattern that makes single-month utilities prints hard to read.
The Fed’s reliability table gives a sense of the uncertainty: for October, the total index change of -0.43% has an 85th-percentile outcome of -0.12% and a 15th-percentile outcome of -0.82%. For utilities, the figures are -4.25%, -2.35% and -6.03%. Historically the first-to-fourth estimate revision for total IP averages 0.24 percentage point.
Two readings
- Payback view: much of the October drop reverses September’s spike, leaving utilities near their summer level.
- Cautious view: the release gives no reason for the swing, so attributing it to a specific driver such as weather is not supported by the document.
Context for non-US readers
Utilities carry roughly a 12% weight in US IP, comparable in concept to the utilities component in Japan’s METI production index, so large utilities moves can dominate the headline even when factory output is steady. Here, manufacturing still rose 0.3% (durables +0.5%, nondurables flat), while mining fell 0.8%.
This summary describes the release; it is not a market forecast.
生産の中身と設備稼働率
Breadth of the October move
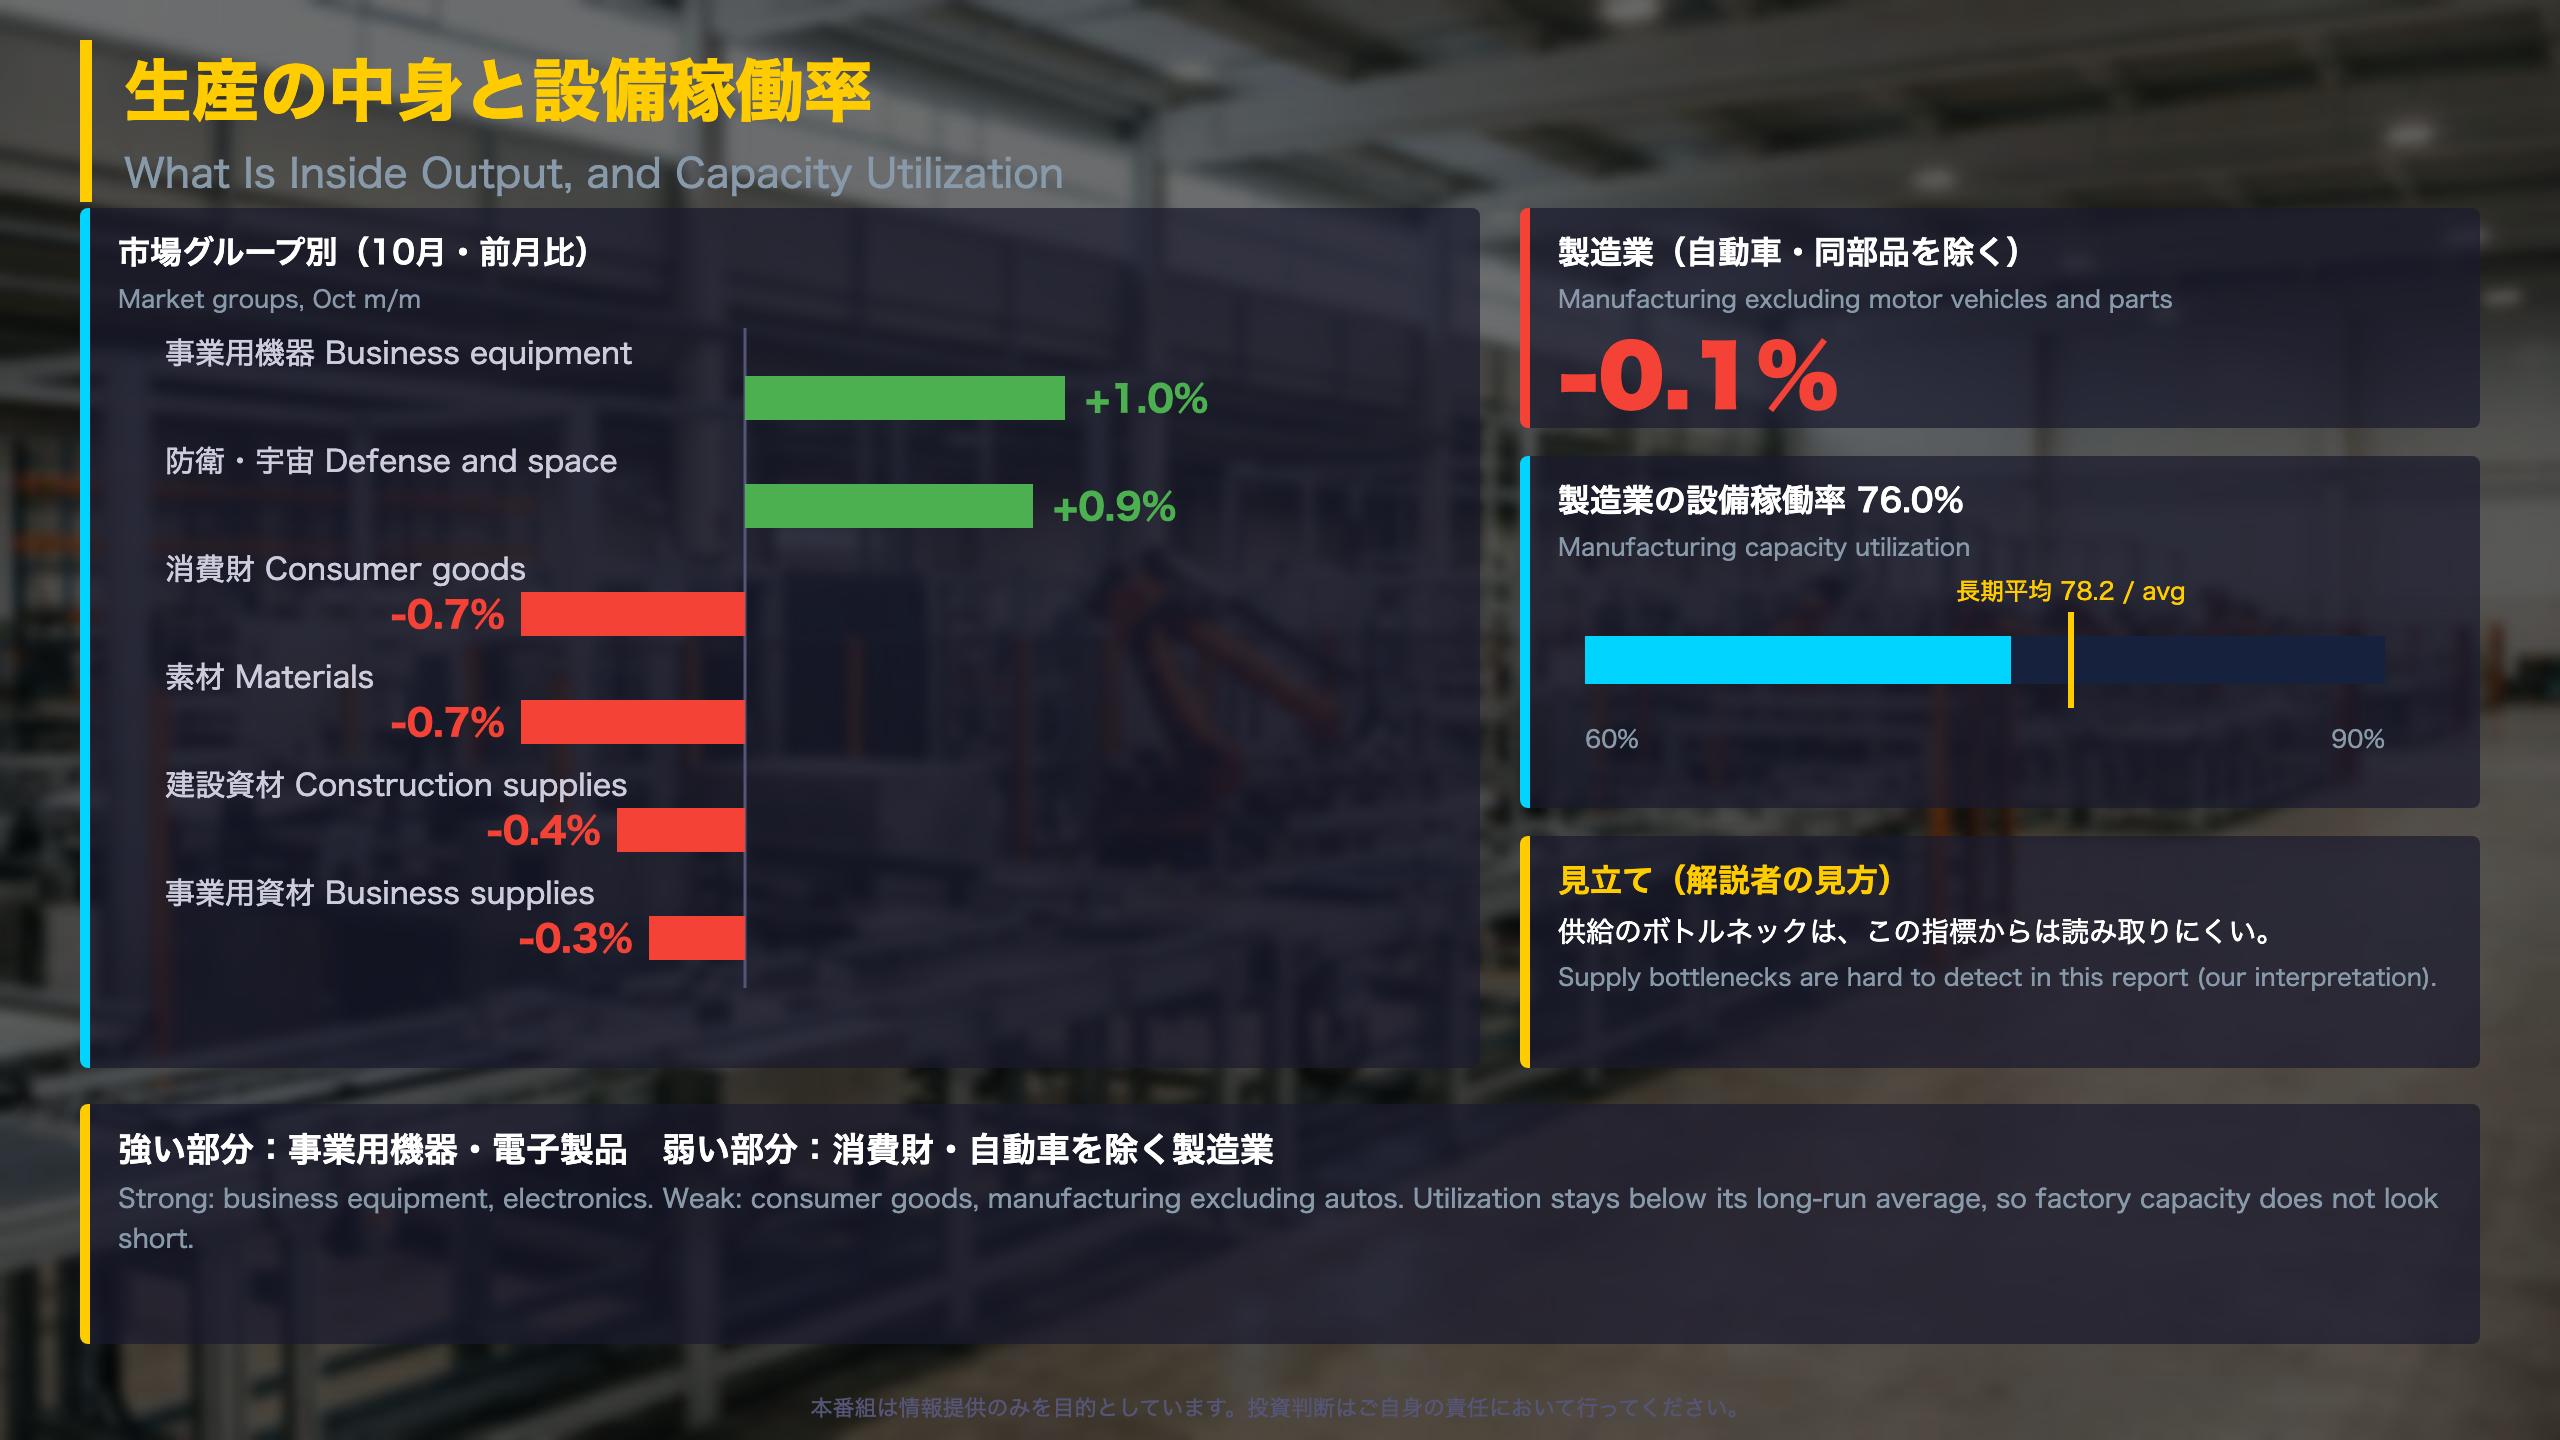
Market groups were mixed. Business equipment rose 1.0% and defense and space equipment rose 0.9%, while consumer goods (-0.7%), construction supplies (-0.4%), business supplies (-0.3%) and materials (-0.7%, with energy materials -2.2%) all fell.
“The major market groups posted mixed results in October.”
Inside manufacturing
Durable manufacturing rose 0.5%, led by motor vehicles and parts (+4.4%). Nondurables were unchanged. Light-vehicle assemblies, an annualized series, rose to 10.41 million units from 10.02 million in September. In the third quarter, semiconductors and related components had grown at a 21.9% annualized rate, a high-technology theme that is separate from the autos story in October. Computers and electronic products rose 1.4% this month, while electrical equipment and appliances fell 2.4%.
Why capacity utilization matters
Capacity utilization is output divided by sustainable maximum output. Manufacturing stood at 76.0%, 2.2 points below its 1972-2025 average of 78.2%, but above 75.1% a year earlier. By stage of process: crude 83.9% (average 84.5%), primary and semifinished 76.0% (80.1%), finished 74.0% (76.6%). In other words, no major stage is running above its long-run norm, which is what a supply bottleneck would typically look like. The Fed’s own note says its utilization rates tend to run higher than Census survey rates, so the level should be read against the Fed’s own history, not compared with other surveys.
Comparison with other gauges
Unlike the ISM manufacturing PMI, which captures business sentiment, G.17 measures physical output, so a soft PMI and rising output can coexist. This summary reports the release’s content; it does not forecast Fed policy or currency moves.
質疑で深める:製造業の強さと稼働率
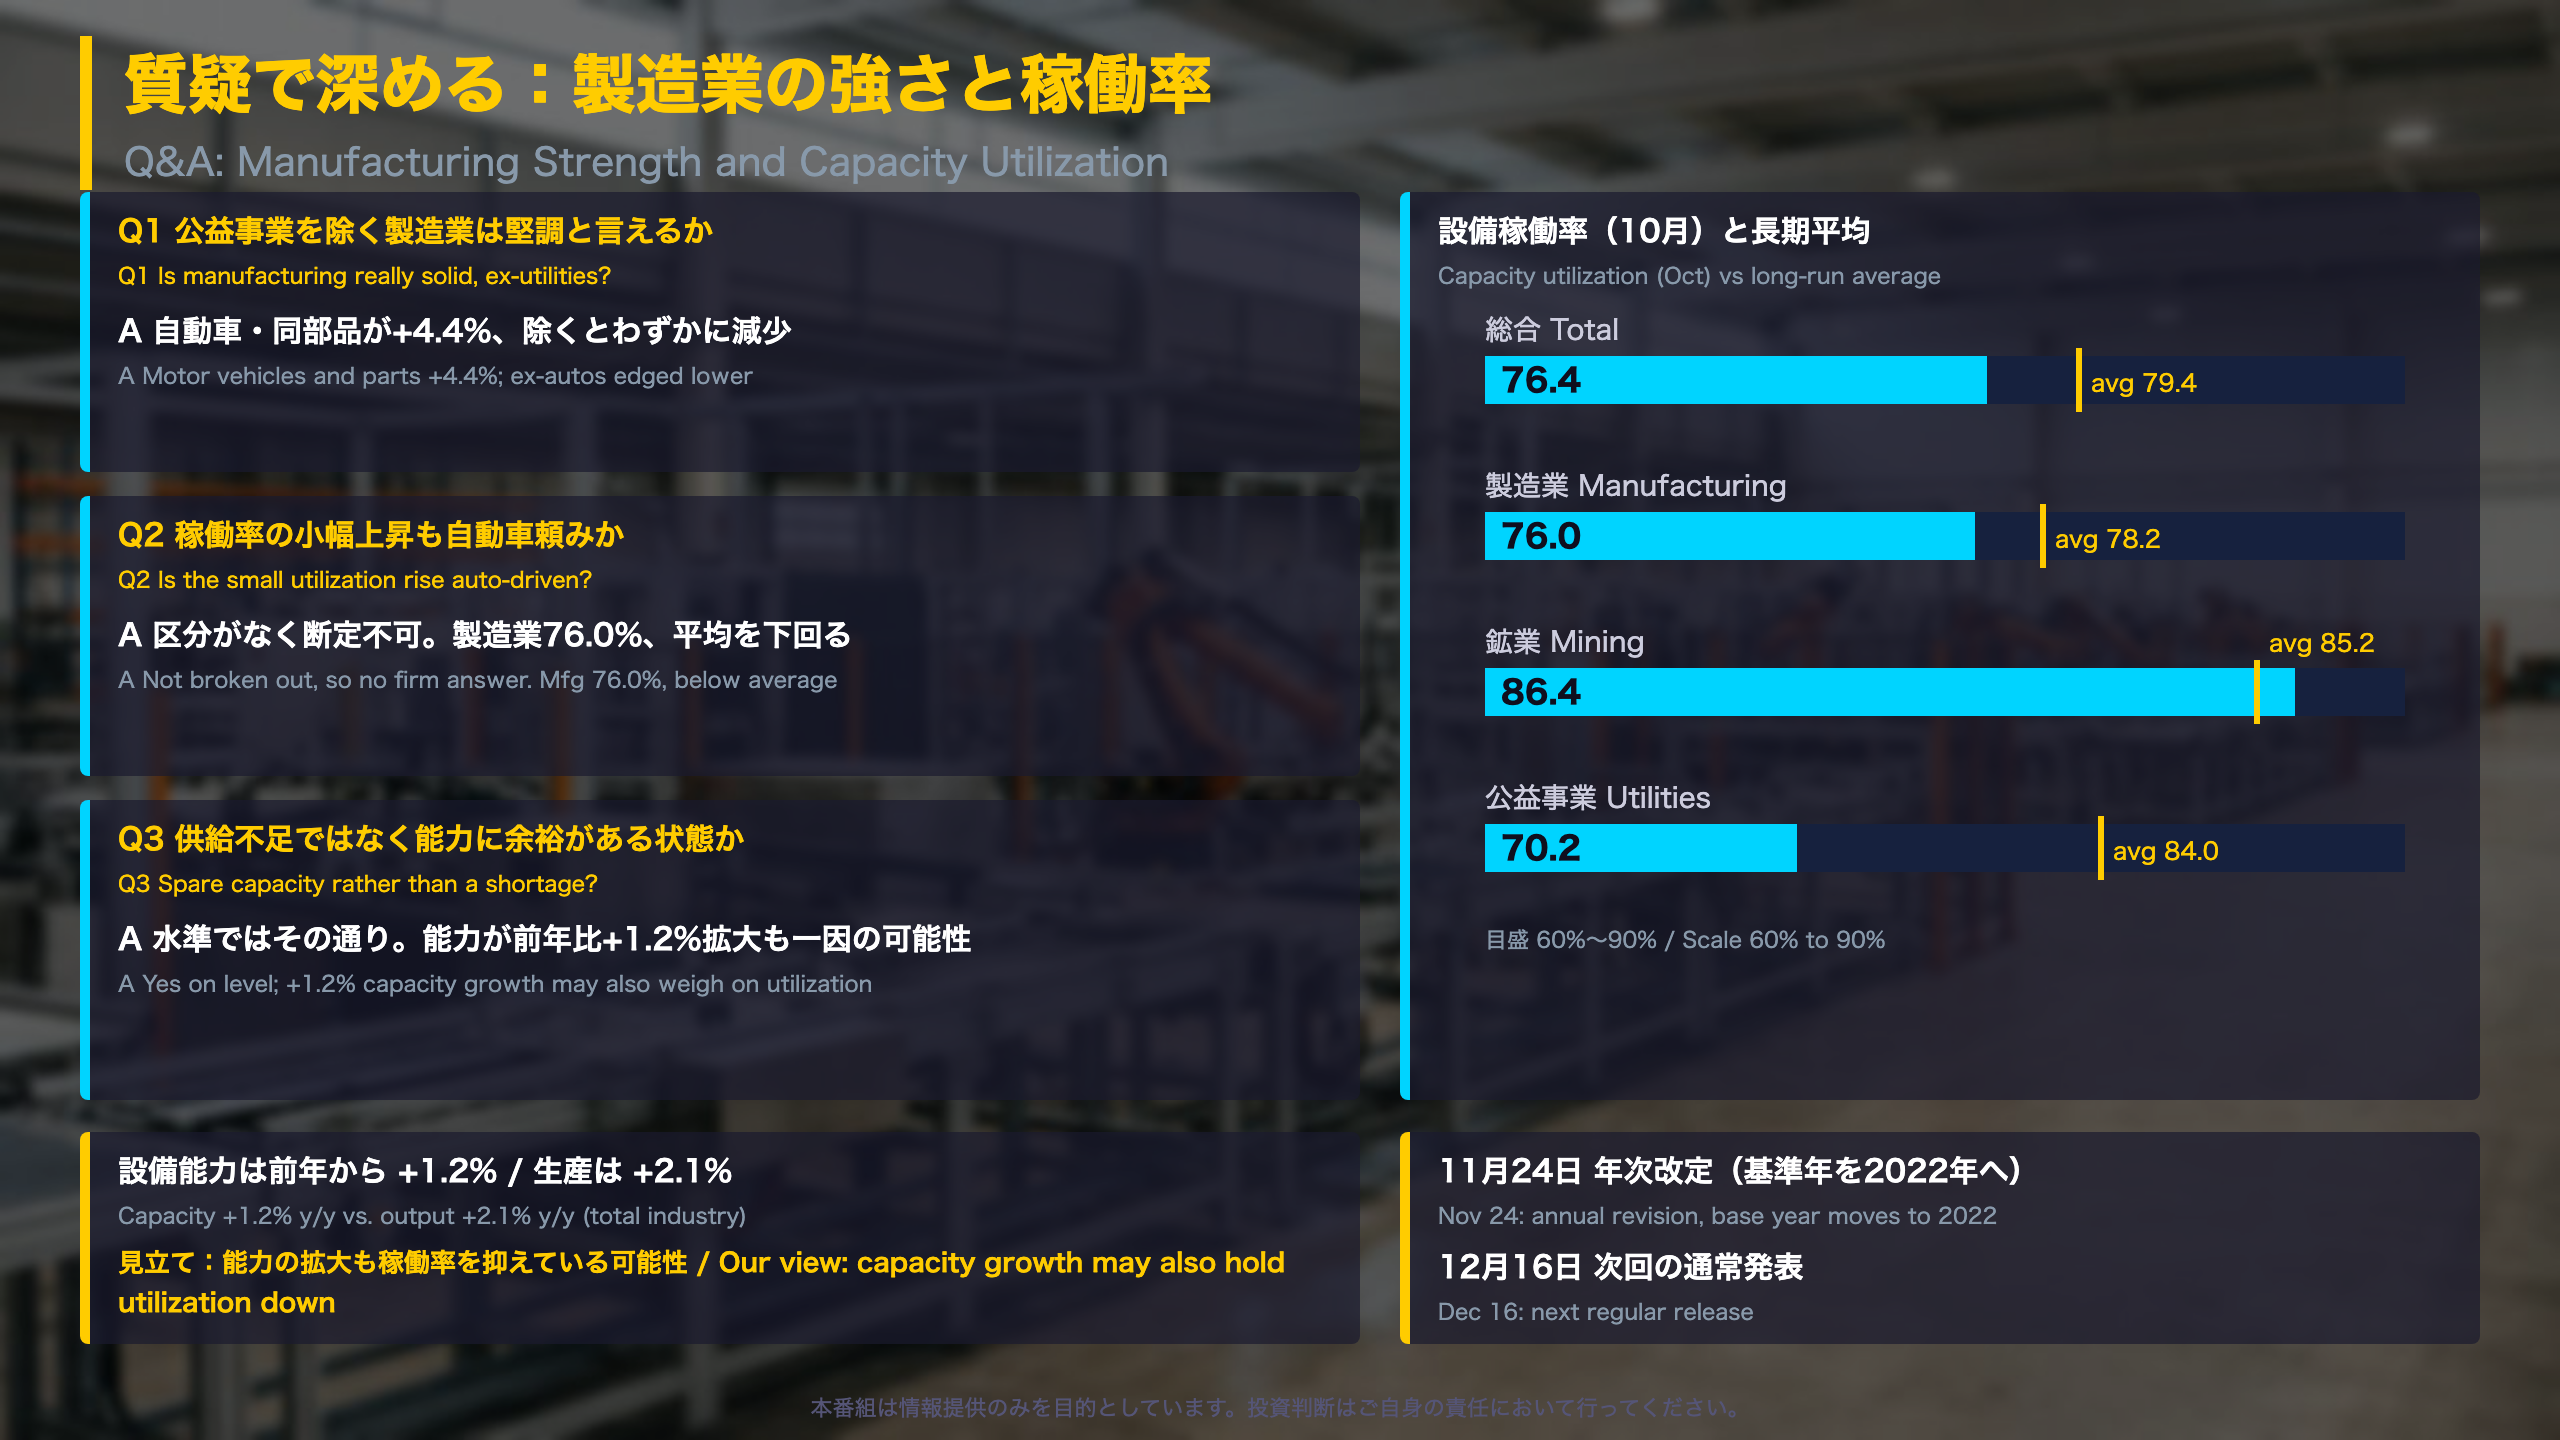
Utilization at a glance
| Segment | Oct 2026 | 1972-2025 avg | Gap |
|---|---|---|---|
| Total industry | 76.4% | 79.4% | -3.0 pt |
| Manufacturing | 76.0% | 78.2% | -2.2 pt |
| Mining | 86.4% | 85.2% | +1.2 pt |
| Utilities | 70.2% | 80.1% | -9.9 pt |
“Capacity utilization dropped to 76.4 percent in October, a rate that is 3.0 percentage points below its long-run (1972-2025) average.”
Total utilization was 76.8% in September (revised) and 75.6% a year ago. For context, the 1994-95 peak was 85.0% and the 2009 trough was 66.5%, so today’s reading sits well on the slack side of the historical range.
Capacity growth is part of the story
Total industrial capacity grew 1.2% over the past year, while output rose 2.1%. Because capacity expands nearly as fast as output, utilization has stayed in a narrow band. This suggests that a modest utilization level can reflect new capacity as well as soft demand, and the release alone cannot separate the two.
Two views
- Slack view: utilization below average implies supply is not binding.
- Cautious view: the Fed’s capacity estimates are model-based and, by its own note, run higher than Census survey rates, so levels should be judged against the Fed’s own history.
What is next
The annual revision lands on November 24 (base year 2022, with Census capacity survey data through Q4 2025). The next regular release is December 16. For comparison, Japan’s METI publishes a similar capacity utilization index, but US and Japanese levels are not directly comparable because definitions differ. This article describes the release and does not forecast Fed policy or exchange rates.
Disclaimer: This article is for informational purposes only. All investment decisions are made solely at your own risk.