📺 Watch the Full Video Analysis
This article was automatically generated by the NFC Market Live AI analysis system. (Updated: 2026-07-25 07:11 JST)
📄 Primary Source
米国労働省(DOL)— 新規失業保険申請件数
https://www.dol.gov/newsroom/releases/eta/eta20260723
米国エネルギー情報局(EIA)— 週間石油状況レポート
https://www.eia.gov/petroleum/supply/weekly/pdf/highlights.pdf
連邦準備制度理事会(FRB)— H.4.1 バランスシート
https://www.federalreserve.gov/releases/h41/current/h41.htm
A full breakdown of this week’s three key US macro releases.
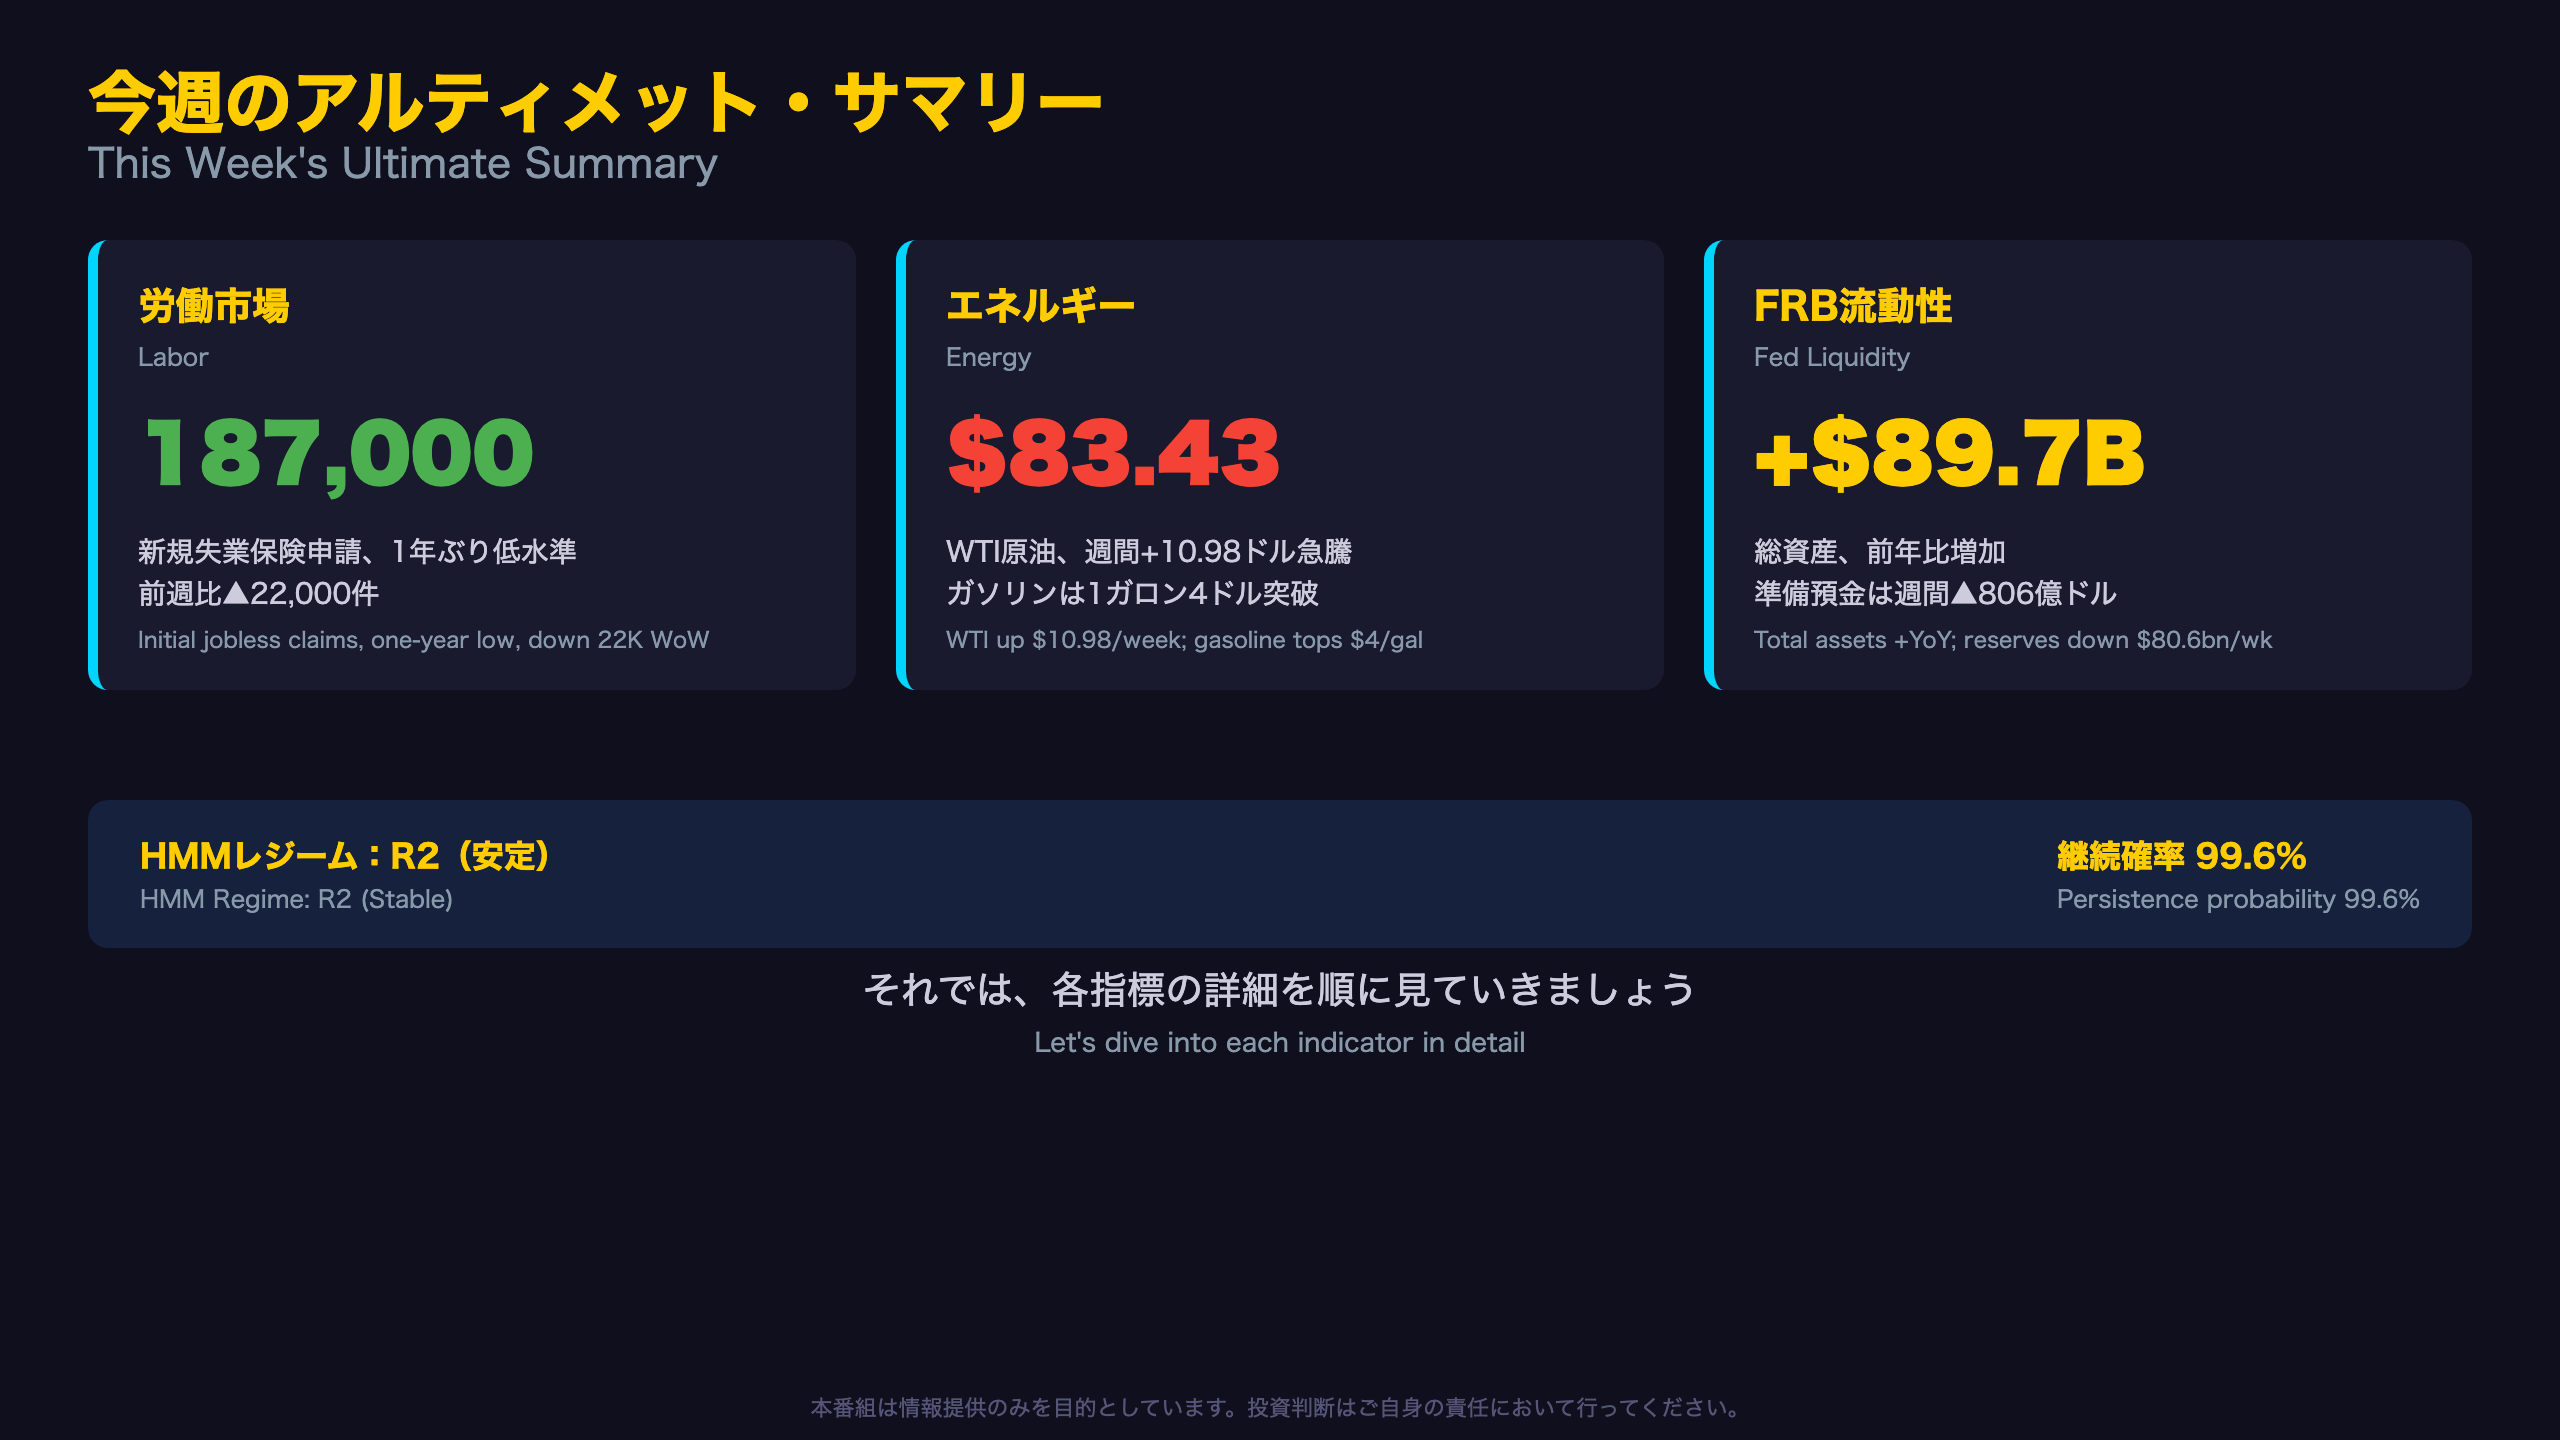
📊 DOL initial jobless claims fell to 187K, the lowest in a full year
🛢️ EIA data shows WTI crude jumping $10.98 in a week to $83.43
🏦 Fed’s H.4.1 shows total assets up $89.7bn YoY, even as reserve balances dropped $80.6bn in a week amid Treasury cash rebuilding
Labor resilience, an energy-driven inflation warning, and tightening liquidity at the margin — we unpack the full picture for investors.
⚠️ For informational purposes only. Not investment advice.
今週のアルティメット・サマリー
A Statistically Stable Regime
Our proprietary weekly Hidden Markov Model (HMM) analysis classifies the current US macro state as Regime “R2,” with a 100% probability held for five consecutive weeks, and a 99.6% probability of persisting next week. The centroid distance (deviation from the regime’s typical pattern) has held flat at 1.7072 for three straight weeks — indicating a statistically stable environment overall.
But Sub-Indicators Are Flashing Deviations
Within this stable regime, individual components tell a more nuanced story. CPI gasoline (YoY +26.7%) and CPI energy (YoY +15.7%) both deviate sharply from this regime’s historical centroid values. This aligns directionally with the sharp energy price increases confirmed in this week’s EIA data, suggesting inflation pressure is starting to register as a statistical anomaly even within an otherwise “stable” macro backdrop.
Three Indicators at a Glance
| Indicator | This Week | Read |
|---|---|---|
| Labor (DOL) | Claims at 1-yr low | Resilient |
| Energy (EIA) | WTI +15%+ in a week | Inflation watch |
| Liquidity (Fed) | Assets +$89.7bn YoY | QT stalled |
For US and international investors, the key takeaway is that headline stability can mask meaningfully divergent undercurrents across the real economy and financial plumbing.
労働市場の現在地(DOL詳細)
Context: The Lowest Weekly Print in a Year
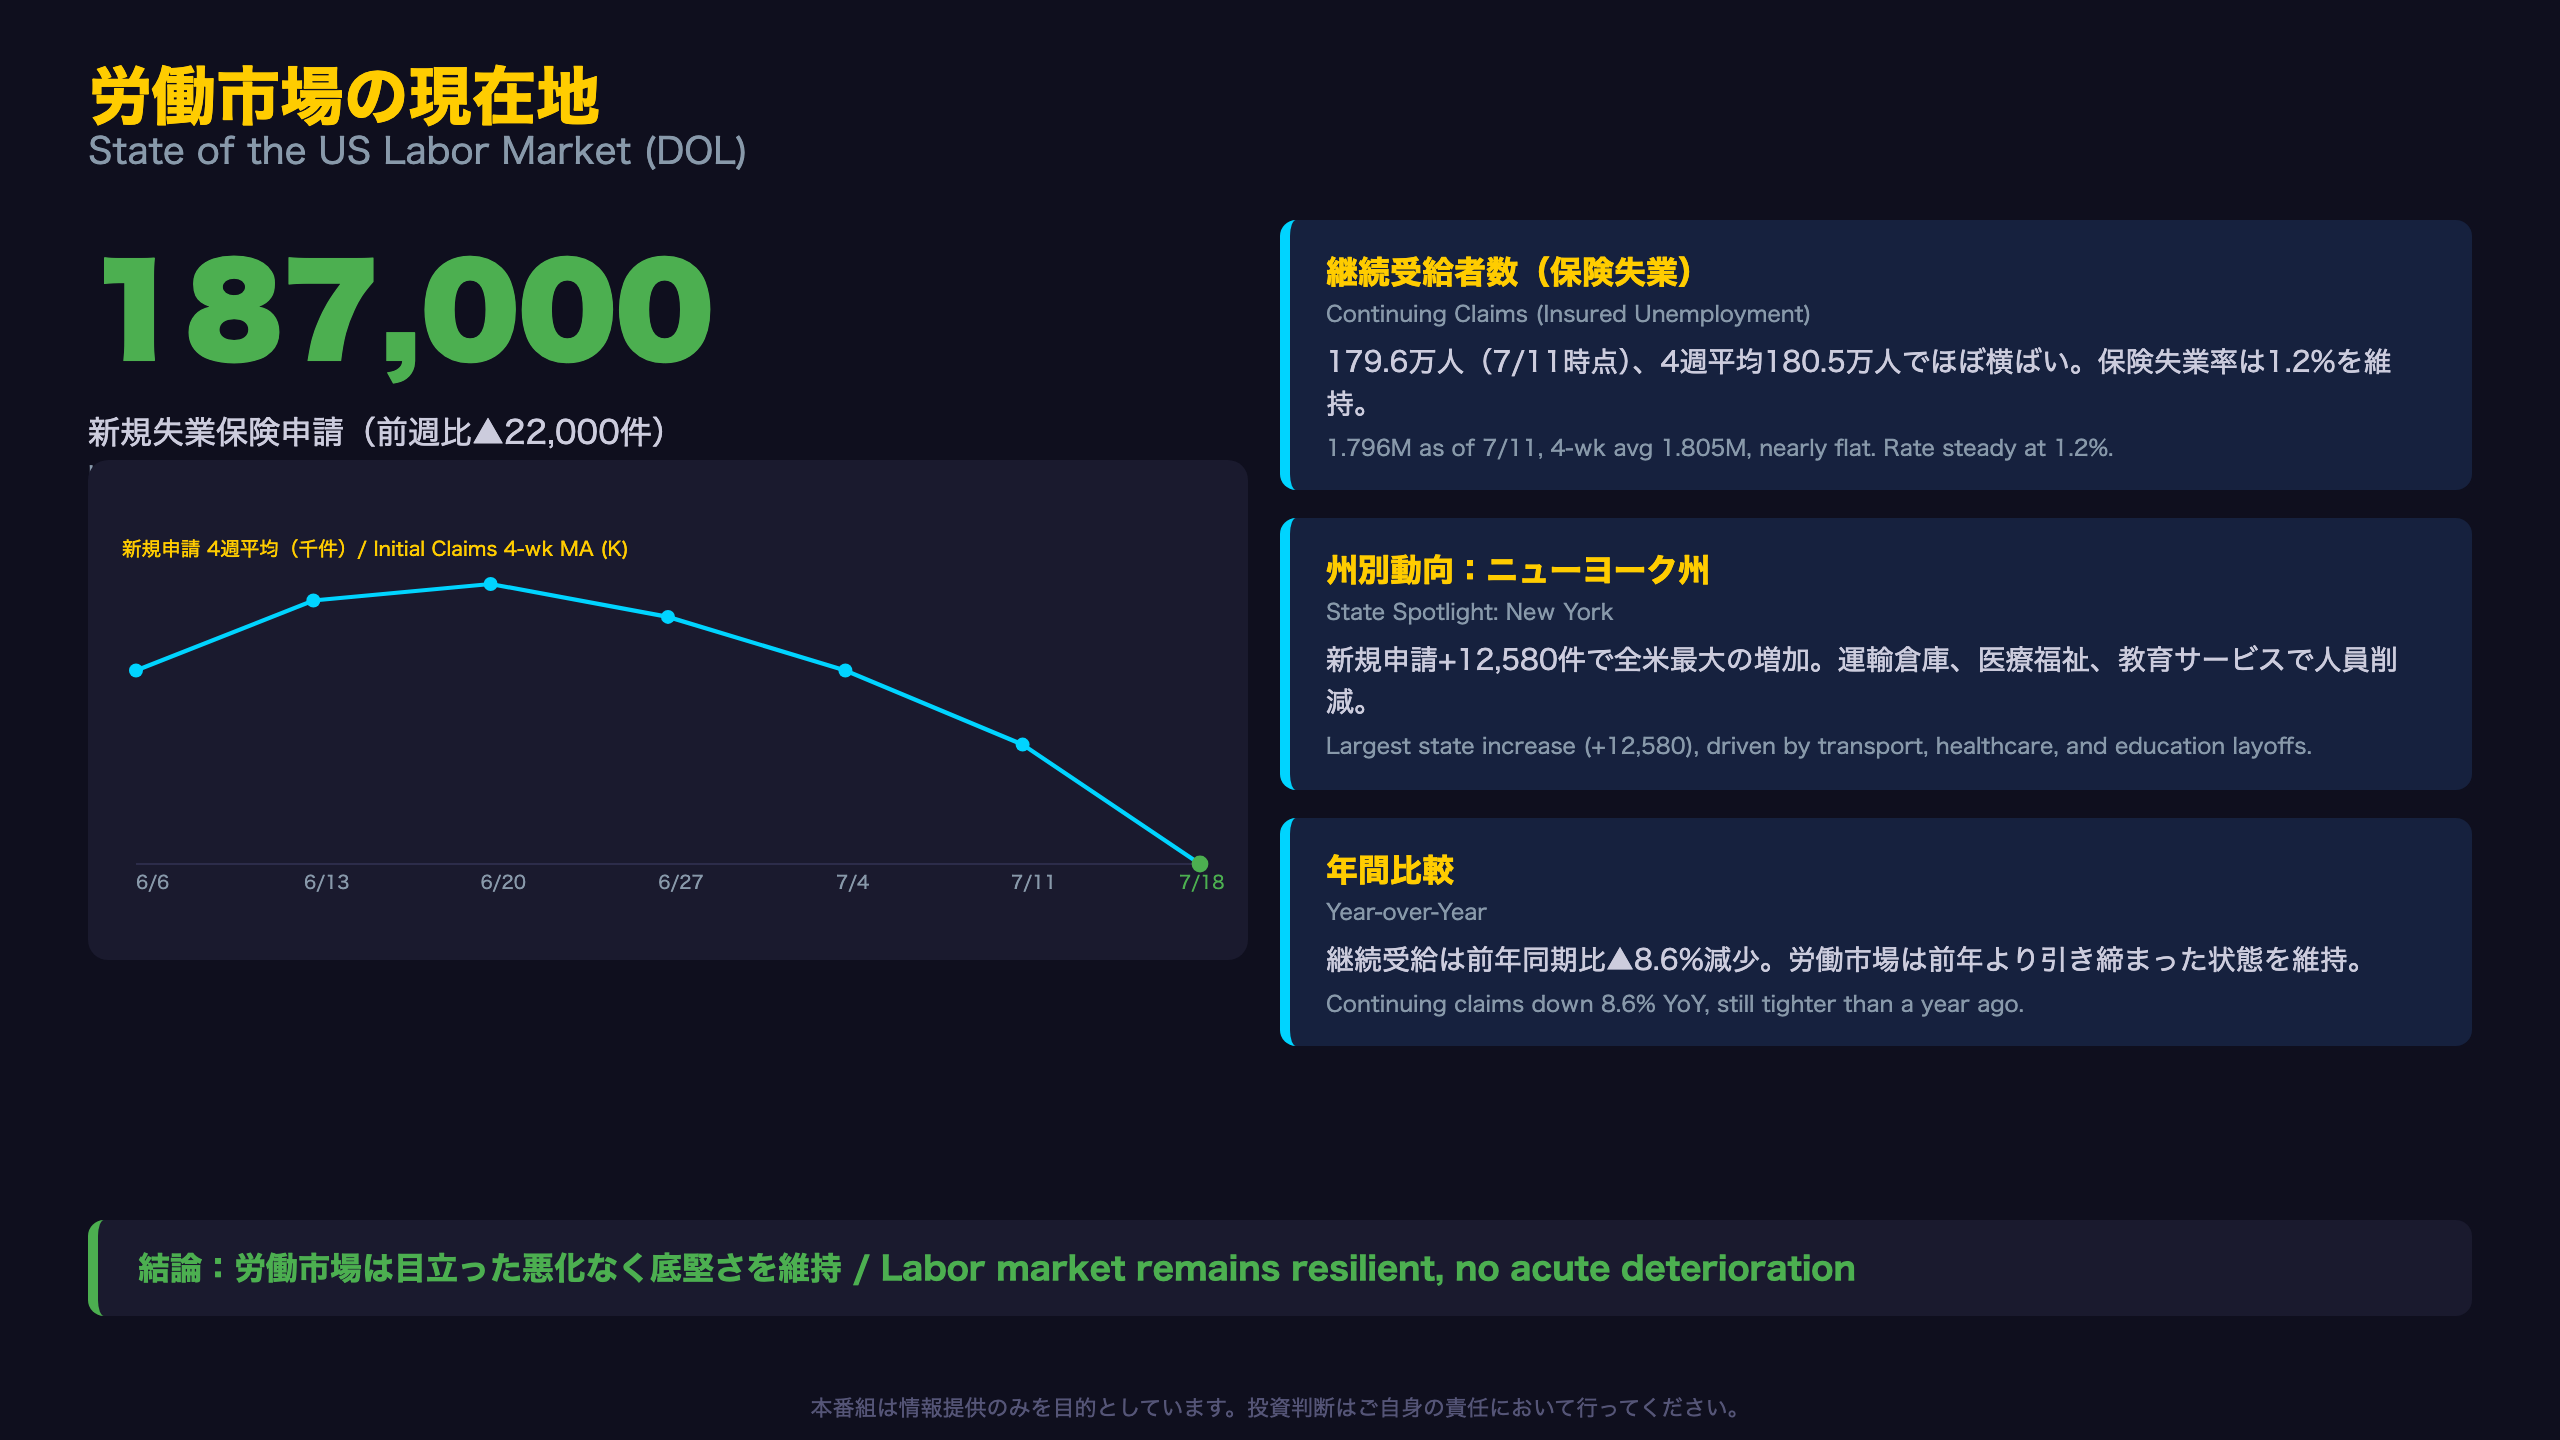
The US Department of Labor’s weekly claims report is a leading labor market indicator, tracked closely by the Federal Reserve as part of its employment mandate. A year ago, initial claims stood at 218,000; this week’s 187,000 print is the lowest weekly level across the entire reported one-year window, though DOL’s own technical notes flag July as a period of elevated seasonal volatility due to auto plant retooling shutdowns — a caveat international readers should weigh before over-extrapolating a single print.
State-Level Dispersion
New Jersey and Puerto Rico posted the highest insured unemployment rates at 2.6%, followed by Rhode Island at 2.3% — a pattern concentrated in the Northeast. New York, meanwhile, recorded the largest single-state increase in initial claims (+12,580), officially attributed to “layoffs in transportation and warehousing, healthcare and social assistance, and educational services industries.”
The Bigger Picture vs. US Peers
Total continued weeks claimed across all programs fell about 8.6% year-over-year (1.86 million vs. 2.04 million a year ago), reinforcing that despite week-to-week noise, the US labor market has not shown the sharp continuing-claims build that typically precedes a hiring slowdown. For investors benchmarking against the Fed’s dual mandate, this data supports a “no urgency to cut” reading on the labor side alone.
エネルギー需給の現在地(EIA詳細)
Demand Side Is Actually Strong: Transport Fuels All Up YoY
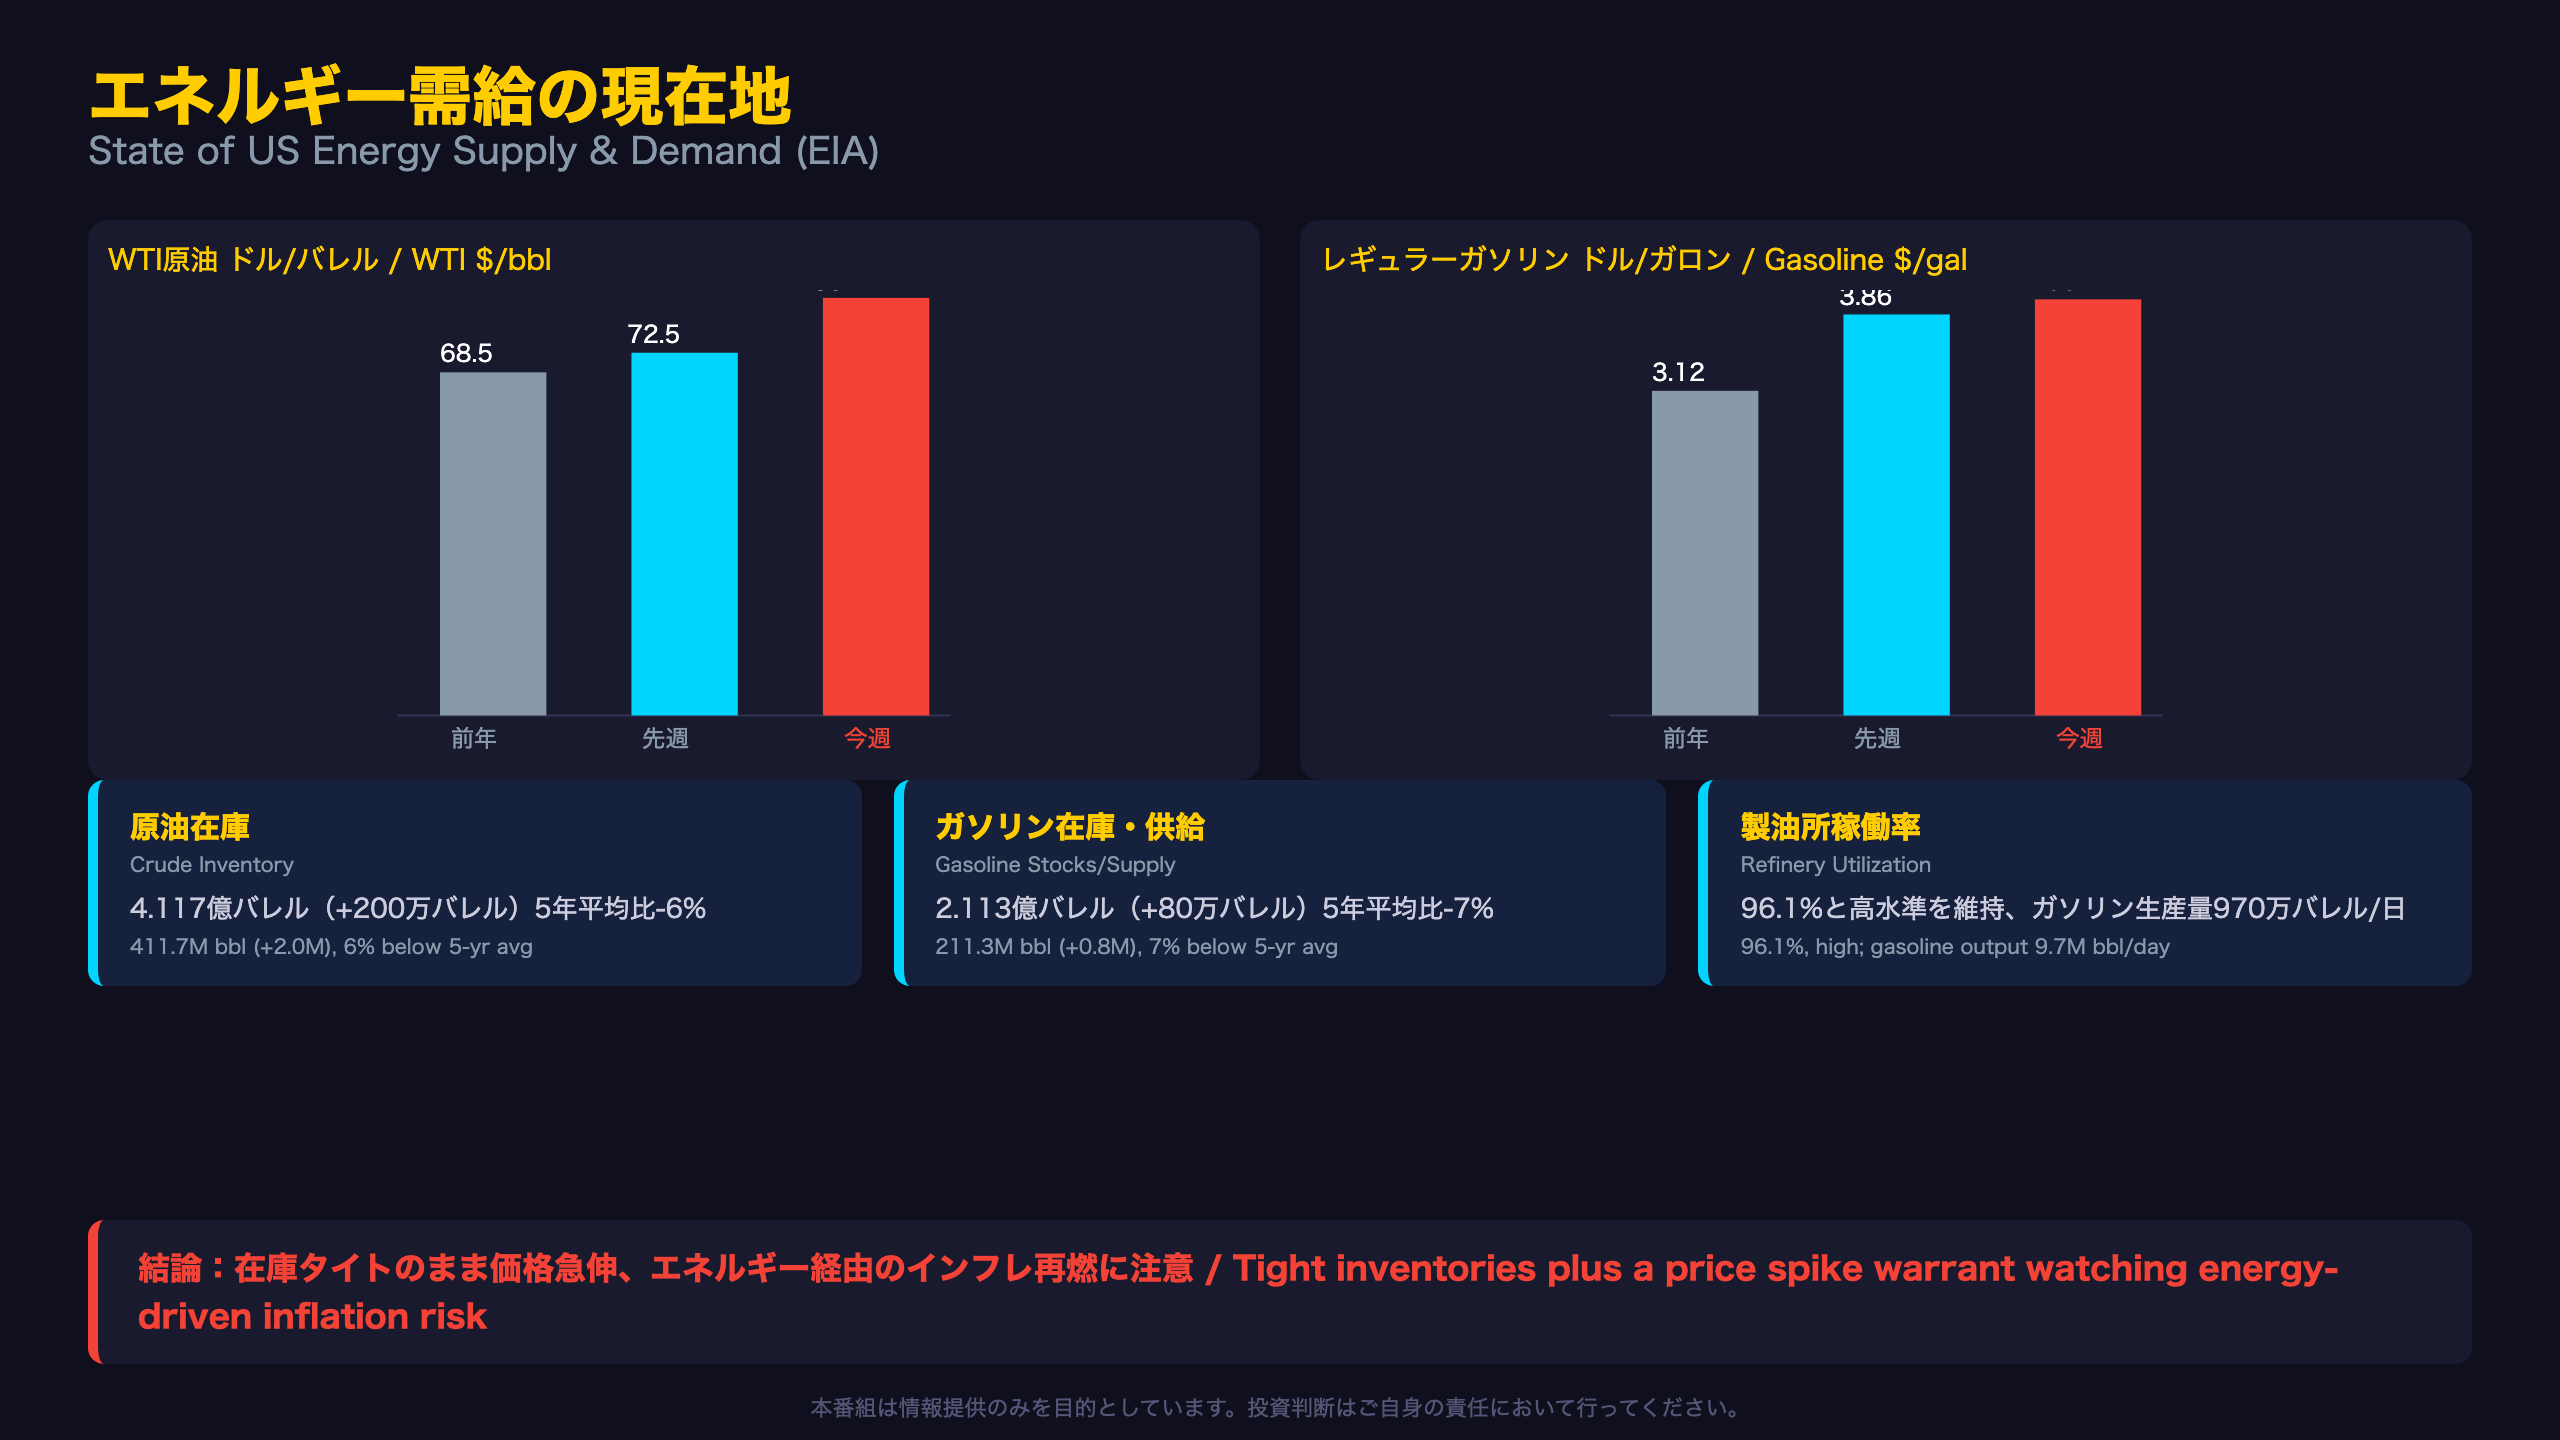
The EIA’s Weekly Petroleum Status Report is the US benchmark for crude and refined product supply-demand balances, closely watched alongside international agencies like the IEA. While total four-week average products supplied (a demand proxy) fell 1.0% year-over-year to 20.4 million barrels per day, the breakdown tells a different story: gasoline supplied rose 1.4% YoY, distillate rose 2.2%, and jet fuel rose a striking 9.1%. The drag on the headline figure comes from “other products” (largely petrochemical feedstocks), meaning consumer-facing transportation fuel demand is actually running stronger than a year ago.
A Bifurcated Inventory Picture
Propane stocks rose 6.3 million barrels and now sit 34% above their five-year average, while distillate inventories remain about 10% below and gasoline 7% below their five-year norms. Crude imports averaged 5.6 million barrels per day over four weeks, down 11.4% YoY — underscoring uneven tightness across different segments of the energy complex.
Cross-Checking With the Statistical Model
Our HMM regime analysis independently flags CPI gasoline (YoY +26.7%) and CPI energy (YoY +15.7%) as statistical outliers relative to the current regime’s historical centroid — directionally consistent with this week’s EIA price data. However, the report gives no explanation for WTI’s sudden 15%+ weekly jump, so US and international investors should treat it as a data point requiring confirmation next week rather than a confirmed structural shift.
FRB流動性の現在地(H.4.1詳細)
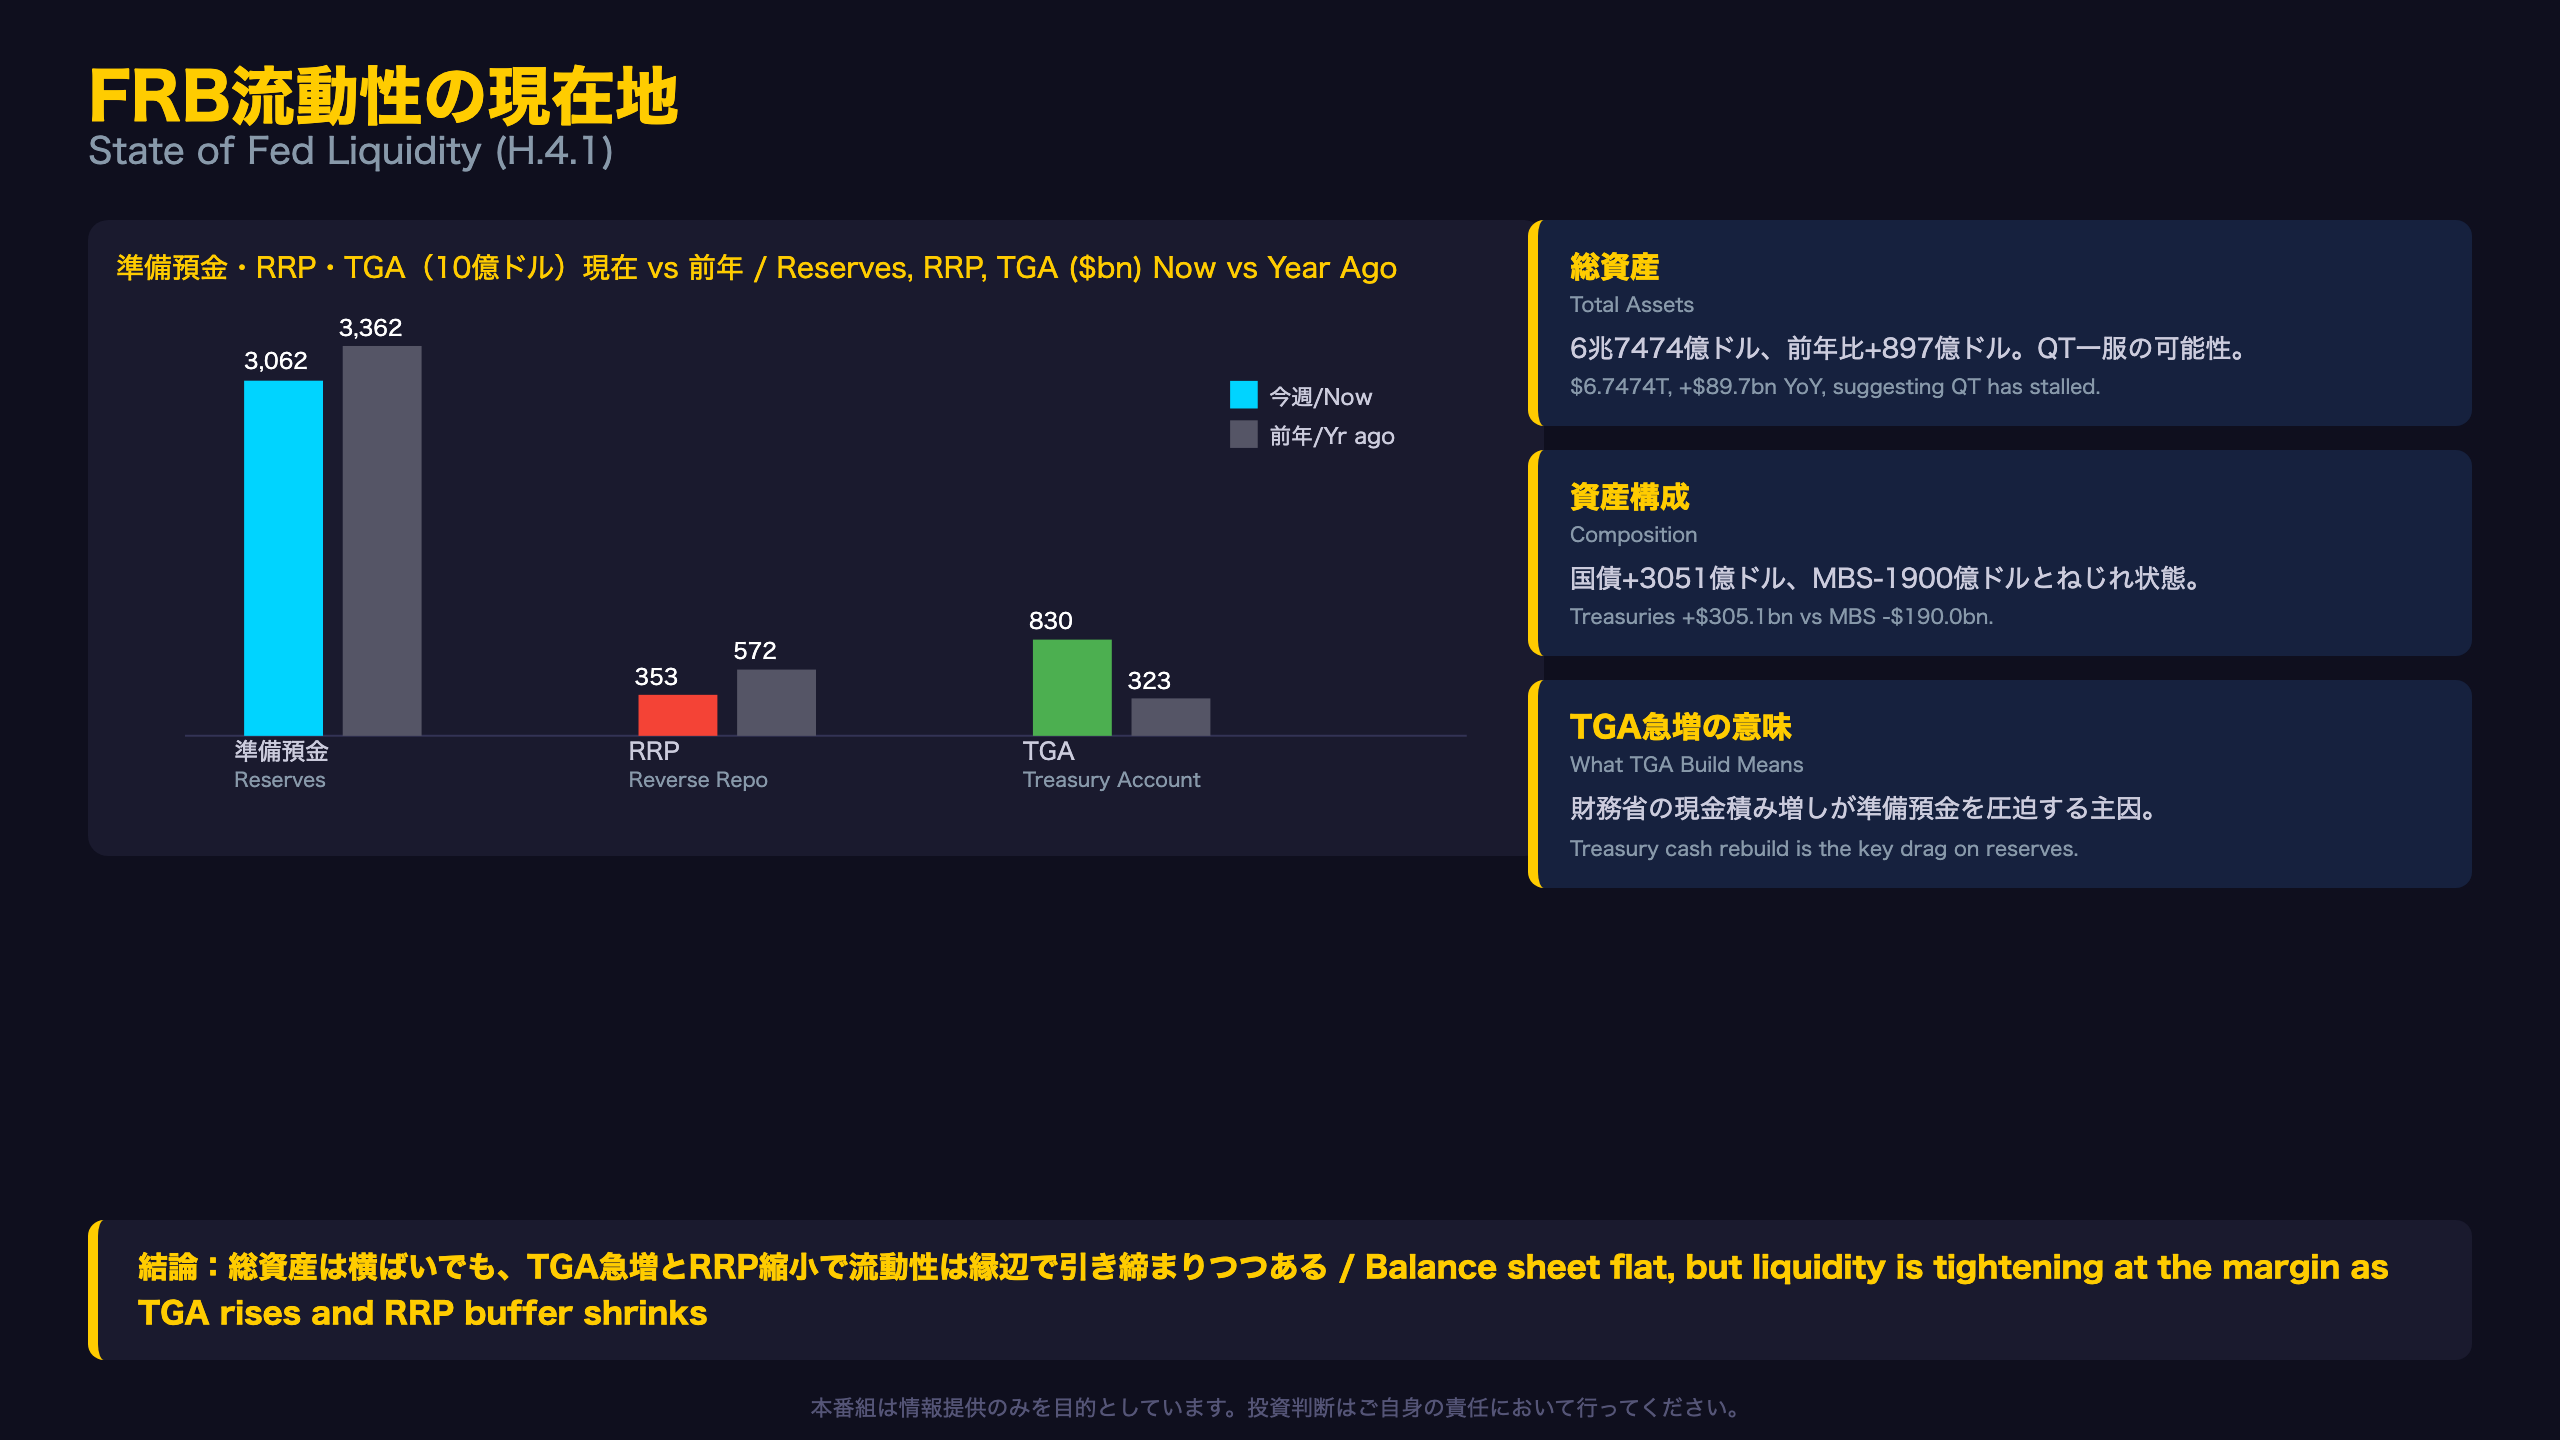
Composition Twist: Treasuries Up, MBS Down
The Fed’s weekly H.4.1 release (Factors Affecting Reserve Balances) is the primary window into US central bank balance sheet dynamics, an analog to what the ECB and BOJ publish for their own asset holdings. Over the past year, Treasury securities held outright rose $305.1 billion, while MBS holdings fell $190.0 billion — netting to a +$115.1 billion increase in total securities held outright. This complicates the simple “QT means shrinking assets” narrative that many investors still assume.
TGA Is the Real Story Behind Tighter Reserves
Even with a broadly stable balance sheet, reserve balances available to the banking system have fallen sharply — down $300.1 billion year-over-year. The primary driver is the Treasury General Account (TGA), which averaged $829.6 billion, up an enormous $506.4 billion from a year ago. TGA builds typically occur when Treasury issuance outpaces near-term spending, temporarily draining liquidity from the private banking system until funds are disbursed.
A Shrinking RRP Buffer
Between 2022 and 2023, the overnight reverse repo (RRP) facility absorbed much of the reserve-balance impact from TGA swings, acting as a buffer. That buffer has now shrunk to $353.2 billion, down $218.6 billion year-over-year — meaning less capacity to cushion future TGA builds, a dynamic worth monitoring for anyone tracking US money market conditions, repo rates, or SOFR.
An HMM-Flagged Anomaly
Our regime model also flags currency in circulation ($2.467 trillion actual vs. a $2.334 trillion regime centroid, Z=2.68) as running hotter than typical for the current regime — a secondary data point worth watching alongside the primary liquidity metrics above.
ストラテジスト総括:3指標の連関と来週の注目シナリオ
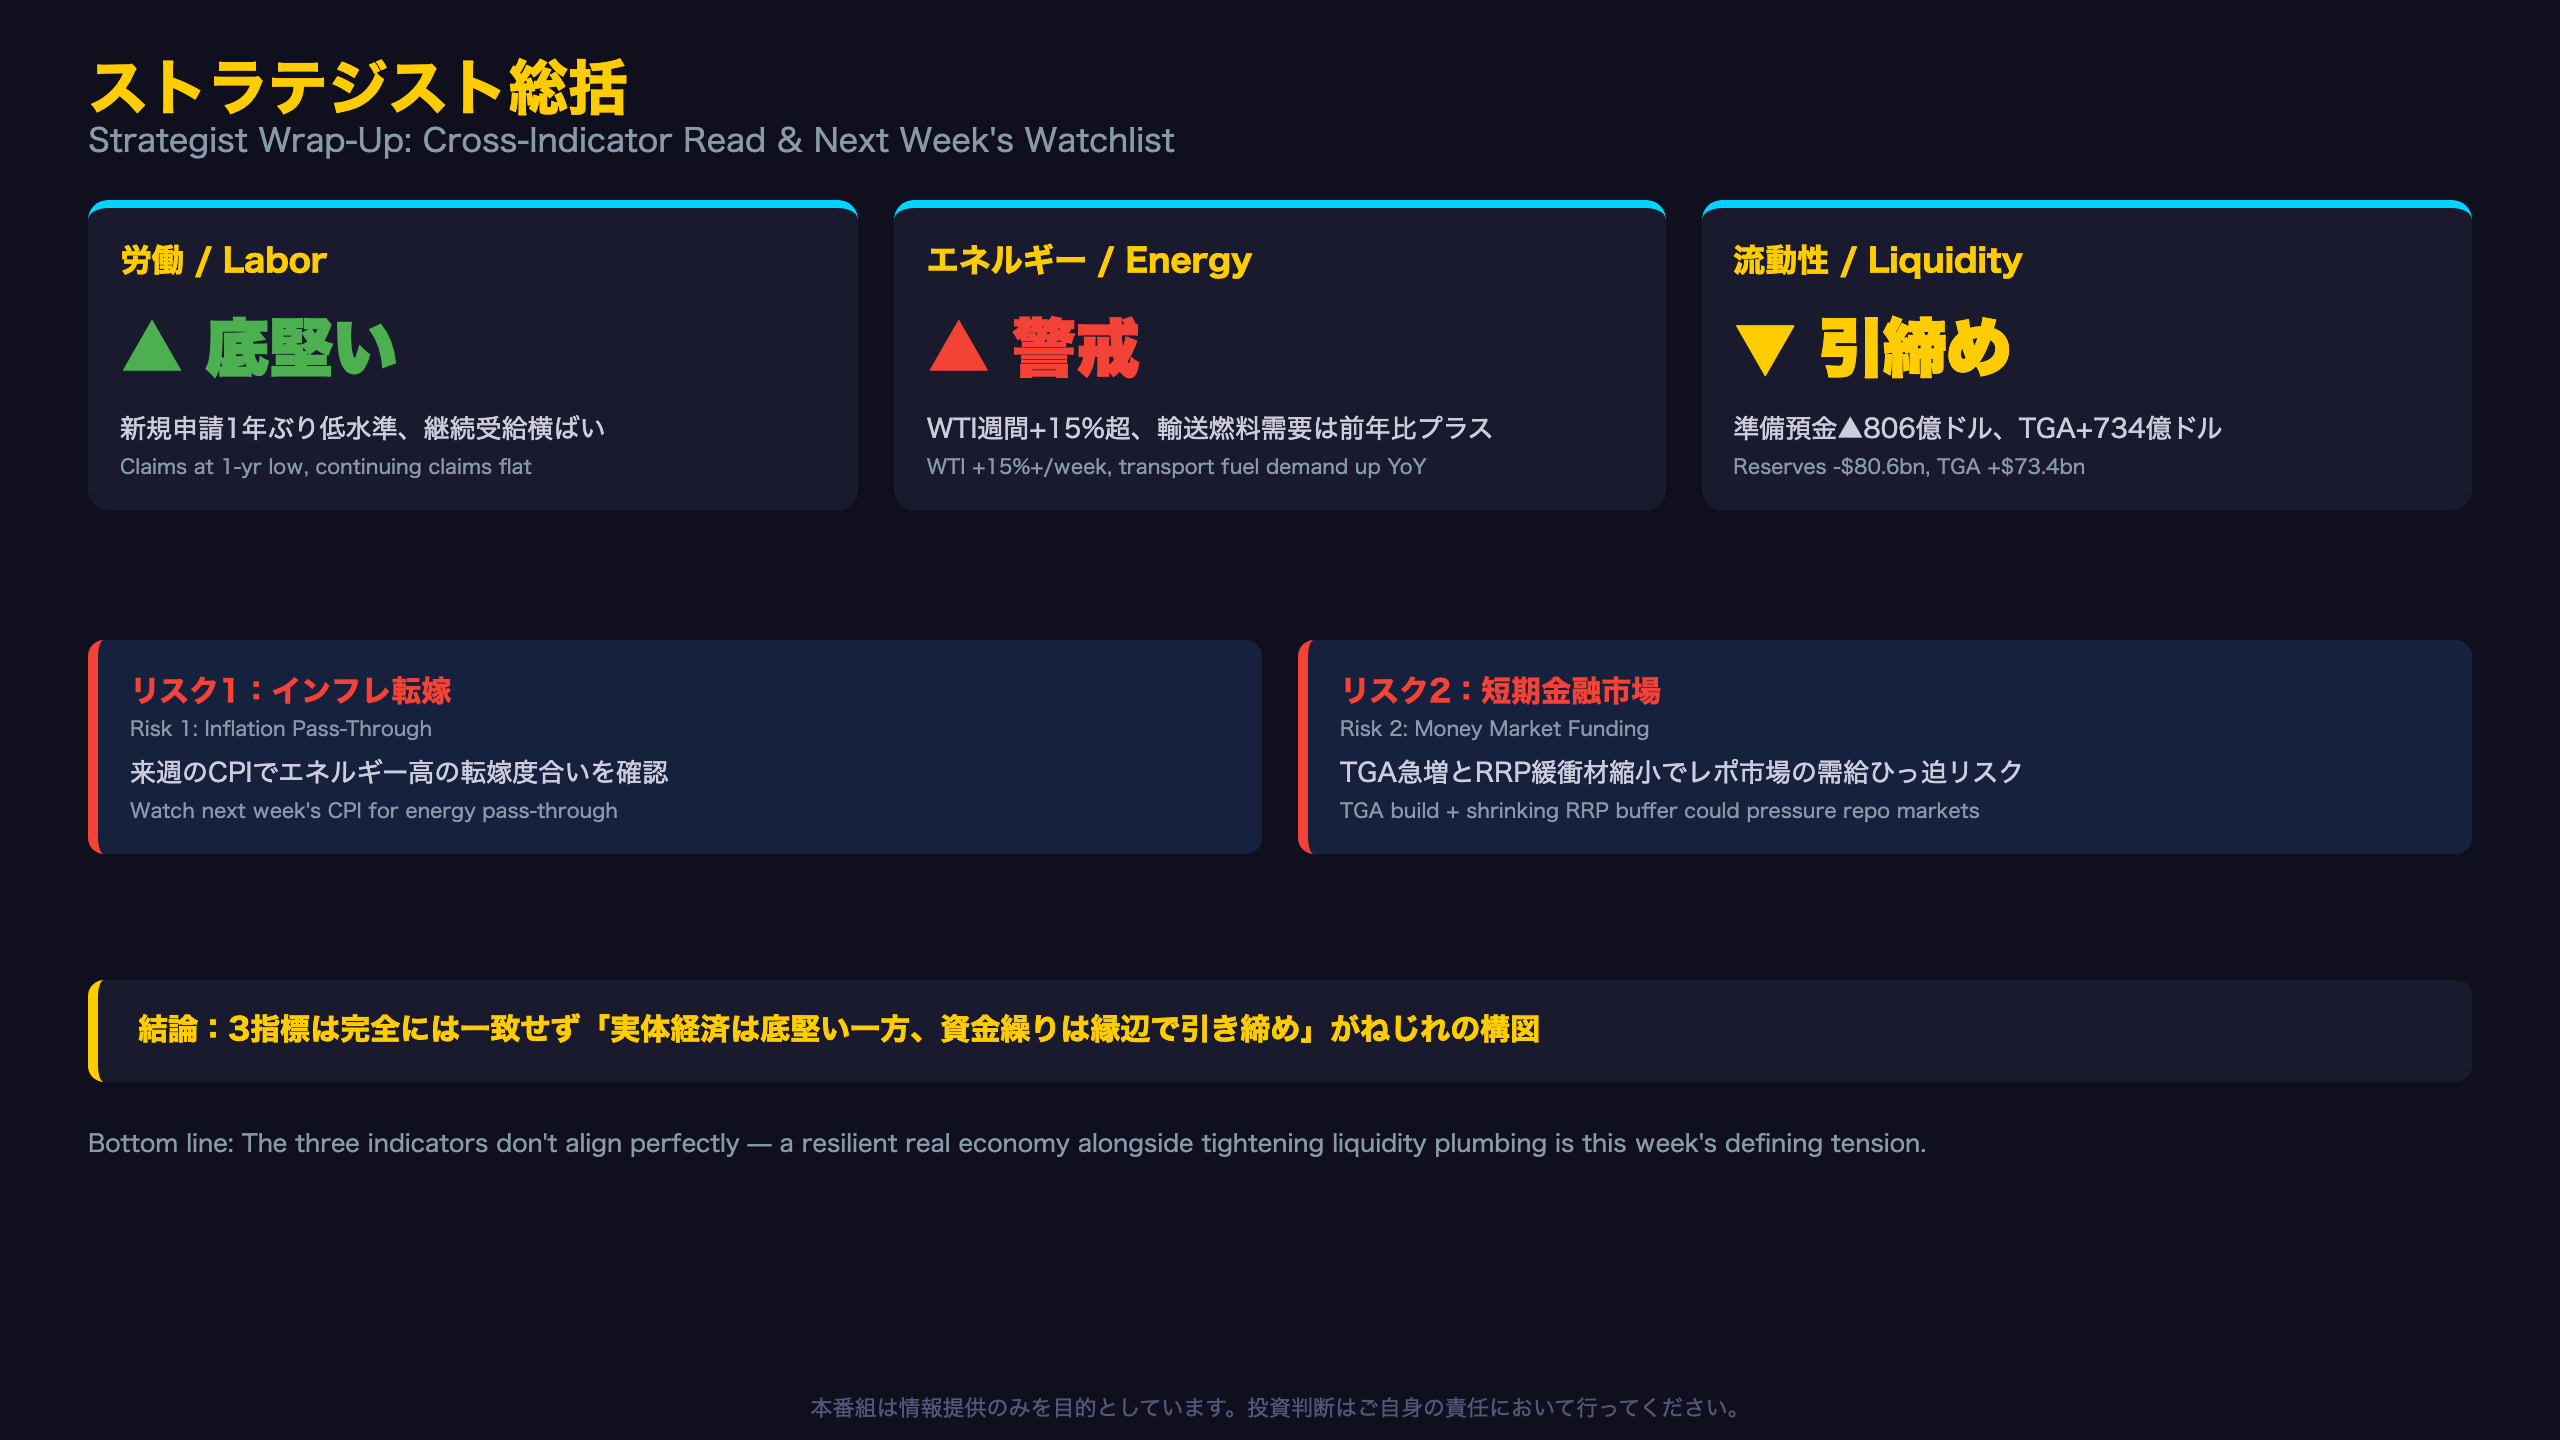
Decomposing the Signals: How Aligned Are They?
| Indicator | This Week’s Signal | Economic Meaning |
|---|---|---|
| Labor (DOL) | Claims at 1-yr low, continuing claims flat | Resilient employment |
| Energy (EIA) | WTI +15%+ weekly, transport fuel demand up YoY | Emerging inflation risk |
| Liquidity (Fed) | Reserves -$80.6bn, TGA +$73.4bn | Tightening at the margin |
The three indicators are not perfectly aligned. The real economy (labor and energy demand) looks broadly resilient, while the financial system’s “plumbing” — bank reserves — is narrowing due to fiscal (Treasury) factors. This divergence is the defining characteristic of this week’s data set, and international investors accustomed to reading US data in isolation should note that headline balance-sheet stability can mask a genuine liquidity squeeze underneath.
A Historical Lesson: September 2019
It is generally believed that reserve balances falling below a certain threshold can trigger stress in short-term funding markets such as repo, though this data alone cannot pinpoint where that threshold lies for the current cycle. In September 2019, a sharp reserve drawdown combined with TGA dynamics coincided with a spike in repo rates — a precedent worth keeping in mind as the current TGA build continues.
What to Watch Next Week
Next week brings the usual weekly releases — DOL claims, the EIA petroleum status report, and the Fed’s H.4.1 — alongside consumer price data. Two thresholds matter most for global markets: how much of this week’s energy price strength passes through to headline CPI, and how much further the TGA build can run before the shrinking RRP buffer stops absorbing it, a dynamic directly relevant to USD funding costs and short-term rates.
Disclaimer: This article is for informational purposes only. All investment decisions are made solely at your own risk.