
📺 Watch the Full Video Analysis
This article was automatically generated by the NFC Market Live AI analysis system. (Updated: 2026-07-17 21:42 JST)
📄 Primary Source
U.S. Census Bureau
https://www.census.gov/construction/nrc/pdf/newresconst.pdf
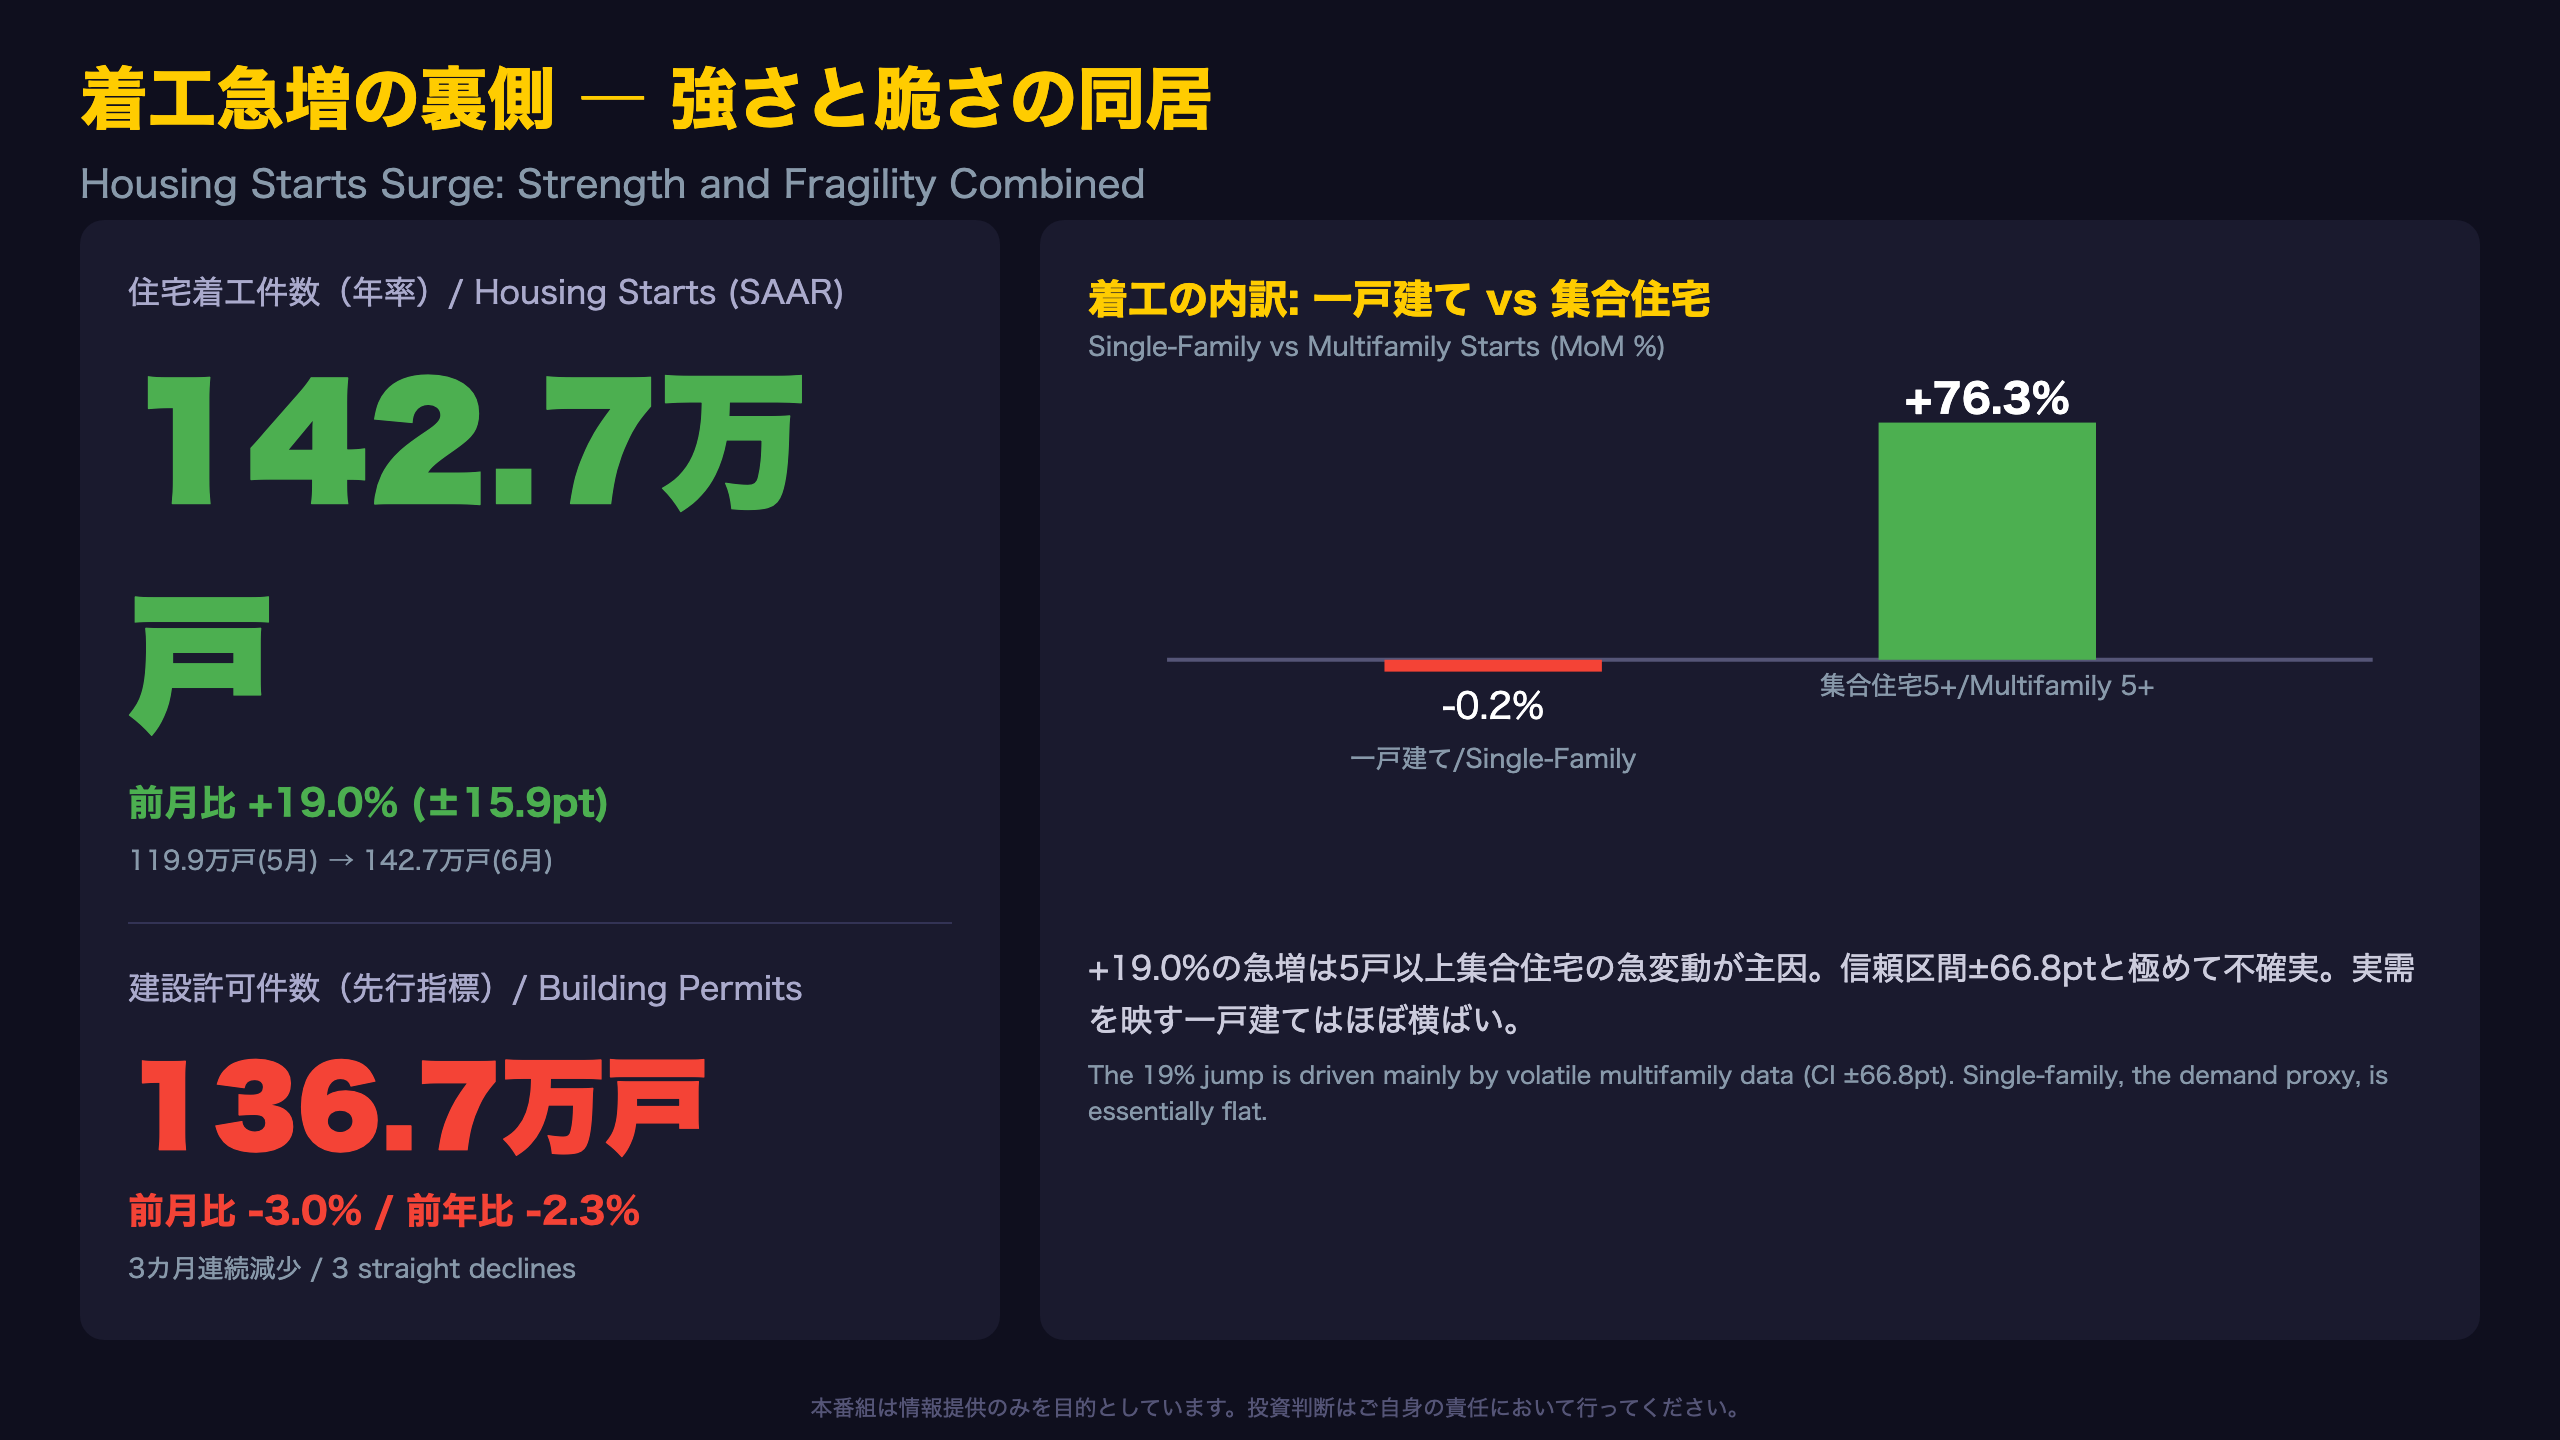
📊 US housing starts jumped to a 1.427M SAAR in June 2026, up 19.0% month-over-month.
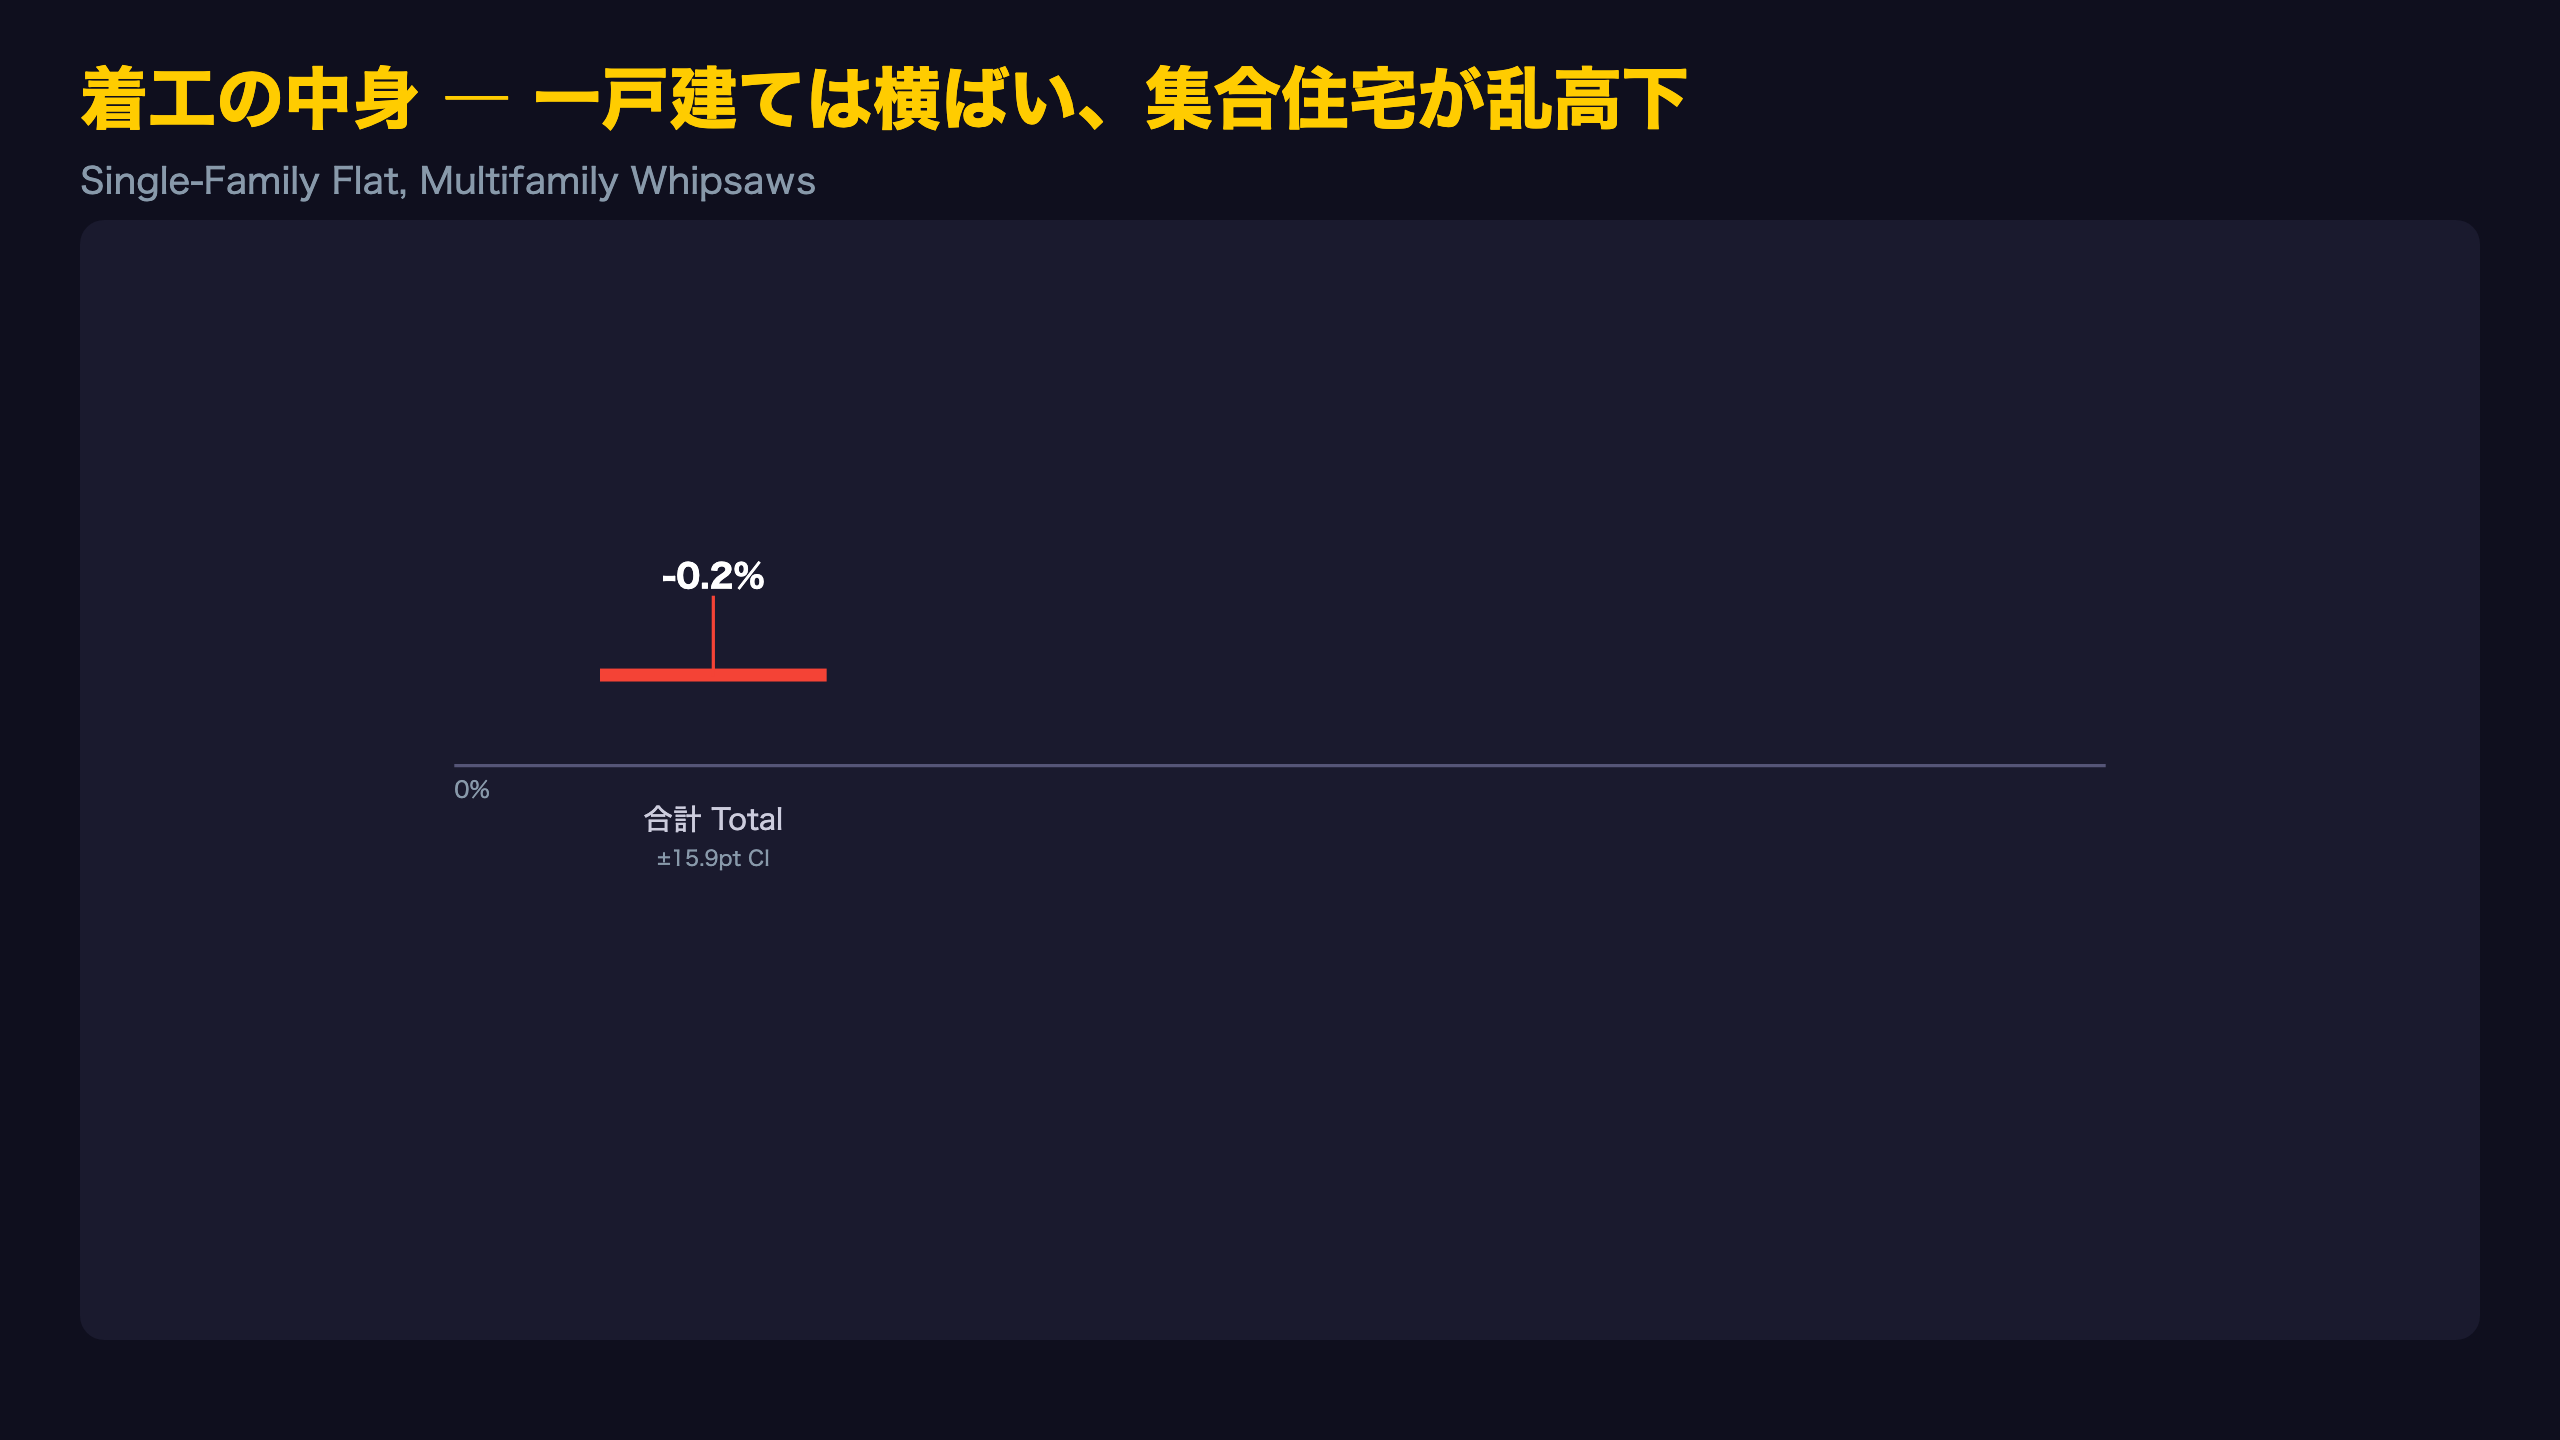
⚠️ But the surge was driven almost entirely by volatile multifamily starts (+76.3%, ±66.8pt CI). Single-family starts, the better demand proxy, were essentially flat at -0.2%.
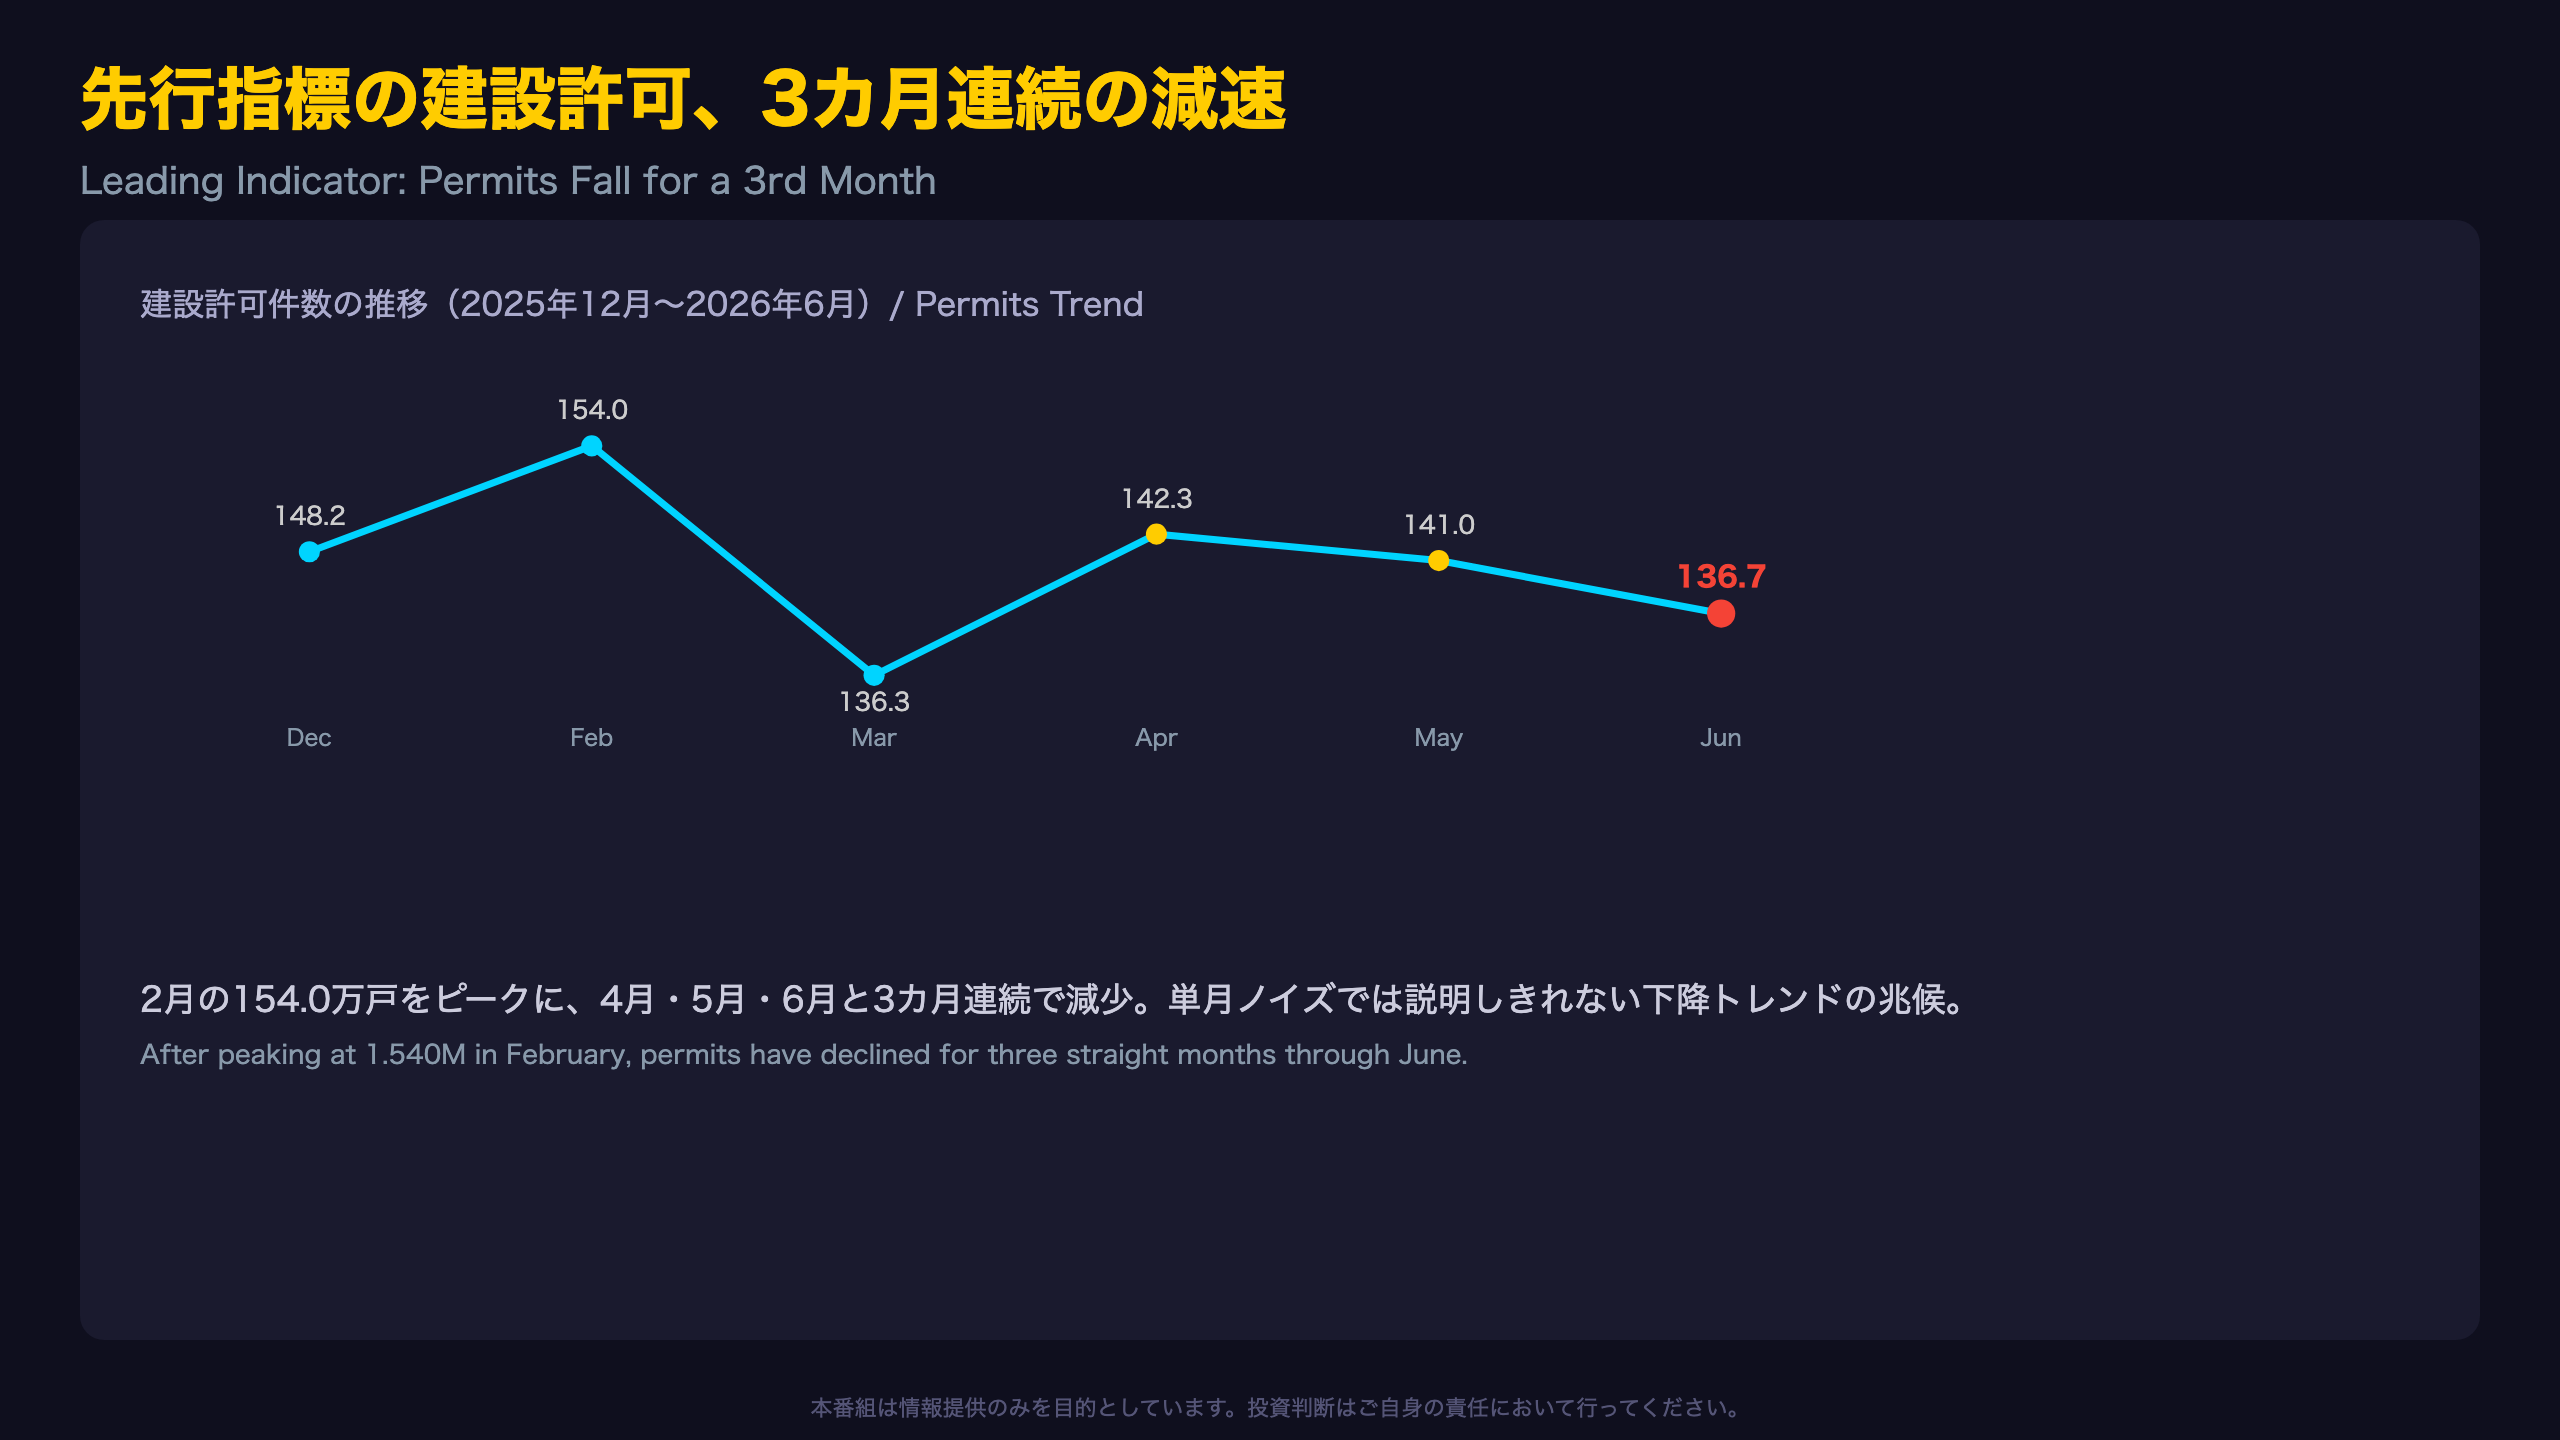
📉 Building permits, the report’s leading indicator, fell to 1.367M — a third straight monthly decline since April’s peak.
🏗️ Units under construction fell a statistically significant 6.2% year-over-year, pointing to a genuine pipeline contraction.
💡 NFC Market Live breaks down a report where headline strength and structural softness coexist.
着工急増の裏側 ― 強さと脆さの同居
The Confidence Interval Problem
The headline +19.0% month-over-month jump carries a startling ±15.9 percentage-point 90% confidence interval — meaning the true change could be anywhere from +3.1% to +34.9%. The Census Bureau’s own explanatory notes state that seasonally adjusted month-to-month changes “often show movements which may be irregular,” and that it can take three months to establish a trend in permits and six months for starts and completions.
Why This Matters for International Readers
Unlike the UK’s ONS or Eurostat construction output indices, which lean on larger administrative datasets, the U.S. New Residential Construction report relies heavily on sample surveys for its detailed breakdowns (Tables 2-5), making single-month swings statistically noisy by design.
The Multifamily Distortion
The 5-plus-unit segment surged 76.3% month-over-month — but with a ±66.8% confidence interval, the true range spans roughly 9.5% to 143.1%. This single volatile category is doing most of the heavy lifting behind the headline number.
Market Read
For rate markets, a report this noisy is unlikely to shift Fed expectations meaningfully on its own. The August 18 release, covering July data, will be the more telling data point for confirming whether this is signal or noise.
着工の中身 ― 一戸建ては横ばい、集合住宅が乱高下
Single-Family: A Slower, More Reliable Signal
Single-family starts fell 3.2% year-over-year (Table 3a), extending a gradual moderation that’s been building for months. Because single-family construction is more directly tied to mortgage rates and household purchasing power, this YoY trend arguably matters more to investors than the noisy monthly print.
Why Multifamily Swings So Wildly
The report’s own footnotes disclose an average relative standard error of roughly 16% for the 5-plus-unit category — among the highest of any series in the release. May’s 291,000 figure itself was a sharp pullback from April’s 494,000, meaning June’s rebound to 513,000 partly reflects mean reversion rather than fresh momentum.
Comparison to International Data Practices
Unlike Eurostat’s construction production index, which draws on VAT and administrative filings for large multi-unit projects, the U.S. Census Bureau relies on a comparatively small permit-office sample for multifamily starts — one reason this category swings so much more than single-family data.
Practical Read for Builders and Investors
Homebuilders navigating this data face two very different signals: a single-family segment in gentle, measurable deceleration, and a multifamily segment whose month-to-month print is close to a coin flip statistically.
先行指標の建設許可、3カ月連続の減速
Permits as the Report’s Leading Indicator
Building permits represent the administrative step that typically precedes a groundbreaking by weeks or months, which is why the Census Bureau flags this series as the release’s forward-looking gauge. Its own explanatory notes state that establishing a genuine trend in permits requires roughly three months of data.
The Trajectory Since Last Summer
Permits rose from 1.399 million in June 2025 to a local peak of 1.540 million in February 2026, then reversed sharply to 1.363 million in March. Since then, the series has drifted lower for three straight months: 1.423 million in April, 1.410 million (revised) in May, and 1.367 million in June.
Year-to-Date Context
Single-family permit issuance for the first half of 2026 is running 4.3% below the same period in 2025 on a year-to-date basis — corroborating the monthly softness with a cumulative view.
What Would Confirm the Trend
International readers comparing this to the UK’s planning permission data or Canada’s CMHC permit series should note the U.S. series’ three-month rule of thumb. The August 18 release, covering July, will show whether the decline extends to a fourth consecutive month — the point at which this would harden from “notable” to “confirmed” trend.
地域別に見る明暗 ― 南部減速、北東部急伸
Why the South Drives the National Print
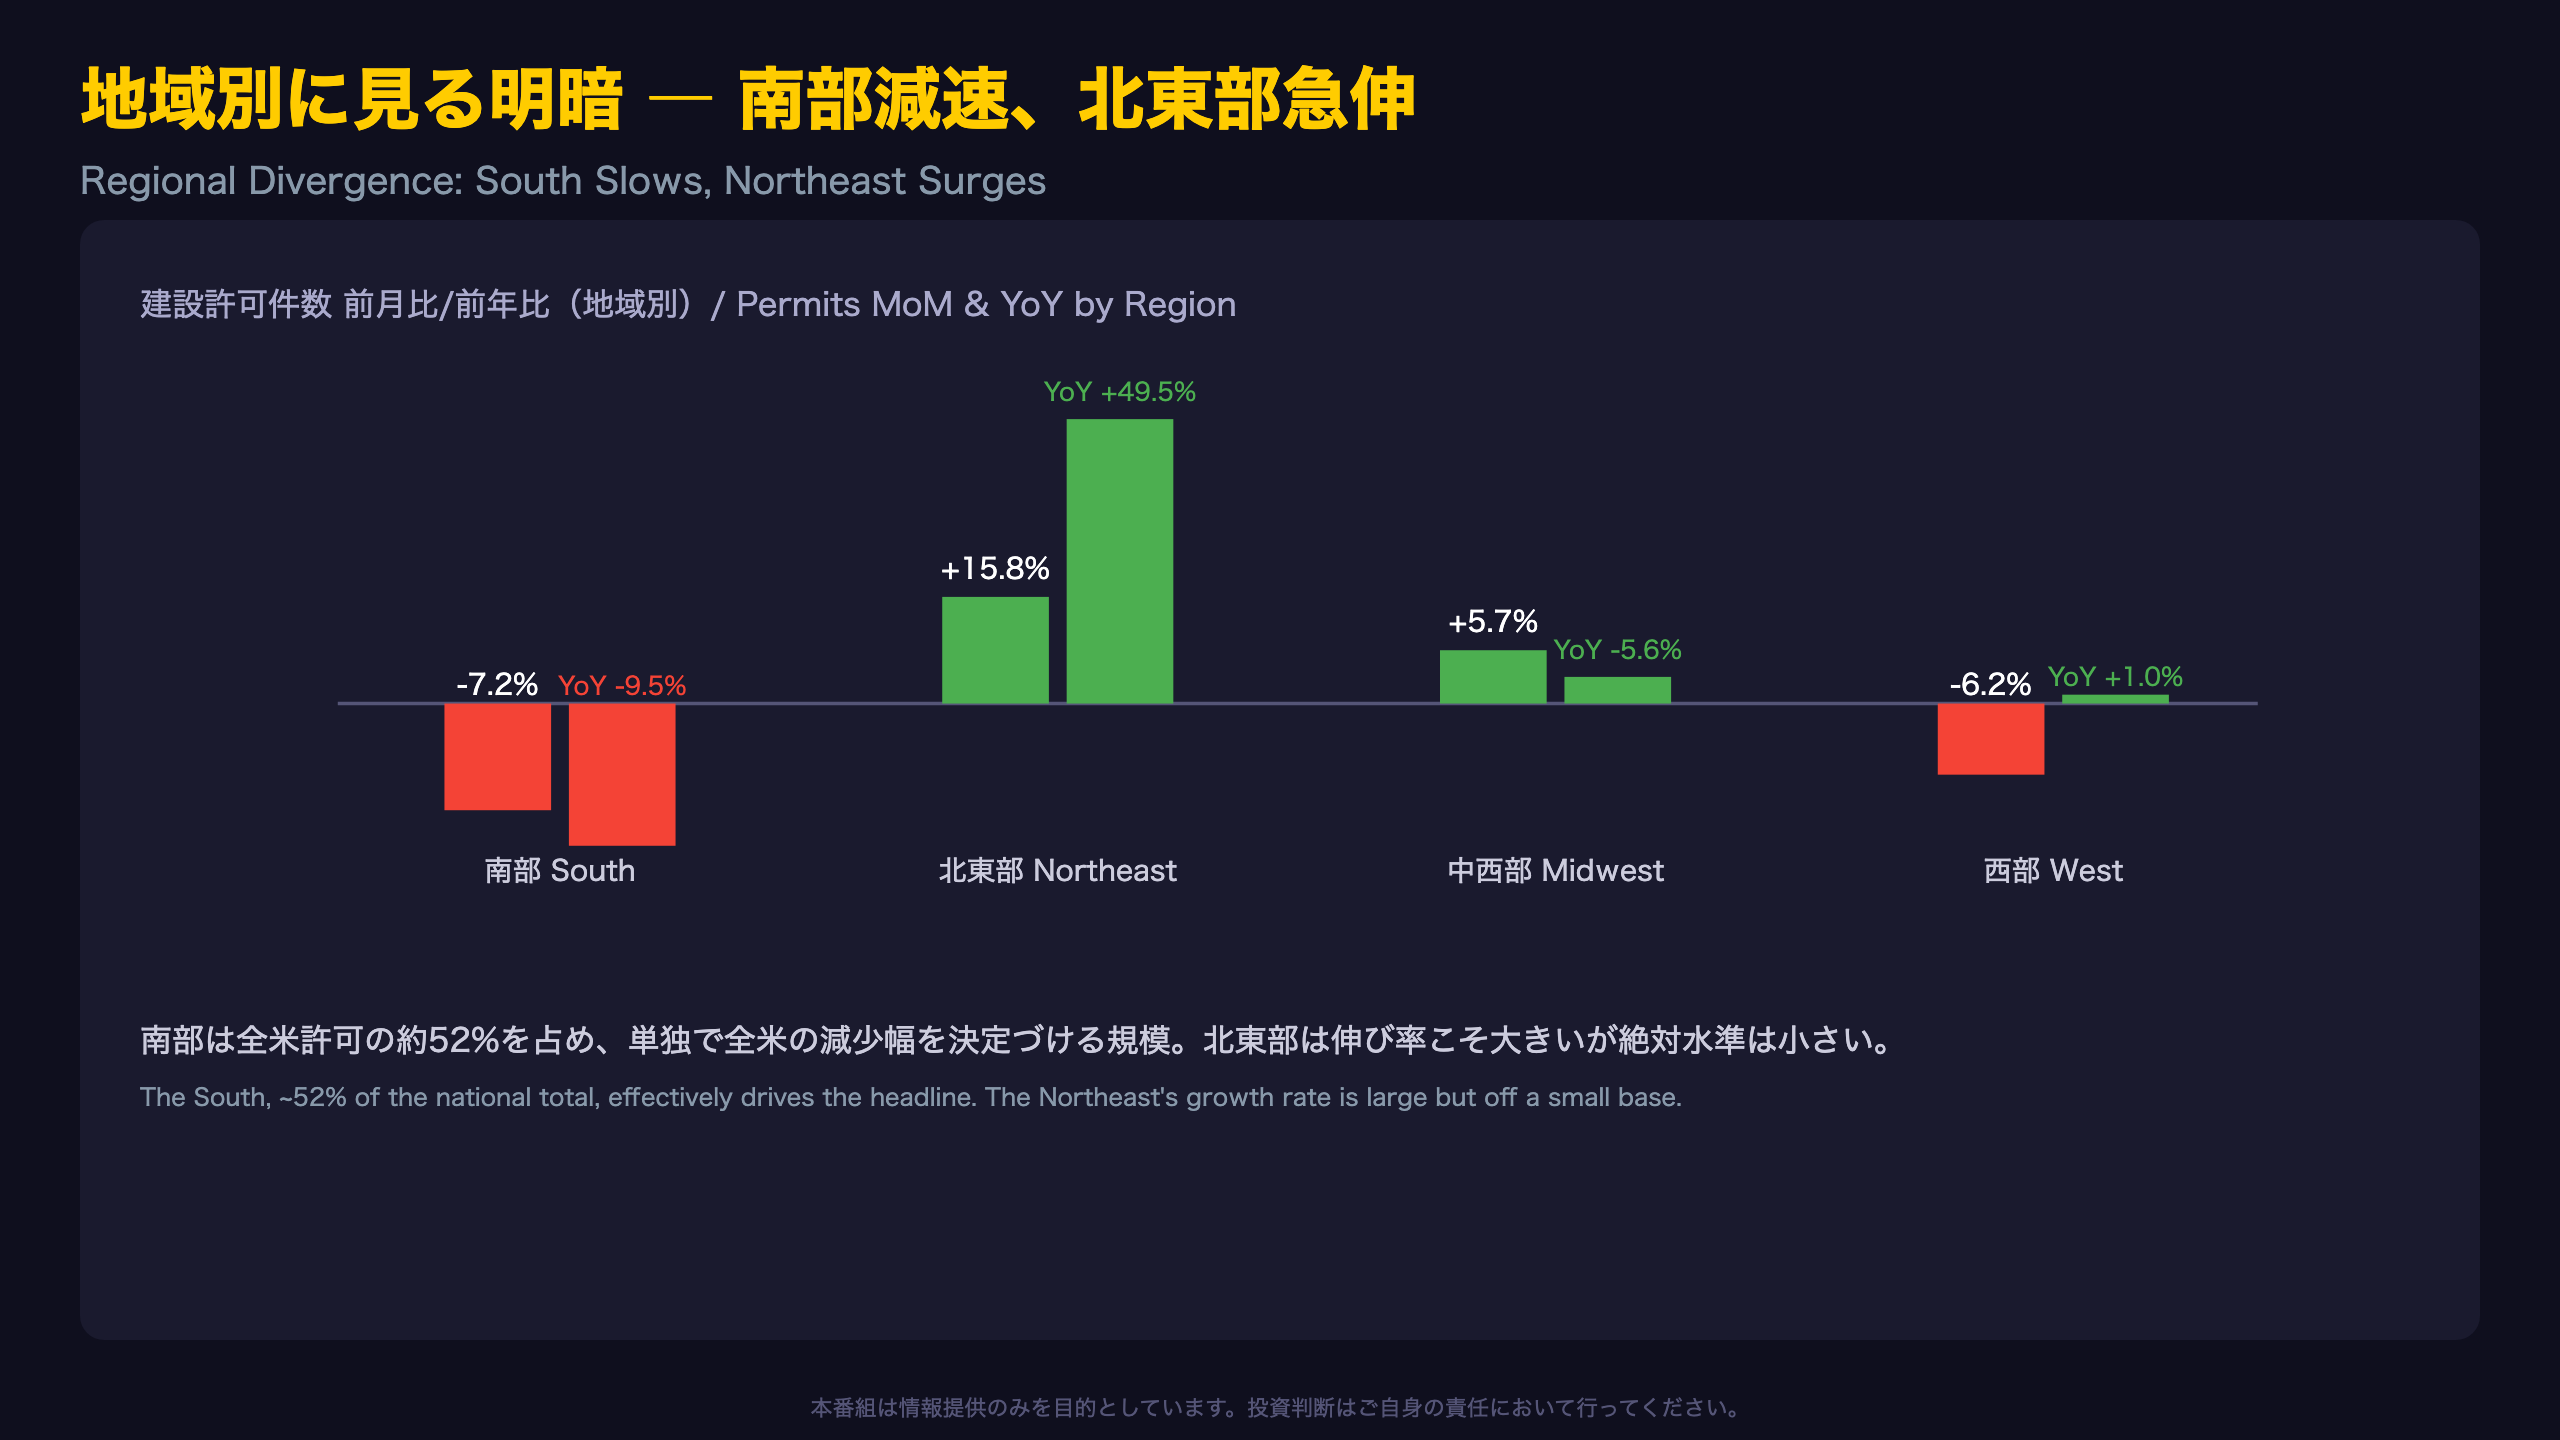
At 707,000 units, the South accounts for roughly 52% of the national permit total — meaning this single region’s momentum effectively dictates the sign of the national month-over-month and year-over-year figures. June’s 7.2% regional decline explains the bulk of the national drop.
Reading the Northeast’s Surge With Caution
The Northeast’s eye-catching 49.5% year-over-year gain looks impressive, but the region represents only about 11% of the national total (154,000 units). Strong percentage growth off a small base carries a very different weight than the South’s decline in absolute supply terms.
Starts Data Tells a Similar, Noisier Story
The housing starts table shows the South up 15.2% and the Midwest up 33.3% month-over-month — but both carry extremely wide confidence intervals (±23.8 and ±27.8 points respectively), making them far less reliable than the permit-based regional trend.
A Global Parallel
Regional divergence of this kind echoes patterns seen in other large housing markets — for instance, Australia’s east-coast/west-coast split — where local price levels and wage growth shape sensitivity to financing costs. This report alone, however, cannot isolate what is driving the South’s specific slowdown.
パイプラインの縮小 ― 建設中件数が示す構造変化
Why Units Under Construction Matter
The stock of homes actively under construction functions as the real supply pipeline feeding future completions. Unlike the monthly starts print, which can swing wildly month to month, this stock measure accumulates activity over many months, making it a comparatively low-noise gauge of underlying construction momentum.
The Statistical Significance Angle
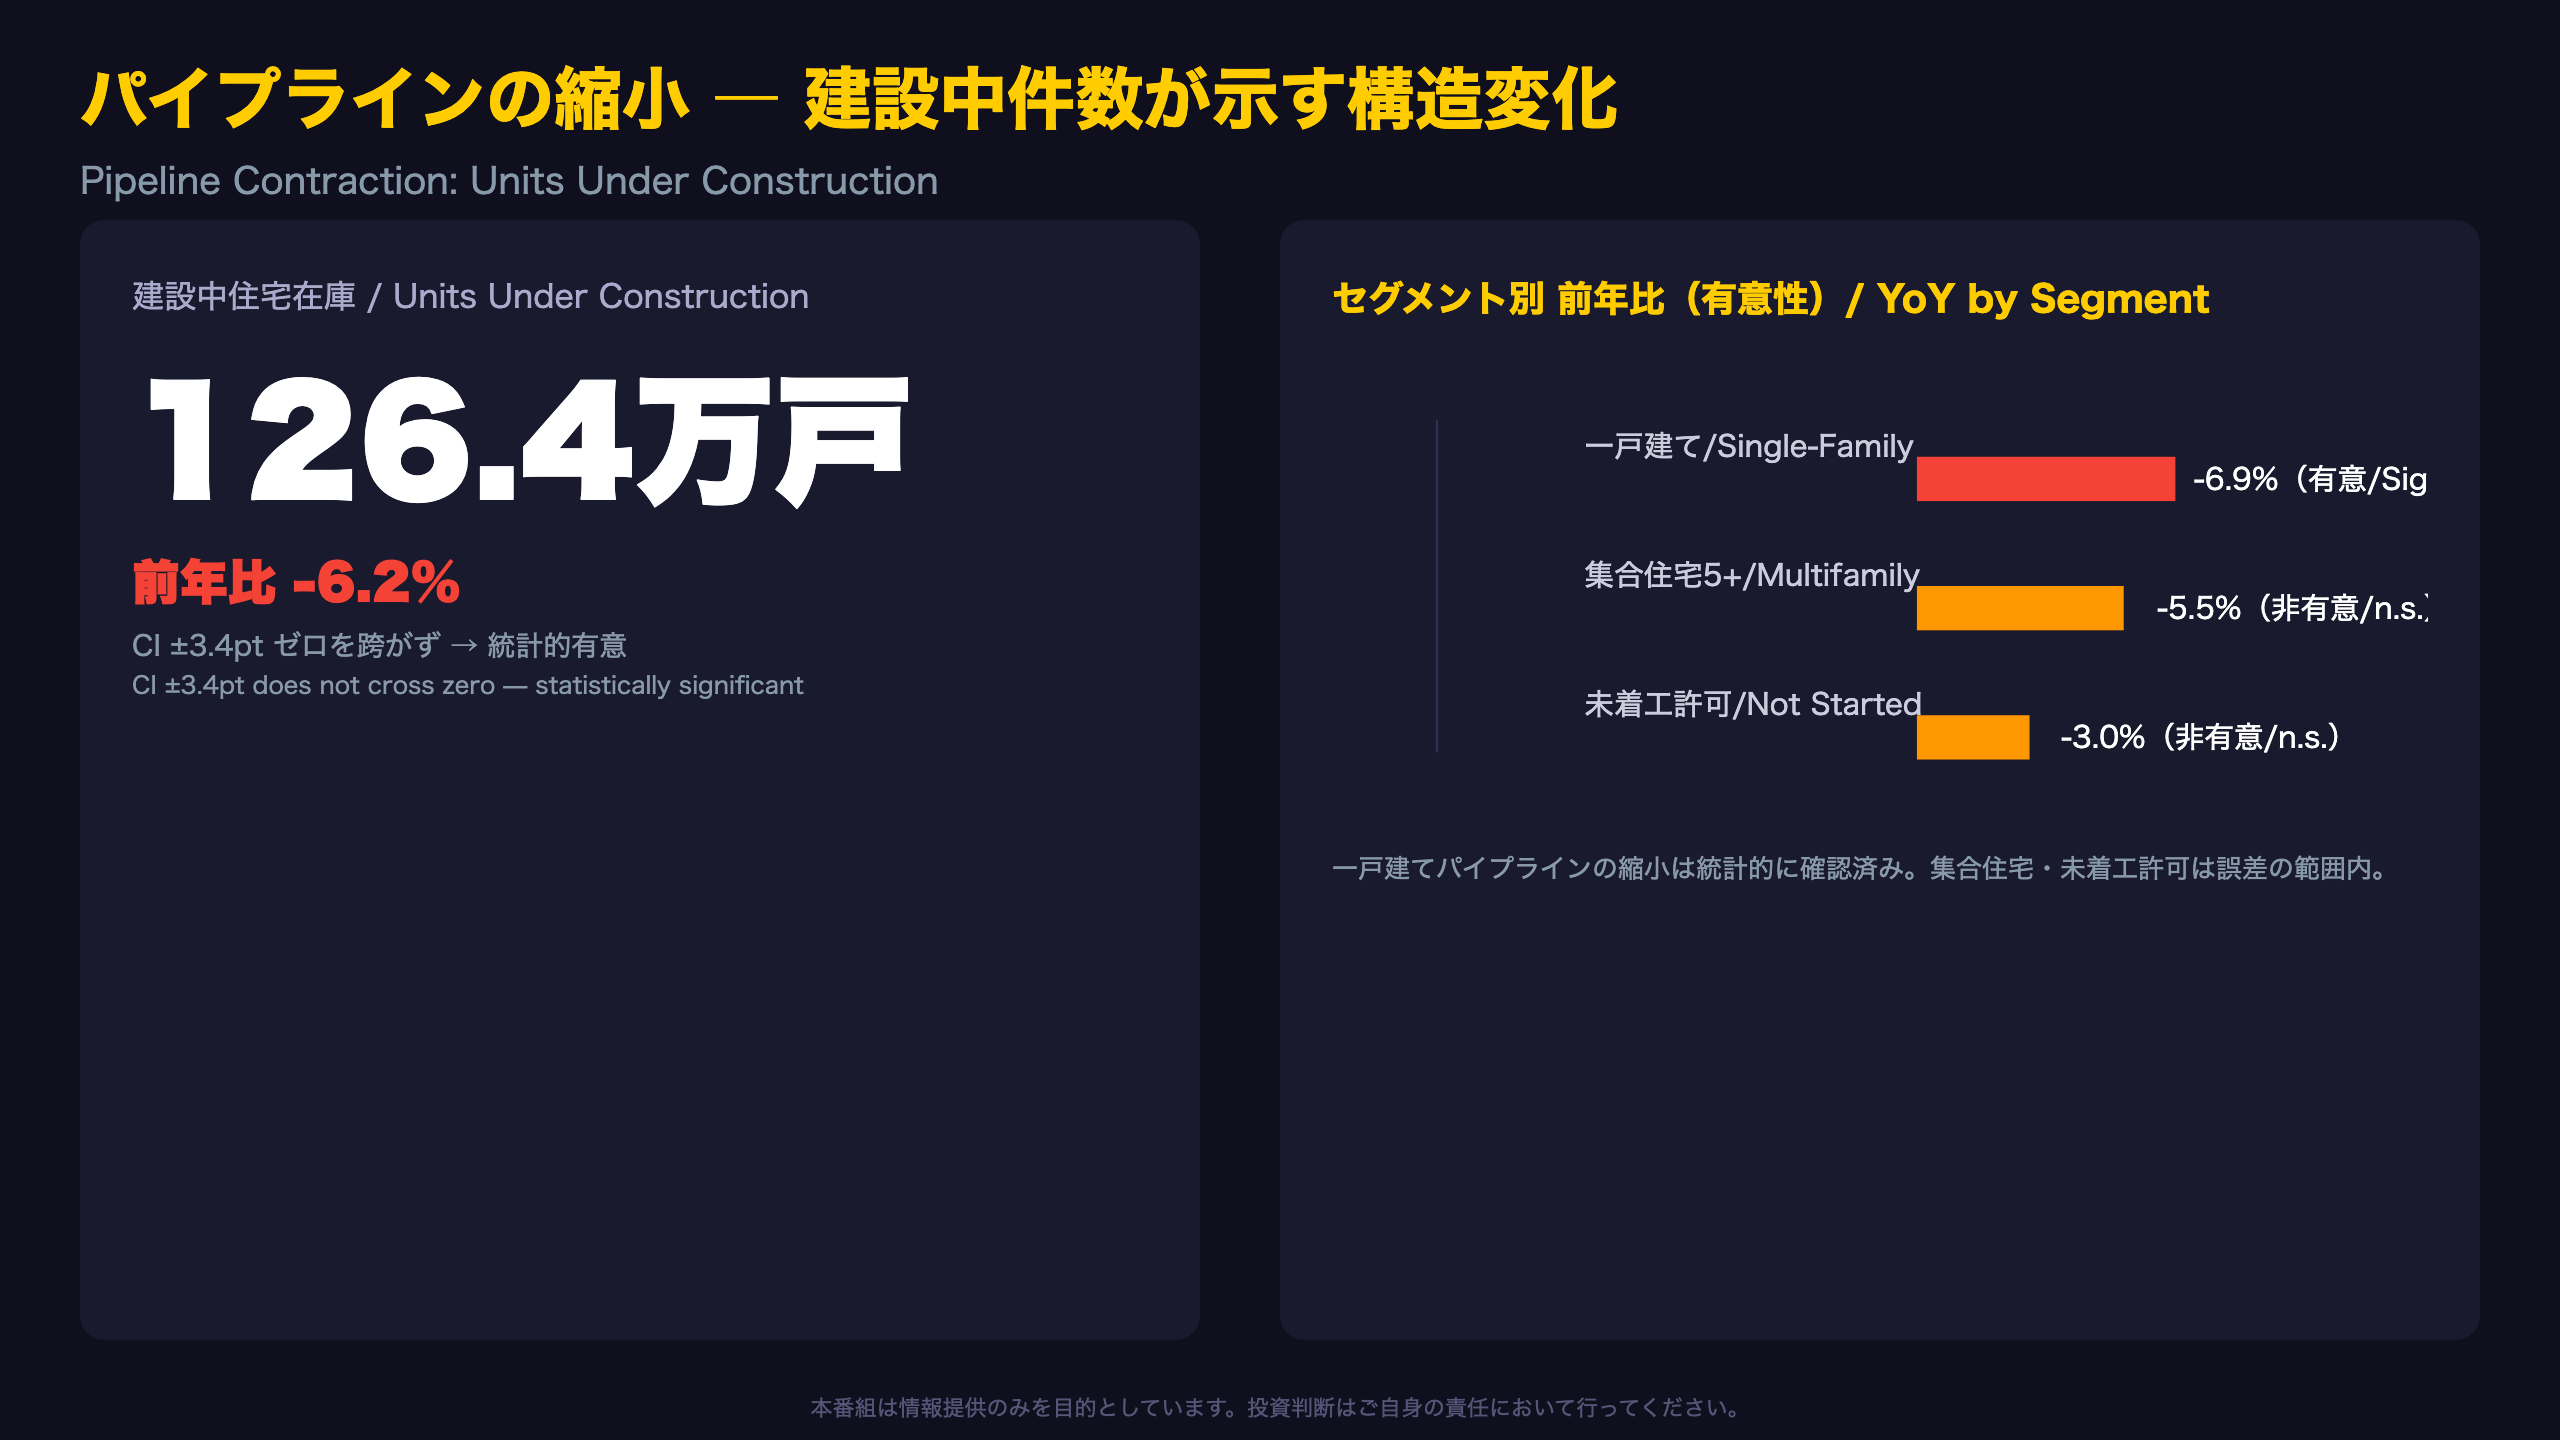
The standout figure here is the 6.2% year-over-year decline in total units under construction, with a ±3.4 percentage-point confidence interval. The implied range, -9.6% to -2.8%, does not cross zero — making this one of the few series in the entire release that can be called a statistically confirmed decline rather than noise.
Single-Family vs. Multifamily Pipelines
Single-family units under construction fell 6.9% year-over-year, also statistically significant (±2.9 points). Multifamily (5+) units, however, fell a smaller 5.5% with a ±6.1-point interval that does include zero — meaning the multifamily pipeline’s contraction cannot yet be confirmed with the same confidence.
The “Shadow Inventory” of Unstarted Permits
The 257,000 units authorized but not yet started act as a reserve pool that will either convert into starts or eventually lapse. The 3.0% monthly decline here isn’t statistically significant, but the level has trended sideways-to-slightly-lower over the past year.
市場とFRBへのインプリケーション

Weighing the Three Signals
Investors parsing this release should assign different confidence levels to its three headline series. Housing starts (wide confidence intervals) sit at the low-confidence end; building permits (subject to the Census Bureau’s own three-month trend rule) sit in the middle; and units under construction, where the year-over-year decline is statistically significant, sit at the high-confidence end.
The Fed Angle — General Context, Not Specific to This Data
Housing is typically one of the most rate-sensitive sectors of the economy, and it is generally understood that elevated mortgage rates suppress new construction activity. However, this specific report contains no reference to mortgage rate levels, so any rate-based explanation for the permit softness should be treated as general context rather than a conclusion drawn from this data.
Chain of Reasoning for Market Implications
Building permits at 1.367 million, down for a third straight month → a softening leading indicator typically points to slower starts and completions ahead → homebuilder equities and building-materials suppliers may see continued scrutiny of permit trends from investors.
Units under construction down 6.2% year-over-year, a statistically significant decline → a genuine contraction in the supply pipeline → this could suggest a cooling trajectory for new housing supply over the medium term, though this must be cross-checked against demand-side factors like rates and household income, which this report does not cover.
What to Watch Next
The August 18 release covering July data will be the key test: a fourth straight monthly decline in permits would meaningfully strengthen the case that this is a genuine trend rather than short-term noise.
Disclaimer: This article is for informational purposes only. All investment decisions are made solely at your own risk.