📺 Watch the Full Video Analysis
This article was automatically generated by the NFC Market Live AI analysis system. (Updated: 2026-07-16 21:41 JST)
📄 Primary Source
U.S. Census Bureau
https://www.census.gov/retail/marts/www/marts_current.pdf
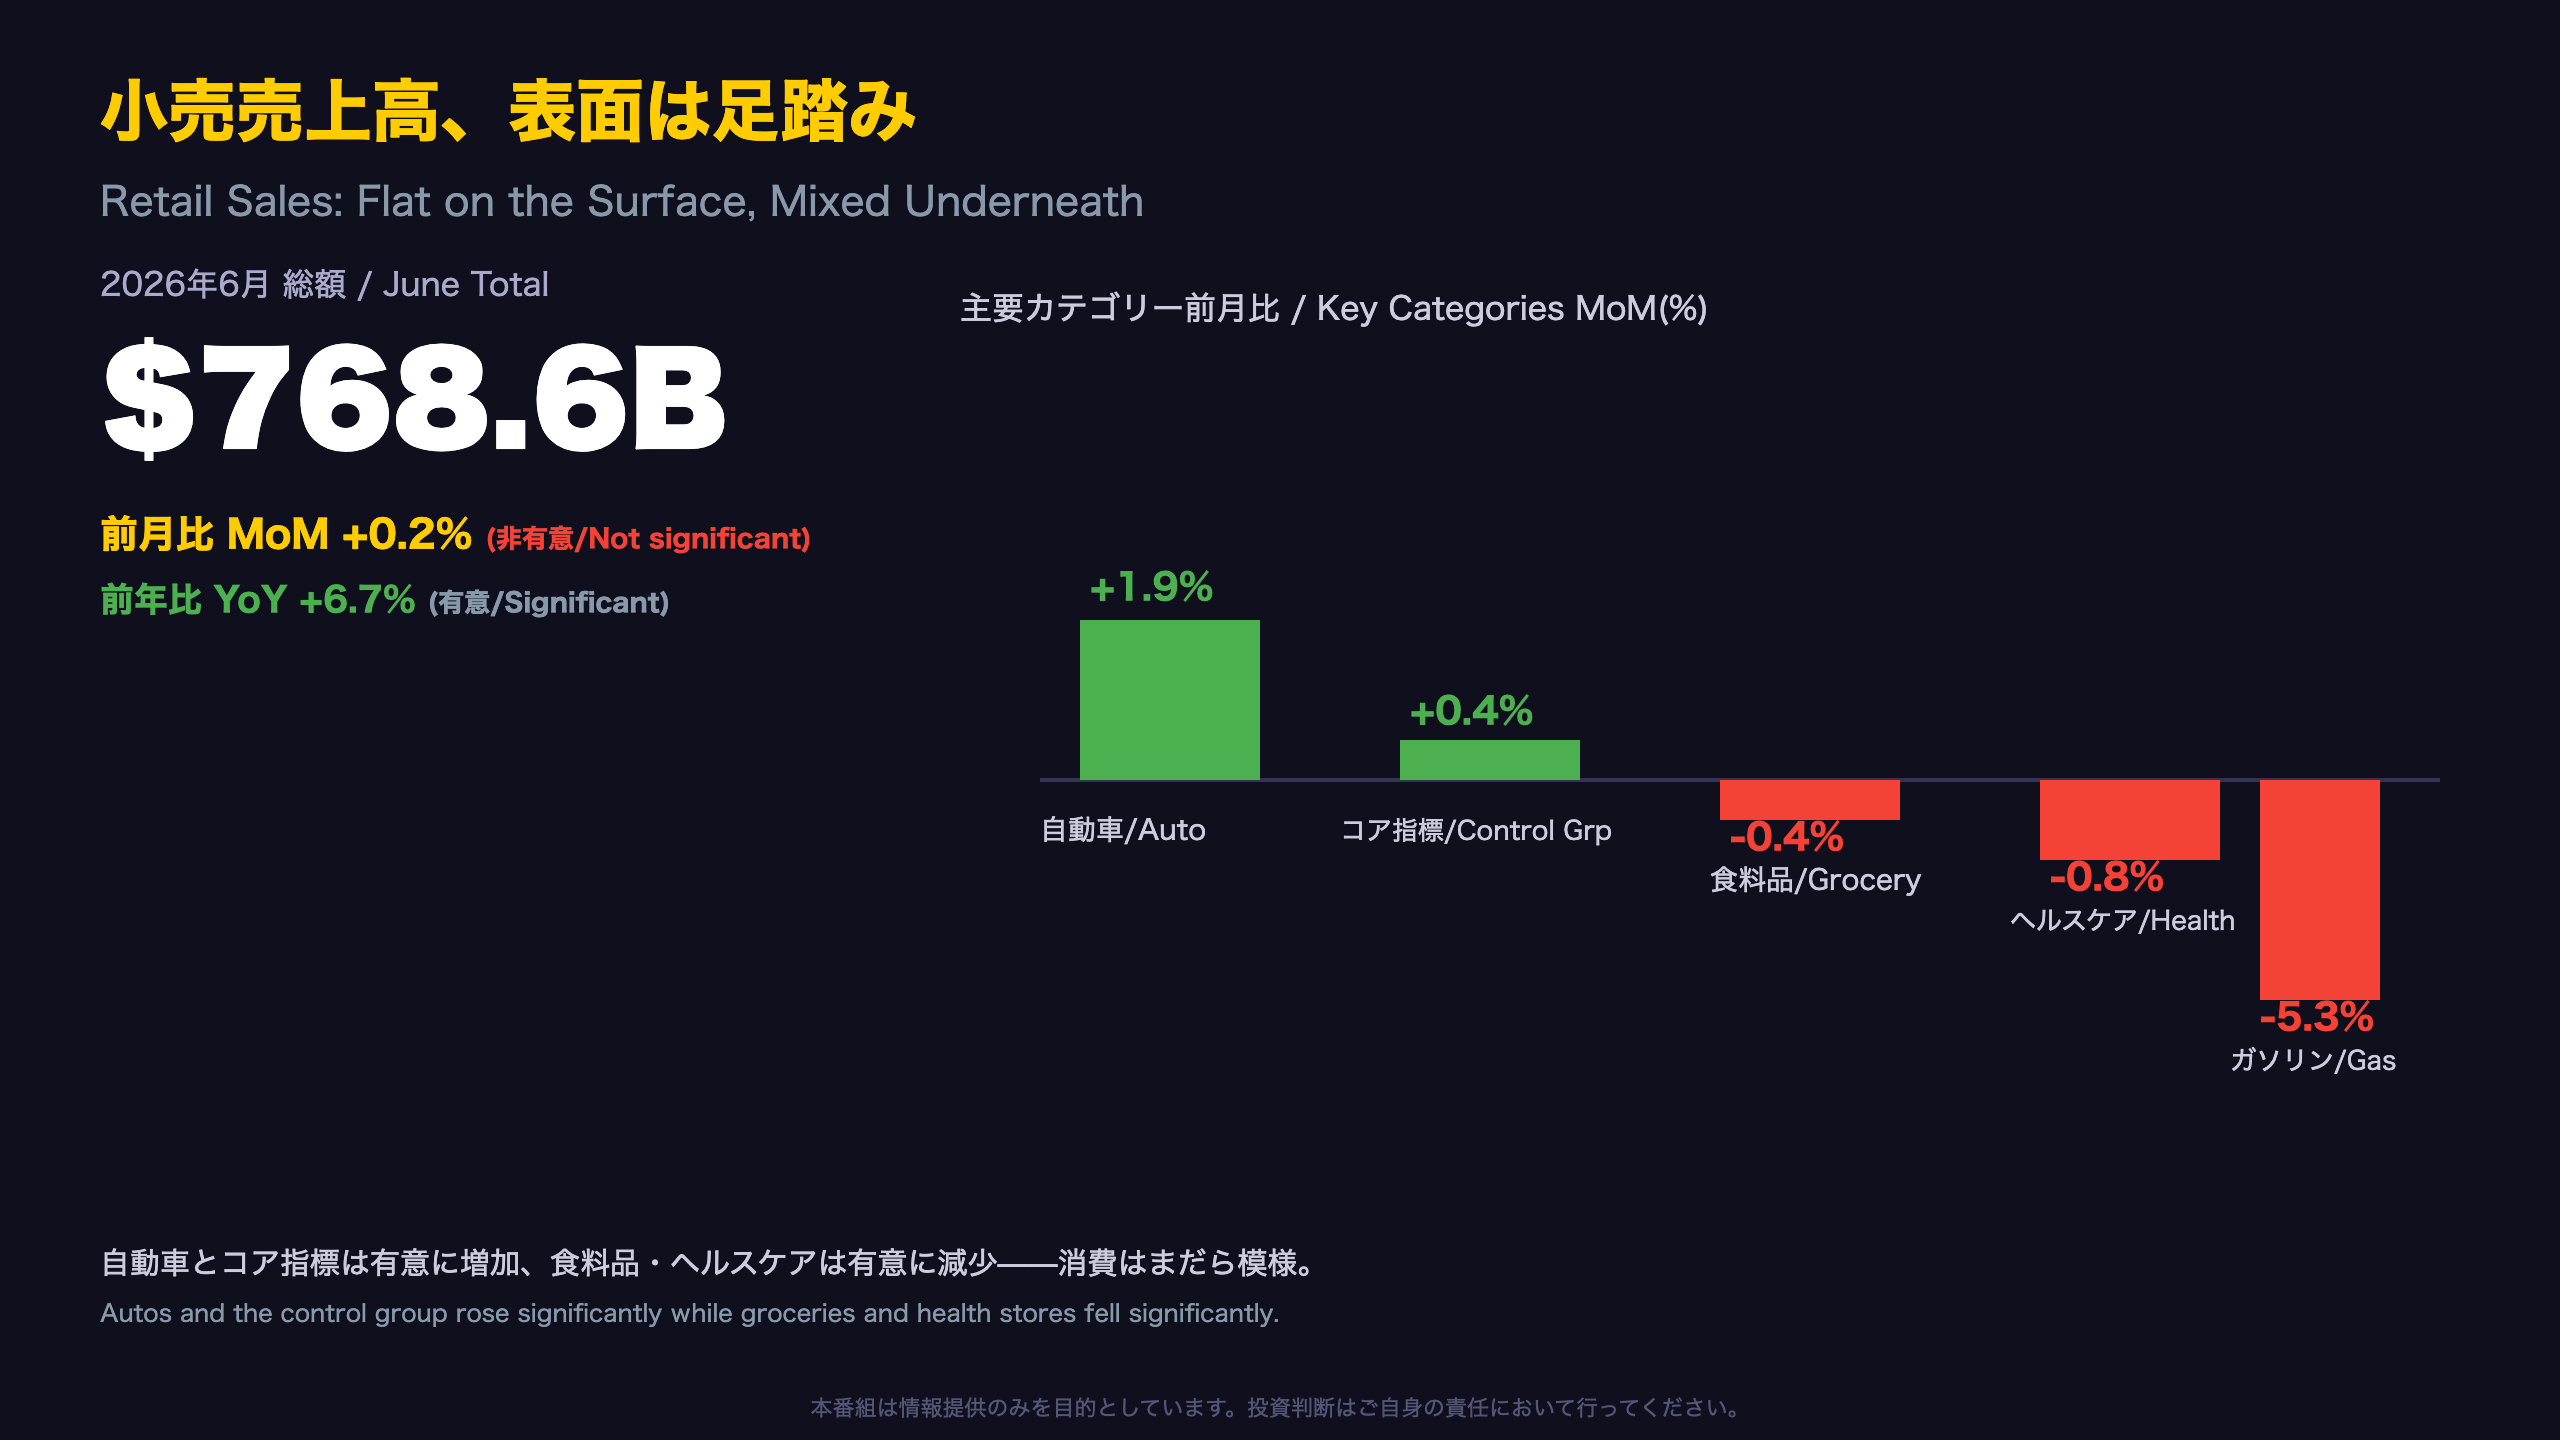
📊 The U.S. Census Bureau’s June retail sales report shows total sales of $768.6B, up just +0.2% month-over-month.
⚠️ That change sits inside a 90% confidence interval that includes zero—statistically indistinguishable from no change.
🚗 Motor vehicle dealers rose a significant +1.9%, the second straight confirmed monthly gain.
🛒 Grocery (-0.4%) and health/personal care (-0.8%) both posted statistically significant declines.
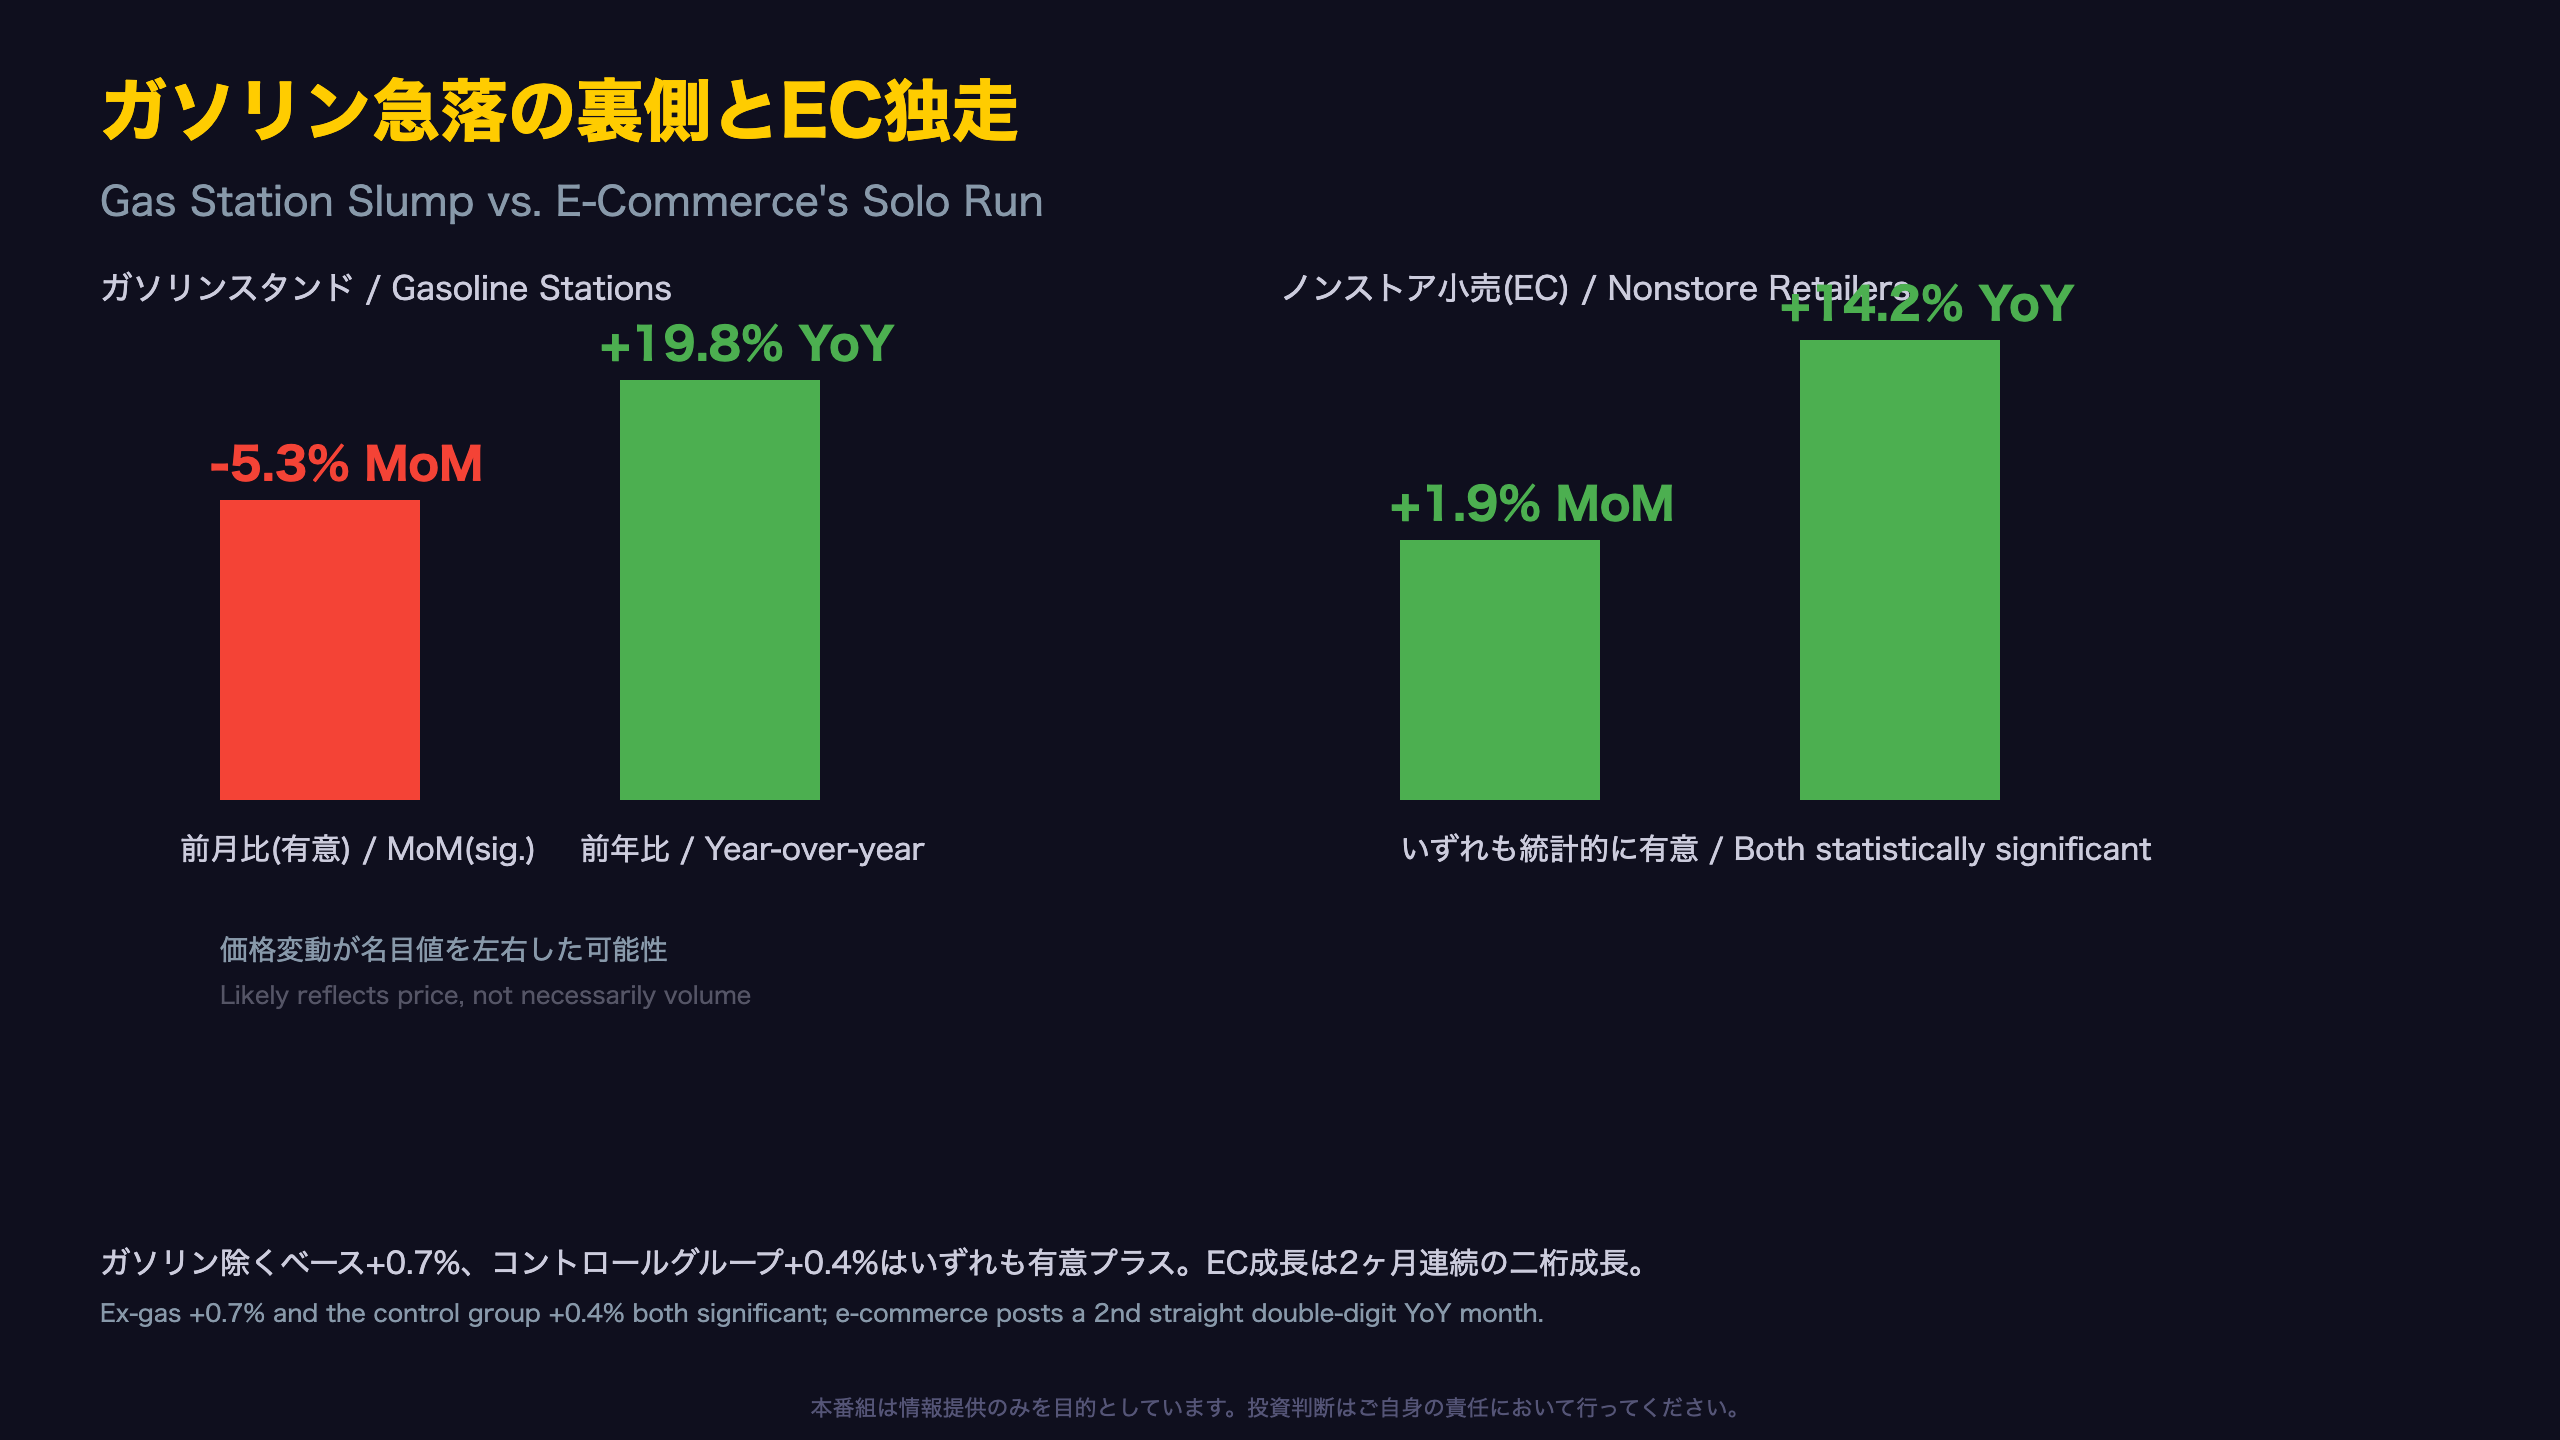
⛽ Gasoline stations plunged -5.3%, likely price-driven rather than volume-driven.
💻 Nonstore retailers (e-commerce) remain up +14.2% year-over-year.
We break down the mixed signals hiding behind the flat headline number.
小売売上高、表面は足踏み — 中身はまだら模様
Why “Statistically Insignificant” Matters More Than the Headline Number
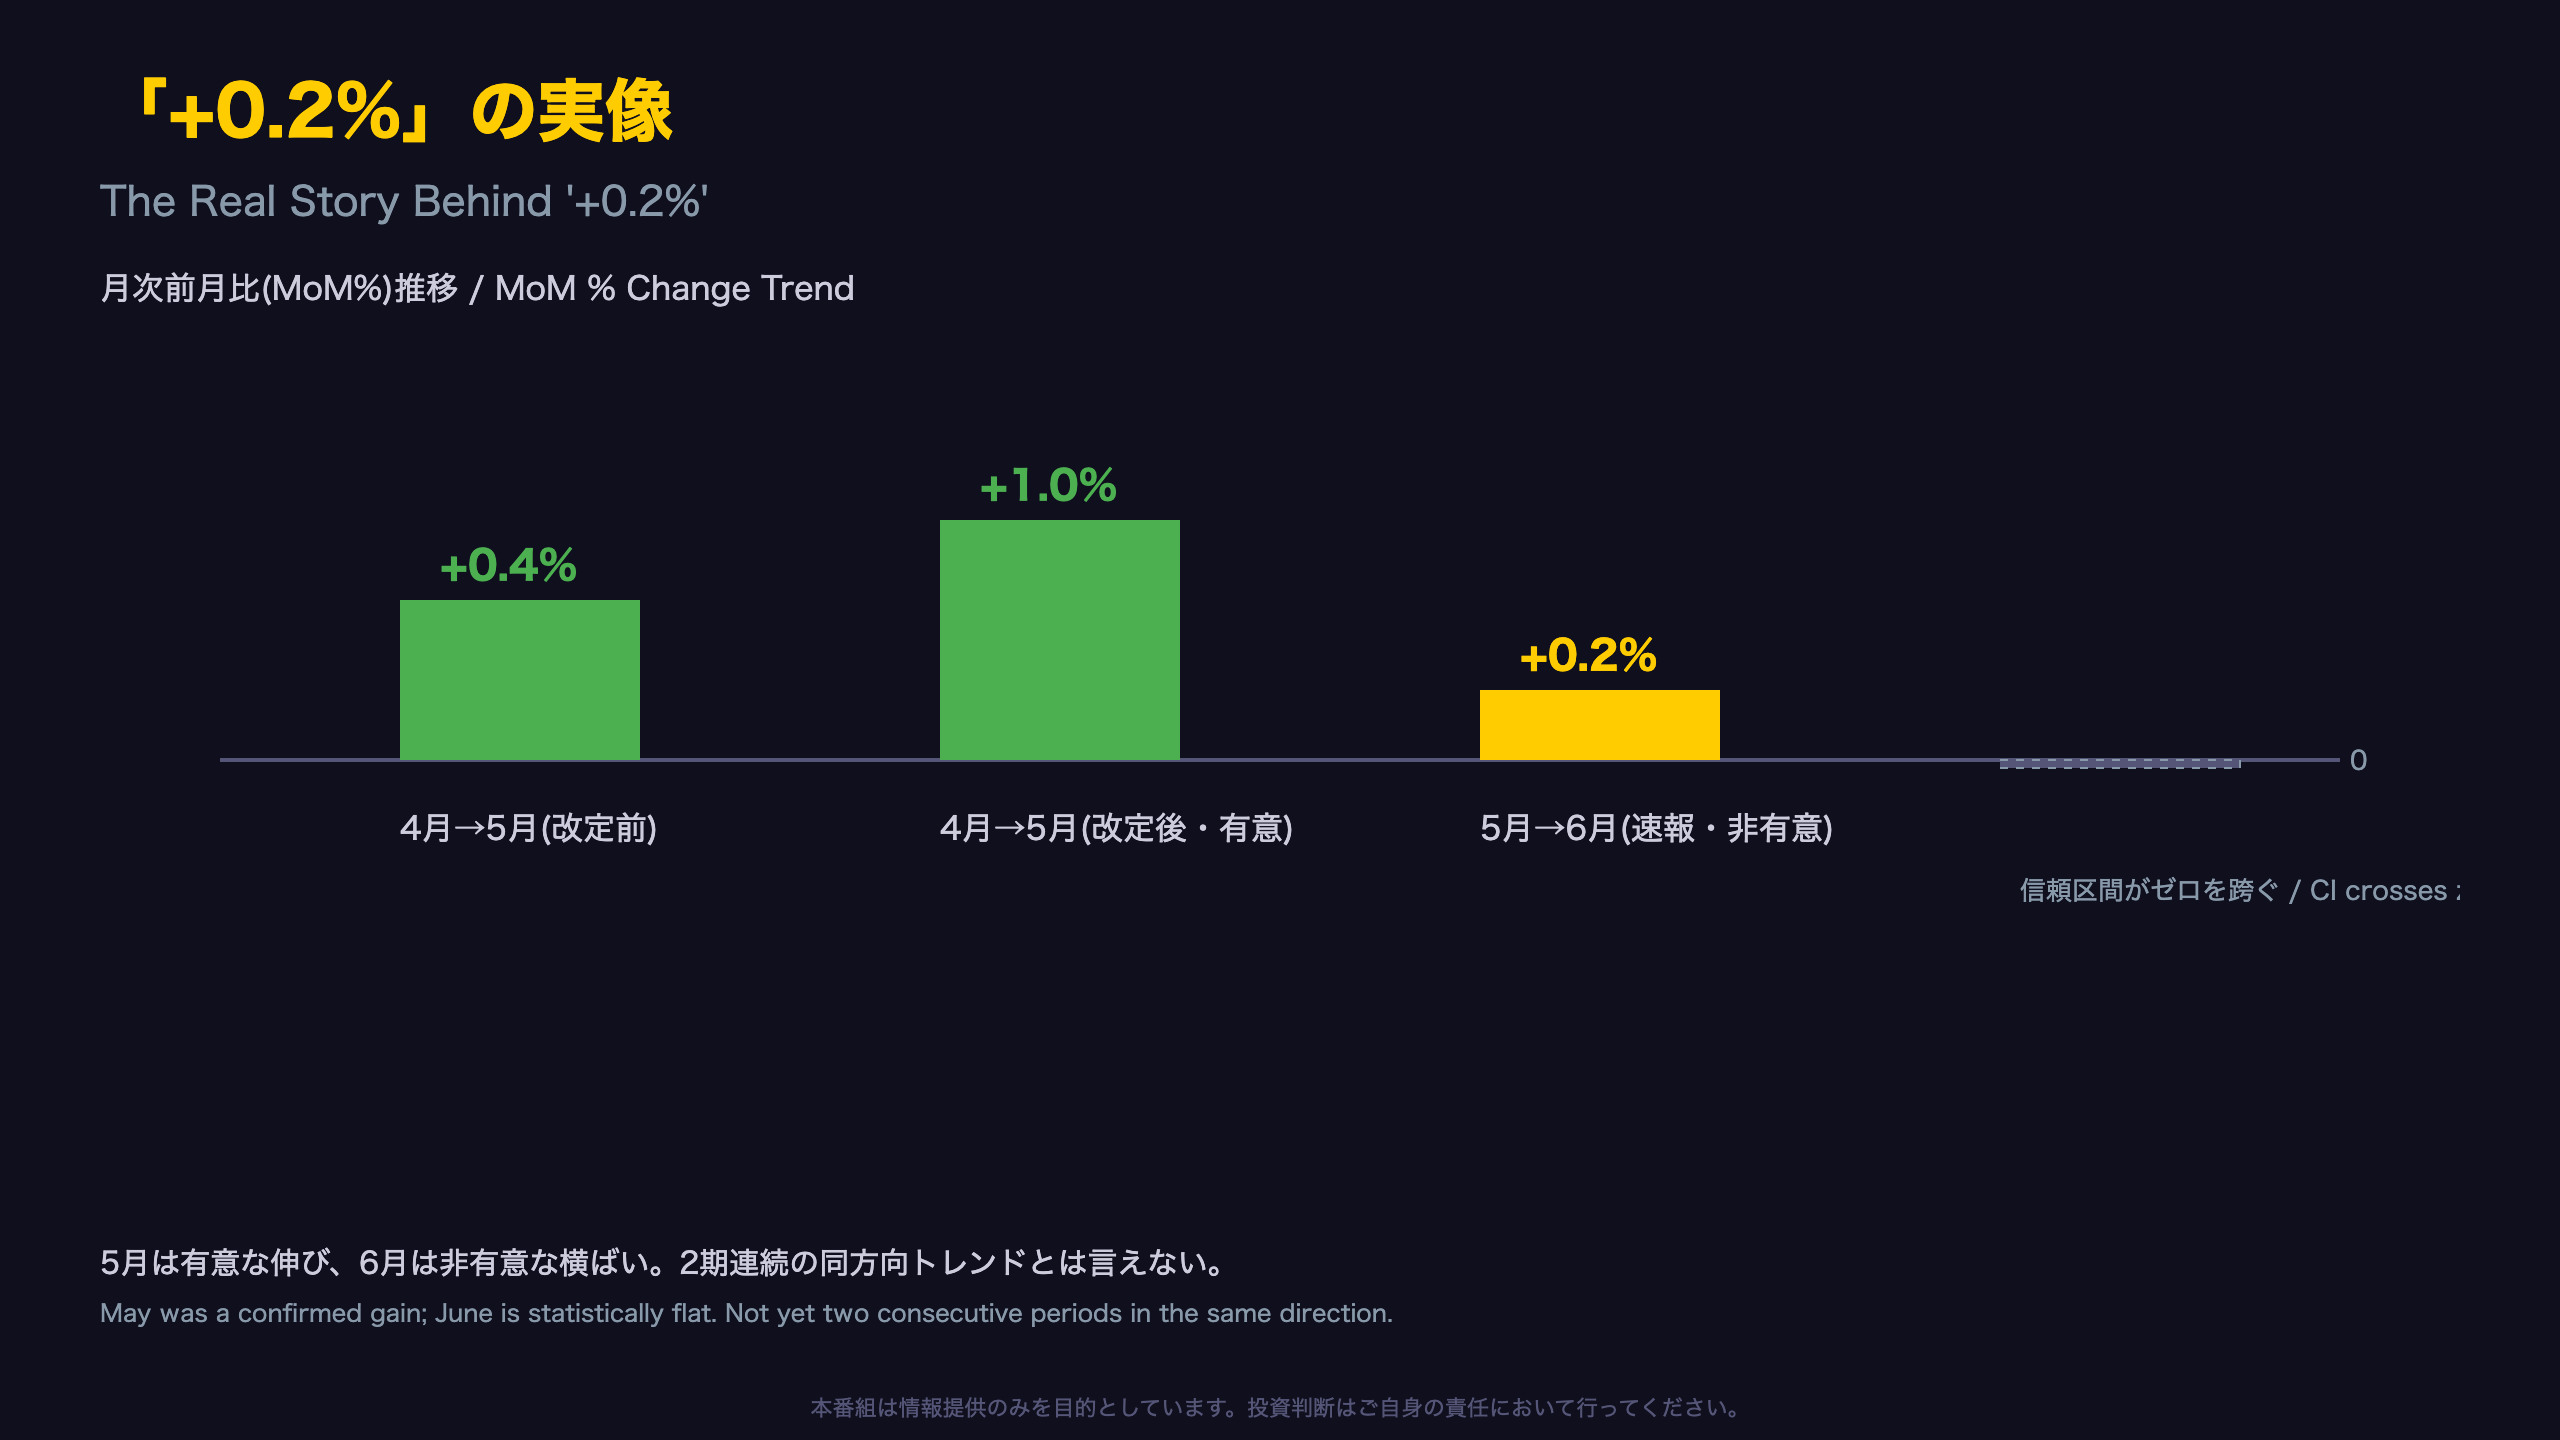
The Census Bureau’s Advance Monthly Retail Trade Survey is a preliminary read based on a sample of roughly 4,800 firms—far smaller than the full Monthly Retail Trade Survey universe of over three million retailers. That is precisely why the report publishes 90 percent confidence intervals alongside every headline number. For June, the agency states plainly: “The 90 percent confidence interval includes zero. There is insufficient statistical evidence to conclude that the actual change is different from zero.” In plain English, the reported +0.2% month-over-month gain cannot be reliably distinguished from no change at all.
Context for international readers
Unlike the University of Michigan sentiment survey or the BLS jobs report, retail sales data is not typically the Fed’s primary focus for policy decisions—CPI and payrolls carry more weight. Still, retail sales feed into the Bureau of Economic Analysis’s GDP estimates through the “control group” (sales excluding autos, gasoline, building materials, and food services), which rose a statistically significant 0.4% this month, following a 0.8% gain in May.
Two-month trend for the control group
That back-to-back significant increase—even as the pace decelerated—is one of the few genuinely confirmable signals in this release, satisfying both statistical significance and directional consistency criteria.
Looking ahead
The July report arrives August 14, and a benchmark revision incorporating the 2023-2024 Annual Integrated Economic Survey is scheduled for September 28—meaning today’s figures remain provisional.
「+0.2%」の実像 — 信頼区間が語る本当の姿
Confidence Intervals 101: Why Economists Treat +0.2% with Caution
The Census Bureau calculates its 90% confidence interval using the formula: estimate ± 1.753 × standard error. For total retail sales, the median standard error is about 0.2%, putting June’s +0.2% reading in a band of roughly -0.15% to +0.55%. Because that range straddles zero, statisticians cannot conclude the change is genuinely different from no change.
Why May’s revision matters
This release revised the April-to-May change from +0.9% to +1.0%, with a tighter ±0.2% interval that does not include zero—a confirmed, significant increase. That means June’s growth is being compared against an already-elevated base, a classic “base effect” that can mechanically flatten the following month’s reported gain.
Quarterly context for U.S. macro watchers
The April-June quarter posted a year-over-year gain of 6.4% (±0.5%), and a 2.9% gain versus the January-March quarter—somewhat softer than the 3.2% three-month-over-three-month pace reported in the prior release. This is a single data point, however, not yet a confirmed trend, and should be read with appropriate caution by anyone drawing conclusions for Fed policy expectations.
What to watch next
The July Advance report lands August 14. Whether the current “not significant” reading persists, or gives way to a confirmed increase or decrease, will be the next real signal for consumer spending momentum.
自動車は伸びても、食卓と薬局は縮む
Two Confirmed Months of Auto Strength
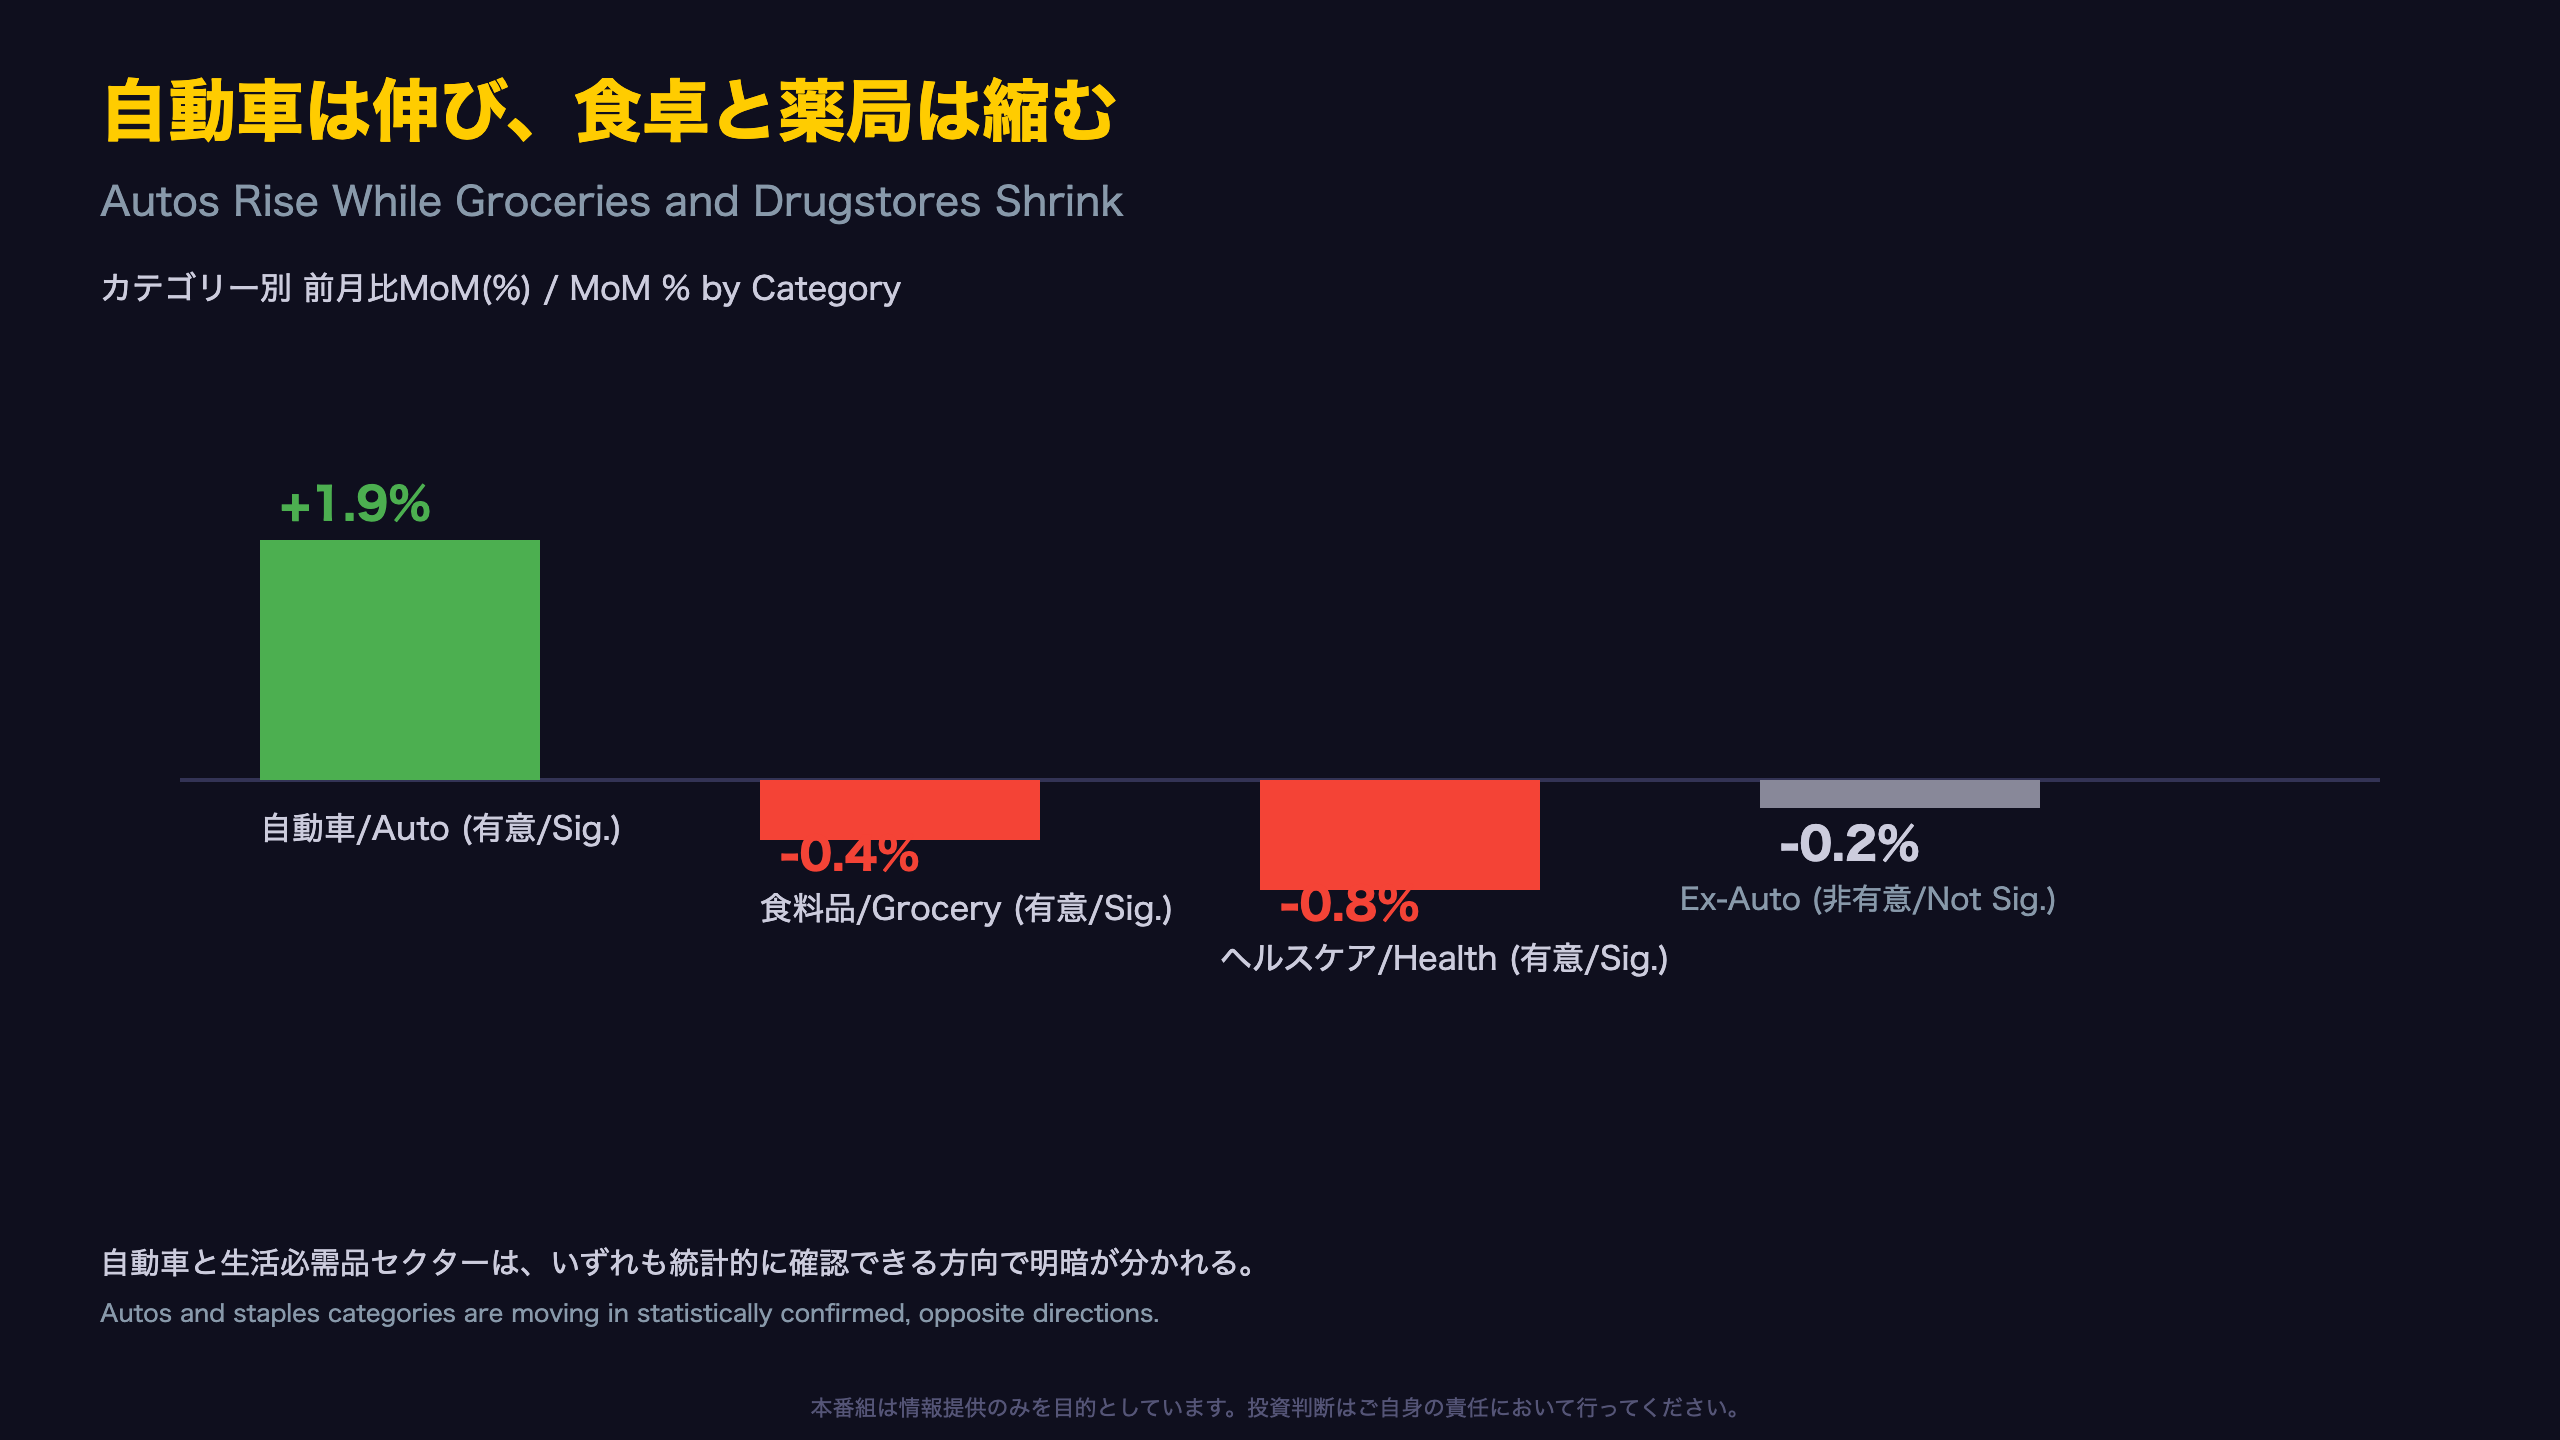
Motor vehicle dealer sales rose a significant 1.1% from April to May and accelerated to a significant 1.9% from May to June—satisfying both the statistical-significance and two-consecutive-period criteria for a genuine trend. The report does not break out whether this reflects rising average transaction prices or higher unit volumes, so analysts should treat this as directional strength rather than a precise volume signal.
Confirmed weakness in staples
Grocery stores fell a significant 0.4% (confidence interval ±0.175%) and health and personal care stores dropped a significant 0.8% (±0.7%)—both intervals exclude zero. Year-over-year growth in these categories is also tepid: +0.9% for groceries and just +0.2% for health and personal care, versus a national retail sales YoY average of +6.7%. As with gasoline, food price fluctuations may be one factor behind the softer nominal figures, but a single month of data cannot confirm a broader pattern of defensive consumer behavior.
The “ex-auto” trap
The headline ex-motor-vehicle figure of -0.2% looks like a decline, but its confidence interval of ±0.35% includes zero. Concluding that “non-auto spending fell” based on this number alone would be a statistically unsupported claim—a useful reminder for anyone scanning headline tables without checking the underlying error margins.
ガソリン急落の裏側と、独走するネット通販
Nominal Dollars, Not Volumes: The Gasoline Caveat
Retail sales are reported in nominal dollar terms, unadjusted for price changes. Gasoline stations’ -5.3% monthly decline is statistically significant (confidence interval ±0.7%), but this report alone cannot tell us whether it reflects fewer gallons pumped or a lower price per gallon. As general economic reasoning, falling gasoline prices tend to increase households’ discretionary income—but this is a general mechanism, not something this specific dataset can confirm on its own.
The control group as a cleaner gauge
For readers less familiar with Census terminology: the “control group” (retail sales excluding autos, gasoline, building materials, and food services) is the subset the Bureau of Economic Analysis feeds directly into its GDP consumption estimates. This month it rose a significant 0.4% (±0.35%), suggesting the underlying spending trend, once volatile categories are stripped out, remains resilient.
E-commerce’s consistent strength
Nonstore retailers—Census’s proxy for e-commerce—rose a significant 1.9% on the month (±0.53%) and are up 14.2% year-over-year, following 12.2% growth reported in the prior release. That is two consecutive months of confirmed double-digit annual growth. However, linking this to a broader multi-year narrative of e-commerce share gains would extend beyond what this single report can support.
市場への示唆——『強弱まだら』が意味すること

Reading the Chain of Reasoning Behind This Release
1. Insignificant headline → limited policy implications. June’s +0.2% monthly gain sits inside a confidence interval that includes zero, meaning it cannot be treated as a confirmed change. It would be inappropriate to build a monetary-policy narrative around this single data point. It is generally true that consumption indicators require multiple months of confirmation before being treated as a trend—but that is a general principle, not something this specific report proves.
2. Two straight months of significant control-group growth → resilient underlying spending. The control group, which feeds most directly into the Bureau of Economic Analysis’s personal consumption expenditure estimates, rose a significant 0.8% in May and 0.4% in June—decelerating but still confirmed positive for two consecutive periods. This offers little support for a narrative of an abrupt consumer pullback.
3. Significant declines in staples → sector-level selectivity, not blanket weakness. Statistically confirmed drops in grocery and health and personal-care spending may partly reflect price effects or shifts in purchase timing—plausible explanations, though not provable from a single month’s data. What is clear is that not all retail categories are moving in the same direction.
For FX, rates, and equity watchers
As a general matter, when consumption data lands in a genuinely mixed, neither-strong-nor-weak zone, markets often adopt a wait-and-see posture pending the next data points—payrolls, CPI, and so on. That said, this is a general market mechanism, not a specific prediction this report can support regarding the dollar or U.S. equities.
Disclaimer: This article is for informational purposes only. All investment decisions are made solely at your own risk.