📺 Watch the Full Video Analysis
This article was automatically generated by the NFC Market Live AI analysis system. (Updated: 2026-07-15 21:39 JST)
📄 Primary Source
NFC Market Live
https://www.newyorkfed.org/medialibrary/media/survey/empire/empire2026/2026_07-empire-state-manufacturing-survey.pdf
In-depth analysis of the latest NY Fed Empire State Manufacturing Survey. Our AI extracts the most market-relevant signals and sub-indices to help decode the outlook for the US economy.
📊 Headline index jumps +9.9pts to 15.6
📈 New orders +18.7pts, shipments hit a 4-year high at 24.4
💡 Employment index at its highest since Dec 2022, up for a sixth straight month
⚠️ Yet six-month-ahead expectations broadly declined, and supply availability remains negative
We break down the tension between strong current activity and a more cautious outlook.
総合指数15.6に急上昇、現況と先行きが分岐
Anatomy of the Headline Jump
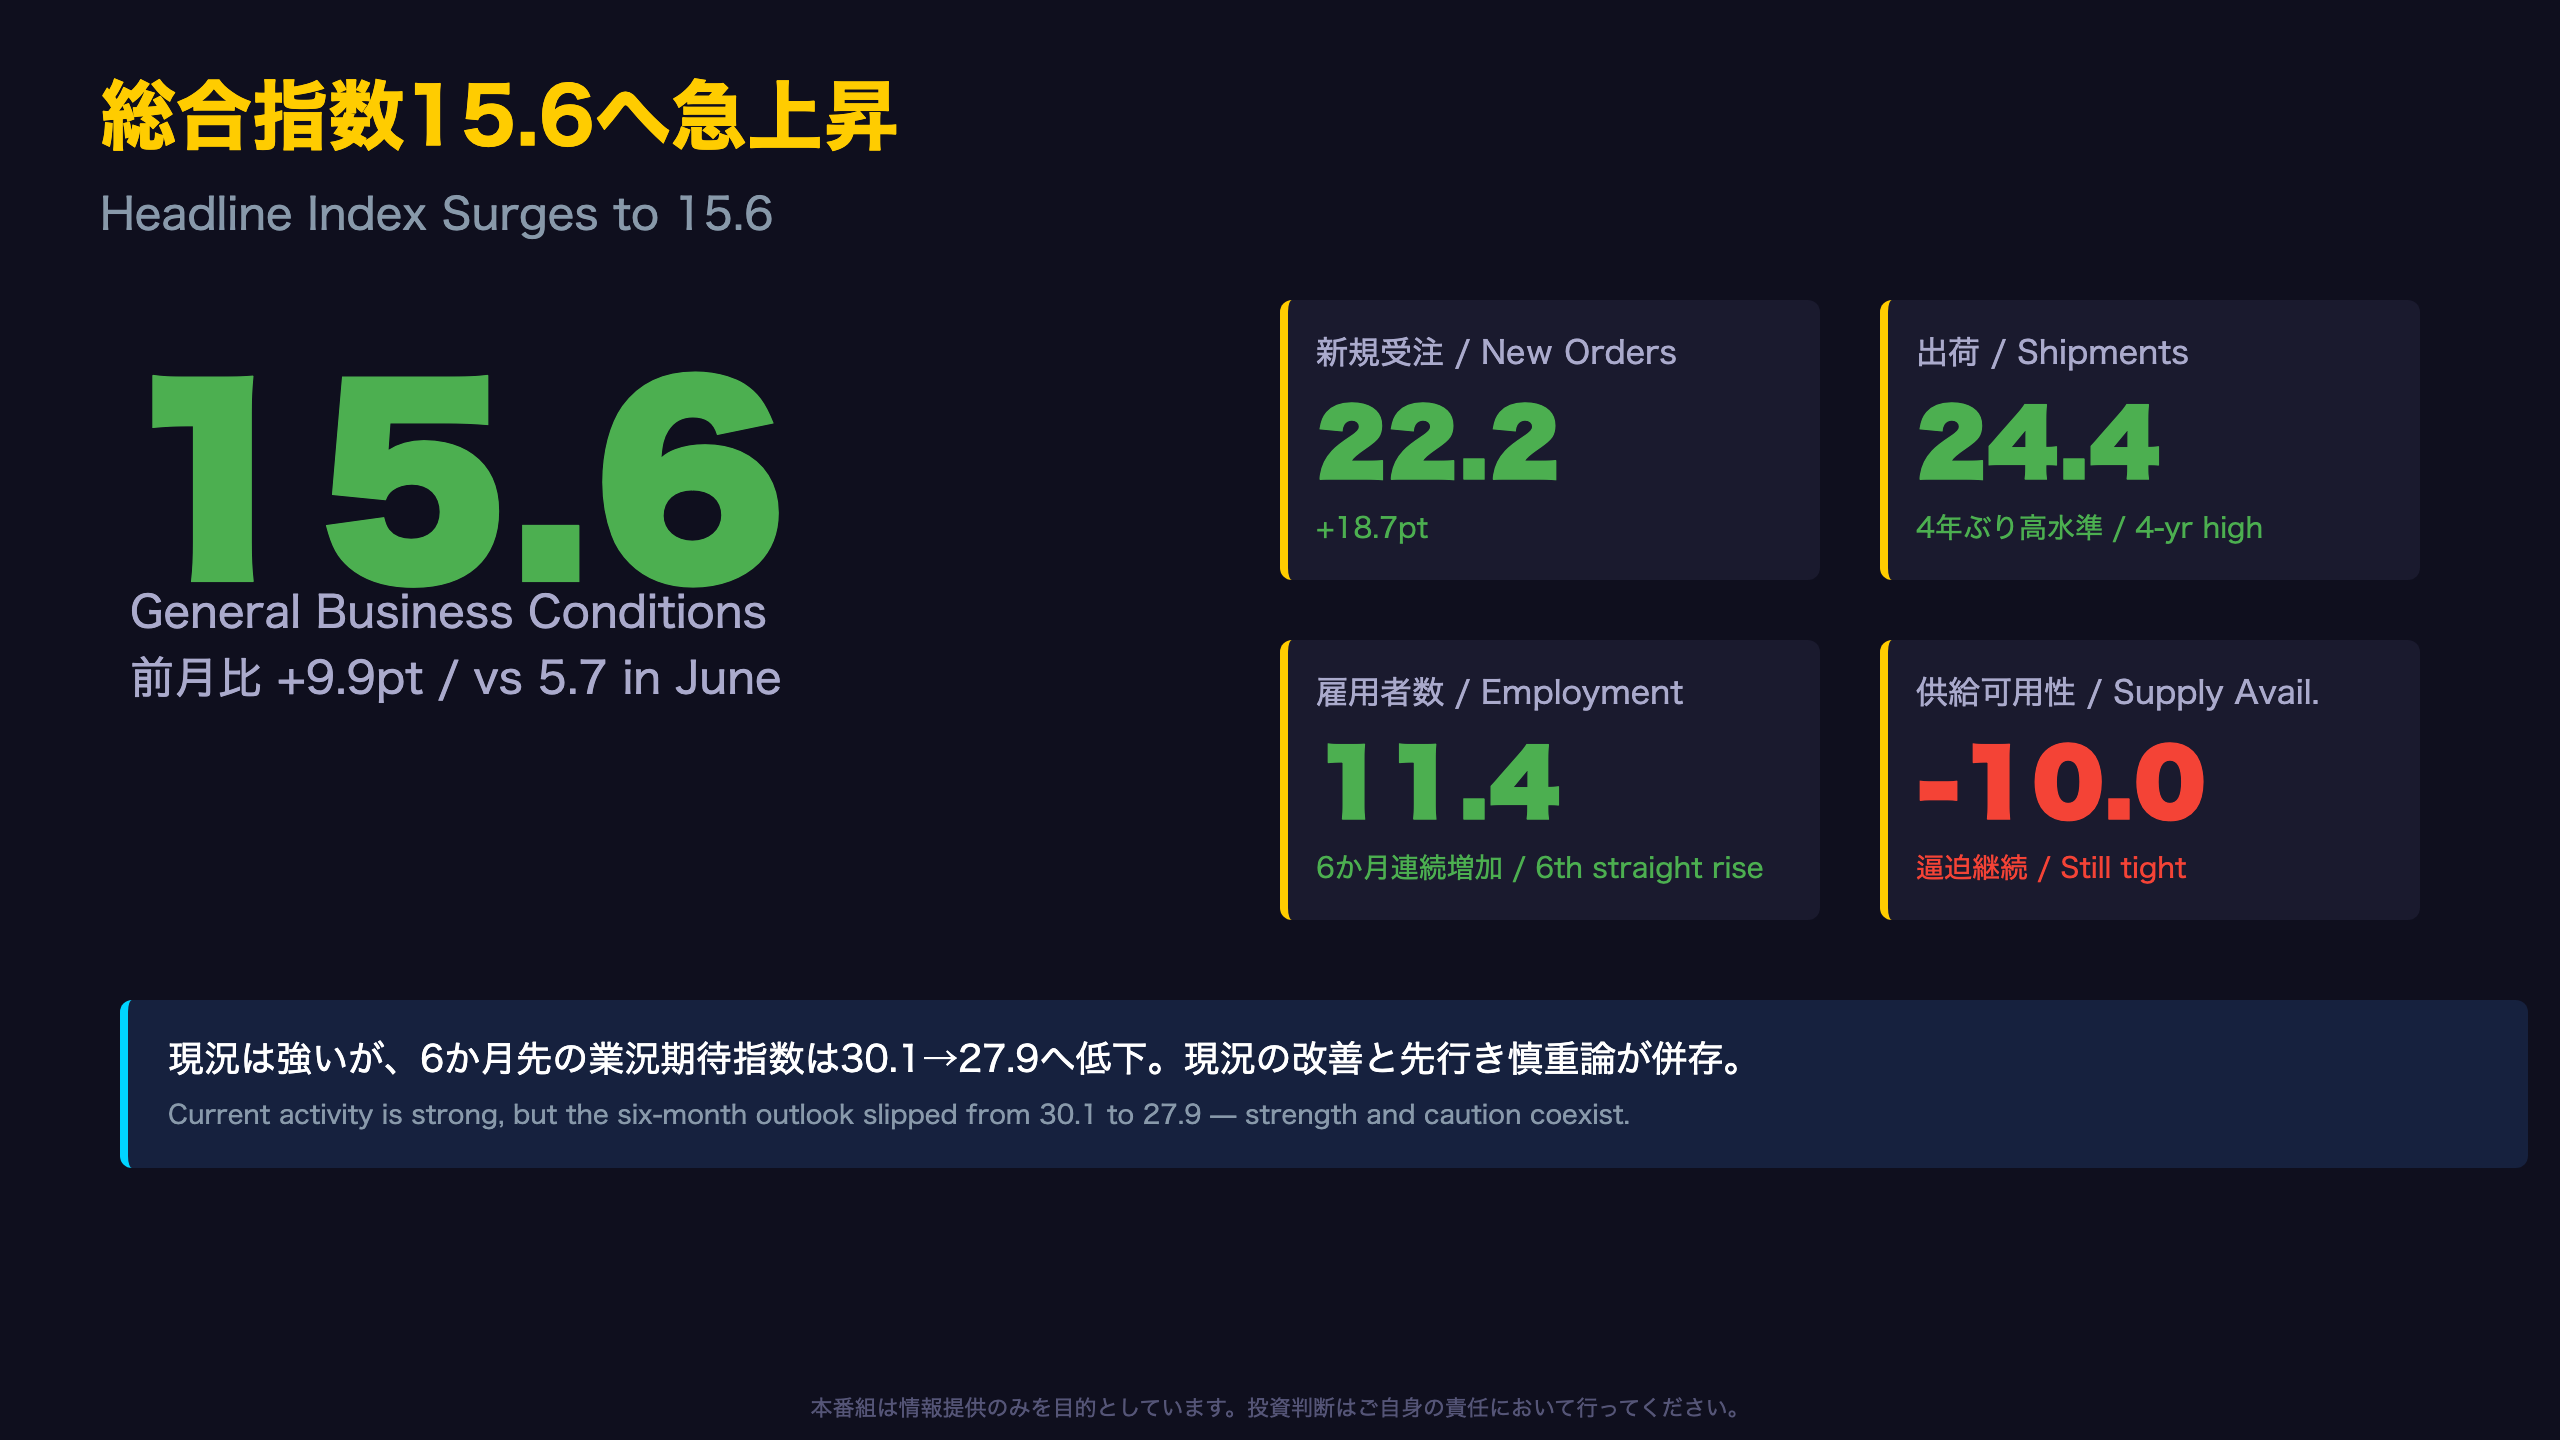
The NY Fed’s July survey showed the general business conditions index rising 9.9 points to 15.6, driven largely by a sharp rebound in demand. New orders surged 18.7 points to 22.2, and shipments jumped 15.8 points to 24.4.
“New York State manufacturing activity increased substantially in July, with new orders and shipments picking up sharply. Employment grew for a sixth consecutive month,” said Richard Deitz, Economic Research Advisor at the New York Fed.
Key Indices (June vs July)
| Index | June | July | Change |
|---|---|---|---|
| General Conditions | 5.7 | 15.6 | +9.9 |
| New Orders | 3.5 | 22.2 | +18.7 |
| Shipments | 8.6 | 24.4 | +15.8 |
| Employment | 9.6 | 11.4 | +1.8 |
For international readers unfamiliar with this survey: the Empire State Manufacturing Survey is the New York Fed’s monthly diffusion-index poll of regional factory executives, and is widely watched as one of the earliest reads on US manufacturing each month — arriving well before the ISM Manufacturing PMI. However, the six-month-ahead general business conditions index slipped from 30.1 to 27.9, showing that current strength has not fully carried through to future confidence. This divergence between present resilience and forward caution is the defining feature of this report.
需要の急回復:新規受注と出荷が牽引
Assessing the Quality of the Demand Rebound
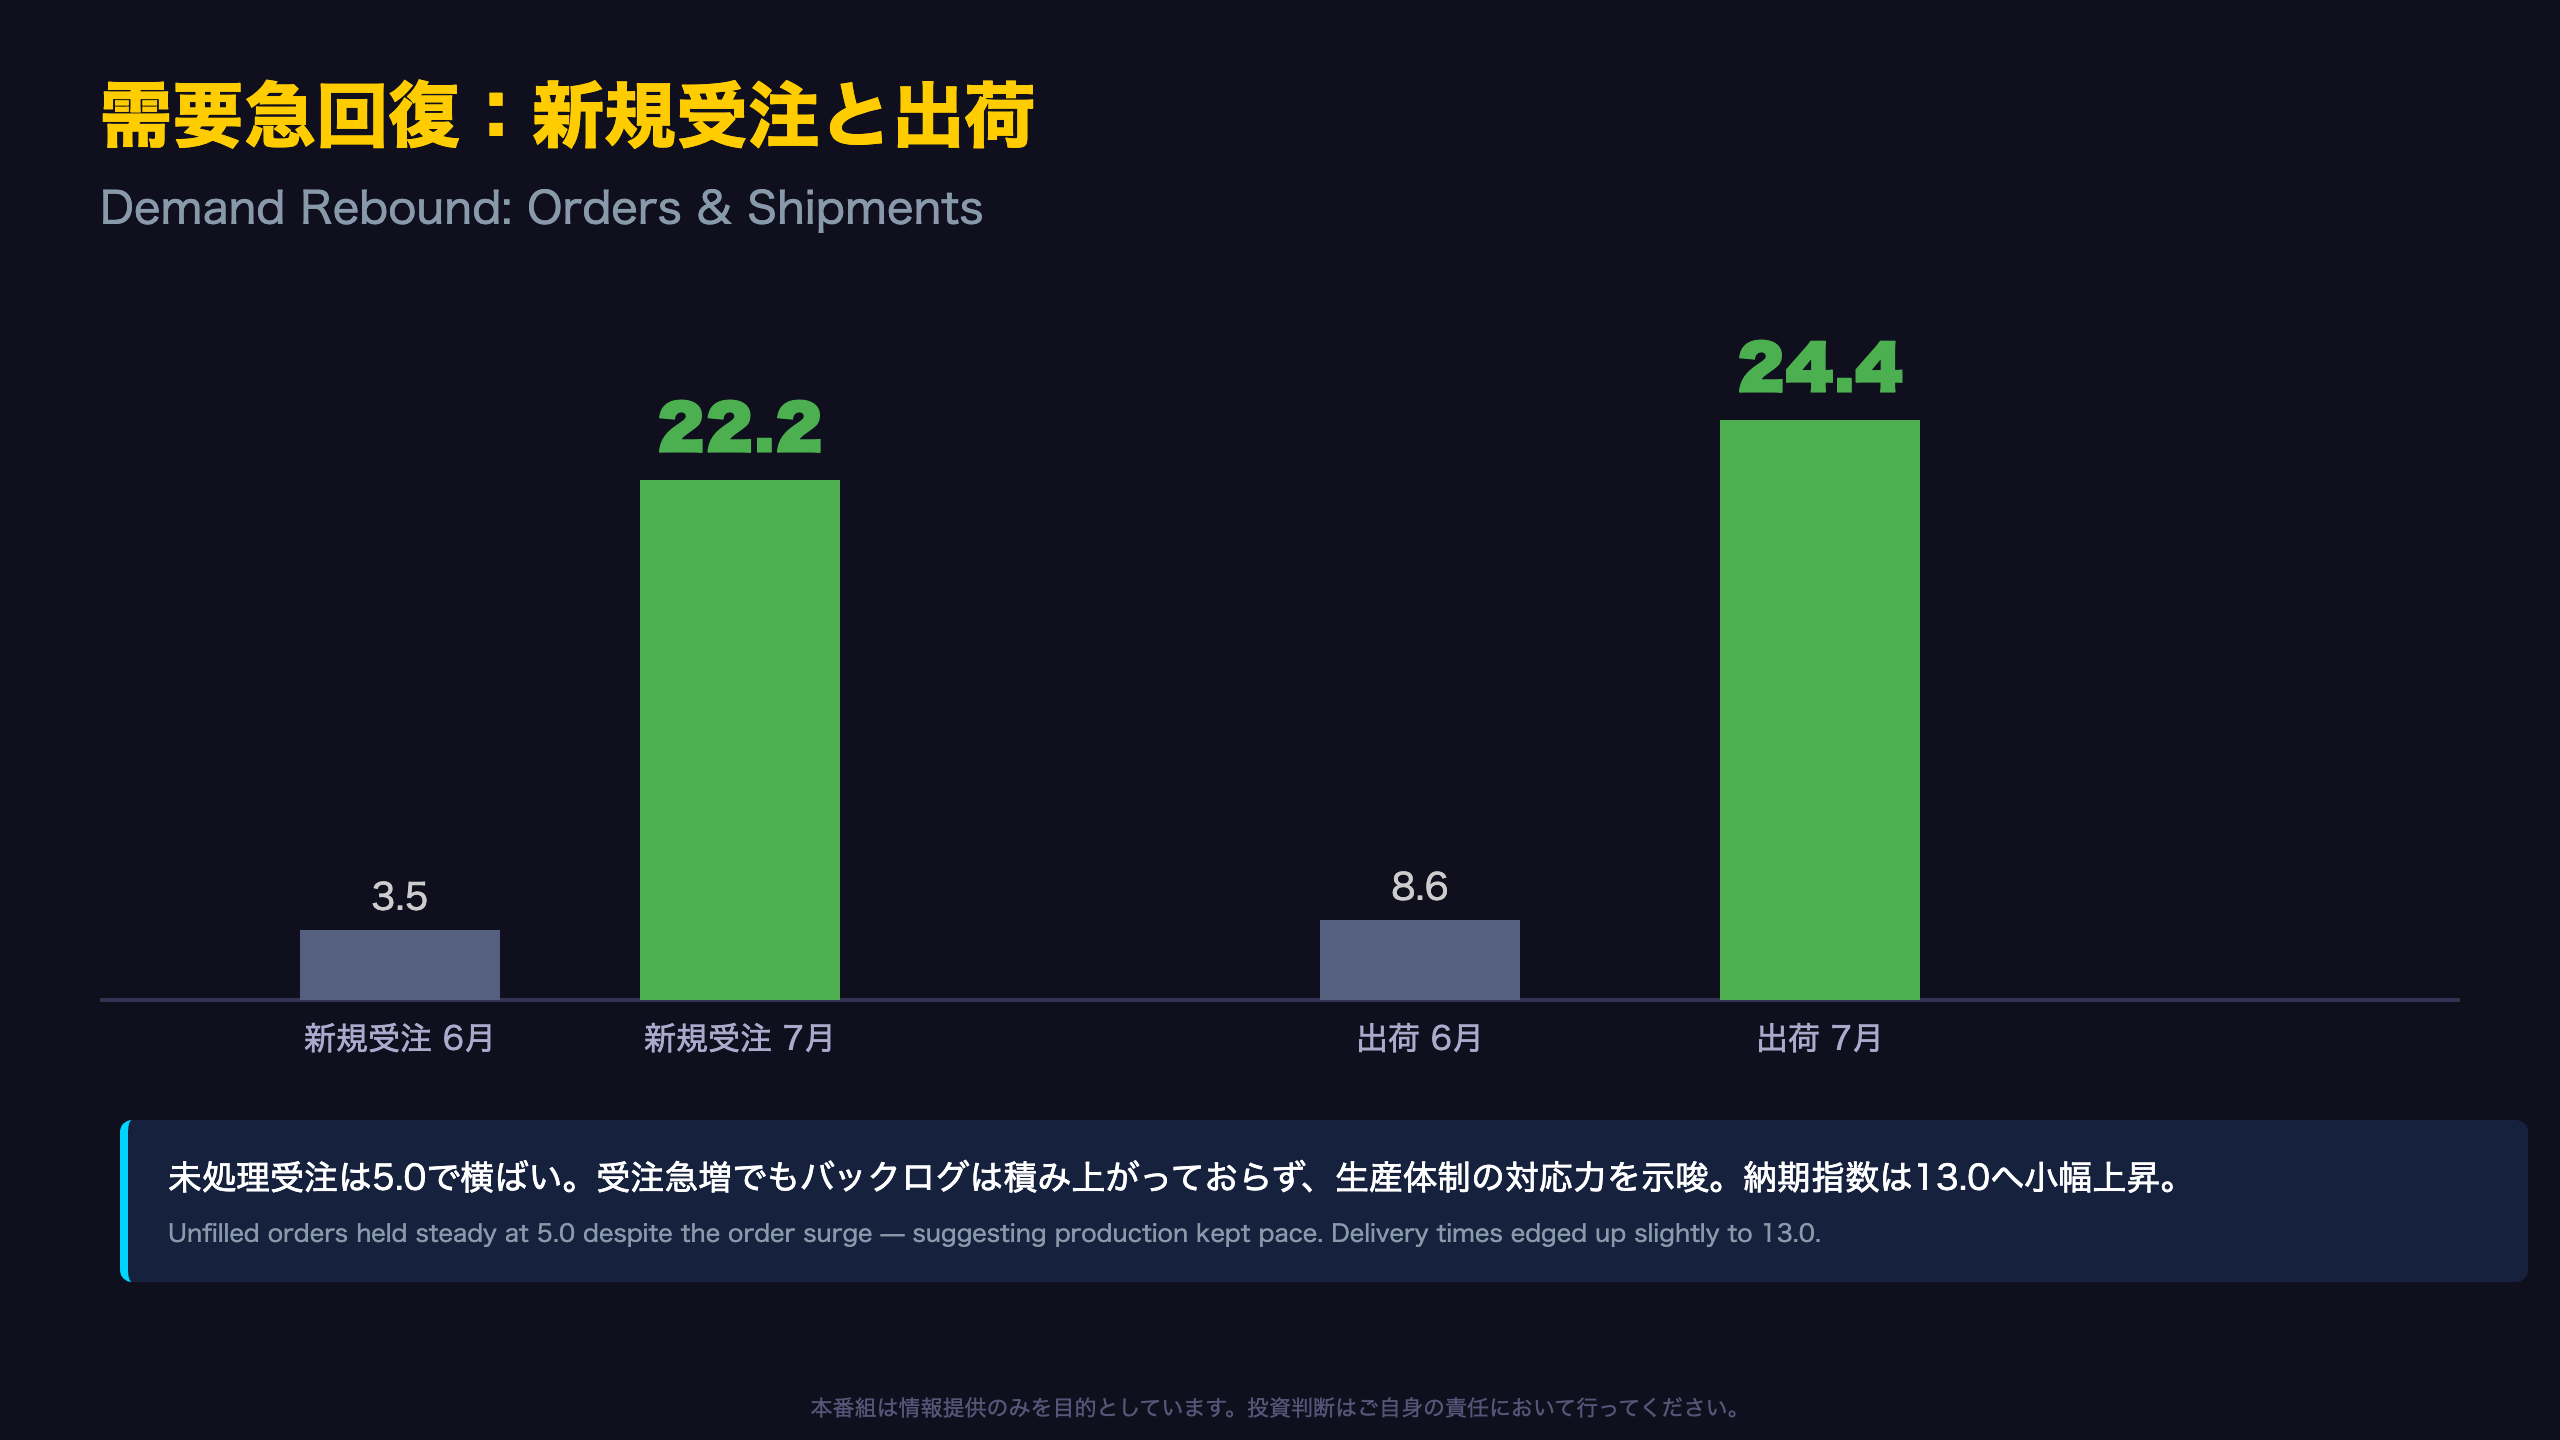
The simultaneous surge in new orders (+18.7pt) and shipments (+15.8pt) suggests this may reflect genuine demand recovery rather than a one-off blip. The report explicitly notes that the shipments index of 24.4 marks roughly a four-year high — one of the strongest readings since the pandemic-era disruptions.
Supply-Demand Balance in Detail
| Index | June | July | Change |
|---|---|---|---|
| New Orders | 3.5 | 22.2 | +18.7 |
| Shipments | 8.6 | 24.4 | +15.8 |
| Unfilled Orders | 5.0 | 5.0 | 0.0 |
| Inventories | 0.0 | 4.0 | +4.0 |
| Delivery Time | 11.9 | 13.0 | +1.1 |
For context, this survey is a diffusion index: a positive reading means more firms reported an increase than a decrease, not the magnitude of change itself. Unfilled orders holding flat despite the order surge suggests factories are broadly keeping pace with demand — a sign of healthy capacity utilization rather than a bottleneck build-up. That said, the modest rise in delivery times shows lingering friction in parts of the supply chain. The uptick in inventories (+4.0pt) could reflect firms building stock in anticipation of continued demand, though this single data point alone does not confirm a trend.
雇用は6か月連続増加、2022年以来の高水準
Employment Index at a Multi-Year High
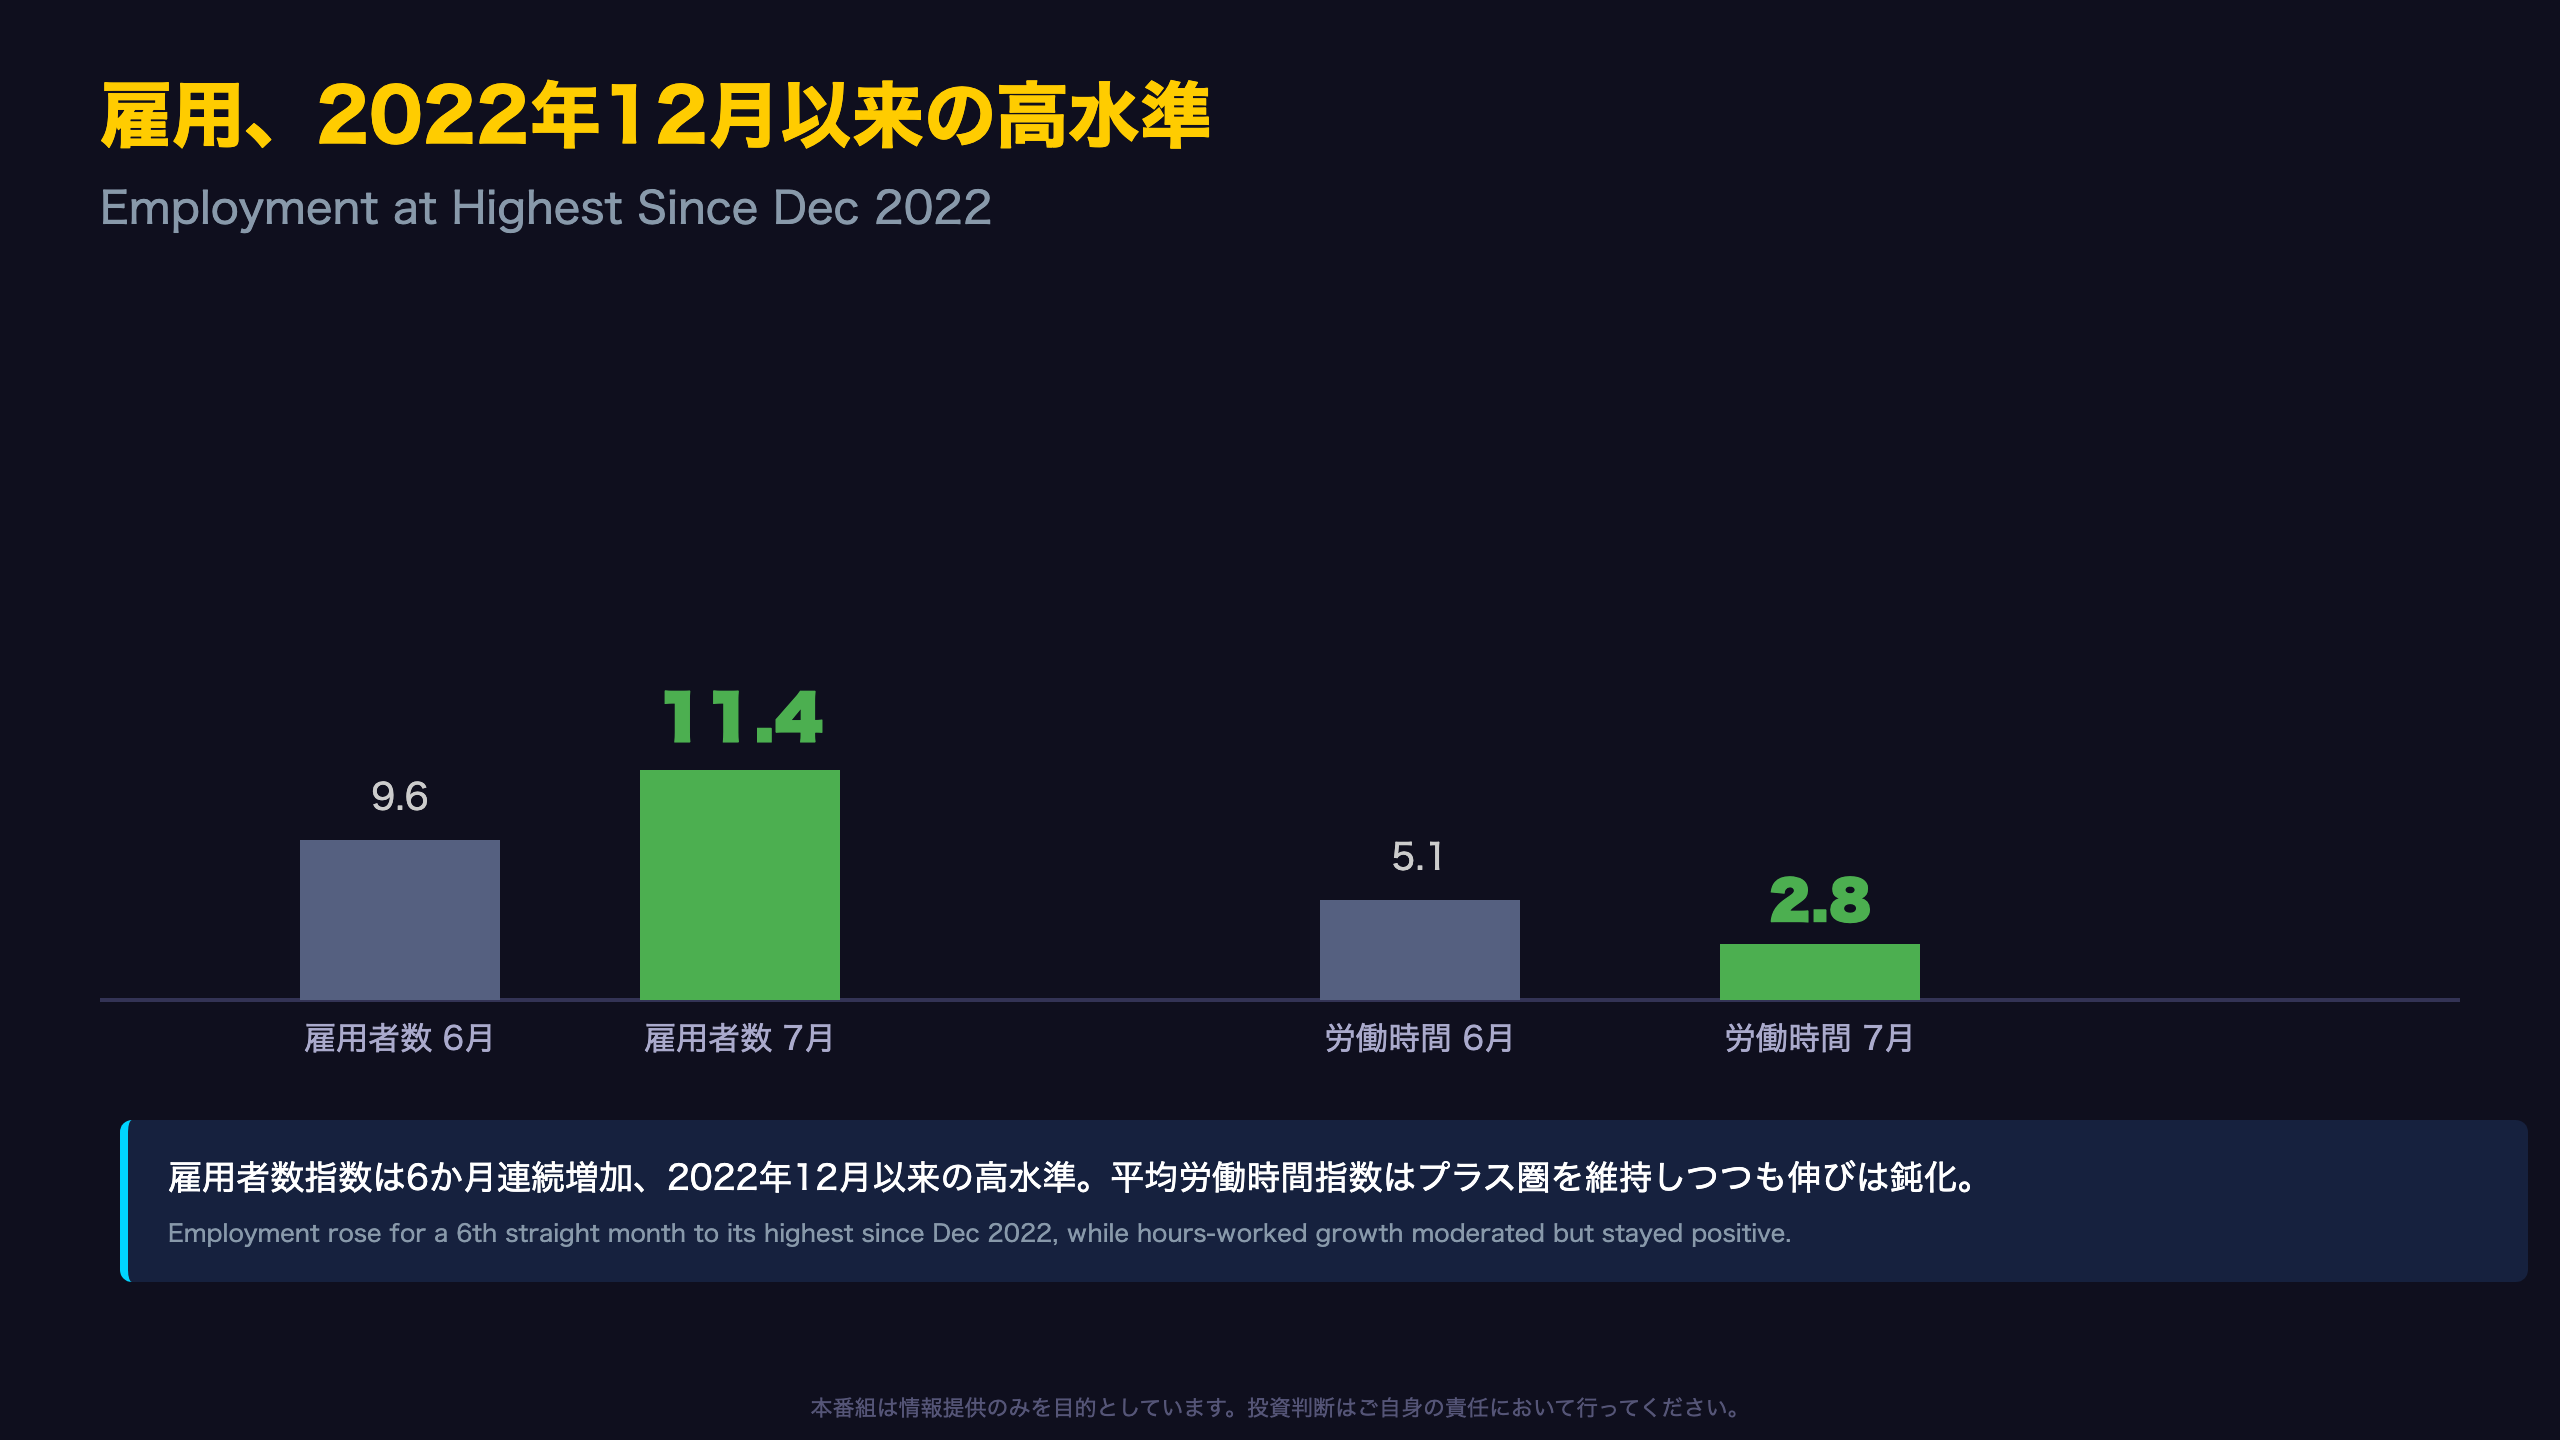
The employment index of 11.4 is, per the report, “its highest reading since December 2022” — a notable milestone in the gradual evolution of the regional labor market. Six consecutive months of gains underscores a steady, incremental expansion in manufacturing headcount.
Labor Market Indicators
| Index | June | July | Change |
|---|---|---|---|
| Employment | 9.6 | 11.4 | +1.8 |
| Average Workweek | 5.1 | 2.8 | -2.3 |
From the release: “The index for number of employees rose two points to 11.4, its highest reading since December 2022, and the average workweek index came in at 2.8, suggesting an increase in both employment and hours worked for a sixth consecutive month.”
For context, this is a regional (New York State) survey and is not directly comparable to the national US Nonfarm Payrolls report, though it is often watched as an early regional proxy for manufacturing labor trends. Notably, while the average workweek index remains in positive territory (implying continued growth in hours), its 2.3-point decline suggests the pace of hours growth is moderating even as headcount additions continue. This divergence — steady hiring alongside slower hours growth — is one factor worth monitoring in next month’s release.
価格圧力は鈍化も高水準、供給制約は解消せず
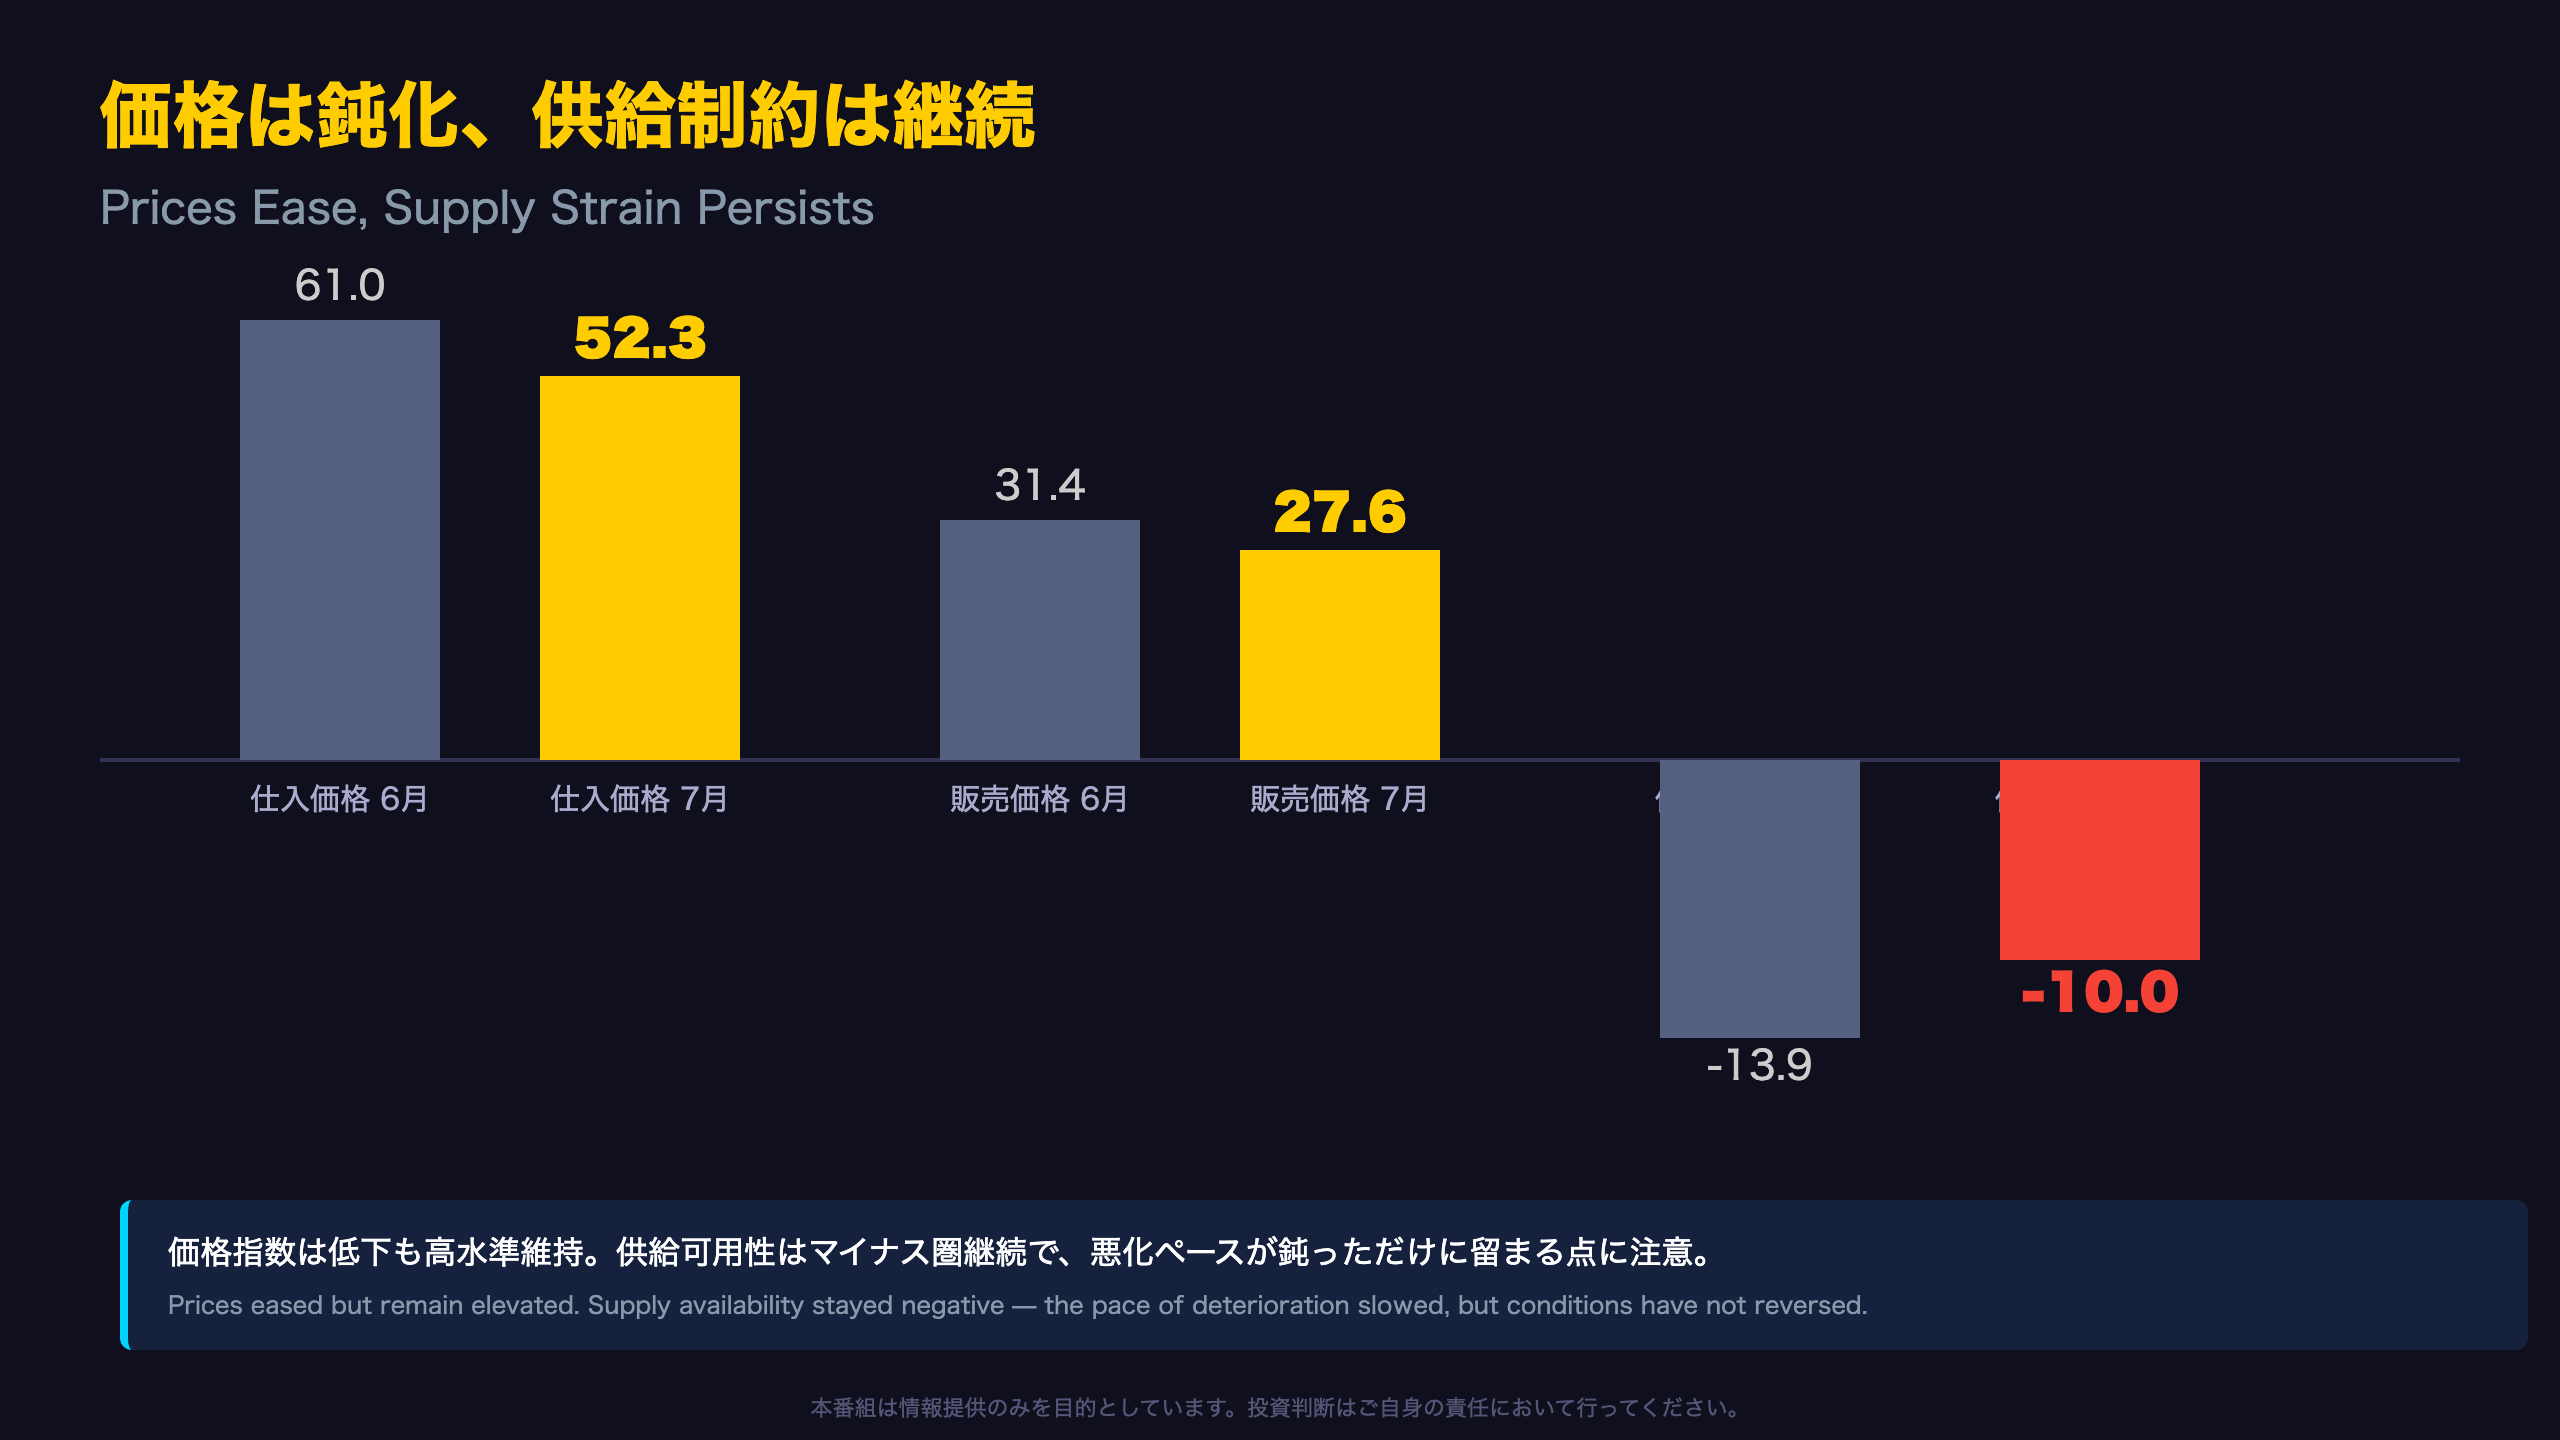
Two Diverging Stories: Cooling Prices, Persistent Supply Strain
Both prices paid (-8.7pt) and prices received (-3.8pt) declined, and the report explicitly attributes this to a slowdown in the pace of increases “after particularly sharp increases in May and June.” This could be one early signal of inflationary pressure peaking within this regional survey.
Cost & Supply Indicators
| Index | June | July | Change |
|---|---|---|---|
| Prices Paid | 61.0 | 52.3 | -8.7 |
| Prices Received | 31.4 | 27.6 | -3.8 |
| Supply Availability | -13.9 | -10.0 | +3.9 |
| Delivery Time | 11.9 | 13.0 | +1.1 |
However, the supply availability index remains negative at -10.0. For readers unfamiliar with this sub-index: it measures whether firms find it easier or harder to obtain needed inputs, with negative values indicating net deterioration. The 3.9-point improvement means the pace of deterioration slowed, not that supply conditions actually improved — an important distinction. With prices paid still at 52.3 and prices received at 27.6, both remain in relatively elevated territory (well above zero), suggesting cost pass-through pressure has not fully abated. This combination — decelerating price growth alongside persistent (if slightly less severe) supply strain — captures the report’s core tension for Fed watchers assessing near-term goods inflation.
特異点:6か月先期待は軒並み低下
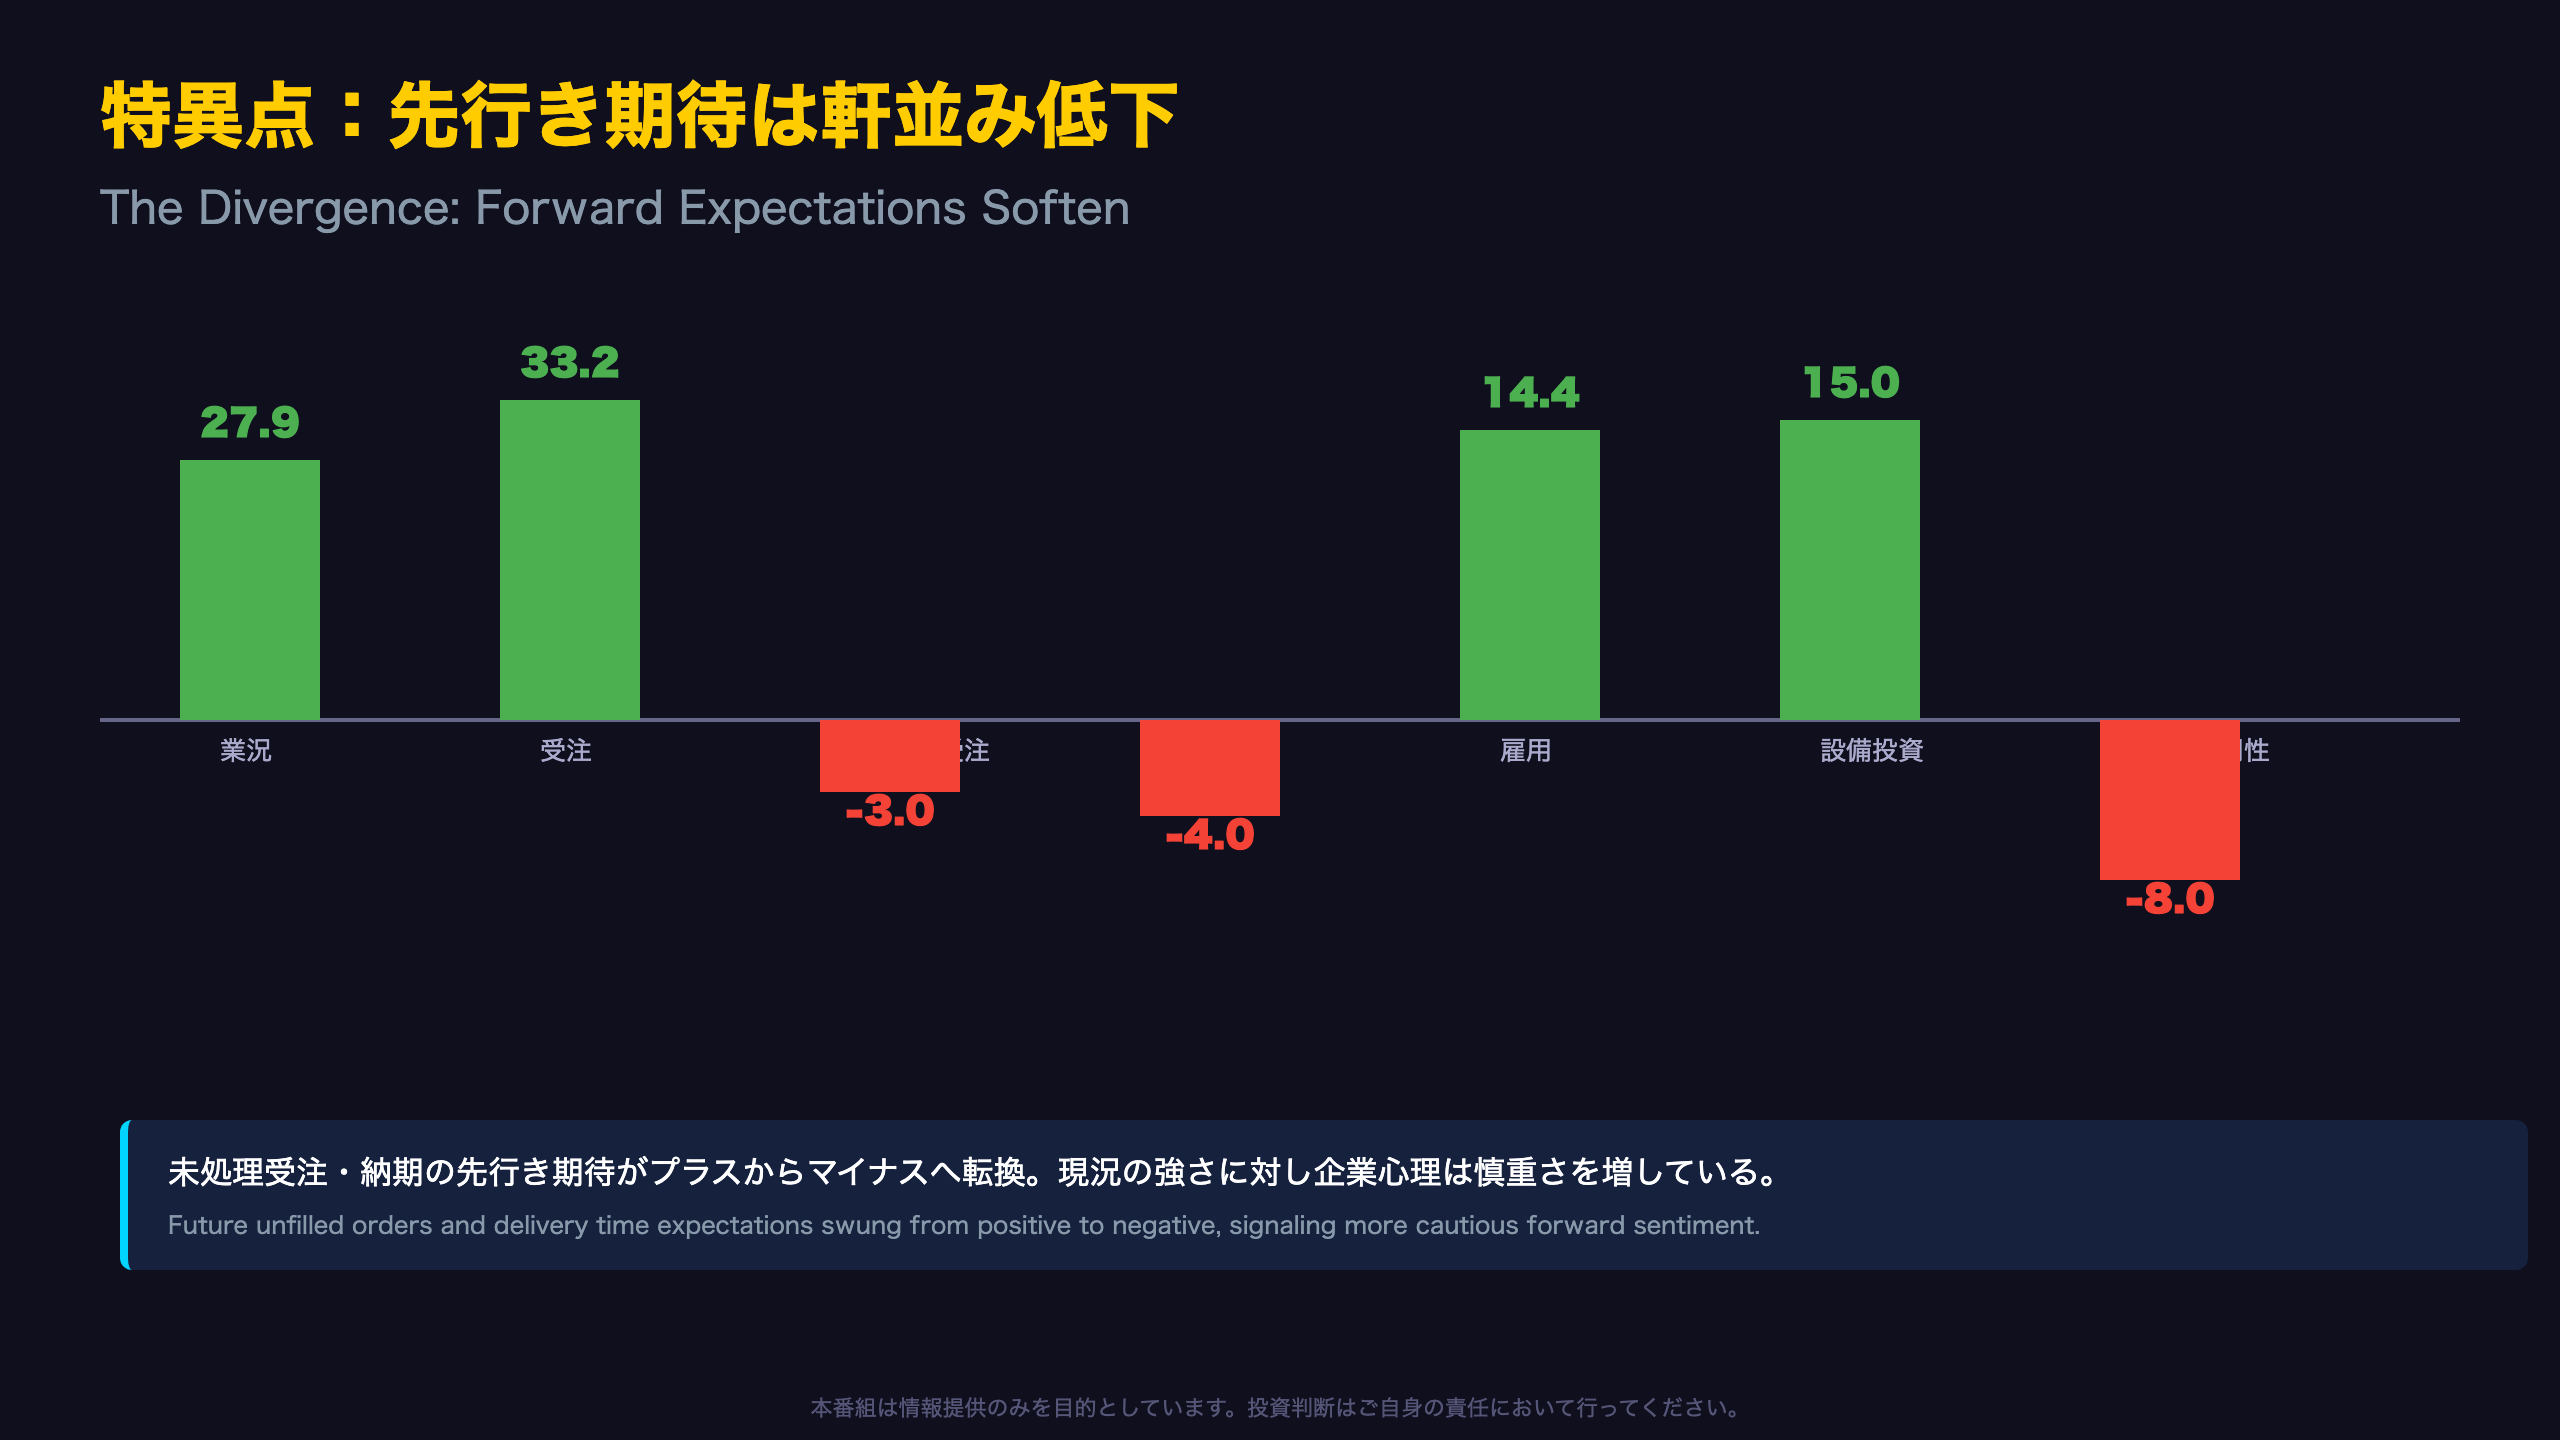
The Key Divergence: Present Strength vs. Future Caution
The most notable feature of this report is the sharp divergence between robust current activity and broadly weaker six-month-ahead expectations. Future unfilled orders (8.9 → -3.0, -11.9pt) and future delivery times (7.9 → -4.0, -11.9pt) both swung from positive to negative — a significant deterioration in supply-side expectations.
Six-Month-Ahead Expectations
| Index | June | July | Change |
|---|---|---|---|
| General Conditions | 30.1 | 27.9 | -2.2 |
| Unfilled Orders | 8.9 | -3.0 | -11.9 |
| Delivery Time | 7.9 | -4.0 | -11.9 |
| Employment | 20.9 | 14.4 | -6.5 |
| Prices Paid | 59.4 | 53.0 | -6.4 |
| Prices Received | 51.6 | 41.9 | -9.7 |
| Capital Expenditures | 10.9 | 15.0 | +4.1 |
One notable exception is capital expenditure expectations, which rose from 10.9 to 15.0. However, the report separately notes that “capital spending plans remained modest,” suggesting the improvement is from a low base rather than a strong investment signal. For US-focused investors, this divergence between present strength and forward caution echoes a pattern also seen at times in the ISM and other regional Fed surveys (Philly Fed, Richmond Fed), where headline current-conditions gauges can outrun business sentiment about the outlook. Whether this gap proves temporary or signals a more structural shift will depend on subsequent monthly releases.
インプリケーション:現況の強さとFRBへの示唆
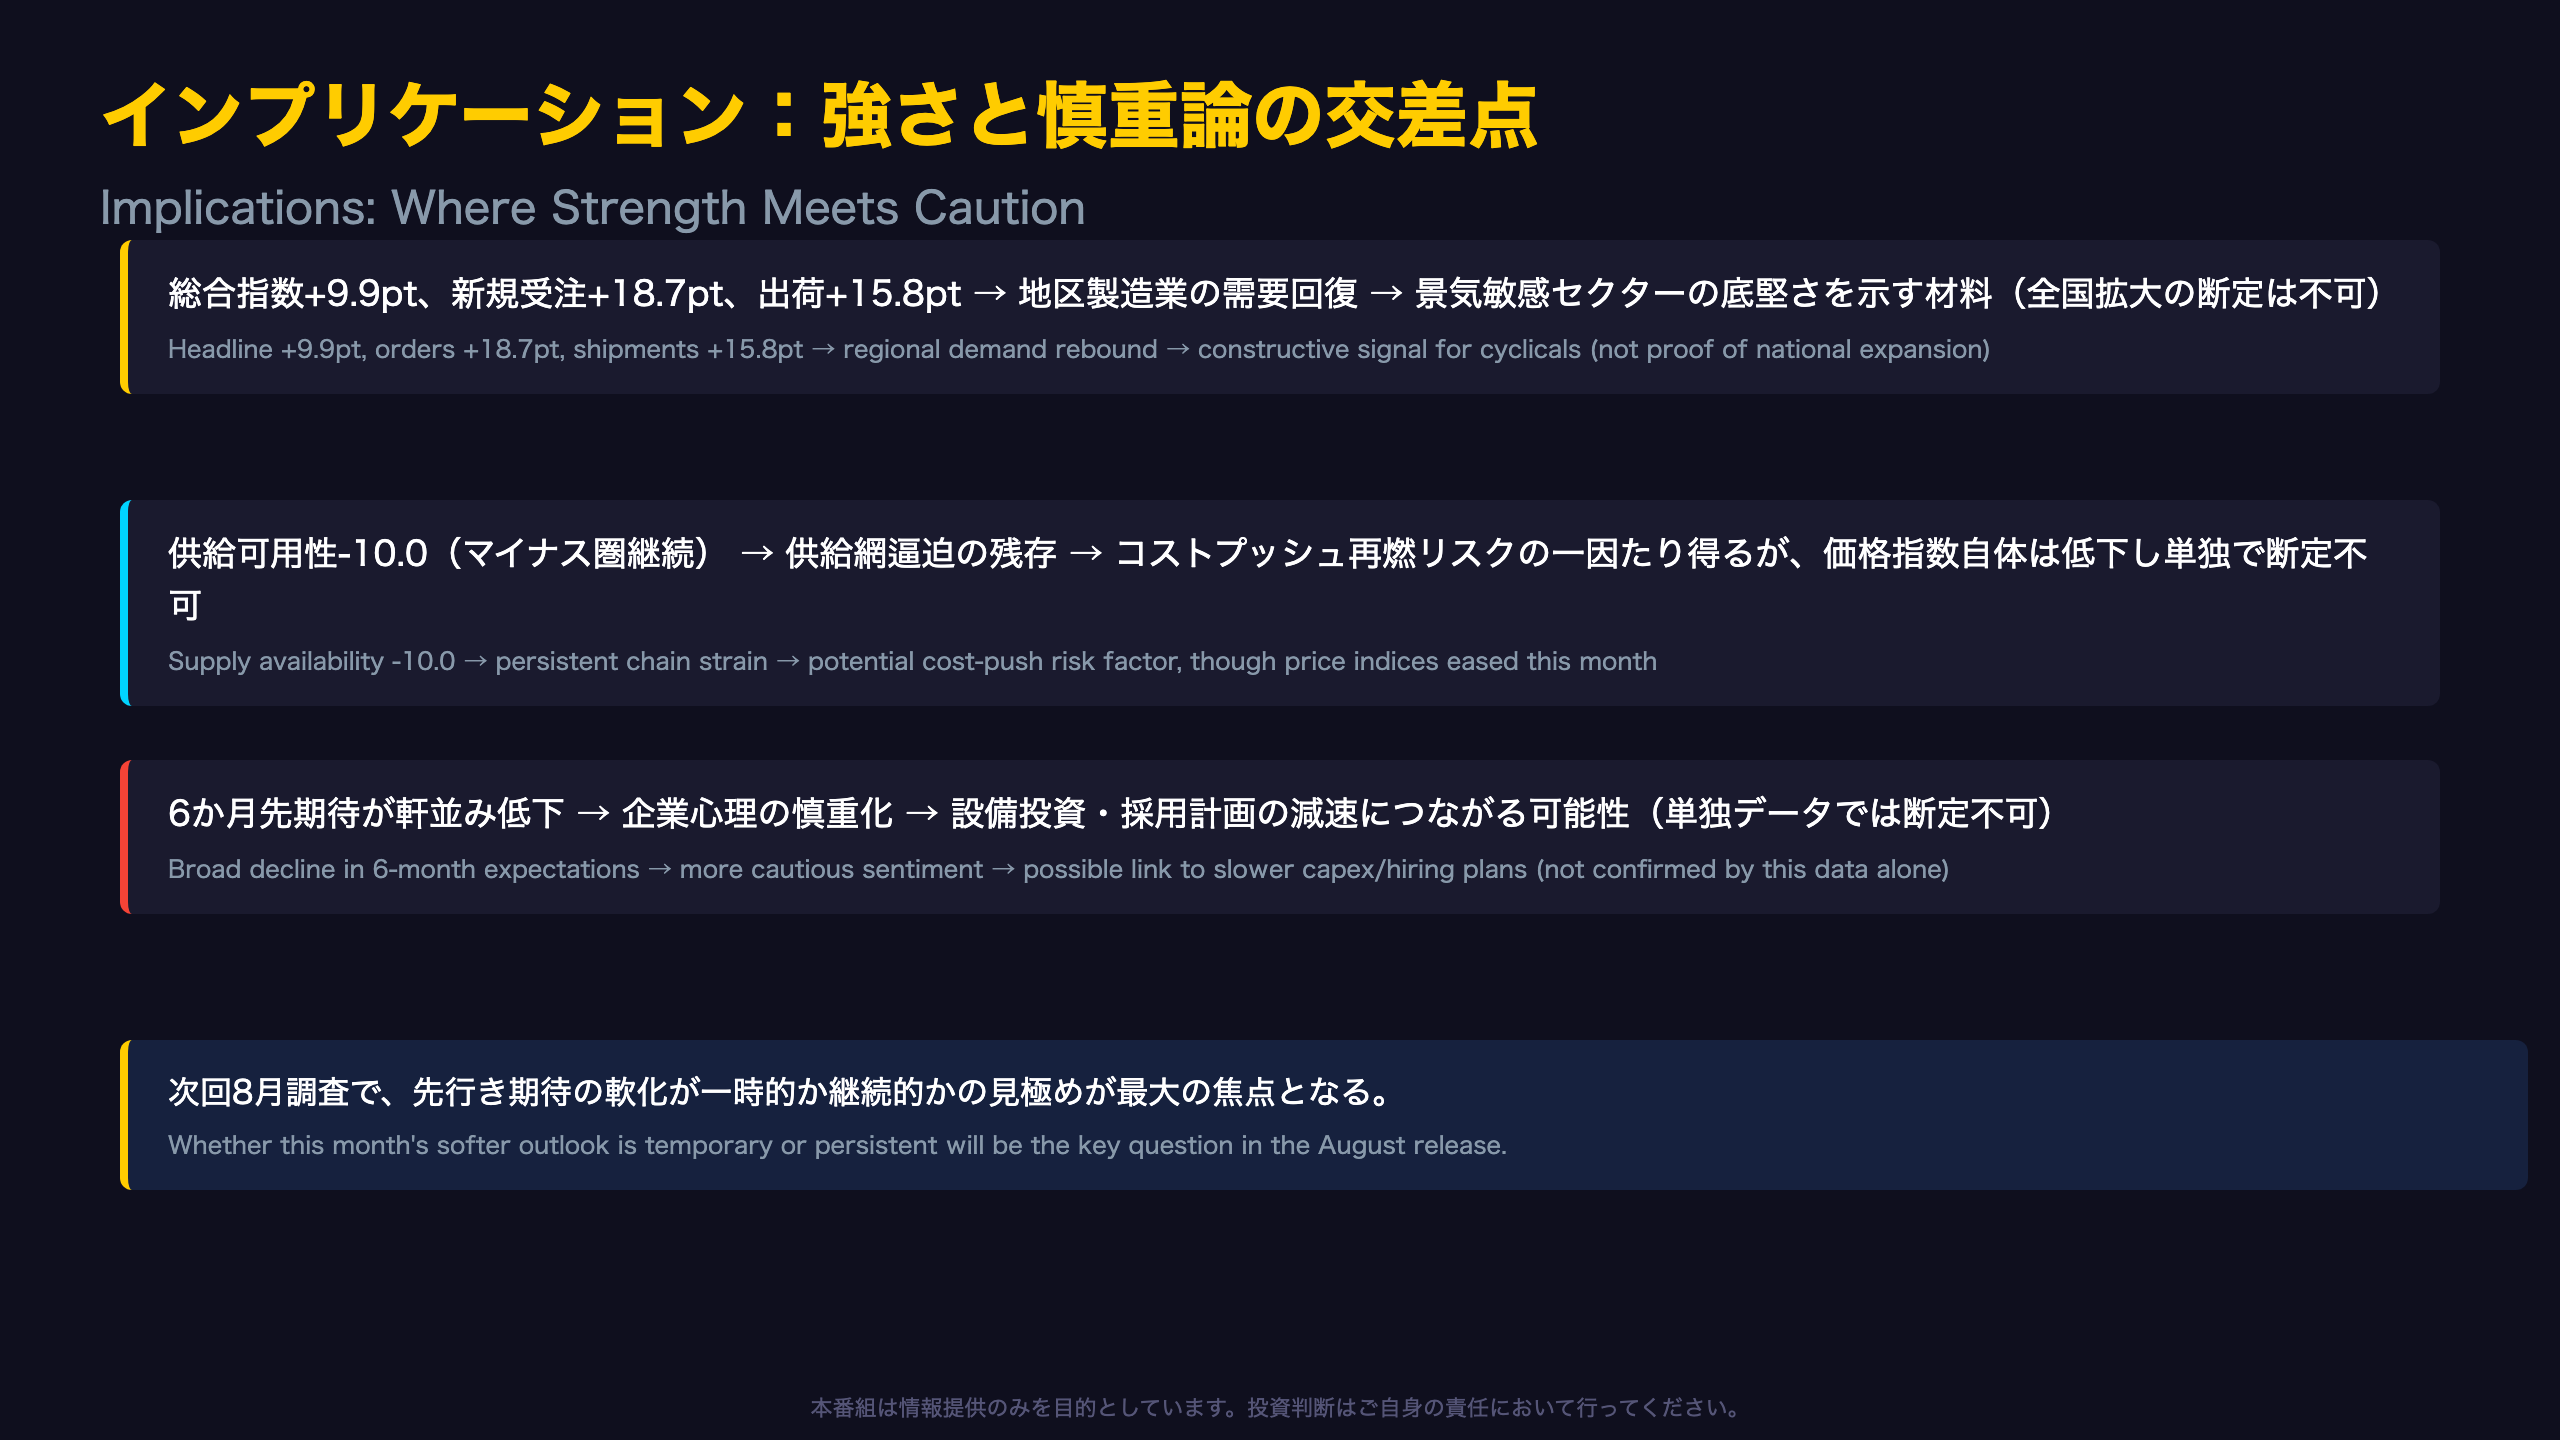
Reading the Market Implications Through the Chain of Evidence
The headline index’s rise to 15.6 (+9.9pt), alongside improvements in new orders, shipments, and employment, points to solid regional manufacturing activity. Generally, an improvement in a regional Fed survey’s current-conditions gauge is watched by market participants as an early proxy for the national ISM Manufacturing PMI, though this single report cannot confirm the durability of nationwide expansion.
Chain of Evidence
- Headline +9.9pt, new orders +18.7pt, shipments +15.8pt → reflects a genuine rebound in regional manufacturing demand → generally seen as a constructive signal for cyclical sectors, though this data alone cannot confirm a broader national expansion.
- Supply availability index remains negative at -10.0 → supply chain strain persists → generally, persistent supply constraints are associated with cost-push inflation risk, but since the price indices themselves declined this month, this data alone cannot confirm a reacceleration of inflation.
- Six-month-ahead expectations for conditions, employment, orders, and delivery times all declined → firms’ forward sentiment turned more cautious → generally, softer business sentiment is associated with slower capex and hiring plans going forward, though this single report cannot confirm that outcome will materialize.
For context, the Empire State survey is one of the first regional Fed manufacturing gauges released each month, making it a closely watched early indicator ahead of the national ISM Manufacturing PMI. The next release (August data) will be key to determining whether this month’s softening in forward expectations is a temporary reaction or the start of a more durable shift — a distinction that matters for how the Fed weighs near-term goods demand against lingering price pressures.
Disclaimer: This article is for informational purposes only. All investment decisions are made solely at your own risk.