📺 Watch the Full Video Analysis
This article was automatically generated by the NFC Market Live AI analysis system. (Updated: 2026-07-15 21:42 JST)
📄 Primary Source
U.S. Bureau of Labor Statistics
https://www.bls.gov/news.release/pdf/ppi.pdf
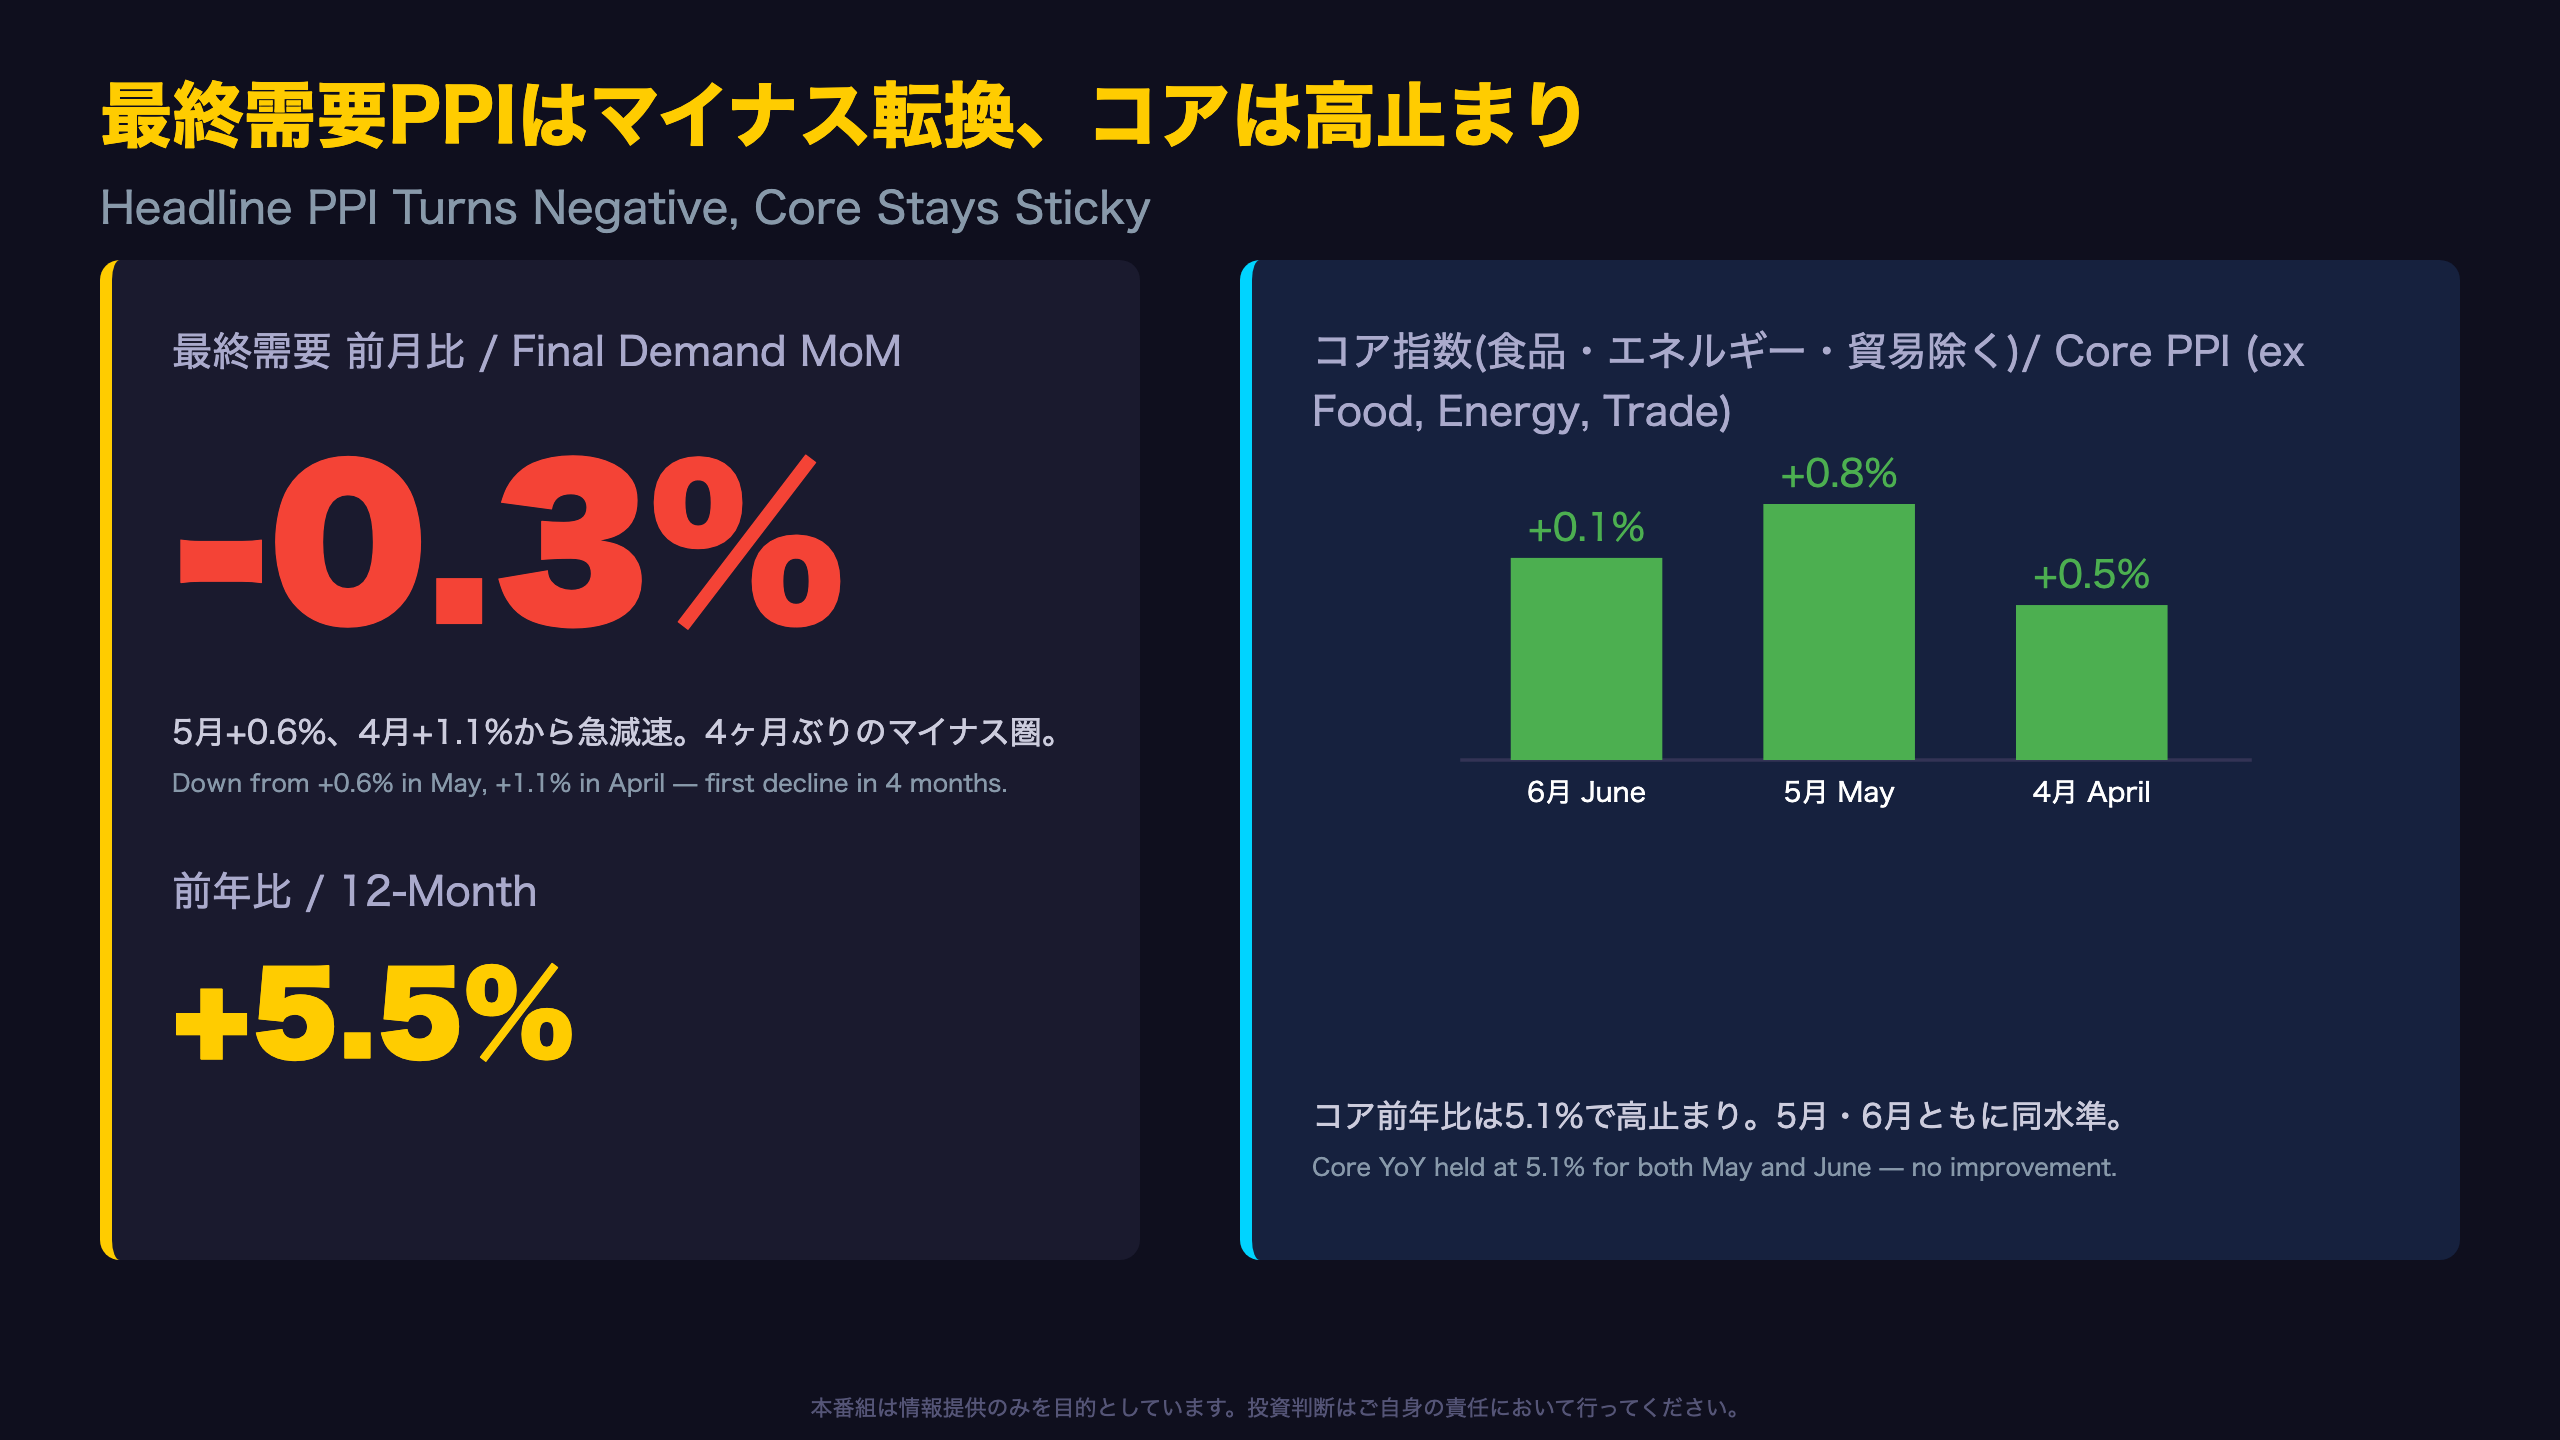
📊 The BLS’s June PPI shows headline final demand prices falling -0.3% MoM — the first decline in 4 months.
📉 The drop was driven by a -1.4% plunge in goods, with gasoline down -12.0%.
📈 But core PPI (ex food/energy/trade) held positive at +0.1% MoM, with YoY stuck at an elevated +5.1%.
⚠️ Intermediate demand softened across all stages, yet non-energy components stayed resilient.
💡 We break down the hidden hawkish signal inside this seemingly dovish report — and what it means for CPI and the Fed.
総合PPIはマイナス転換、コアは高止まり
Context: BLS and the PPI’s Role
The Producer Price Index, published monthly by the U.S. Bureau of Labor Statistics (BLS), measures price changes from the seller’s perspective—distinct from the Consumer Price Index (CPI), which reflects the buyer’s perspective and includes imports and owners’ equivalent rent. For U.S. rates markets, PPI often serves as an early read on the Fed’s preferred inflation gauge, core PCE, since many PPI service categories feed directly into PCE calculations.
A Rare Reversal, But With a Twist
Per the release: “The index for final demand goods moved down 1.4 percent in June, the largest decrease since falling 1.9 percent in July 2022.” That comparison matters: in 2022, goods deflation reflected a genuine unwind of pandemic-era supply shocks. This time, the decline is concentrated almost entirely in energy (-6.4%), making the comparison more superficial than structural.
Margin Expansion Tells Its Own Story
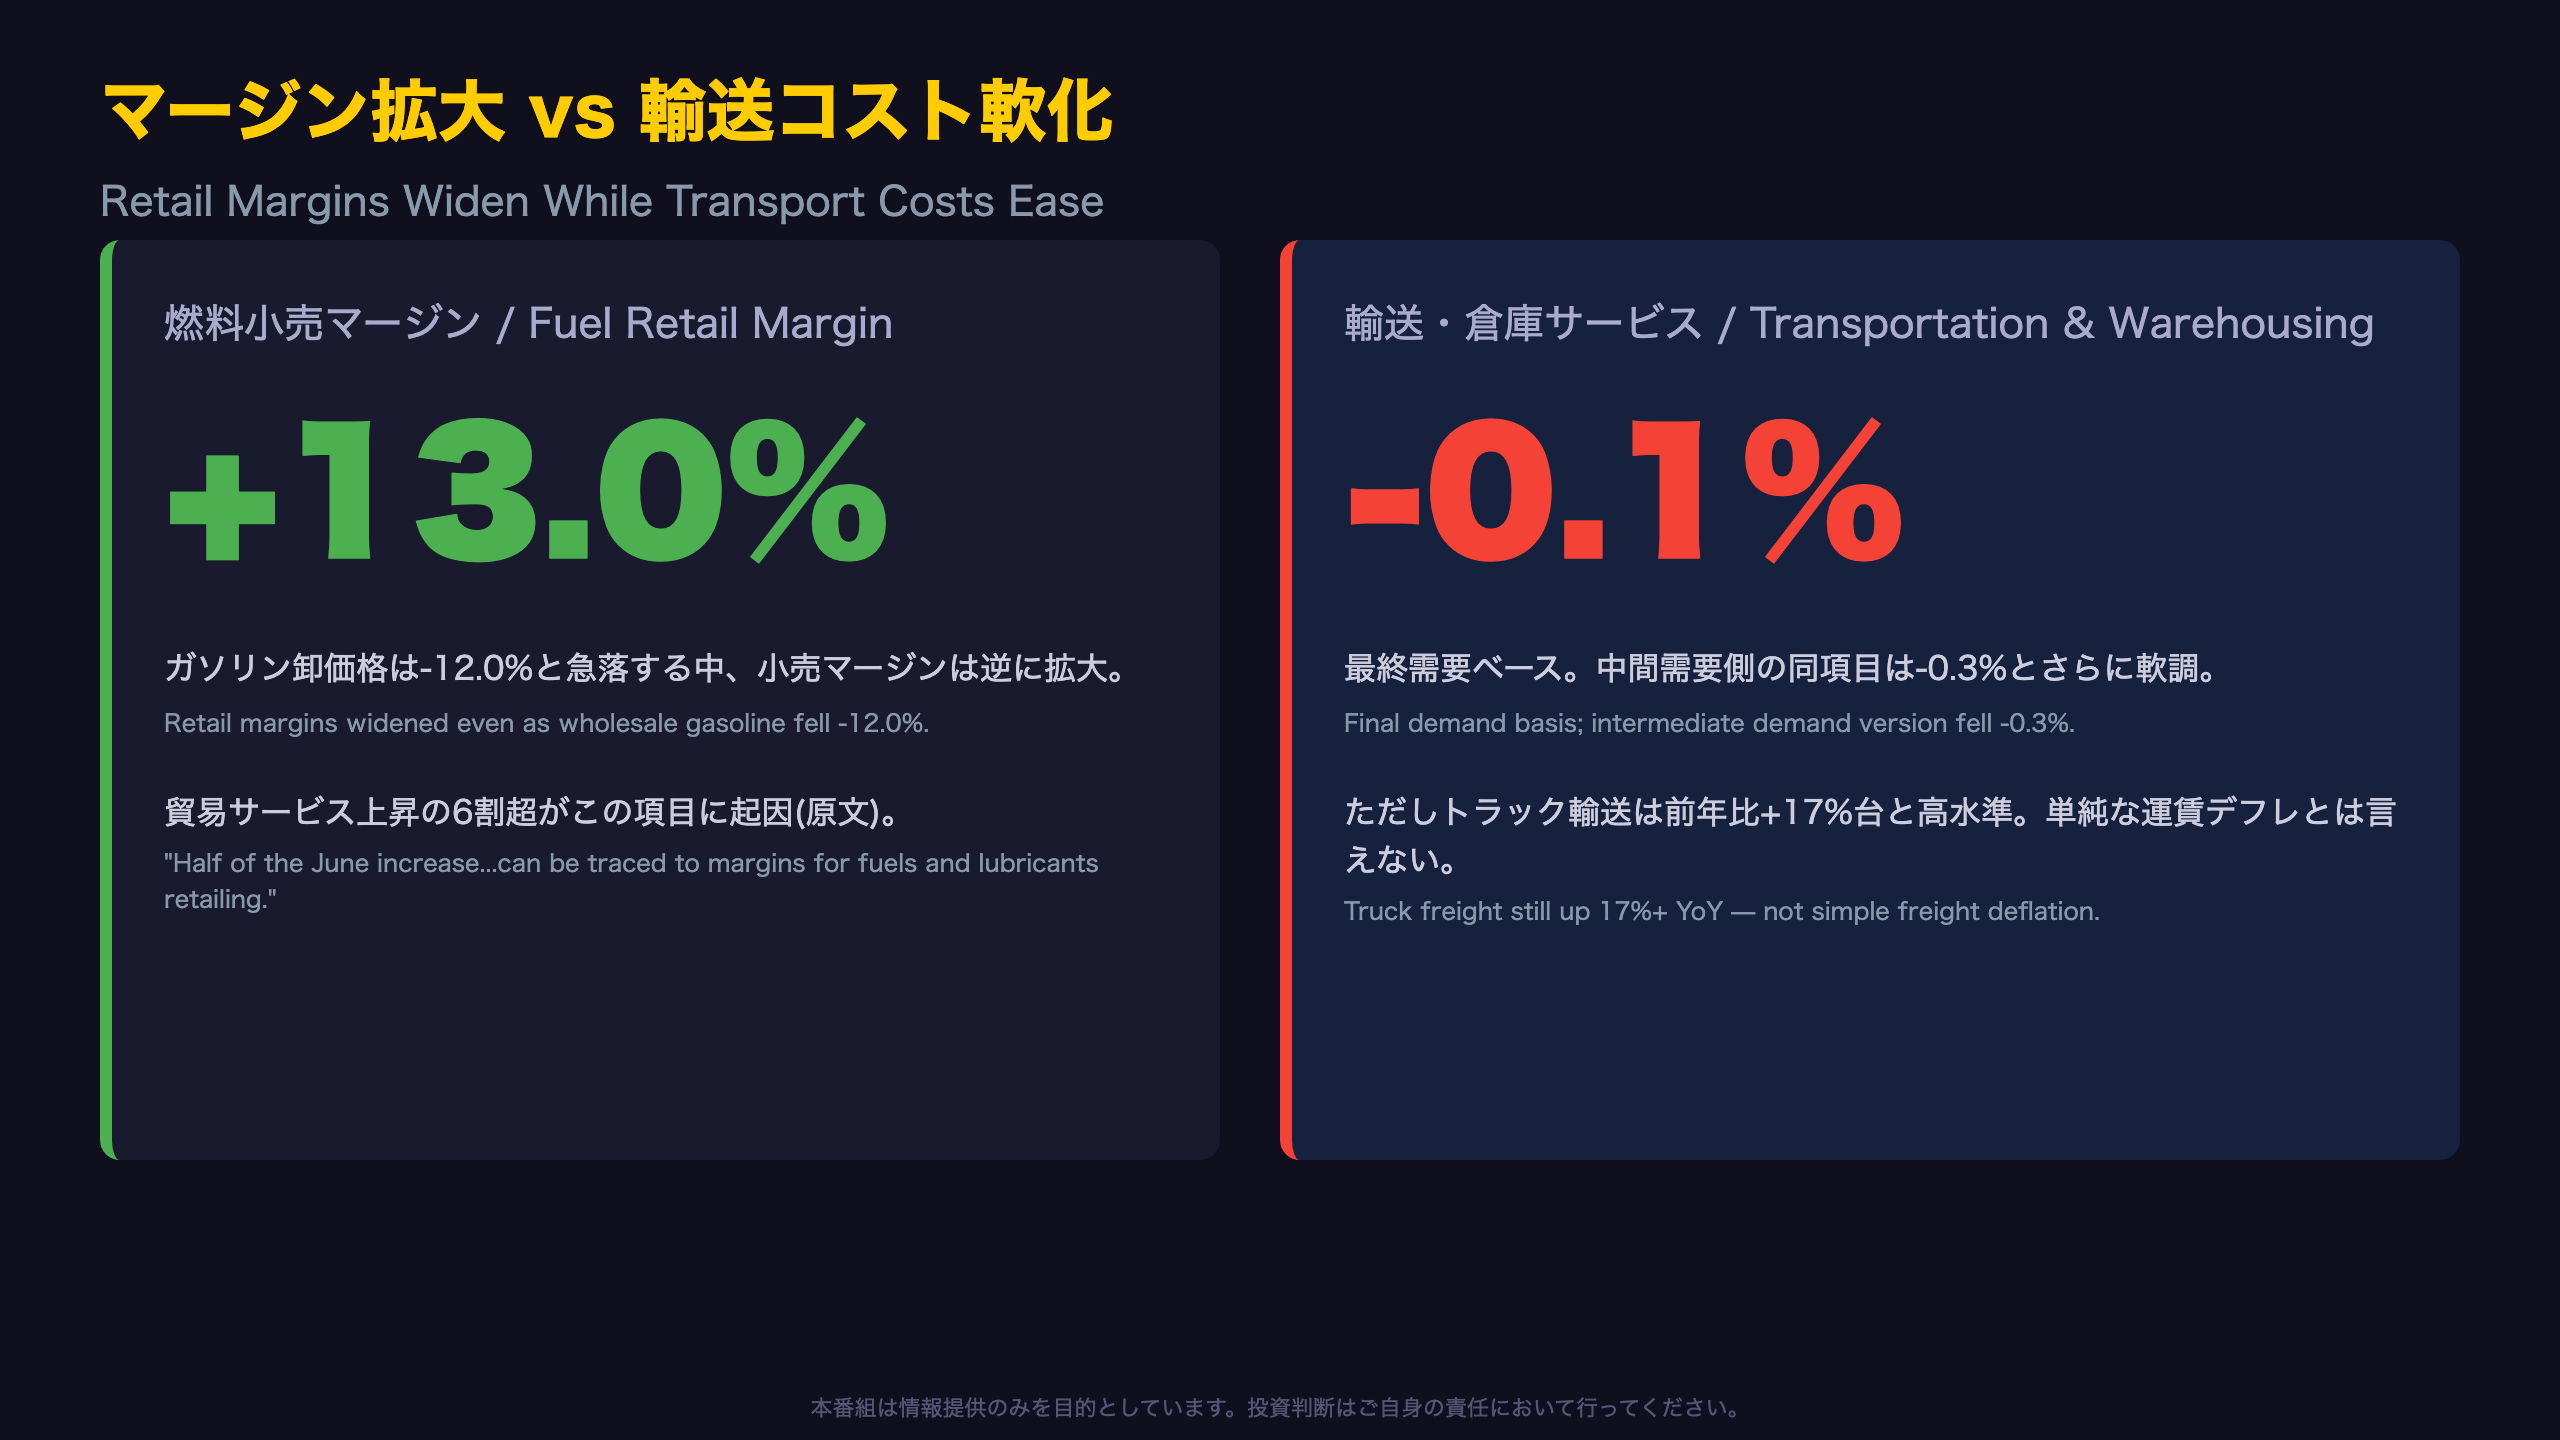
One underappreciated detail: fuel retailing margins jumped 13.0% even as wholesale gasoline costs collapsed 12.0%. This margin expansion—common when input costs fall faster than retail prices adjust—suggests consumers may not see the full gasoline price drop reflected at the pump.
Bull vs. Bear Case
Bears (disinflation case) point to the outright goods decline and core’s deceleration to 0.1% from May’s 0.8%. Bulls (sticky-inflation case) counter that core PPI’s 12-month rate remains stuck at 5.1%, near its highest since October 2022, and that structural cost categories—steel mill products (+3.6%), asphalt (+22.5%)—continue climbing.
What’s Next
The July PPI report is scheduled for August 13, 2026. The key question: does energy-led softness persist, or does core reaccelerate toward May’s pace? A core reading above 0.3% would revive sticky-inflation concerns for the Fed.
財とサービスの綱引き:マイナス0.3%の内訳
Understanding “Trade Indexes” in the PPI Framework
A distinctive feature of the U.S. PPI—one that often confuses readers unfamiliar with BLS methodology—is the “trade services” category. Unlike a typical price index, PPI trade indexes measure the margin earned by wholesalers and retailers, not the price of goods sold. This June, that margin metric rose 0.4%, and more than 60% of the advance in final demand services traced to this single line item.
Retail Margins as a Hidden Signal
Fuel retailing margins jumped 13.0% in June even as wholesale gasoline prices fell 12.0%. This divergence—input costs falling faster than retail margins compress—means the benefit of cheaper wholesale gasoline may not fully reach consumers immediately, a detail that matters for anyone modeling the next CPI gasoline print.
Estimated Contribution Breakdown
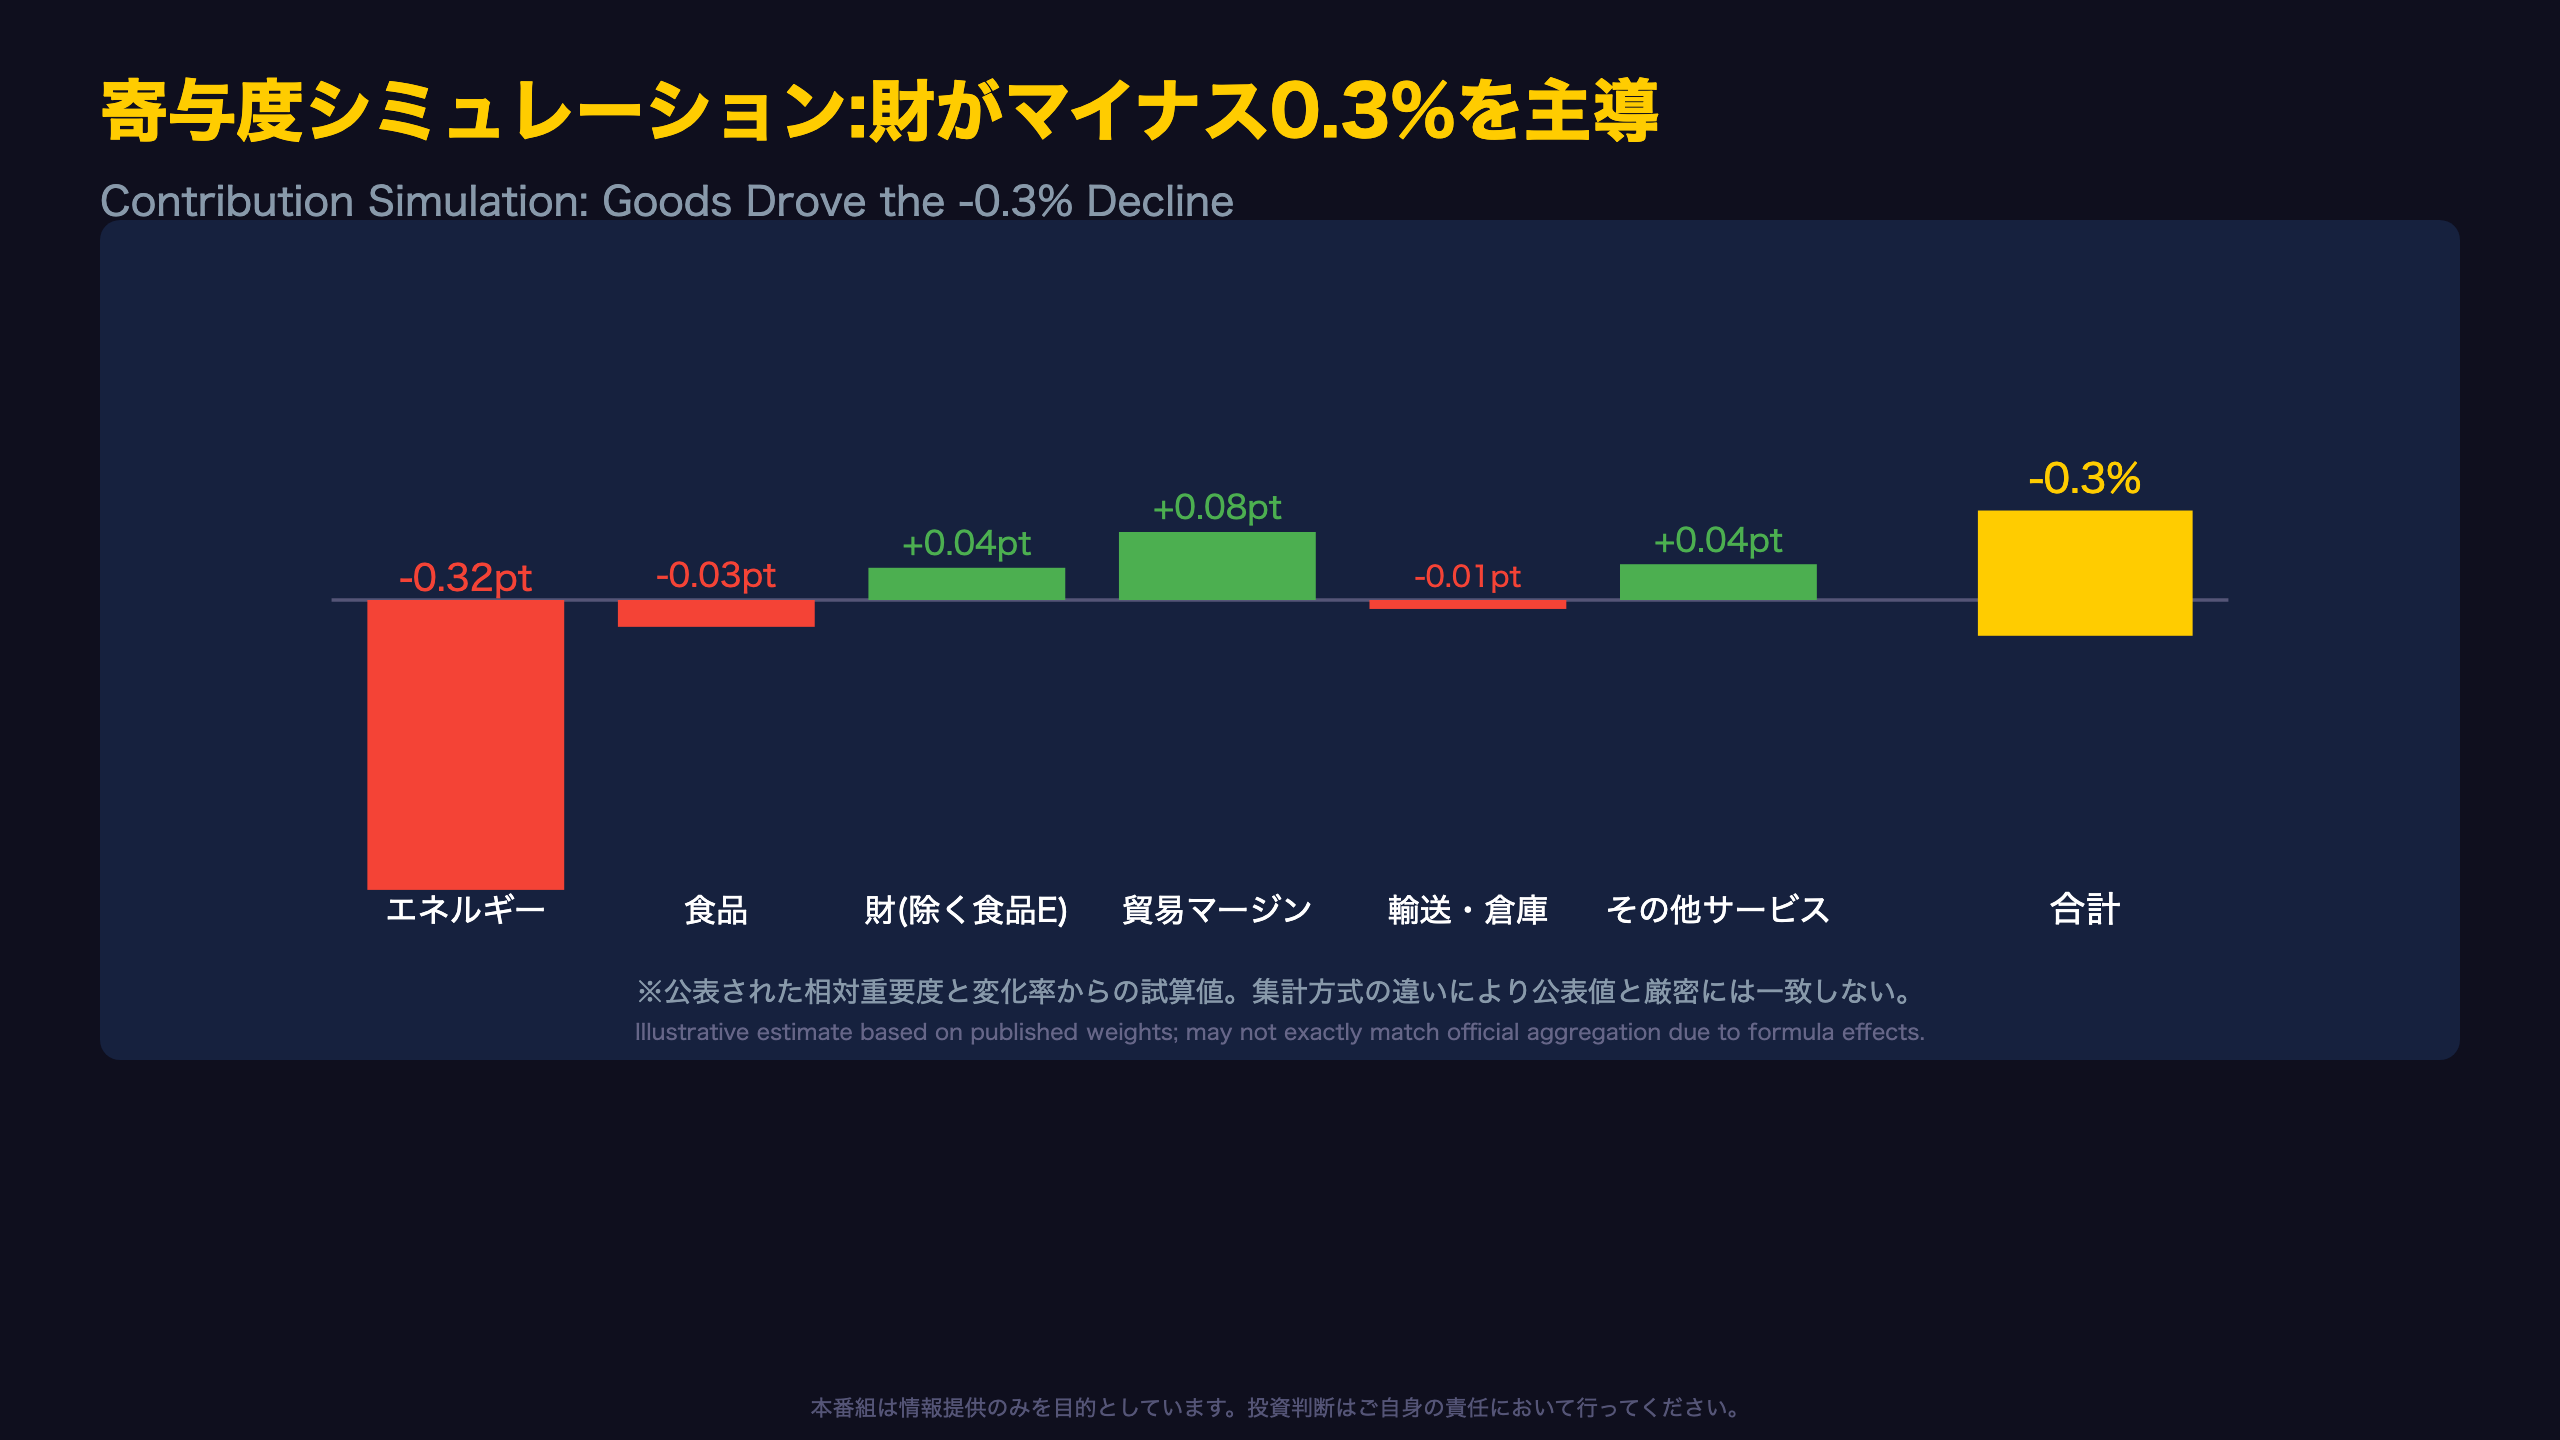
Using BLS-published relative importance weights alongside component price changes, energy alone subtracted an estimated 0.32 percentage points from the headline index, while goods excluding food and energy added about 0.04 points. This simulation—not an official BLS figure—illustrates how concentrated the June decline was in a single volatile category.
Bull/Bear Split
The bear case: outright goods deflation (-1.4%) signals softening demand. That case is weakened, however, by the fact that goods excluding food and energy still rose 0.2%—hardly disinflationary. The bull case: sticky services and margin expansion suggest underlying demand remains intact even as energy swings dominate headlines.
貿易マージン急拡大 vs 輸送コスト軟化
Why PPI “Trade” Indexes Confuse First-Time Readers
Unlike most PPI categories that track the price of a good or service, the “trade services” index measures margins captured by wholesalers and retailers—the gap between what they pay and what they charge. The BLS explicitly notes: “Trade indexes measure changes in margins received by wholesalers and retailers.” This distinction matters enormously this month.
The Fuel Margin Anomaly
The release states: “Half of the June increase in the index for final demand services can be traced to margins for fuels and lubricants retailing, which jumped 13.0 percent.” That’s a striking divergence from wholesale gasoline, which fell 12.0% the same month. Retailers appear to have captured a wider spread rather than passing the full decline through to pump prices—a pattern consistent with well-documented “rockets and feathers” stickiness in retail fuel pricing (prices rise quickly on cost increases but fall more slowly on decreases).
Transportation Tells a Different Story
Final demand transportation and warehousing services fell 0.1%, and the intermediate demand equivalent dropped 0.3%—suggesting freight carriers passed lower fuel costs through faster than retailers did. Yet truck transportation of freight specifically still shows elevated 17%+ year-over-year gains, complicating any simple “freight deflation” narrative.
Consumer Takeaway
For anyone modeling the next CPI gasoline component, this margin stickiness matters: retail pump prices may not decline as much as wholesale/PPI data alone would suggest, since retailers appear to be widening margins rather than fully passing through lower input costs.
中間需要:全ステージで軟化も非エネルギーは底堅い
What the BLS Stage-of-Production Model Measures
The BLS constructs intermediate demand data using two parallel frameworks: commodity type and production flow (“stage of production”). The latter—Stages 1 through 4—traces how price pressure moves from raw-material producers (Stage 1) toward industries that sell directly to final demand (Stage 4). This structure has no direct equivalent in most other countries’ producer price statistics, making it a uniquely granular tool for U.S. inflation-pipeline analysis.
A Broad-Based but Energy-Driven Retreat
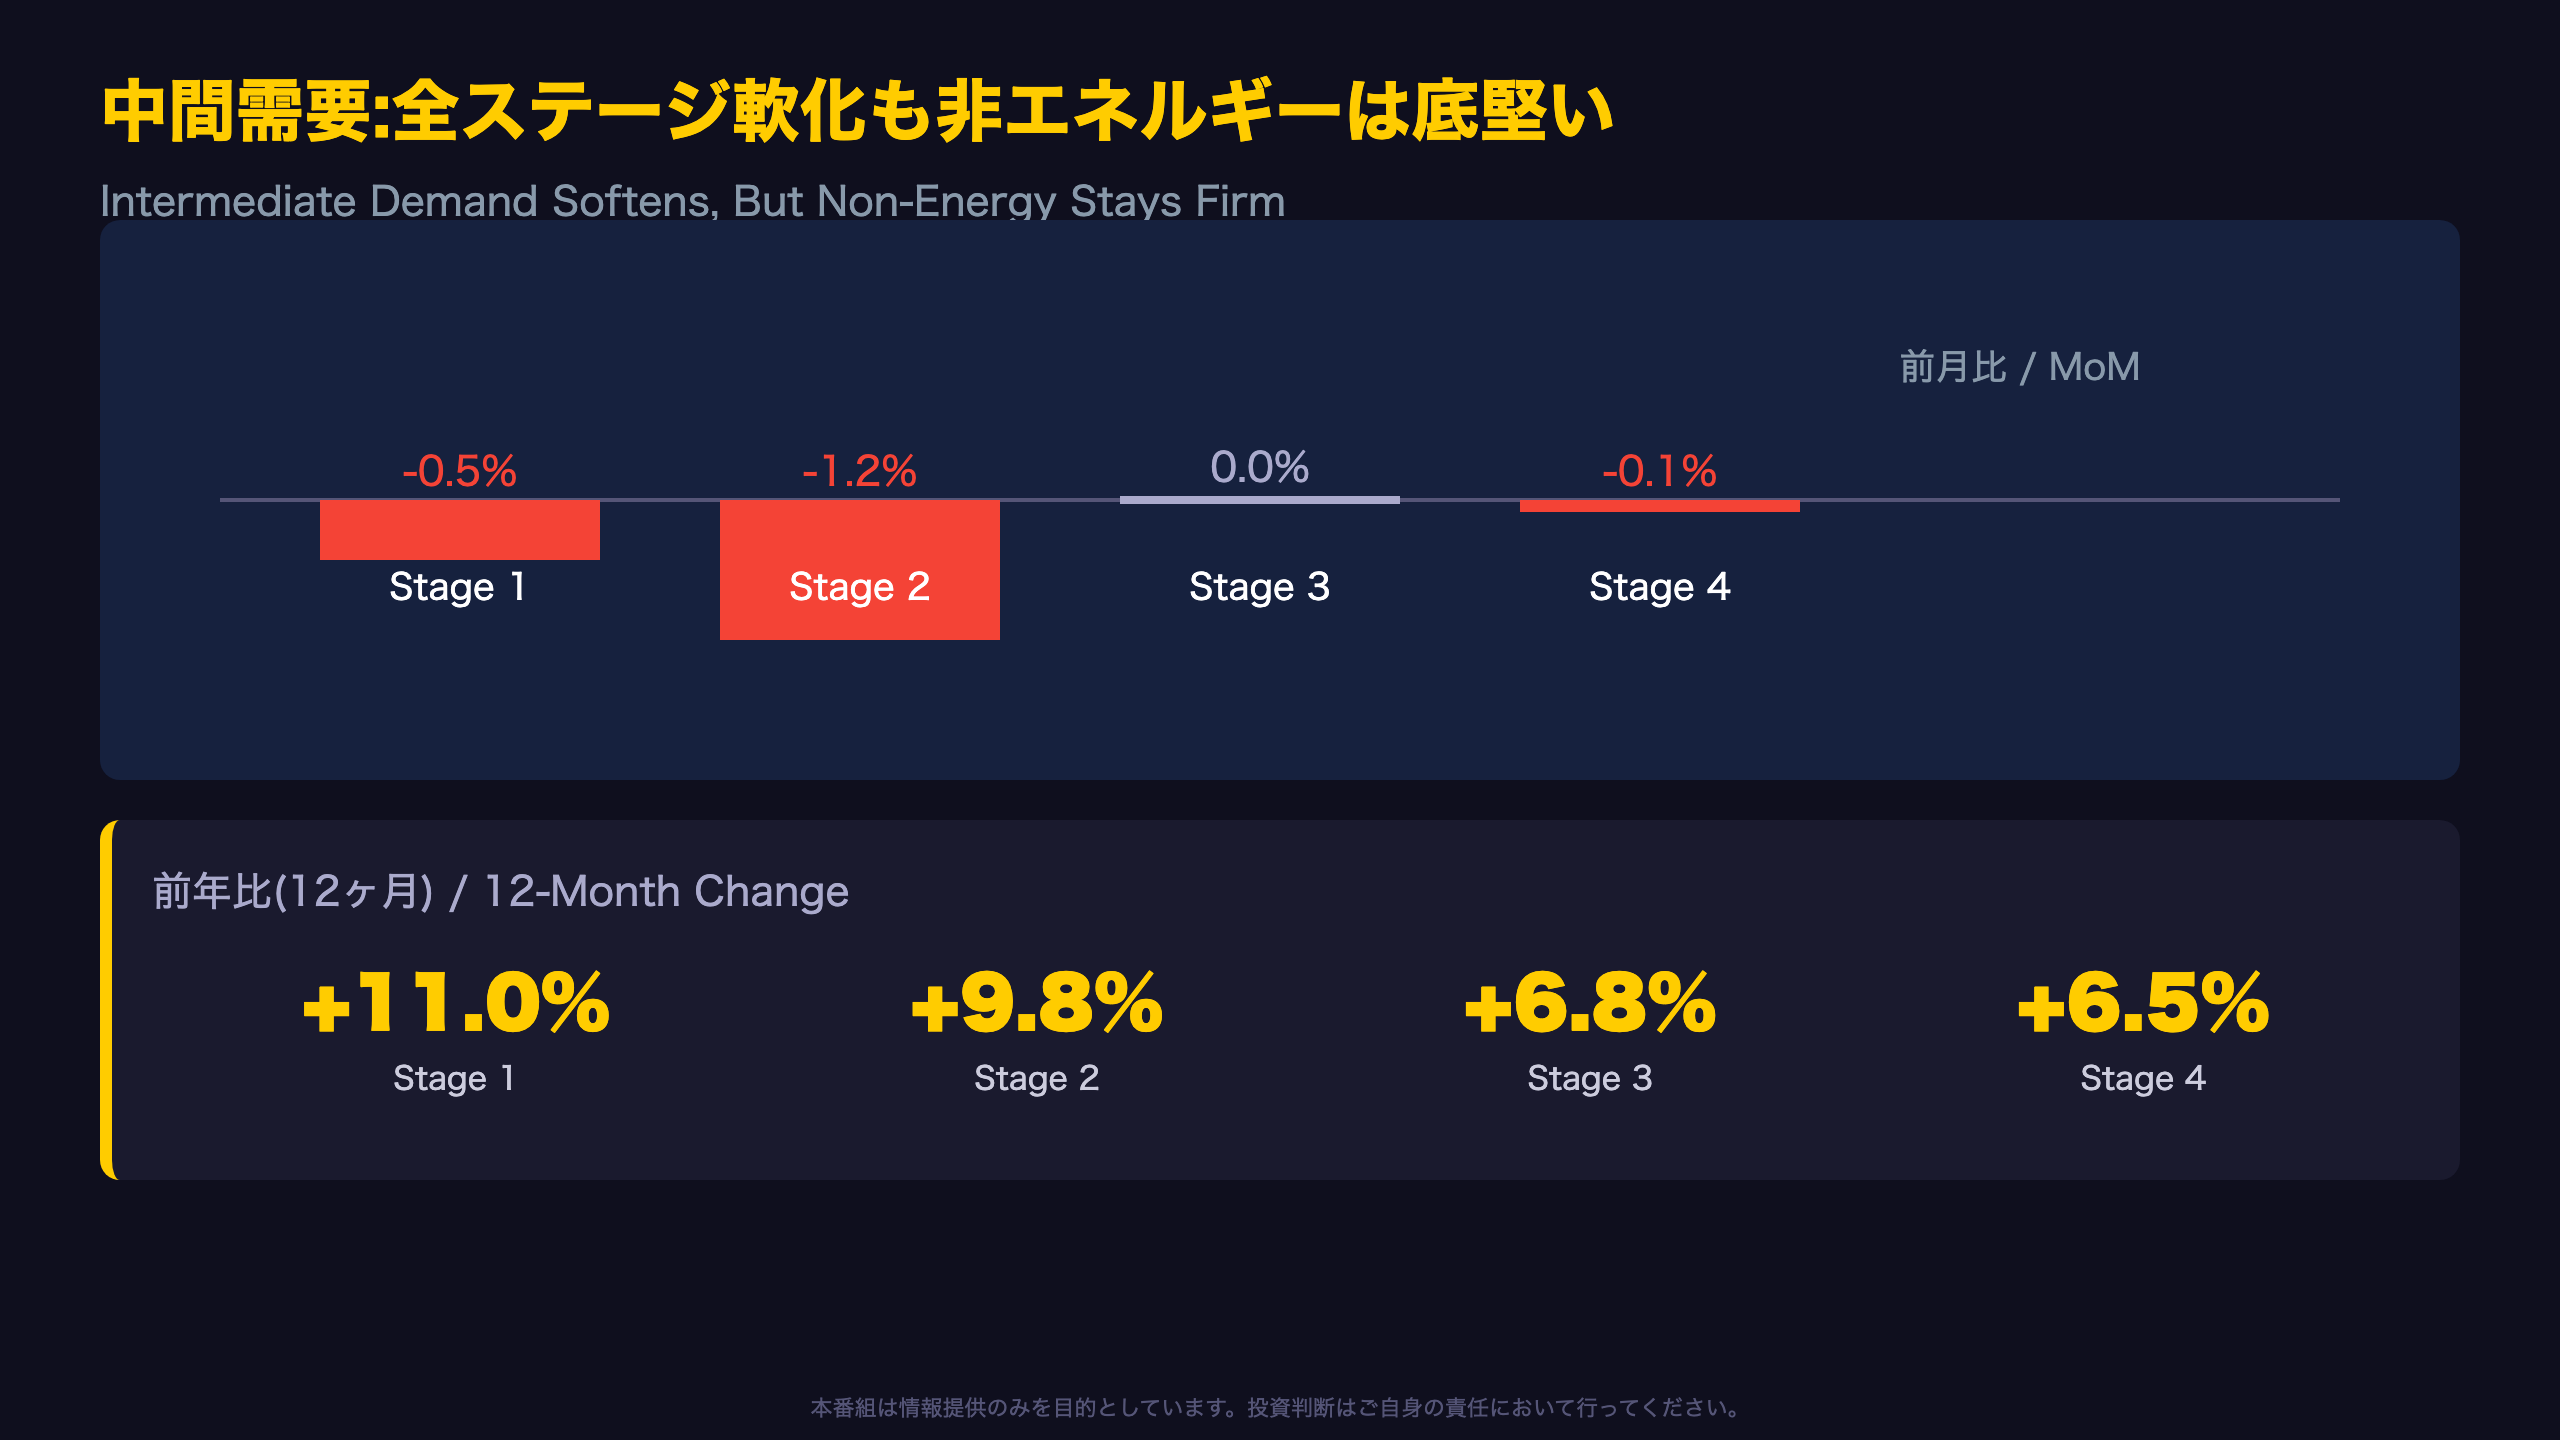
Per the release: “The index for stage 2 intermediate demand decreased 1.2 percent in June, the largest decline since moving down 1.2 percent in September 2024.” That’s nearly a two-year record. Yet across every stage, goods excluding food and energy inputs remained positive—Stage 3 up 0.7%, Stage 4 up 0.6%—indicating the retreat was concentrated in volatile commodities, not broad-based demand destruction.
Steel and Structural Cost Pressures Persist
Steel mill products rose 3.6% month-over-month and 16.9% year-over-year, a detail that gets lost in the aggregate stage indexes. This is consistent with tariff-related and supply-constrained cost pressures that could still work their way into finished goods prices over coming months.
Two Readings, One Data Point
Disinflation bulls will cite the across-the-board stage declines as evidence of cooling upstream pressure. Inflation hawks will note that year-over-year rates remain elevated (Stage 1 at 11.0%, Stage 2 at 9.8%), meaning the pipeline hasn’t fully normalized. Both readings are defensible from a single month of data.
Looking Ahead
Watch whether Stage 1 and 2 rebound in the July report (due August 13). A return to positive momentum in Stage 1 would signal renewed upstream cost pressure worth flagging for CPI watchers.
結論:ハト派の皮を被ったタカ派シグナル
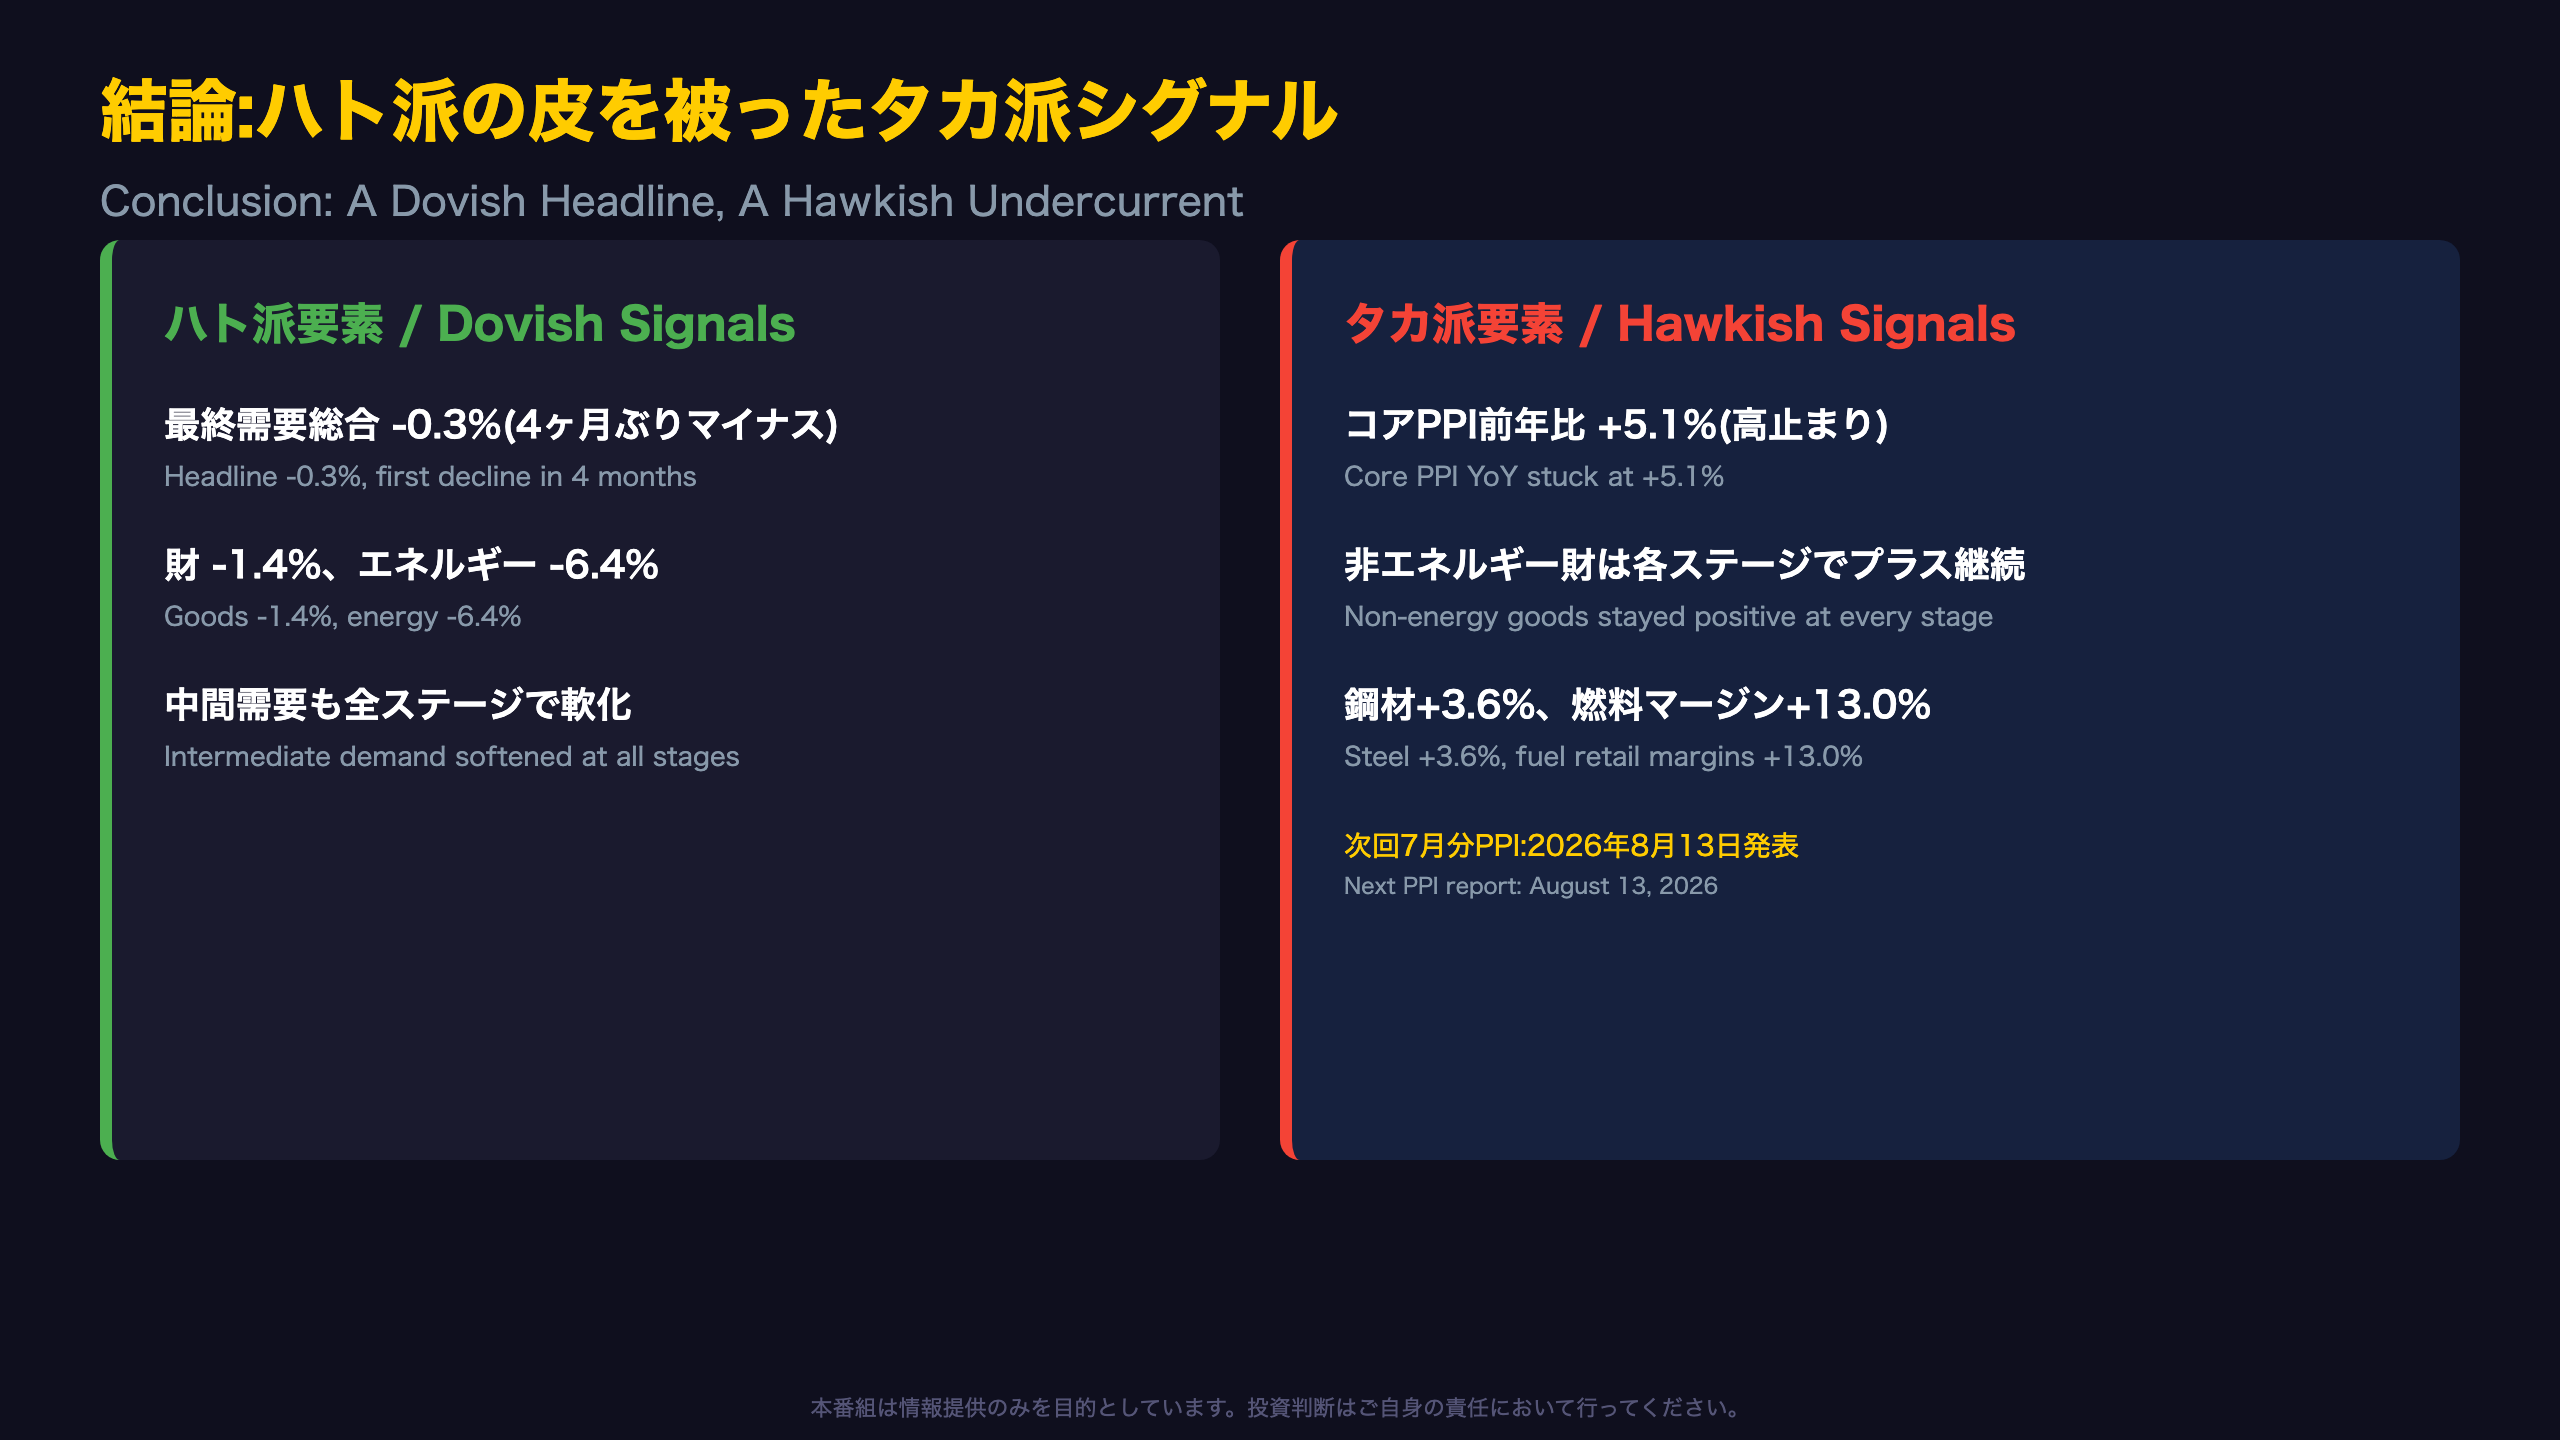
The Chain of Reasoning
Fact: final demand energy fell 6.4%, with gasoline down 12.0%. Mechanism: this represents a temporary pullback in volatile energy prices, not a broad-based demand slowdown. Market implication: if crude oil prices stabilize or rebound in coming months, this drag fades, and core PPI’s elevated 5.1% year-over-year rate would resurface as the dominant narrative. This chain, however, depends on the unpredictable path of oil prices and cannot be stated with certainty from this report alone.
What This Means for the Fed’s Reaction Function
It is commonly believed the Federal Reserve weighs core inflation measures—which strip out food and energy—more heavily than headline figures. Core PPI’s 12-month rate of 5.1% is closing in on the 5.5% peak seen in October 2022. Should this elevated pace persist through the July report and subsequent CPI data, markets may need to push back the expected pace of rate cuts. That said, a single month of PPI data cannot determine the Fed’s actual policy path.
Rates and Dollar Implications
Fact: core PPI stays elevated at 5.1% year-over-year. Mechanism: persistently high core producer prices generally sustain inflation expectations. Market implication: Treasury yields and the dollar could find support if markets price in a slower cutting cycle—though this reasoning relies on general macro theory rather than being confirmed by this single data release.
Looking Ahead
The July PPI report is due August 13, 2026. Watch whether core PPI reaccelerates above 0.3% month-over-month—a signal that would strengthen the sticky-inflation camp’s case ahead of the Fed’s next policy meeting.
Disclaimer: This article is for informational purposes only. All investment decisions are made solely at your own risk.