📺 Watch the Full Video Analysis
This article was automatically generated by the NFC Market Live AI analysis system. (Updated: 2026-08-14 23:11 JST)
📄 Primary Source
University of Michigan
http://www.sca.isr.umich.edu/
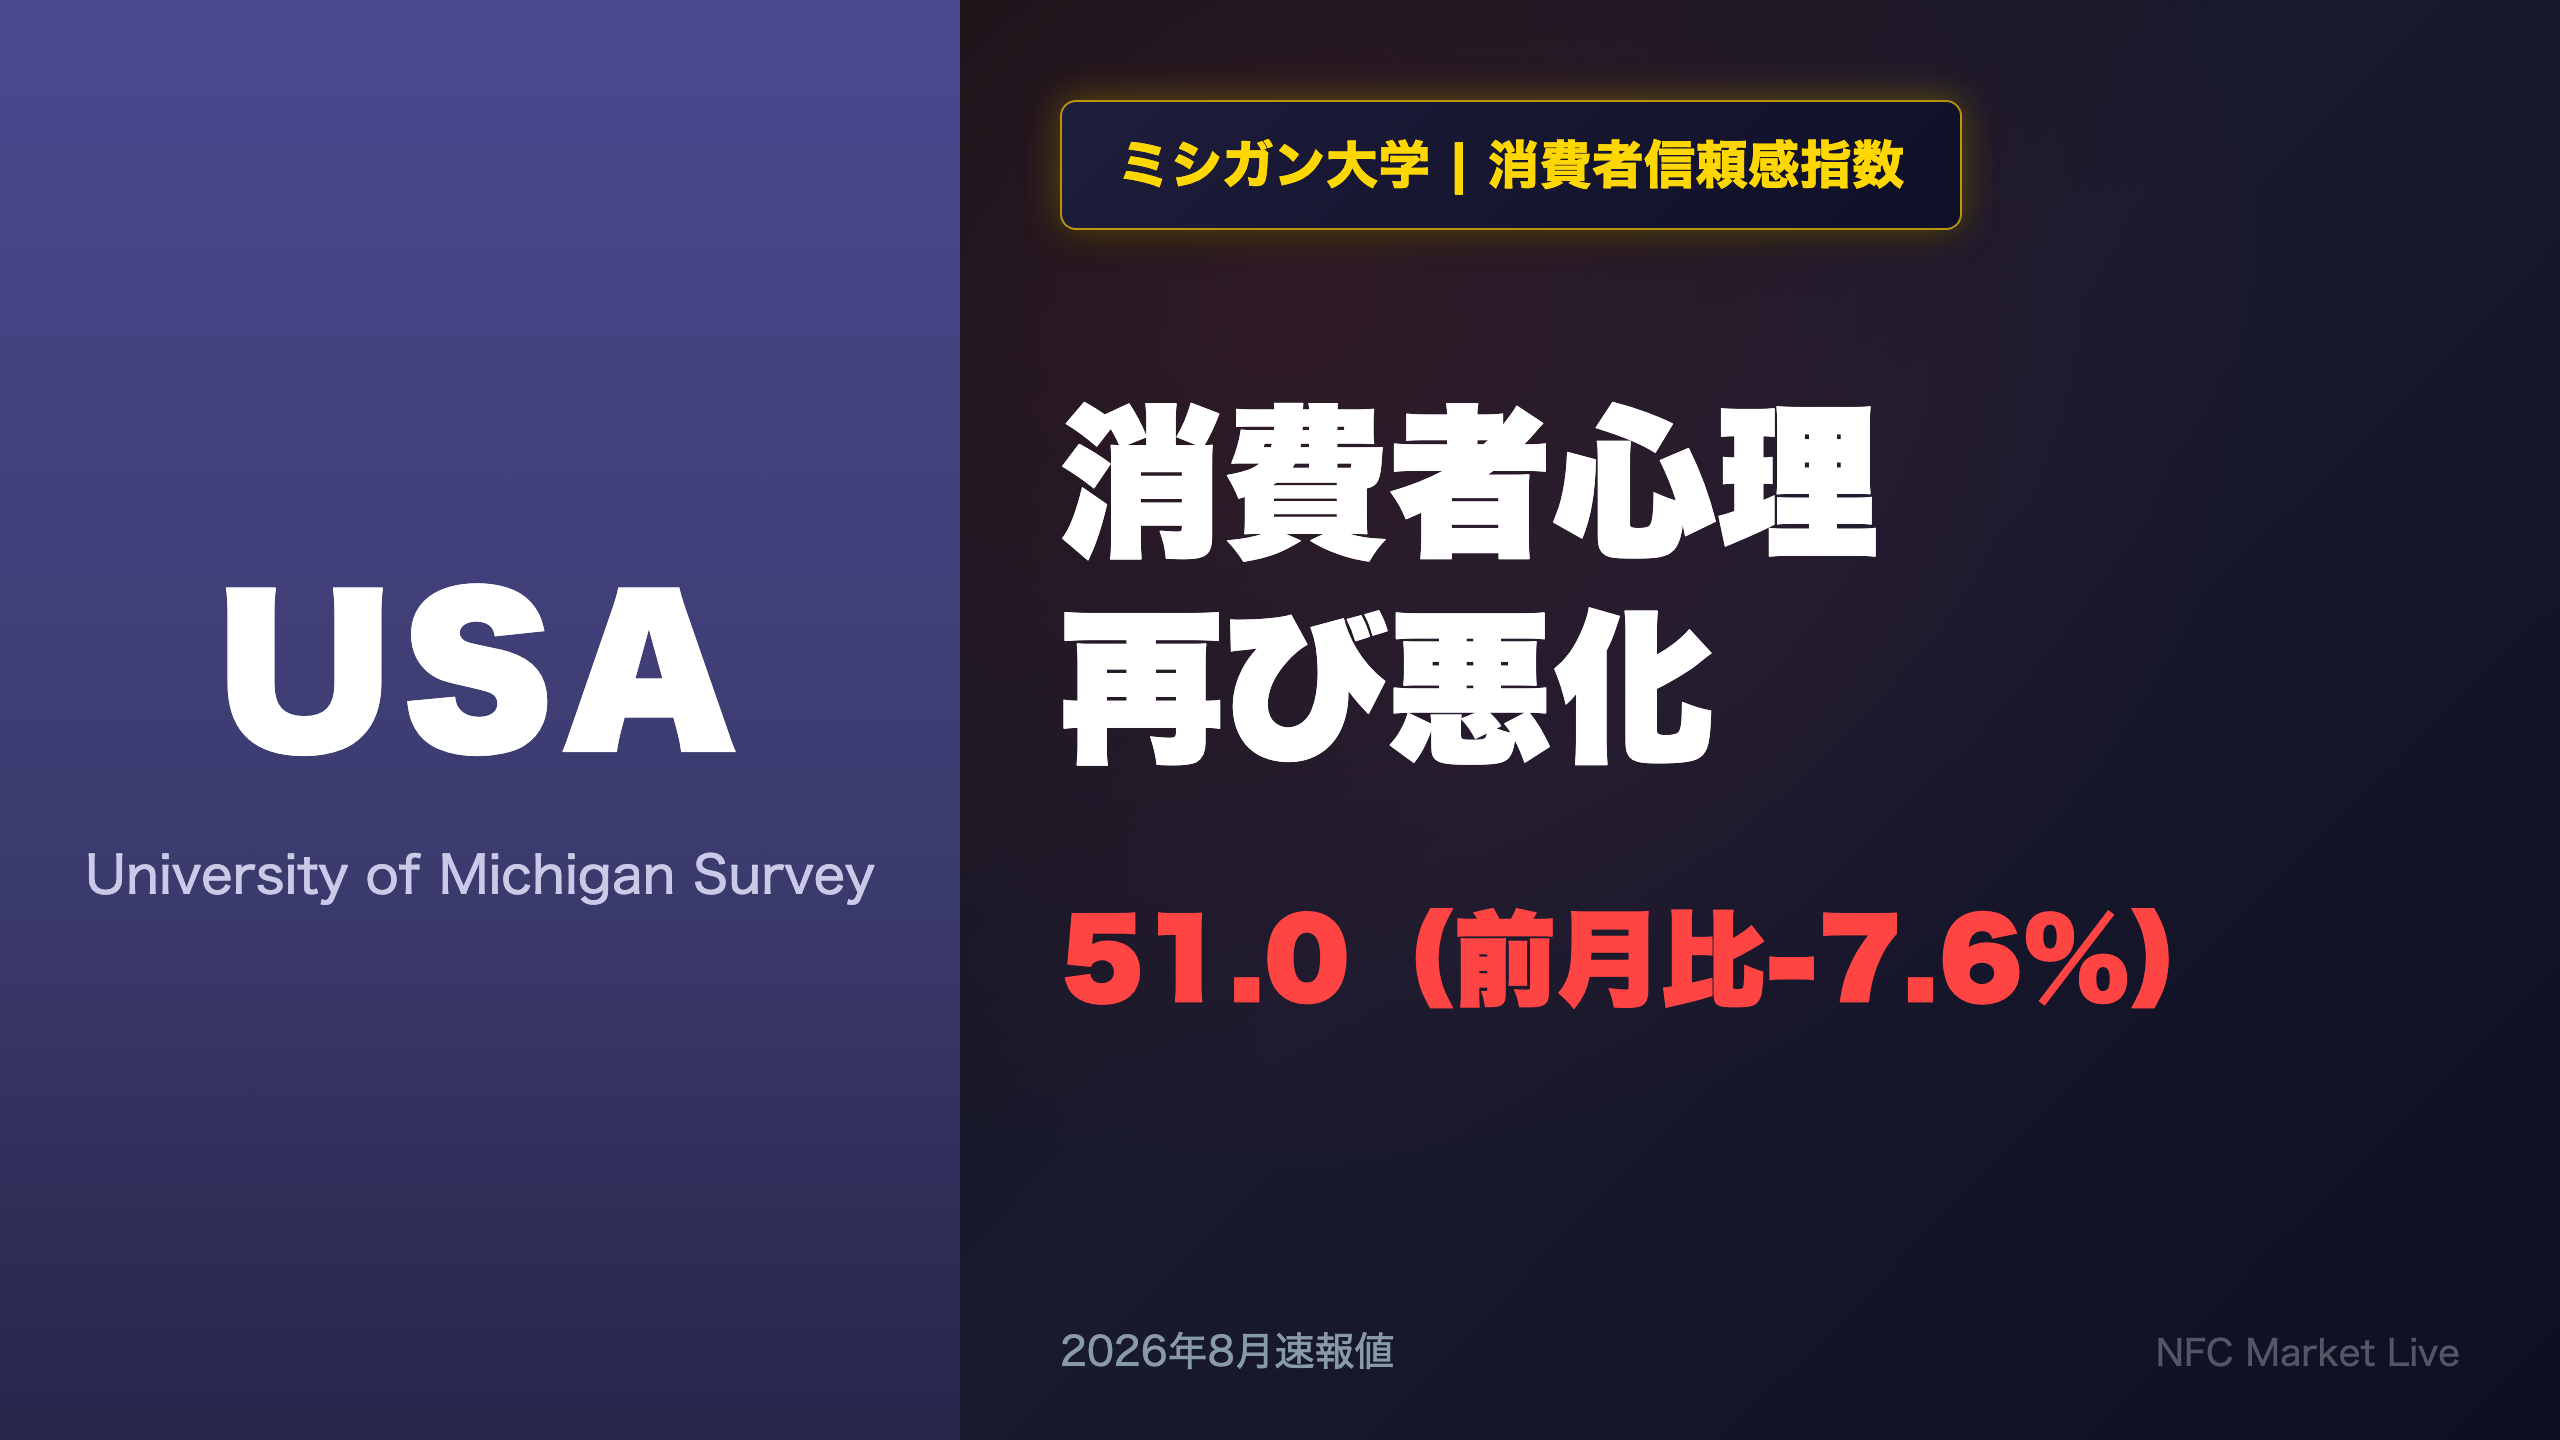
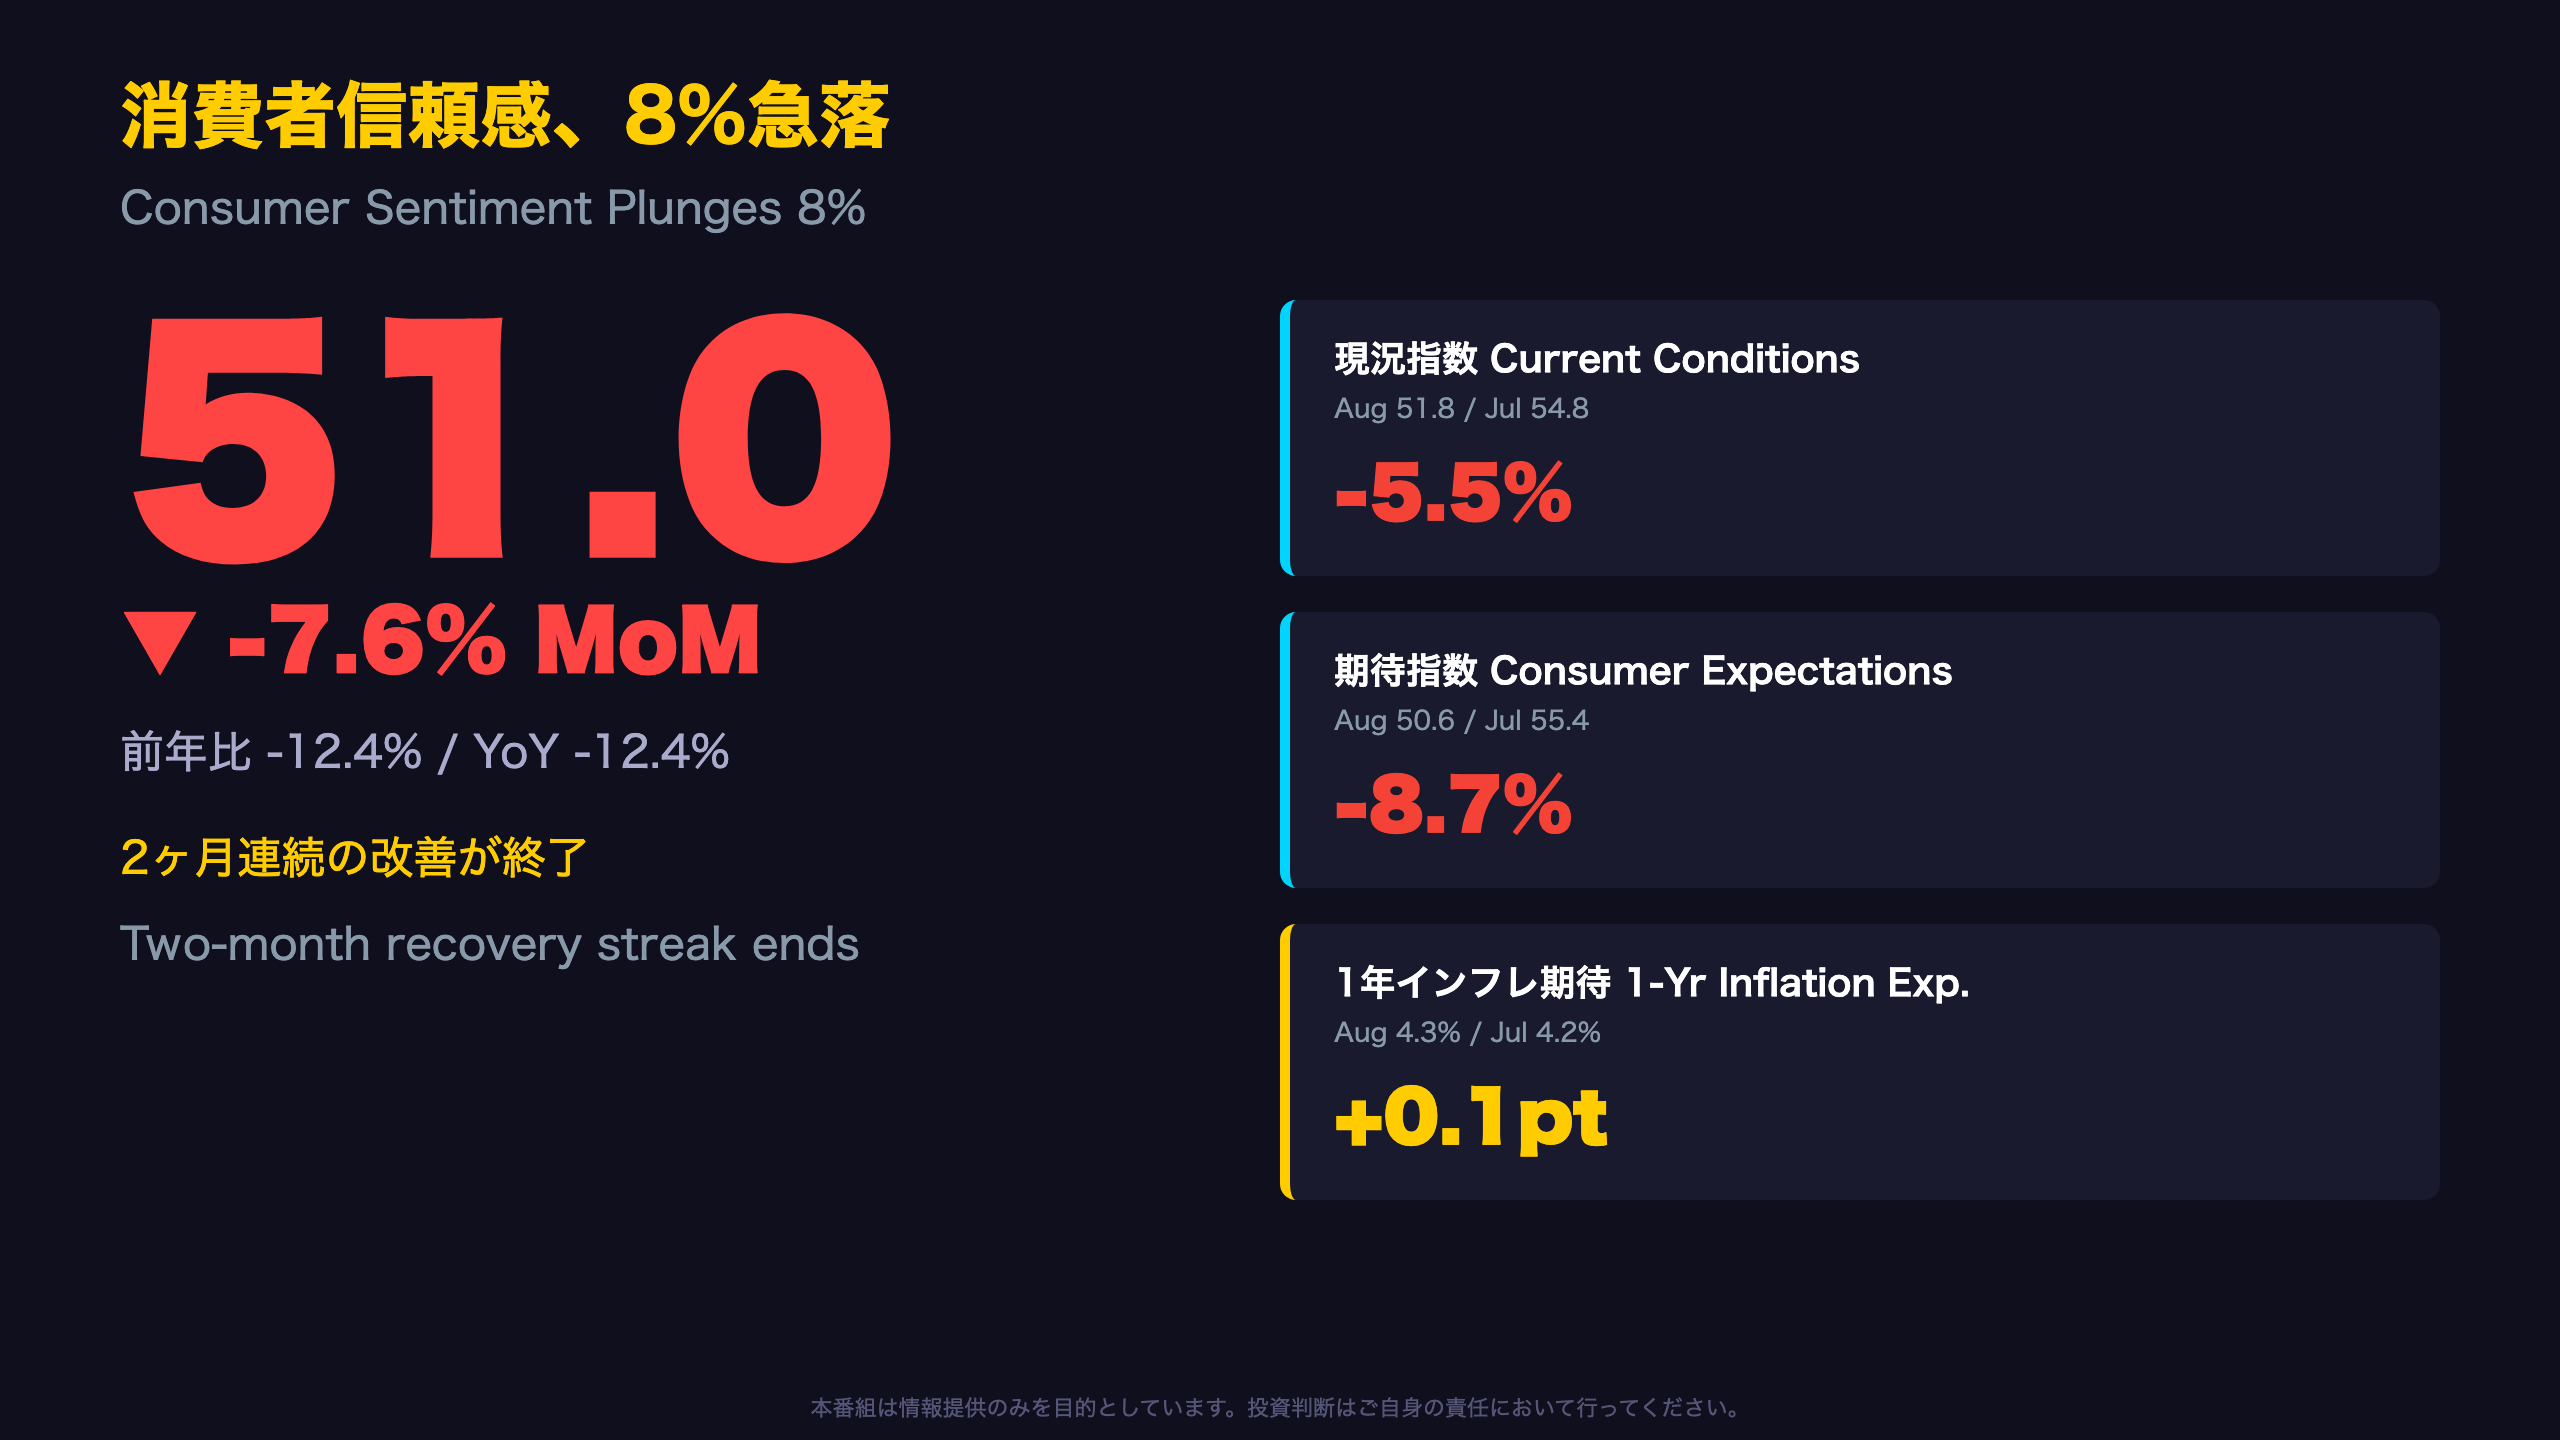
📊 University of Michigan’s preliminary August 2026 Consumer Sentiment Index came in at 51.0.
That’s down 7.6% from July’s 55.2, ending a two-month improvement streak.
📉 Current conditions fell 5.5%, but expectations dropped a sharper 8.7% — a sign of deepening unease about the future.
⚠️ 1-year inflation expectations rose to 4.3%. Only 8% of consumers expect income to outpace inflation, down from 18% in Dec 2024.
💡 We break down what this mix of weakening sentiment and sticky inflation expectations means for the Fed’s next move.
消費者信頼感、8%急落 ― 改善トレンドはわずか2ヶ月で終了
Why This Reversal Matters
Joanne Hsu, Director of the Surveys of Consumers, noted that “consumer sentiment fell about 8% this August, ending two consecutive months of improvement.” This context matters for U.S. investors unfamiliar with the University of Michigan’s methodology: unlike the Conference Board’s Consumer Confidence Index, the Michigan survey places heavy weight on inflation expectations and is closely watched by the Federal Reserve for its forward-looking components.
A Volatile 24-Month Path
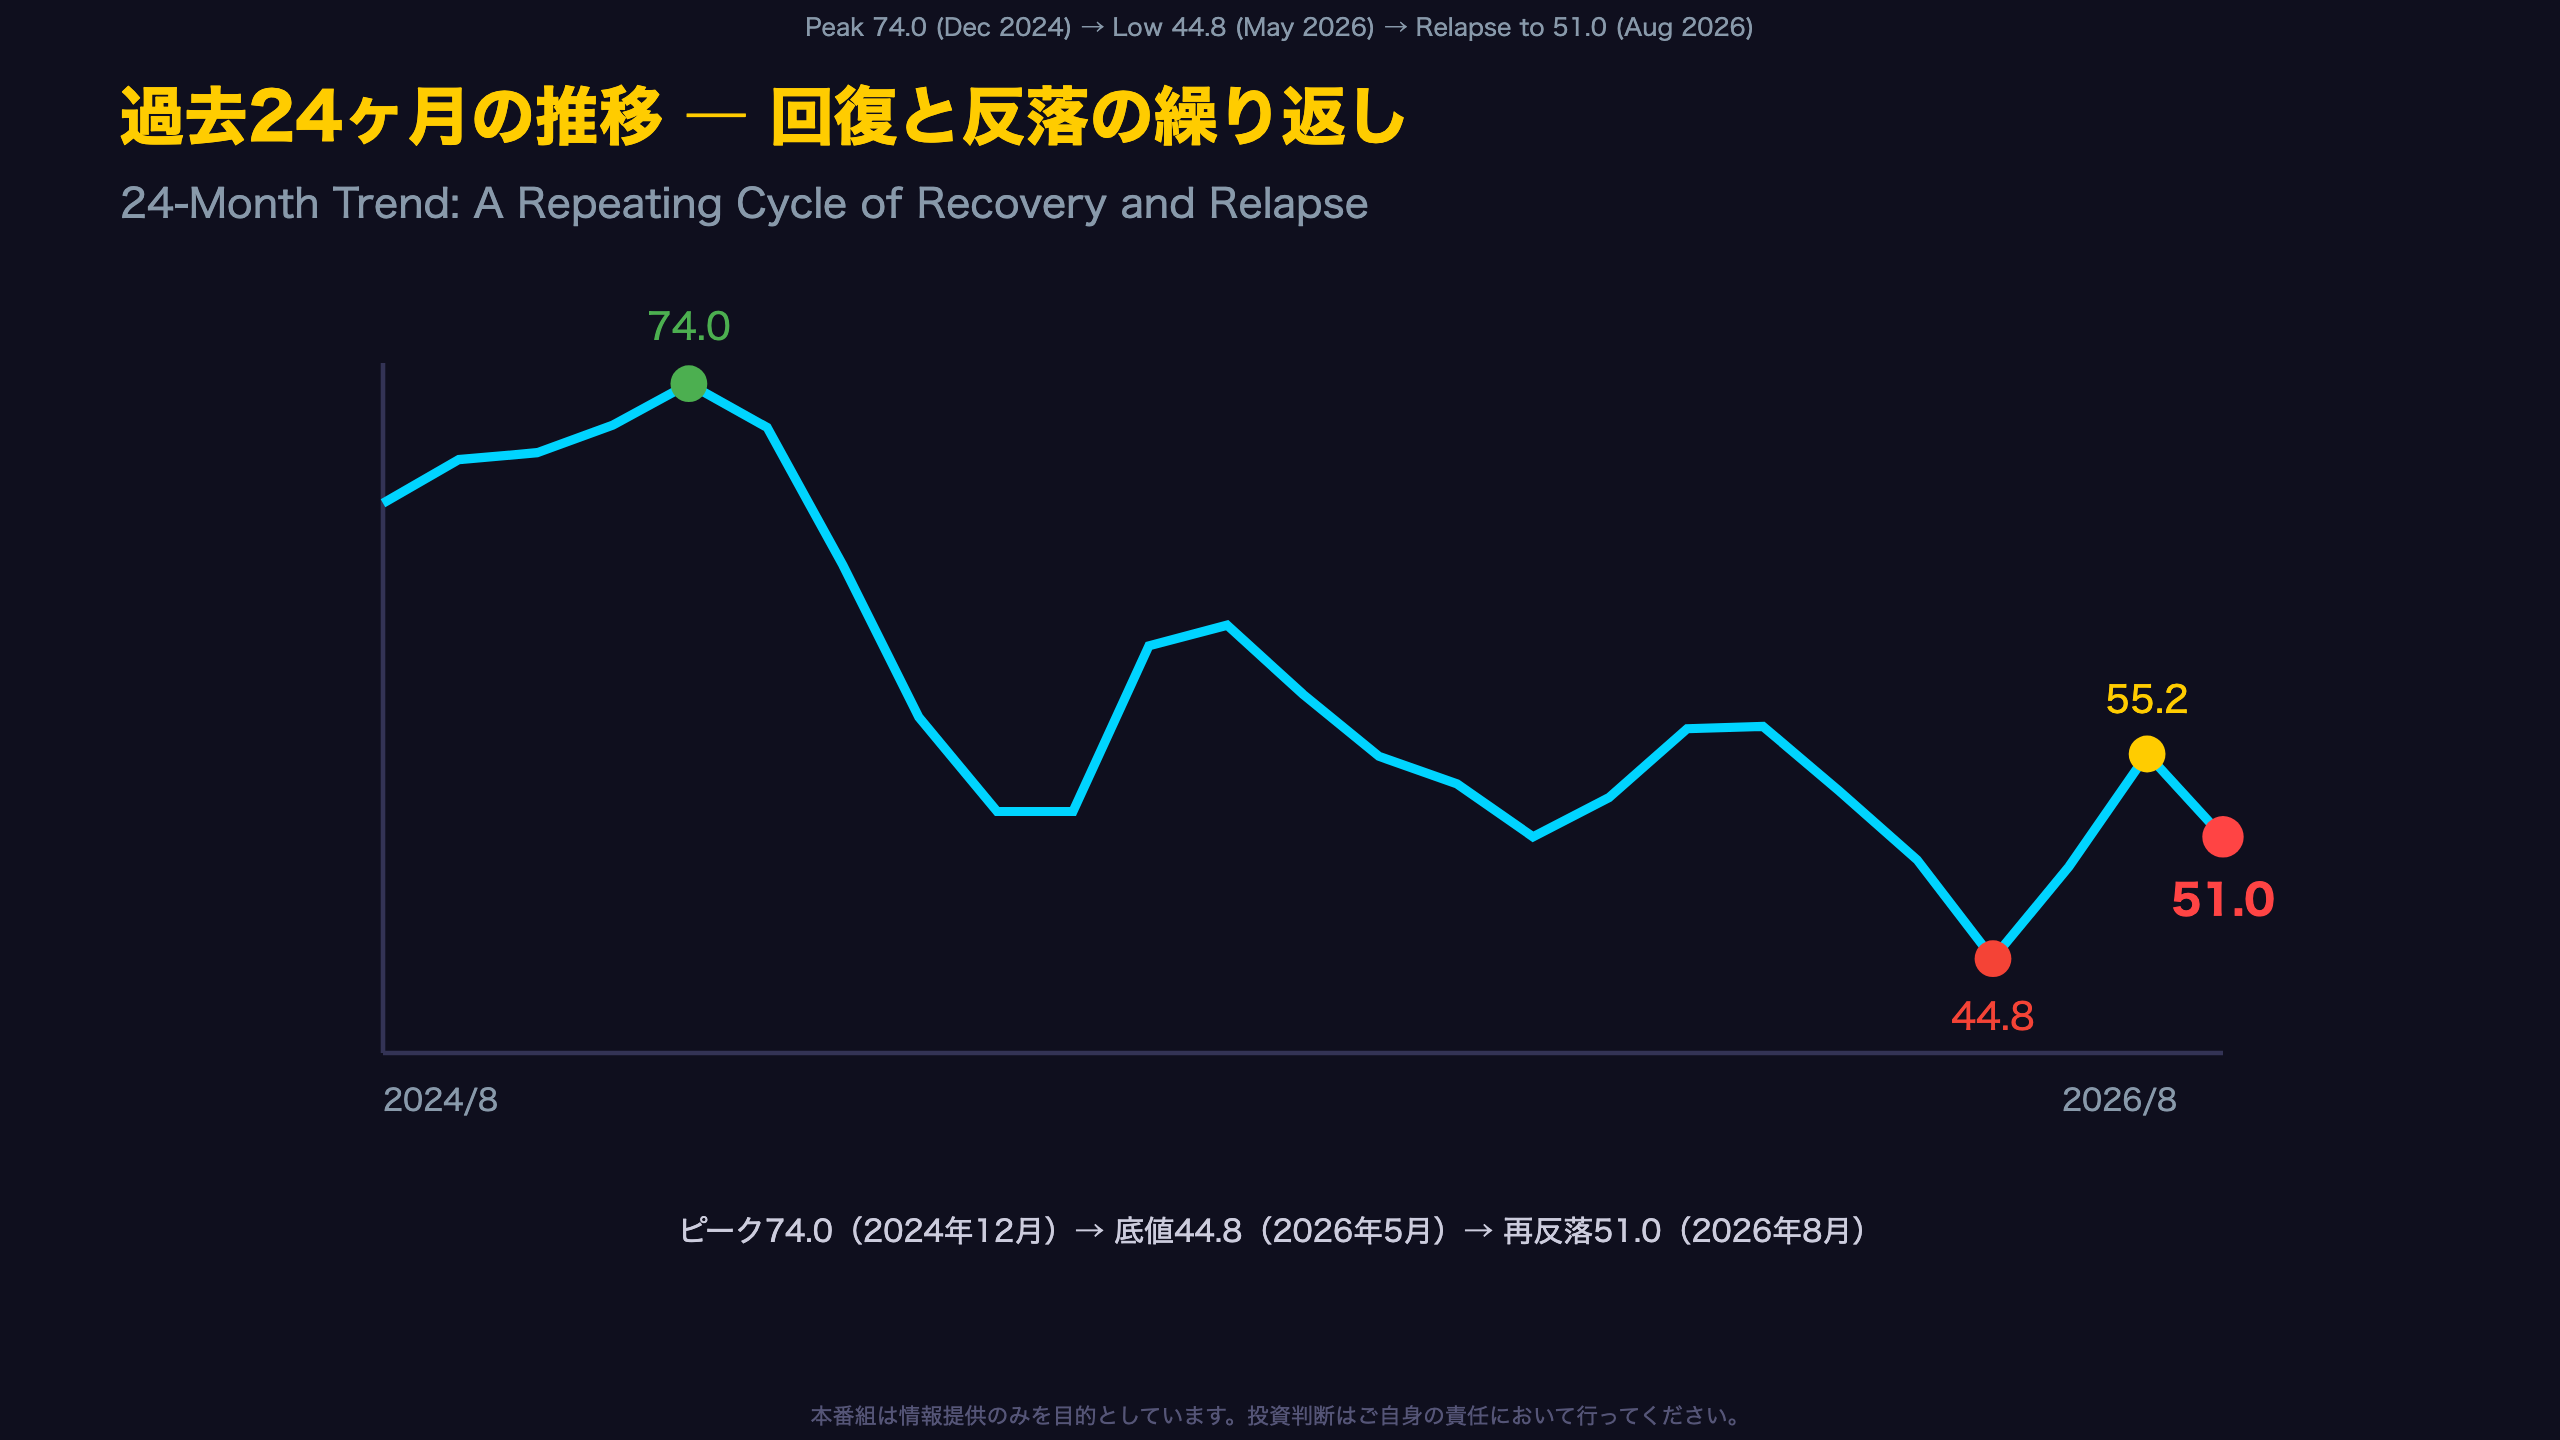
Looking at the trailing two years, the index bottomed at 51.0 in November 2025 (coincidentally matching today’s reading), recovered to the mid-50s by early 2026, then plunged to a cycle-low 44.8 in May before a brief two-month rebound. That rebound has now reversed.
The Expectations-Current Gap
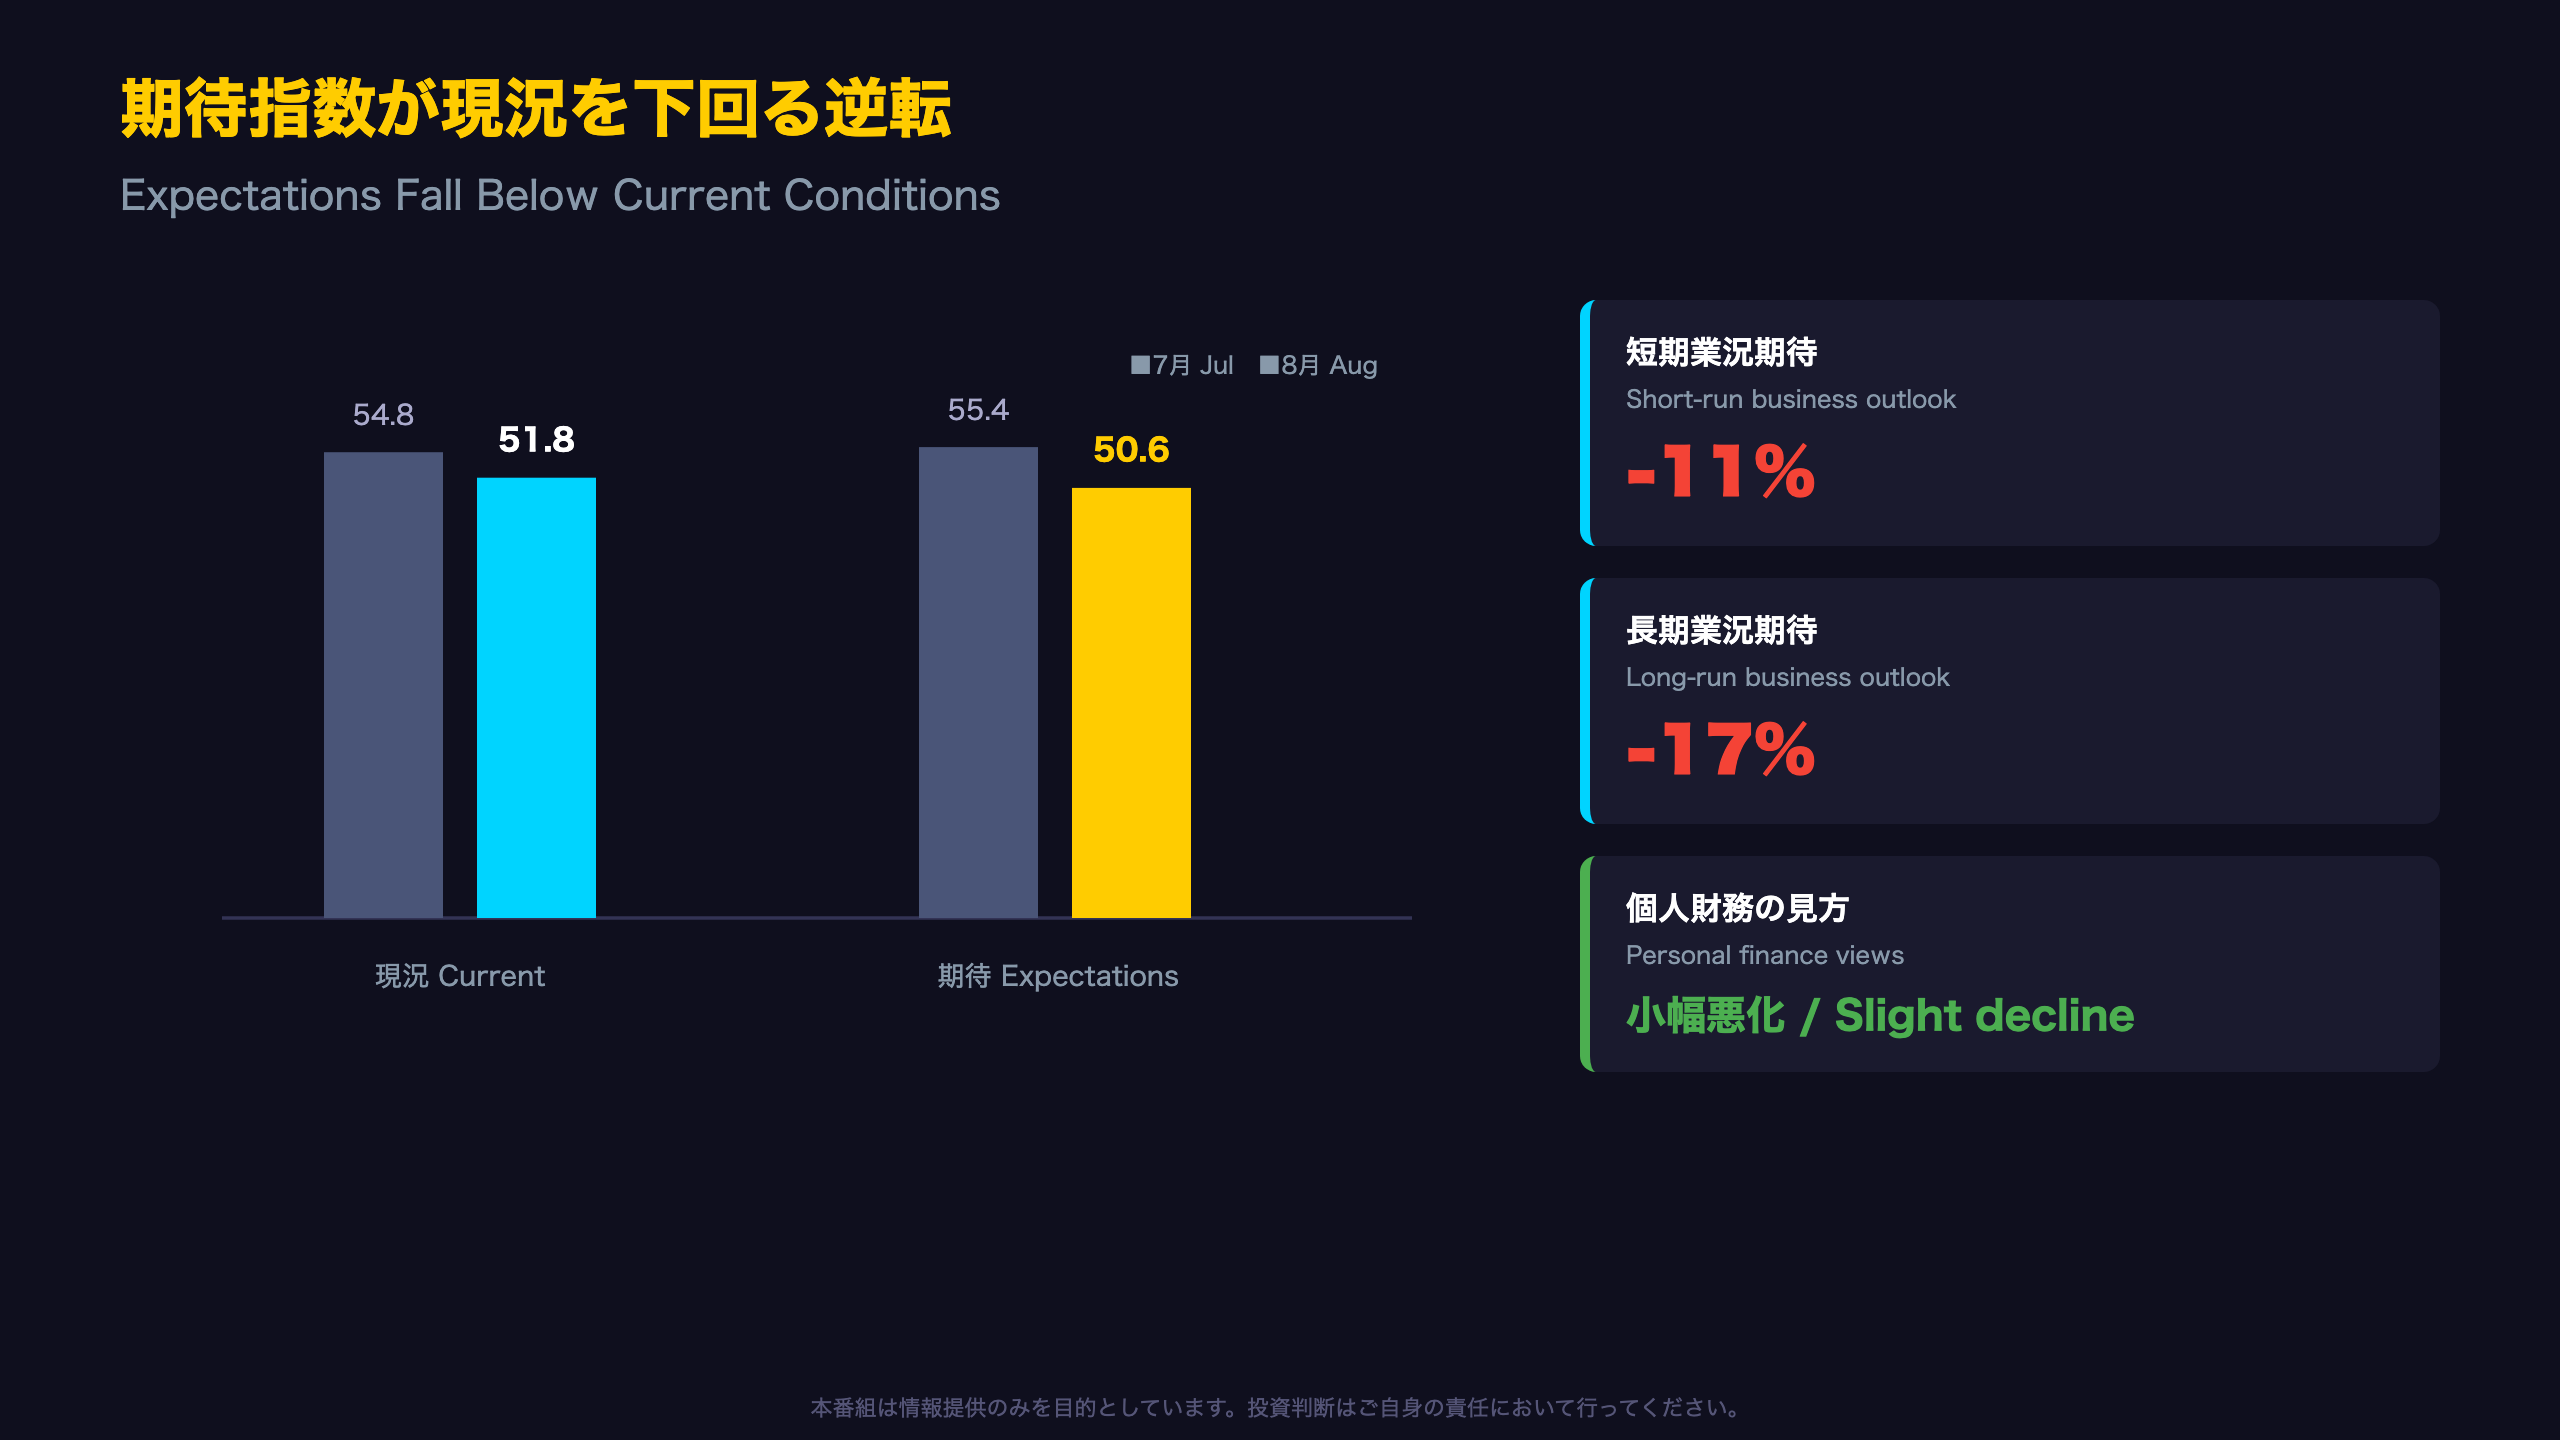
Current conditions fell 5.5% month-over-month, while expectations fell a sharper 8.7%. Per the report, short-run business condition expectations sank 11% and long-run expectations sank 17%, even as personal finance views held relatively steady. This divergence suggests consumers feel their own finances are manageable but harbor growing anxiety about the broader economy.
What’s Next
The final August reading is due August 28. Watch for revisions to the inflation expectations components, which the Fed monitors closely.
個人の生活は「まだ大丈夫」でも、経済全体には強い警戒感
A Widening Gap Between Perception and Expectation
Comparing the Index of Current Economic Conditions (ICC) and Index of Consumer Expectations (ICE) over the trailing months reveals a notable shift. In July 2026, ICC (54.8) and ICE (55.4) were nearly aligned. By August, ICC fell to 51.8 while ICE dropped further to 50.6 — a reversal where expectations now sit below current conditions.
Table: The Gap Over Time
| Month | ICC | ICE | Gap (ICE-ICC) |
|---|---|---|---|
| Jun 2026 | 47.7 | 50.7 | +3.0 |
| Jul 2026 | 54.8 | 55.4 | +0.6 |
| Aug 2026 | 51.8 | 50.6 | -1.2 |
Context for U.S. Readers
This divergence matters because the Michigan survey’s expectations component is a key input to the Conference Board’s Leading Economic Index and is closely tracked by the Fed as a forward-looking signal of consumer spending intentions. A sharper decline in expectations versus current conditions historically has preceded softening in discretionary spending, though a single month’s data is insufficient to confirm a structural trend.
A Counterpoint
Notably, similar near-parity between ICC and ICE occurred in November 2025 (51.1 vs 51.0), suggesting some of this divergence pattern may reflect normal month-to-month noise rather than a durable regime change.
インフレ期待、再び上昇 ― 実質購買力への不安が根強く
Tracking the Inflation Expectations Arc
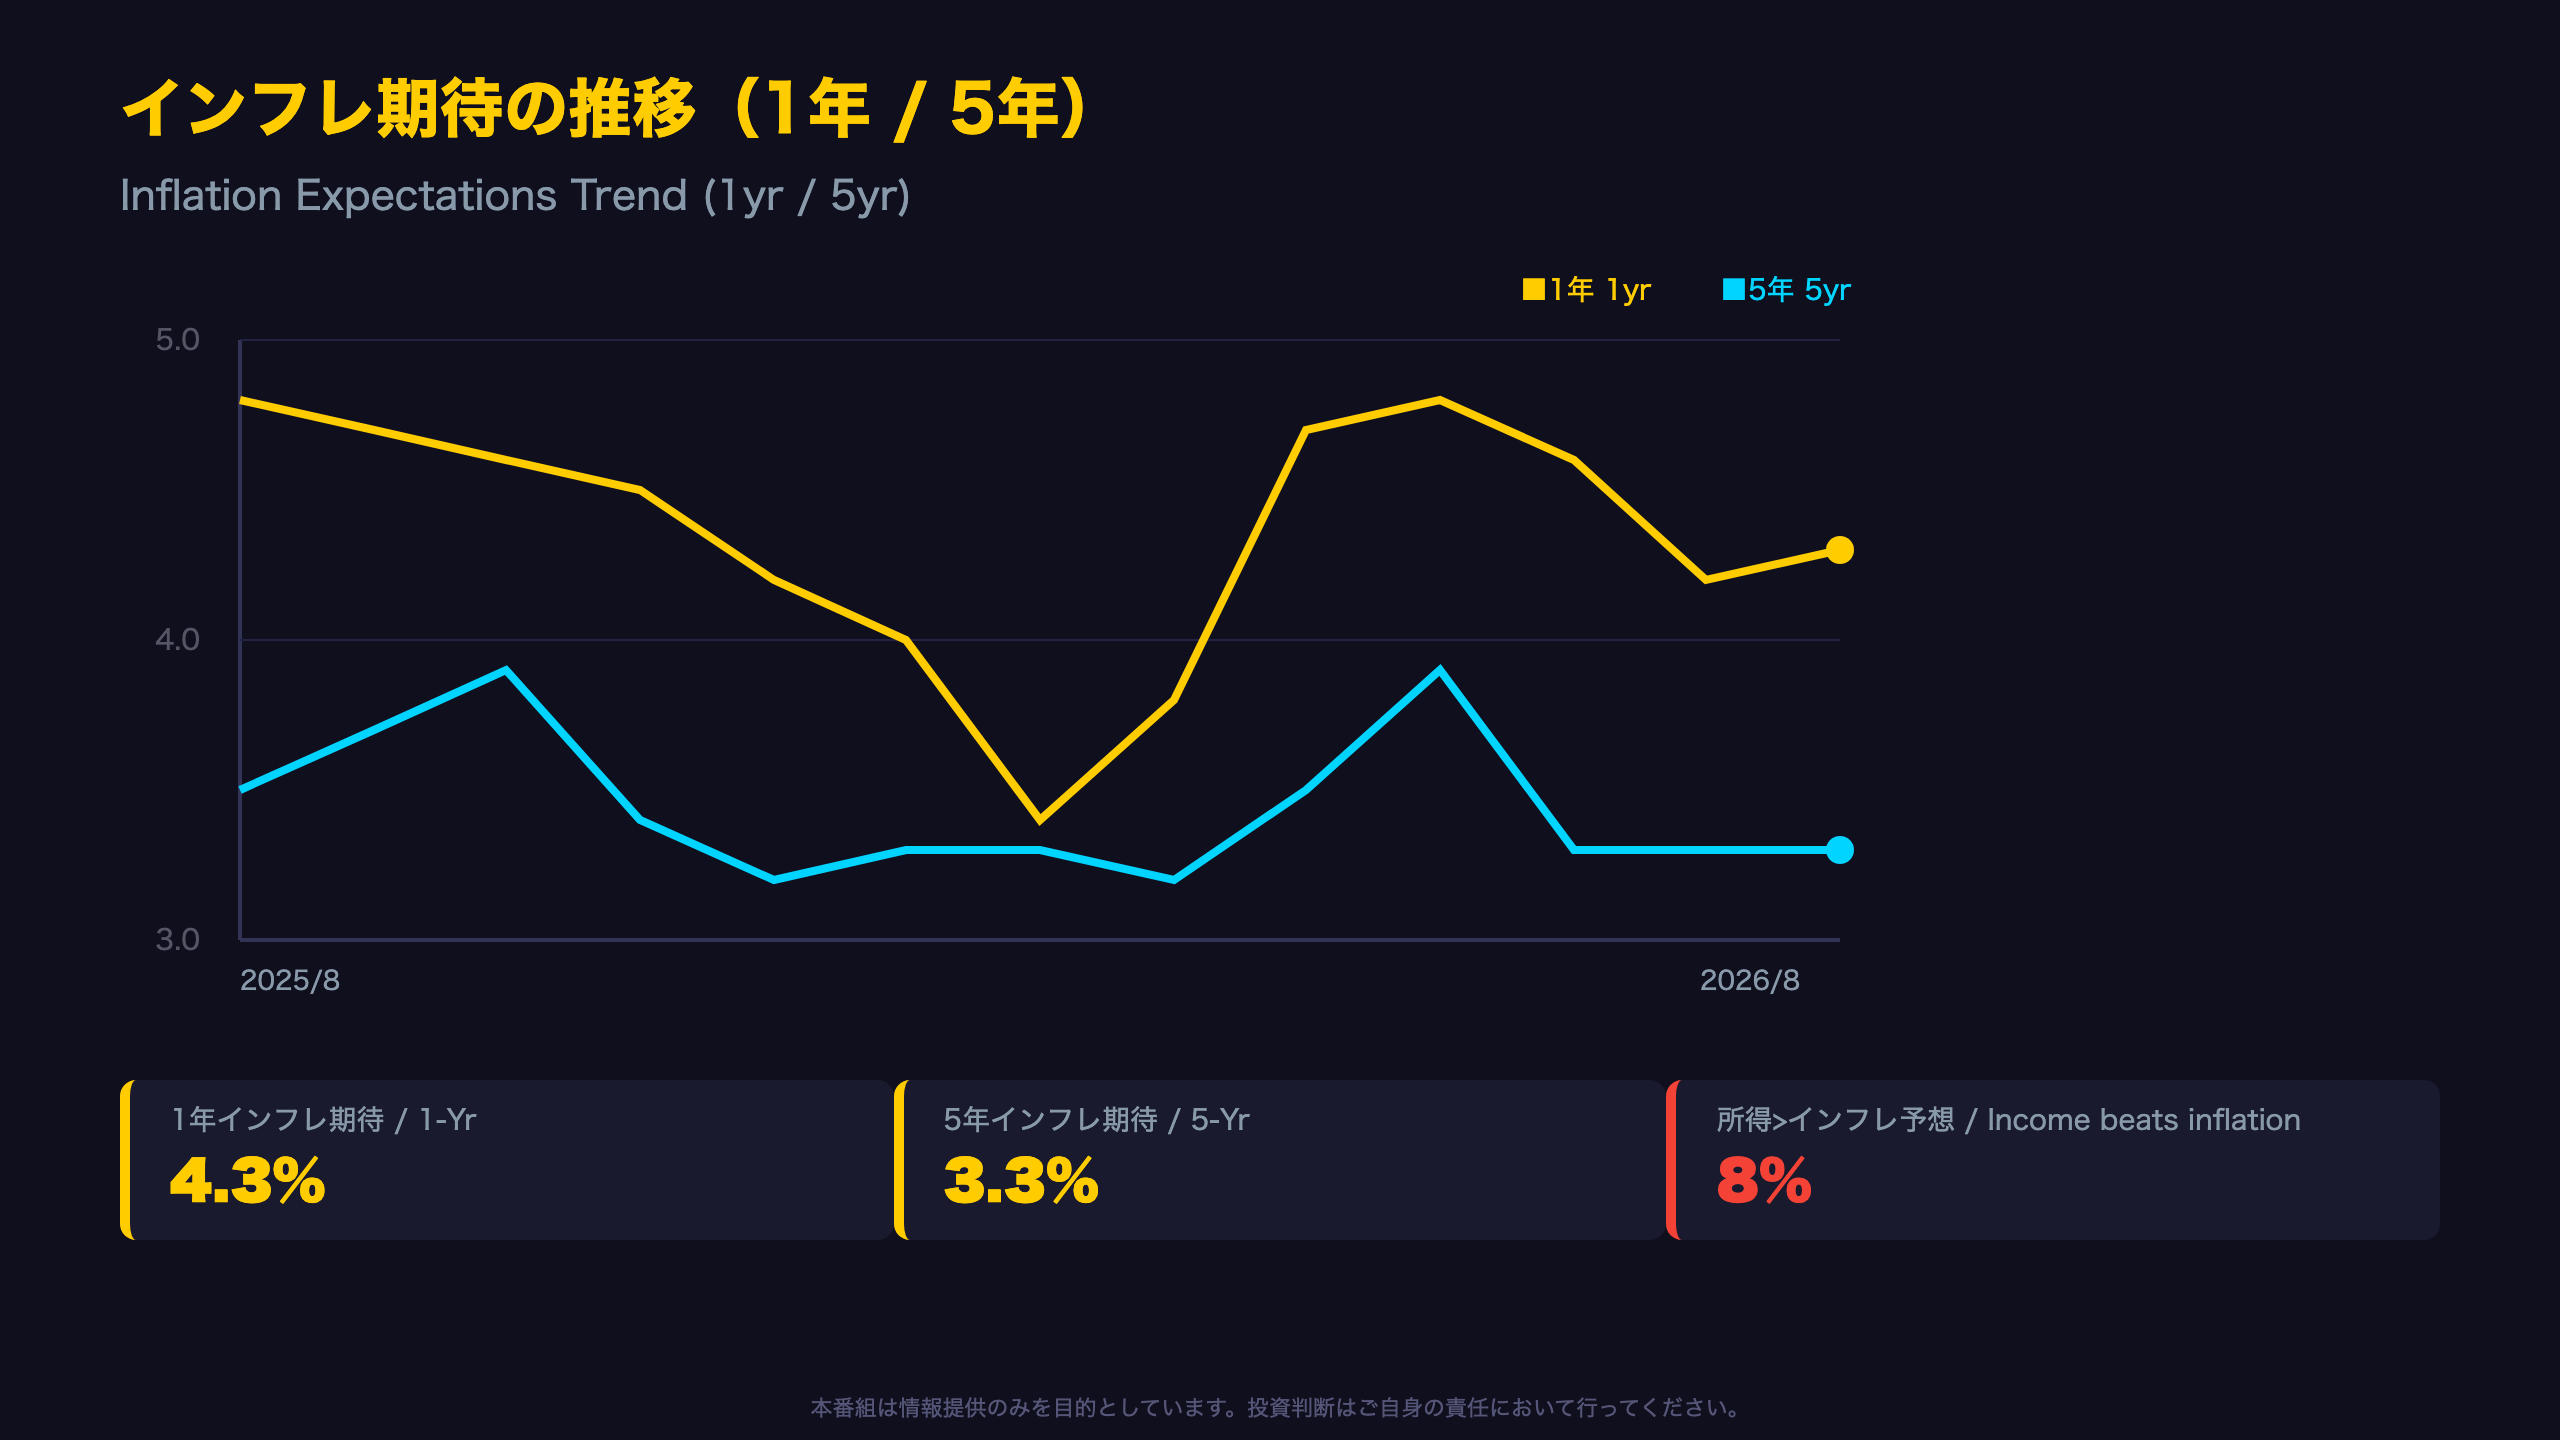
The 1-year median inflation expectation spiked to a striking 5.0%-6.6% range between March and May 2025, before easing to the 4.5%-4.8% zone in the second half of 2025 and touching a cycle-low 3.4% in February 2026. Since March, however, it has re-accelerated: 4.7% in April, 4.8% in May, 4.6% in June, 4.2% in July, and now 4.3% in August — persistently elevated in the low-4% range.
Direct quote: “Year-ahead inflation expectations ticked up from 4.2% in July to 4.3% this month. The current reading substantially exceeds the 3.4% seen in February before the Iran conflict began, along with all 2024 readings.”
Why the 5-Year Reading Matters More for the Fed
The 5-year (long-run) inflation expectation has held at 3.3% for three straight months. For context, U.S. readers should note the Fed’s inflation target is 2% on a PCE basis, and long-run Michigan survey readings above the pre-pandemic 2.8%-3.2% band are watched closely by FOMC officials as a signal of potential de-anchoring — even modest persistence above range can factor into policy deliberations.
The Purchasing Power Angle
Perhaps the most striking data point: only 8% of consumers now expect income growth to outpace inflation, down sharply from 18% in December 2024. This reflects not just a perception of “high prices” but a broader sense that real purchasing power is being persistently eroded — a dynamic that could weigh on discretionary consumer spending even if headline sentiment stabilizes.
共和党層で最大の下落 ― 高齢層・低所得層にも影響拡大
The Politics of Sentiment
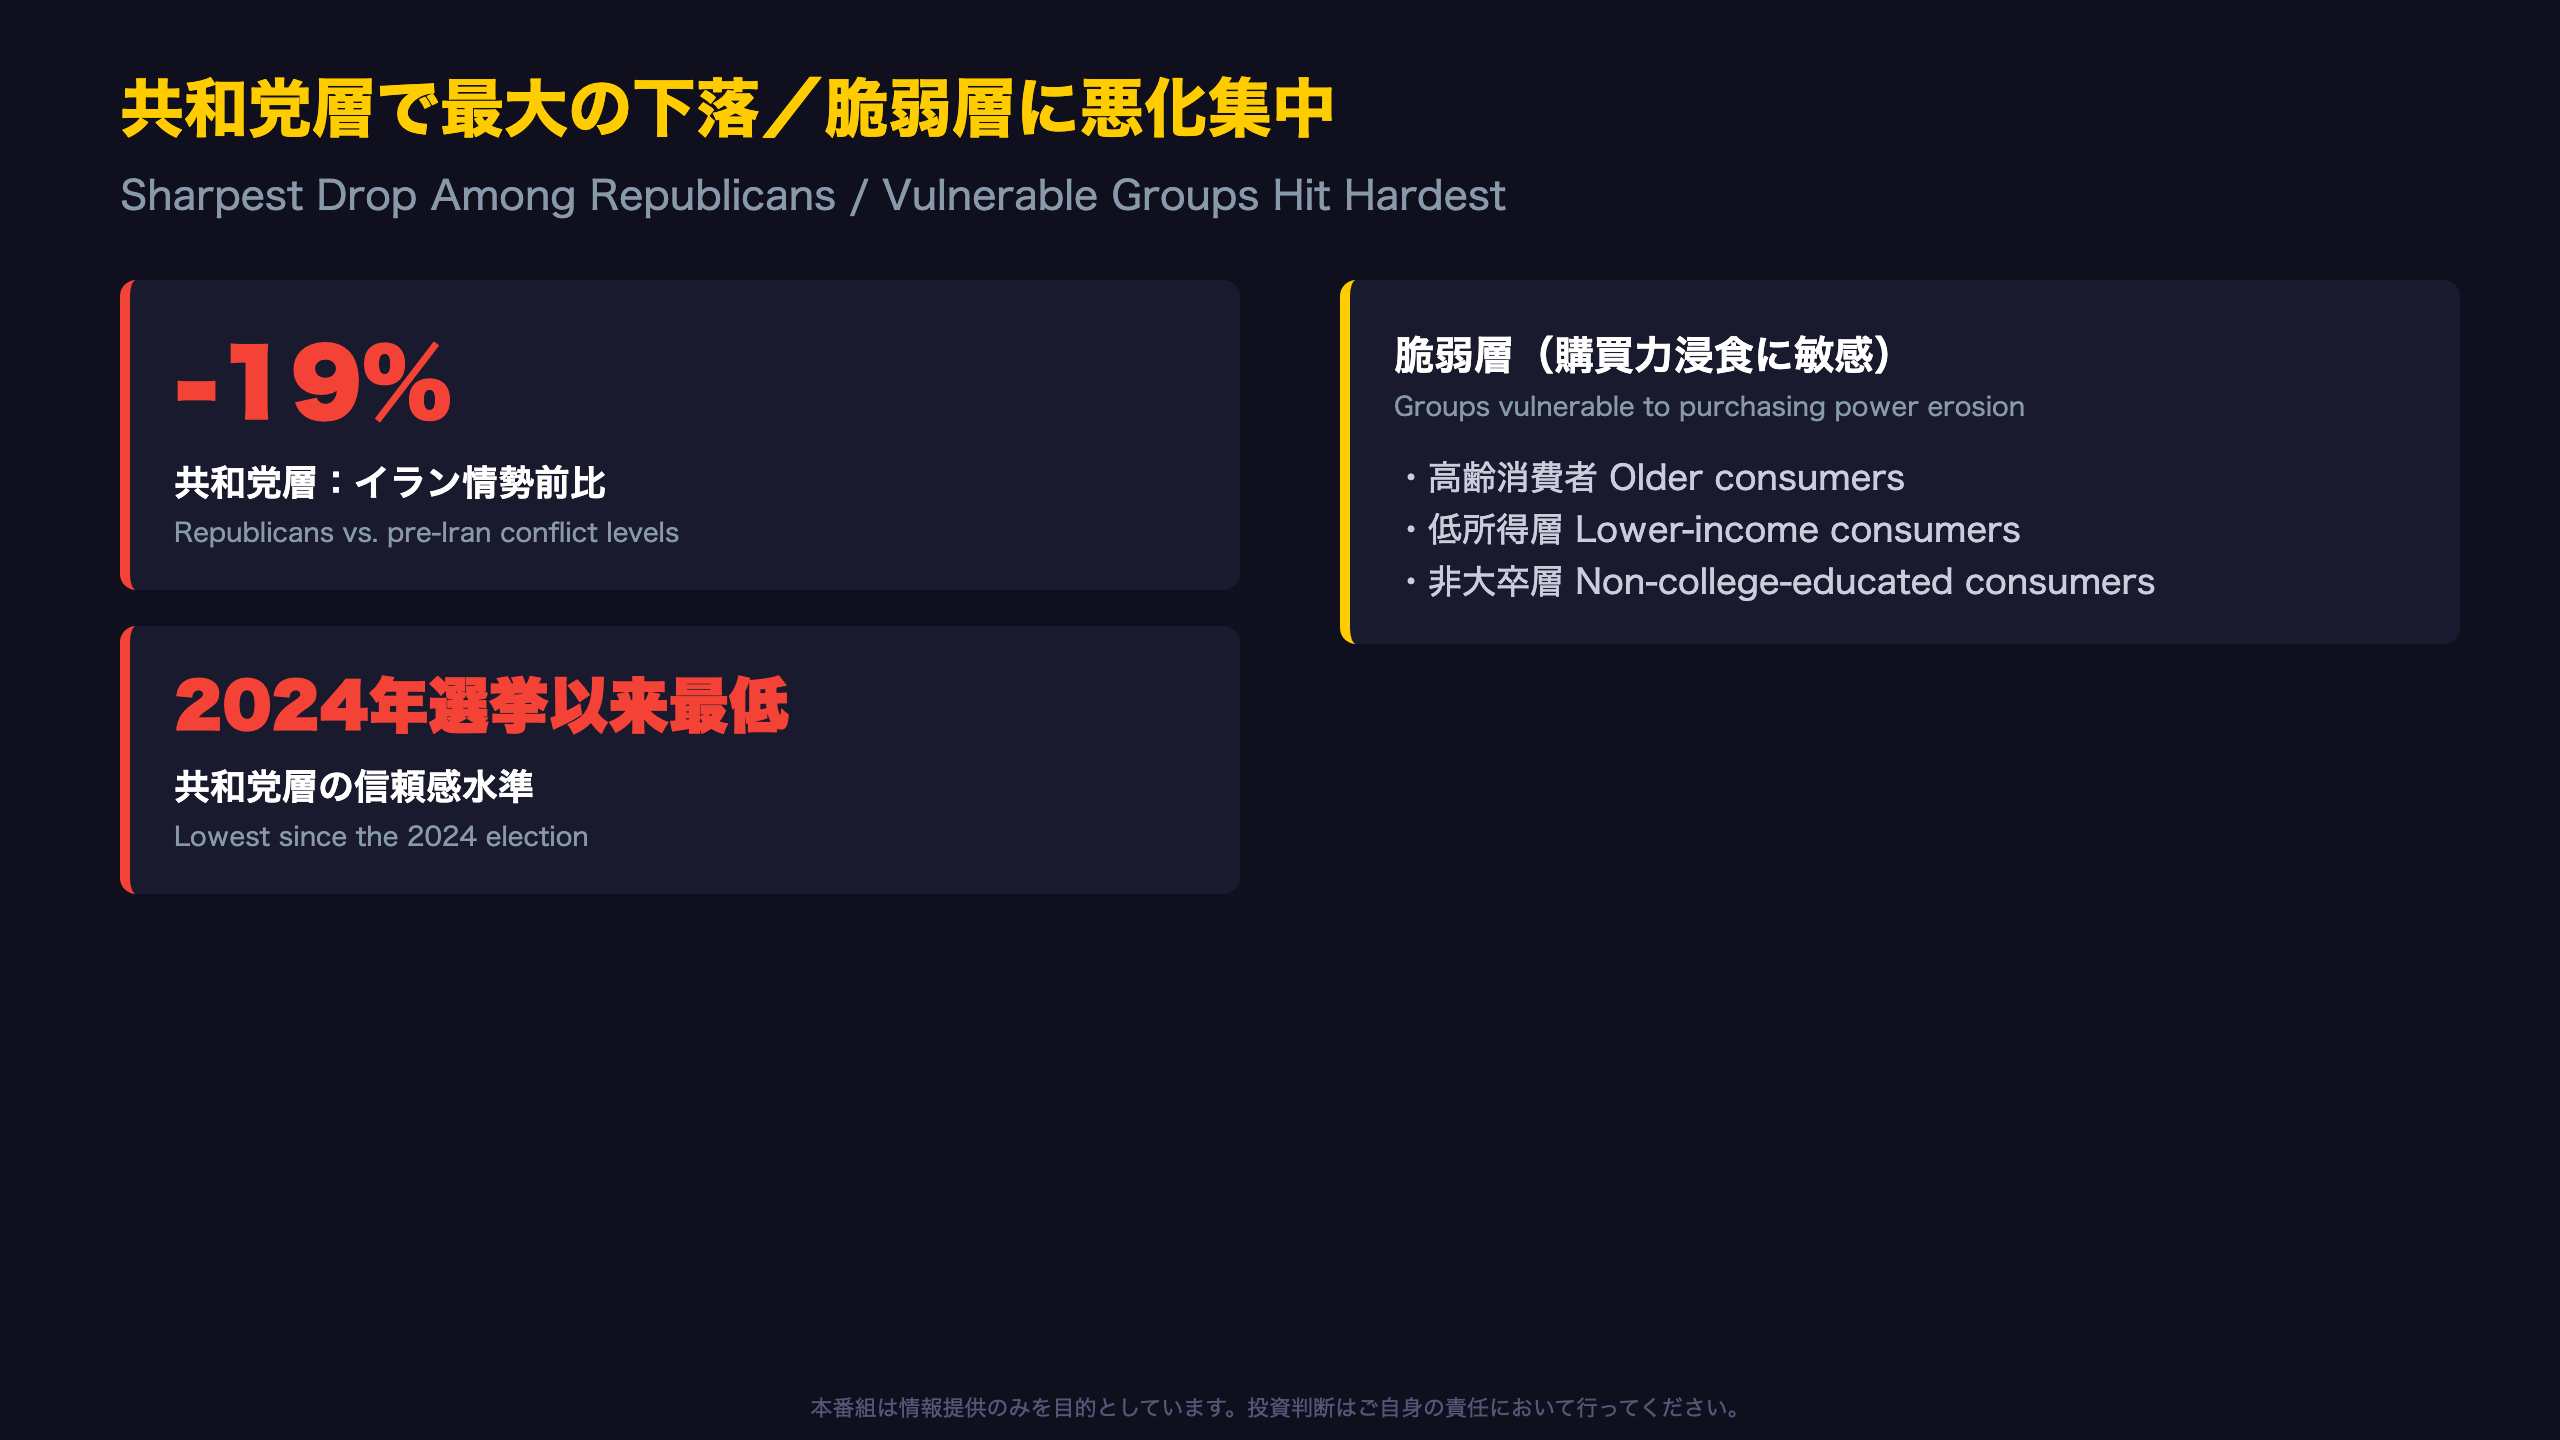
The University of Michigan survey is well known for showing sharp divergences by political affiliation, and this report explicitly states that “decreases in sentiment were seen across the political spectrum, with Republicans exhibiting the strongest month-to-month decline in August.” For international readers: Republican sentiment is now 19% below levels seen just before the Iran conflict and is at its lowest point since the 2024 U.S. presidential election — a reminder that partisan swings in this particular survey can be as large as macroeconomic swings.
Vulnerable Demographics Bear the Brunt
The report specifically calls out that “notably large reductions were seen among older consumers, lower-income consumers, and those without a college degree,” describing these groups as “particularly vulnerable to any erosion of purchasing power stemming from inflation.” This is a meaningful nuance for investors: aggregate sentiment declines may mask a more concentrated deterioration among households with the least financial buffer against inflation.
A Necessary Caveat
This demographic breakdown reflects a single month of data, and one should avoid over-interpreting it as a permanent structural shift. That said, it is consistent with the headline finding that just 8% of consumers expect income to outpace inflation, lending some credibility to the narrative of concentrated financial stress among vulnerable households.
回復と反落を繰り返す2年間 ― 一貫した改善トレンドは形成されず
Four Phases in 24 Months
The trailing 24-month path can be broken into four distinct phases:
- Gradual decline (Aug 2024 – Apr 2025): From 67.9 down to 52.2, spanning the U.S. presidential transition.
- Brief rebound (Jun-Jul 2025): Recovery to 60.7 and 61.7.
- Renewed slide (Aug 2025 – May 2026): Falling from 58.2 to a 24-month low of 44.8.
- Choppy back-and-forth (Jun-Aug 2026): 49.5 → 55.2 → 51.0, with a two-month recovery erased in a single month.
Quantifying the Whipsaw
The rally from May’s 44.8 to July’s 55.2 represented a +10.4 point gain. August’s decline alone erased 4.2 points — 38% of that entire two-month gain. This volatility suggests consumer sentiment remains highly reactive to event-driven shocks (geopolitical risk, inflation surprises) rather than settling into a stable trend.
A Statistical Caveat for U.S. Readers
As a monthly sample survey (methodologically distinct from the Conference Board’s larger-sample Consumer Confidence Index), the Michigan index carries meaningful sampling variability month-to-month. The final August reading, due August 28, could revise this preliminary 7.6% decline meaningfully in either direction.
FRBの判断はより複雑に ― インフレ期待と消費マインドの綱引き
Reading Market Implications Through the Chain of Evidence
Consumption Channel
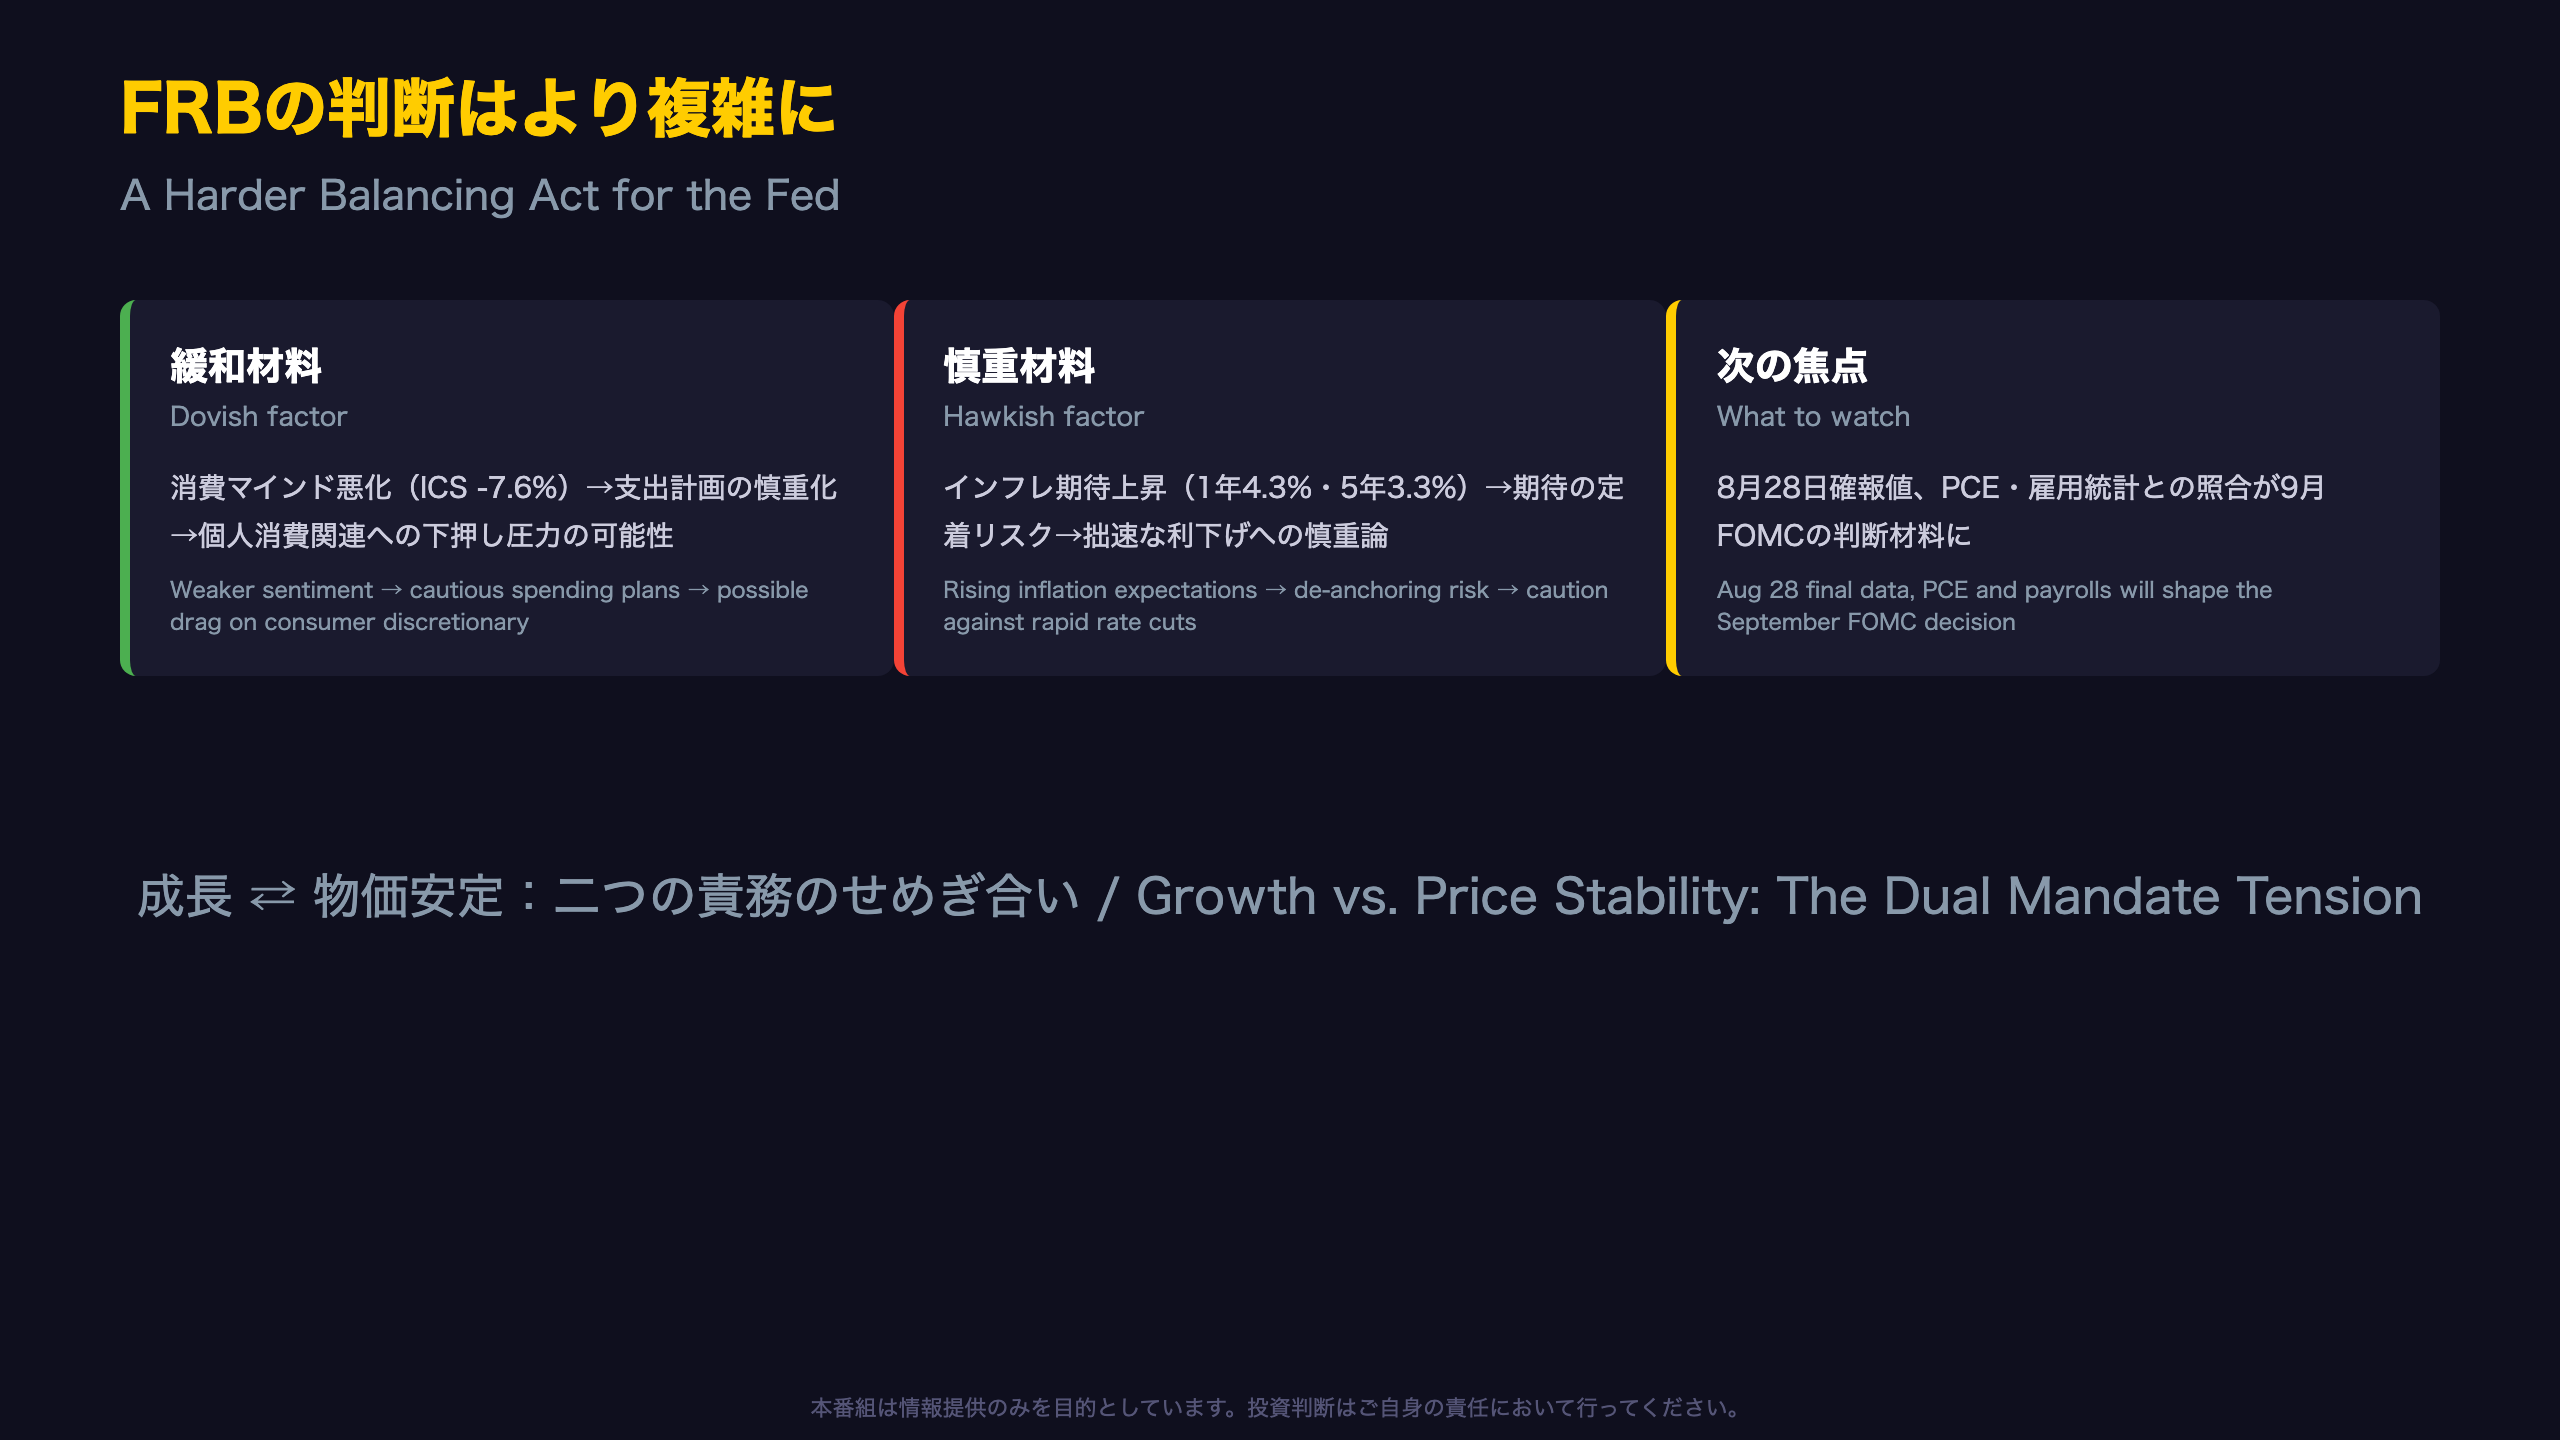
[Fact] ICS fell 7.6% MoM, with the expectations sub-index down a sharper 8.7% → [Mechanism] Declining consumer sentiment typically precedes more cautious household spending plans → [Market Implication] This is generally thought to create headwinds for consumer discretionary and retail sector earnings outlooks, though this single data point alone cannot confirm actual pass-through to spending data — retail sales and PCE reports should be monitored for confirmation.
Inflation Expectations and Fed Policy
[Fact] 1-year inflation expectations rose from 4.2% to 4.3%, while 5-year expectations held at 3.3% for a third straight month — above the 2024 range of 2.8%-3.2% → [Mechanism] The Federal Reserve places significant weight on the anchoring of household inflation expectations; persistent elevation above historical ranges raises the bar for confidently declaring price stability achieved → [Market Implication] This is generally seen as supporting a more hawkish policy stance or slower rate-cut pace, though confirmation requires cross-referencing with PCE and CPI data, as well as labor market indicators.
A Genuine Policy Dilemma
This report presents the Fed with a classic dual-mandate tension: weakening consumer sentiment argues for easier policy, while sticky-to-rising inflation expectations argue for caution. Historically, sentiment deterioration alone has supported dovish pivots, but not when accompanied by de-anchoring risk in inflation expectations. The final August reading (Aug 28) alongside upcoming PCE and payrolls data will be critical inputs for the September FOMC deliberation.
Disclaimer: This article is for informational purposes only. All investment decisions are made solely at your own risk.







