
📺 Watch the Full Video Analysis
This article was automatically generated by the NFC Market Live AI analysis system. (Updated: 2026-08-25 23:08 JST)
📄 Primary Source
U.S. Census Bureau
https://www.census.gov/construction/nrs/pdf/newressales.pdf
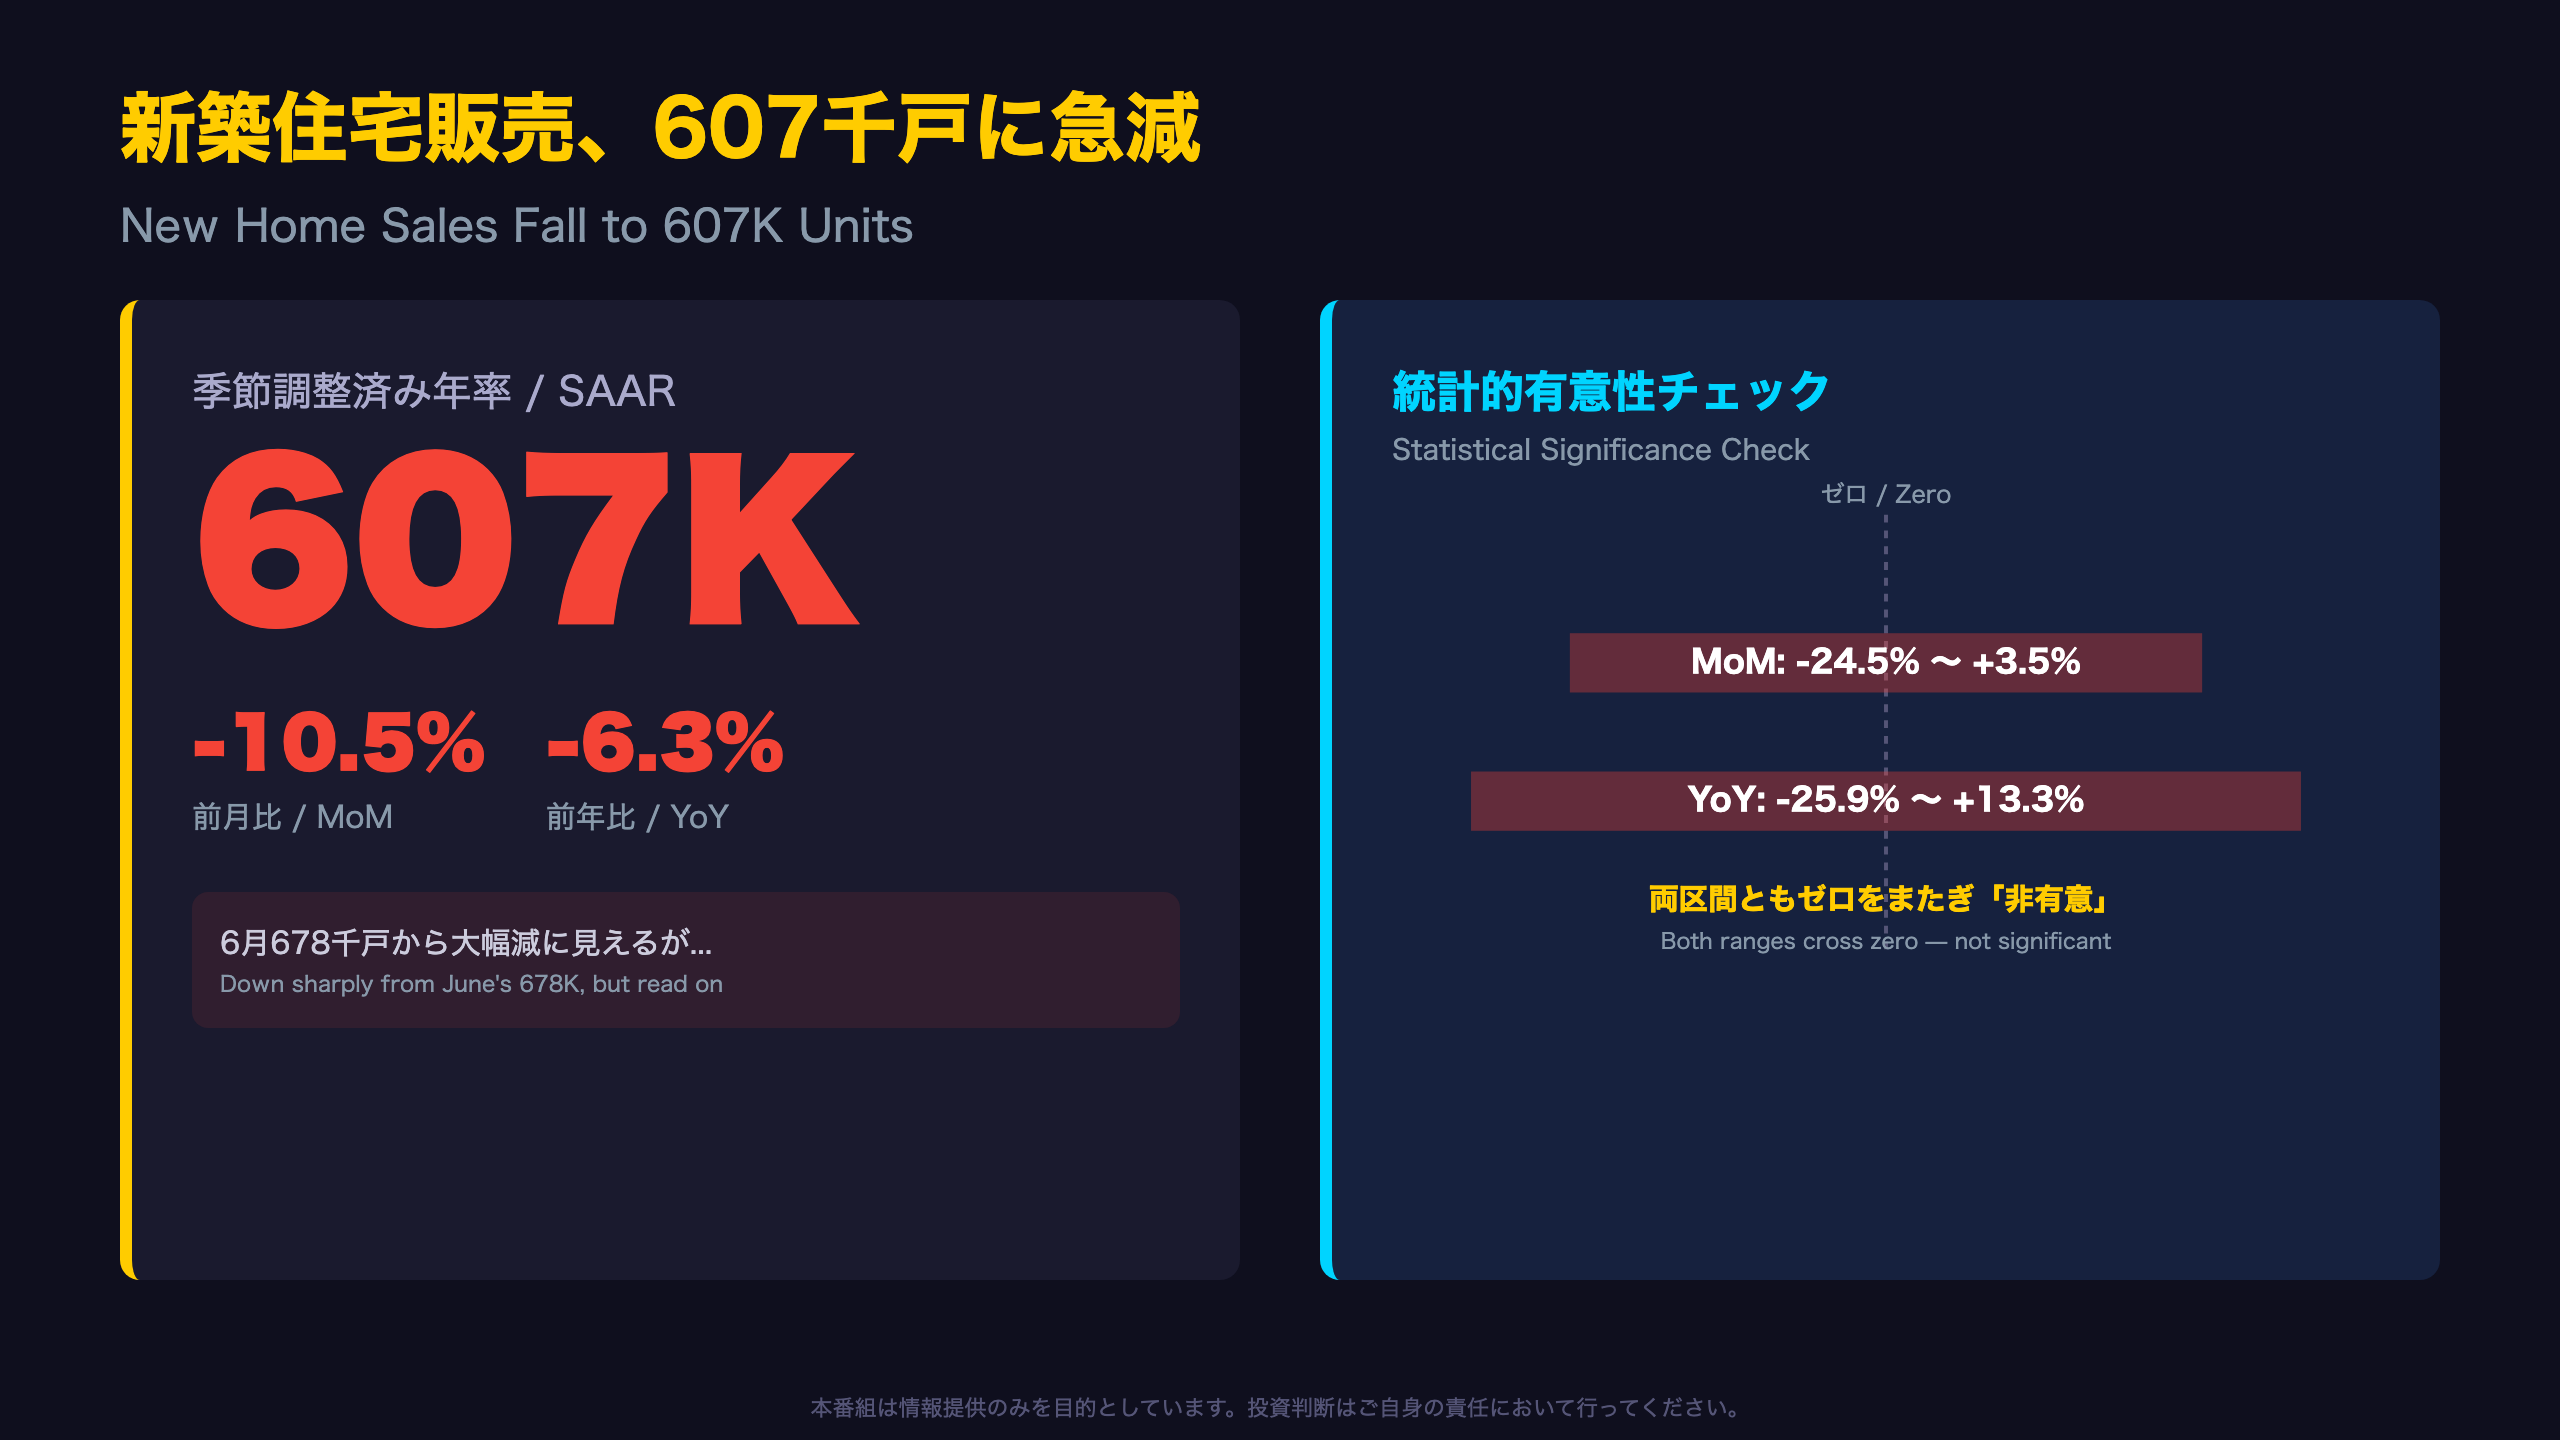
📊 US New Home Sales fell to a seasonally adjusted annual rate of 607,000 in July 2026, down 10.5% MoM and 6.3% YoY. But both confidence intervals (±14.0%, ±19.6%) straddle zero — meaning the drop is not statistically significant.
📈 Inventory rose to 488,000 units (+1.9% MoM, statistically significant), pushing months’ supply to 9.6 — the highest in over a year.
⚠️ The Midwest saw a statistically significant -42.7% MoM plunge, while the South and West stayed within margin of error.
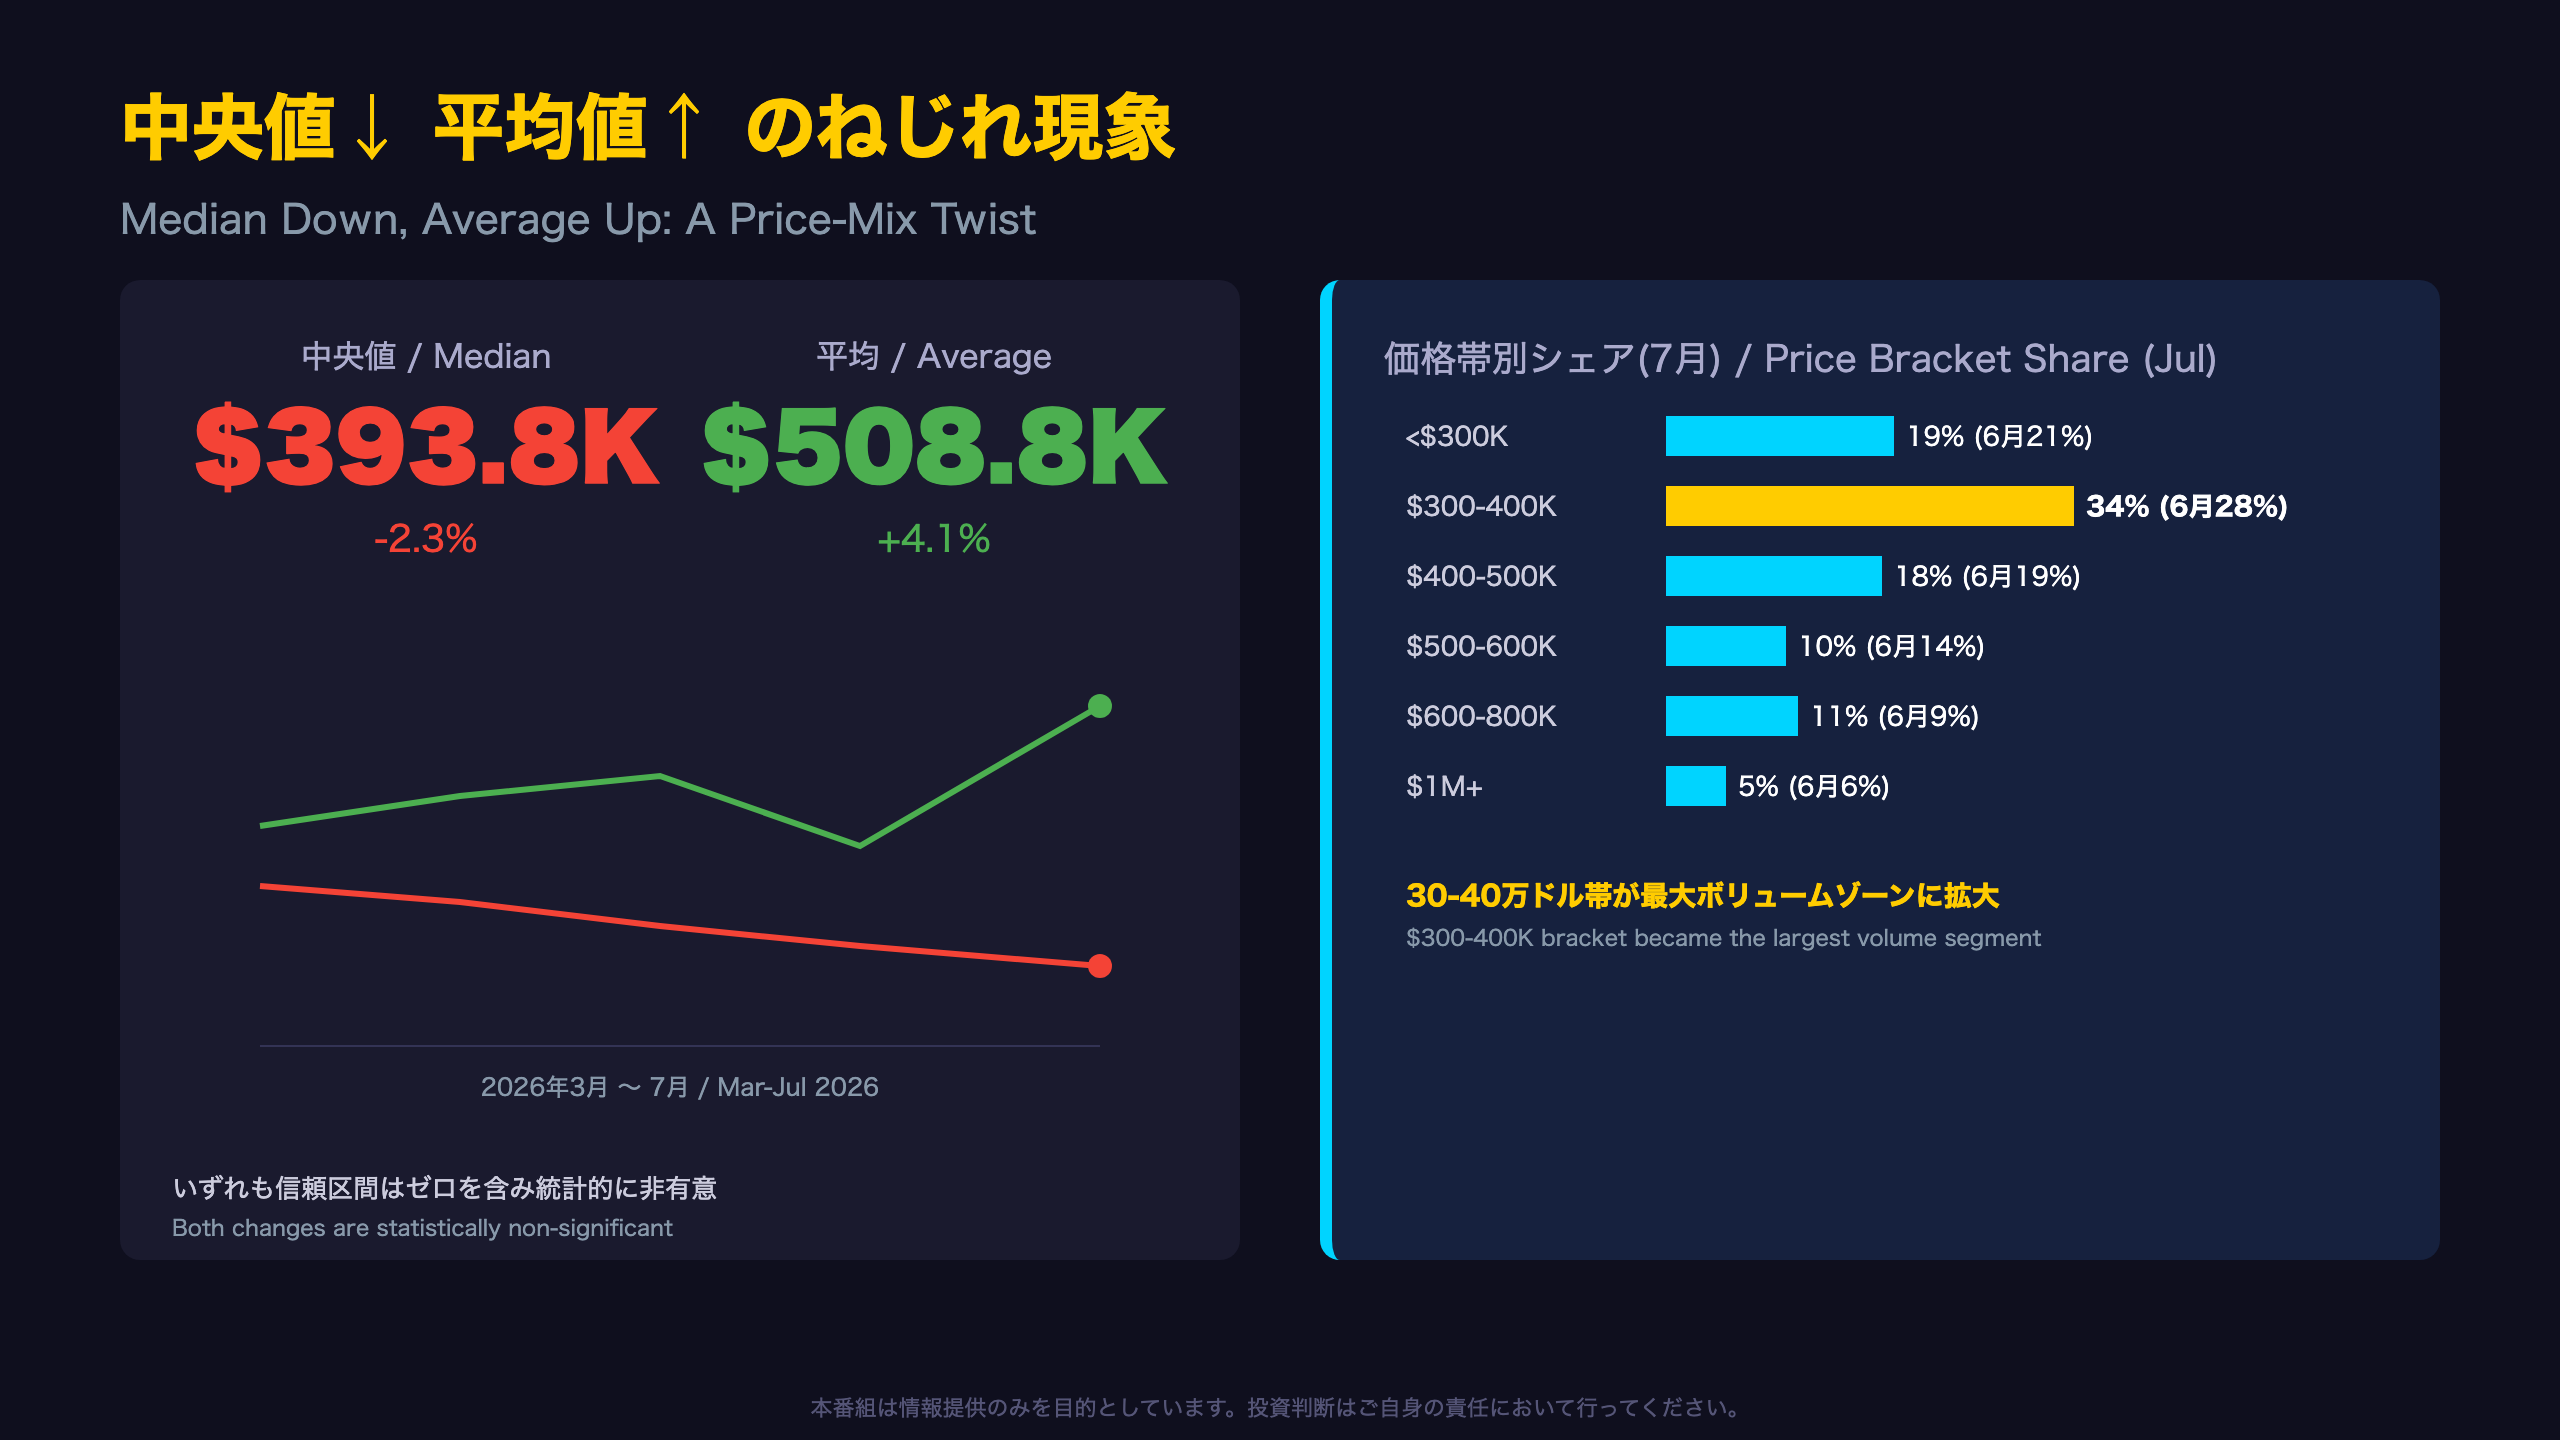
💡 Median price fell to $393,800 while average price rose to $508,800, hinting at a shift in price-mix.
We break down what the headline number hides — and what it means for the housing market and Fed policy.
新築住宅販売、607千戸に急減 — だがその実態は?
The Statistical Fine Print Behind the Headline
The U.S. Census Bureau and HUD reported new home sales fell to a seasonally adjusted annual rate (SAAR) of 607,000 units in July 2026, down from 678,000 in June — a 10.5% month-over-month drop that looks alarming at first glance.
But buried in the report’s explanatory notes is a crucial caveat: “If a range does not contain zero, the change is statistically significant. If it does contain zero, it is uncertain whether there was an increase or decrease.” The 10.5% decline carries a margin of error of ±14.0%, meaning the true change could range from -24.5% to +3.5%. Statistically speaking, we cannot rule out that sales were essentially flat.
Context for International Readers
Unlike existing home sales (compiled by the National Association of Realtors from closed transactions), the Census Bureau’s New Residential Sales survey counts new single-family homes at the point of signed contract or deposit — making it a more forward-looking, but also more sample-volatile, indicator. The Census Bureau explicitly states it takes four consecutive months to establish a reliable trend, a standard far stricter than typical Wall Street headline reactions.
What Was Actually Significant
While the sales drop lacks statistical confidence, inventory of new homes for sale rose to 488,000 units (+1.9% MoM), a change whose ±1.2% confidence interval does NOT contain zero — making it one of the few genuinely significant data points in this release. This asymmetry between a “loud but unproven” sales decline and a “quiet but confirmed” inventory build is the central tension of this report, with implications for how the Fed and bond markets should weigh single-month housing prints.
12ヶ月の推移で見る607千戸の実像
The Trap of Single-Month Data
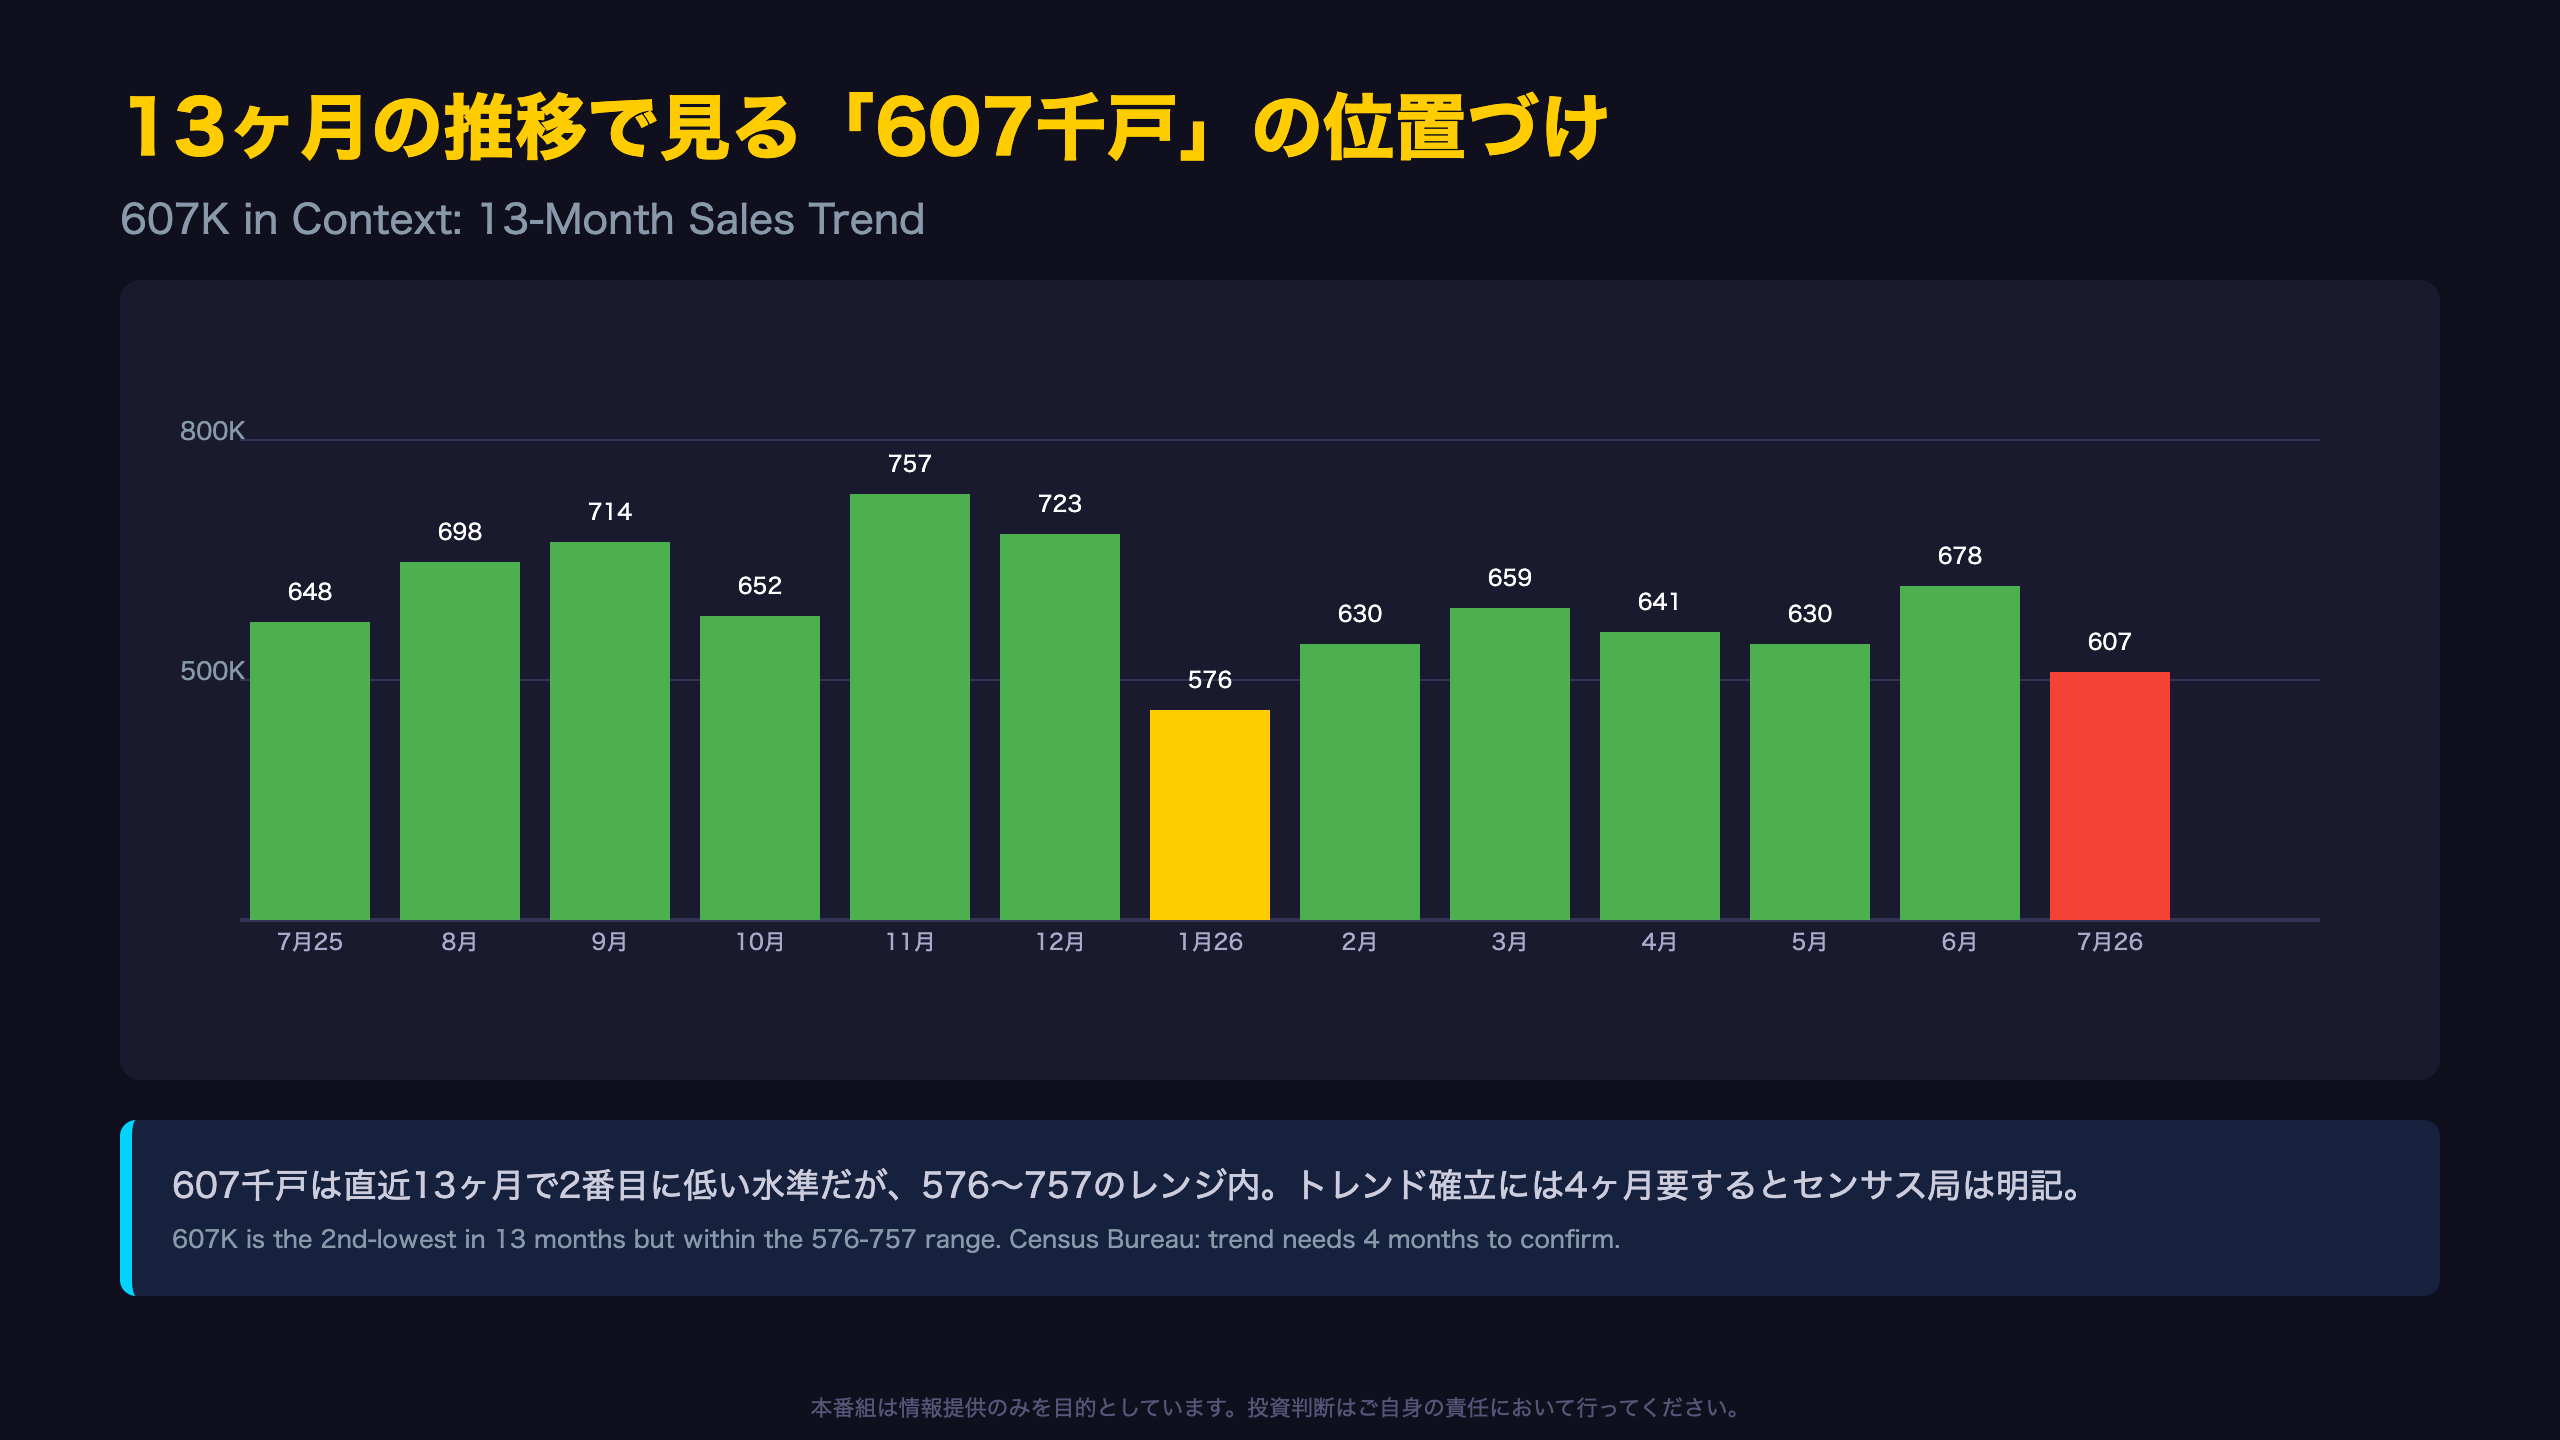
Taken in isolation, 607,000 units looks like a sharp deterioration. But laid out across the trailing 13 months, a different picture emerges: 648, 698, 714, 652, 757, 723, 576, 630, 659, 641, 630, 678, and now 607 (thousands, SAAR).
January 2026’s reading of 576,000 was actually the low point of this stretch — July’s 607,000 is the second-lowest, not a record collapse. If anything, the data reads more like a continuation of a gradual step-down from the 723,000-757,000 range seen in late 2025, rather than a sudden cliff.
Why Sample-Based Surveys Are Noisy
The report discloses an average relative standard error (RSE) of 8% over the latest six-month period. Unlike, say, the ISM Manufacturing PMI (a diffusion index based on survey responses), New Residential Sales is built from a probability sample of building permits — meaning month-to-month volatility is baked into the methodology itself, not necessarily a signal of demand collapse.
Revisions Are the Norm, Not the Exception
The Census Bureau states preliminary total sales estimates are revised by about 5.0% on average. June’s figure was itself revised upward from 630,000 to 678,000 in this release. For US-based investors comparing this to, say, the more revision-light Case-Shiller Home Price Index, the takeaway is clear: treat the July print as a first draft, not a final verdict, until the September 24 release brings August data and further revisions.
在庫は着実に積み上がり、供給9.6ヶ月へ
What’s Happening on the Supply Side
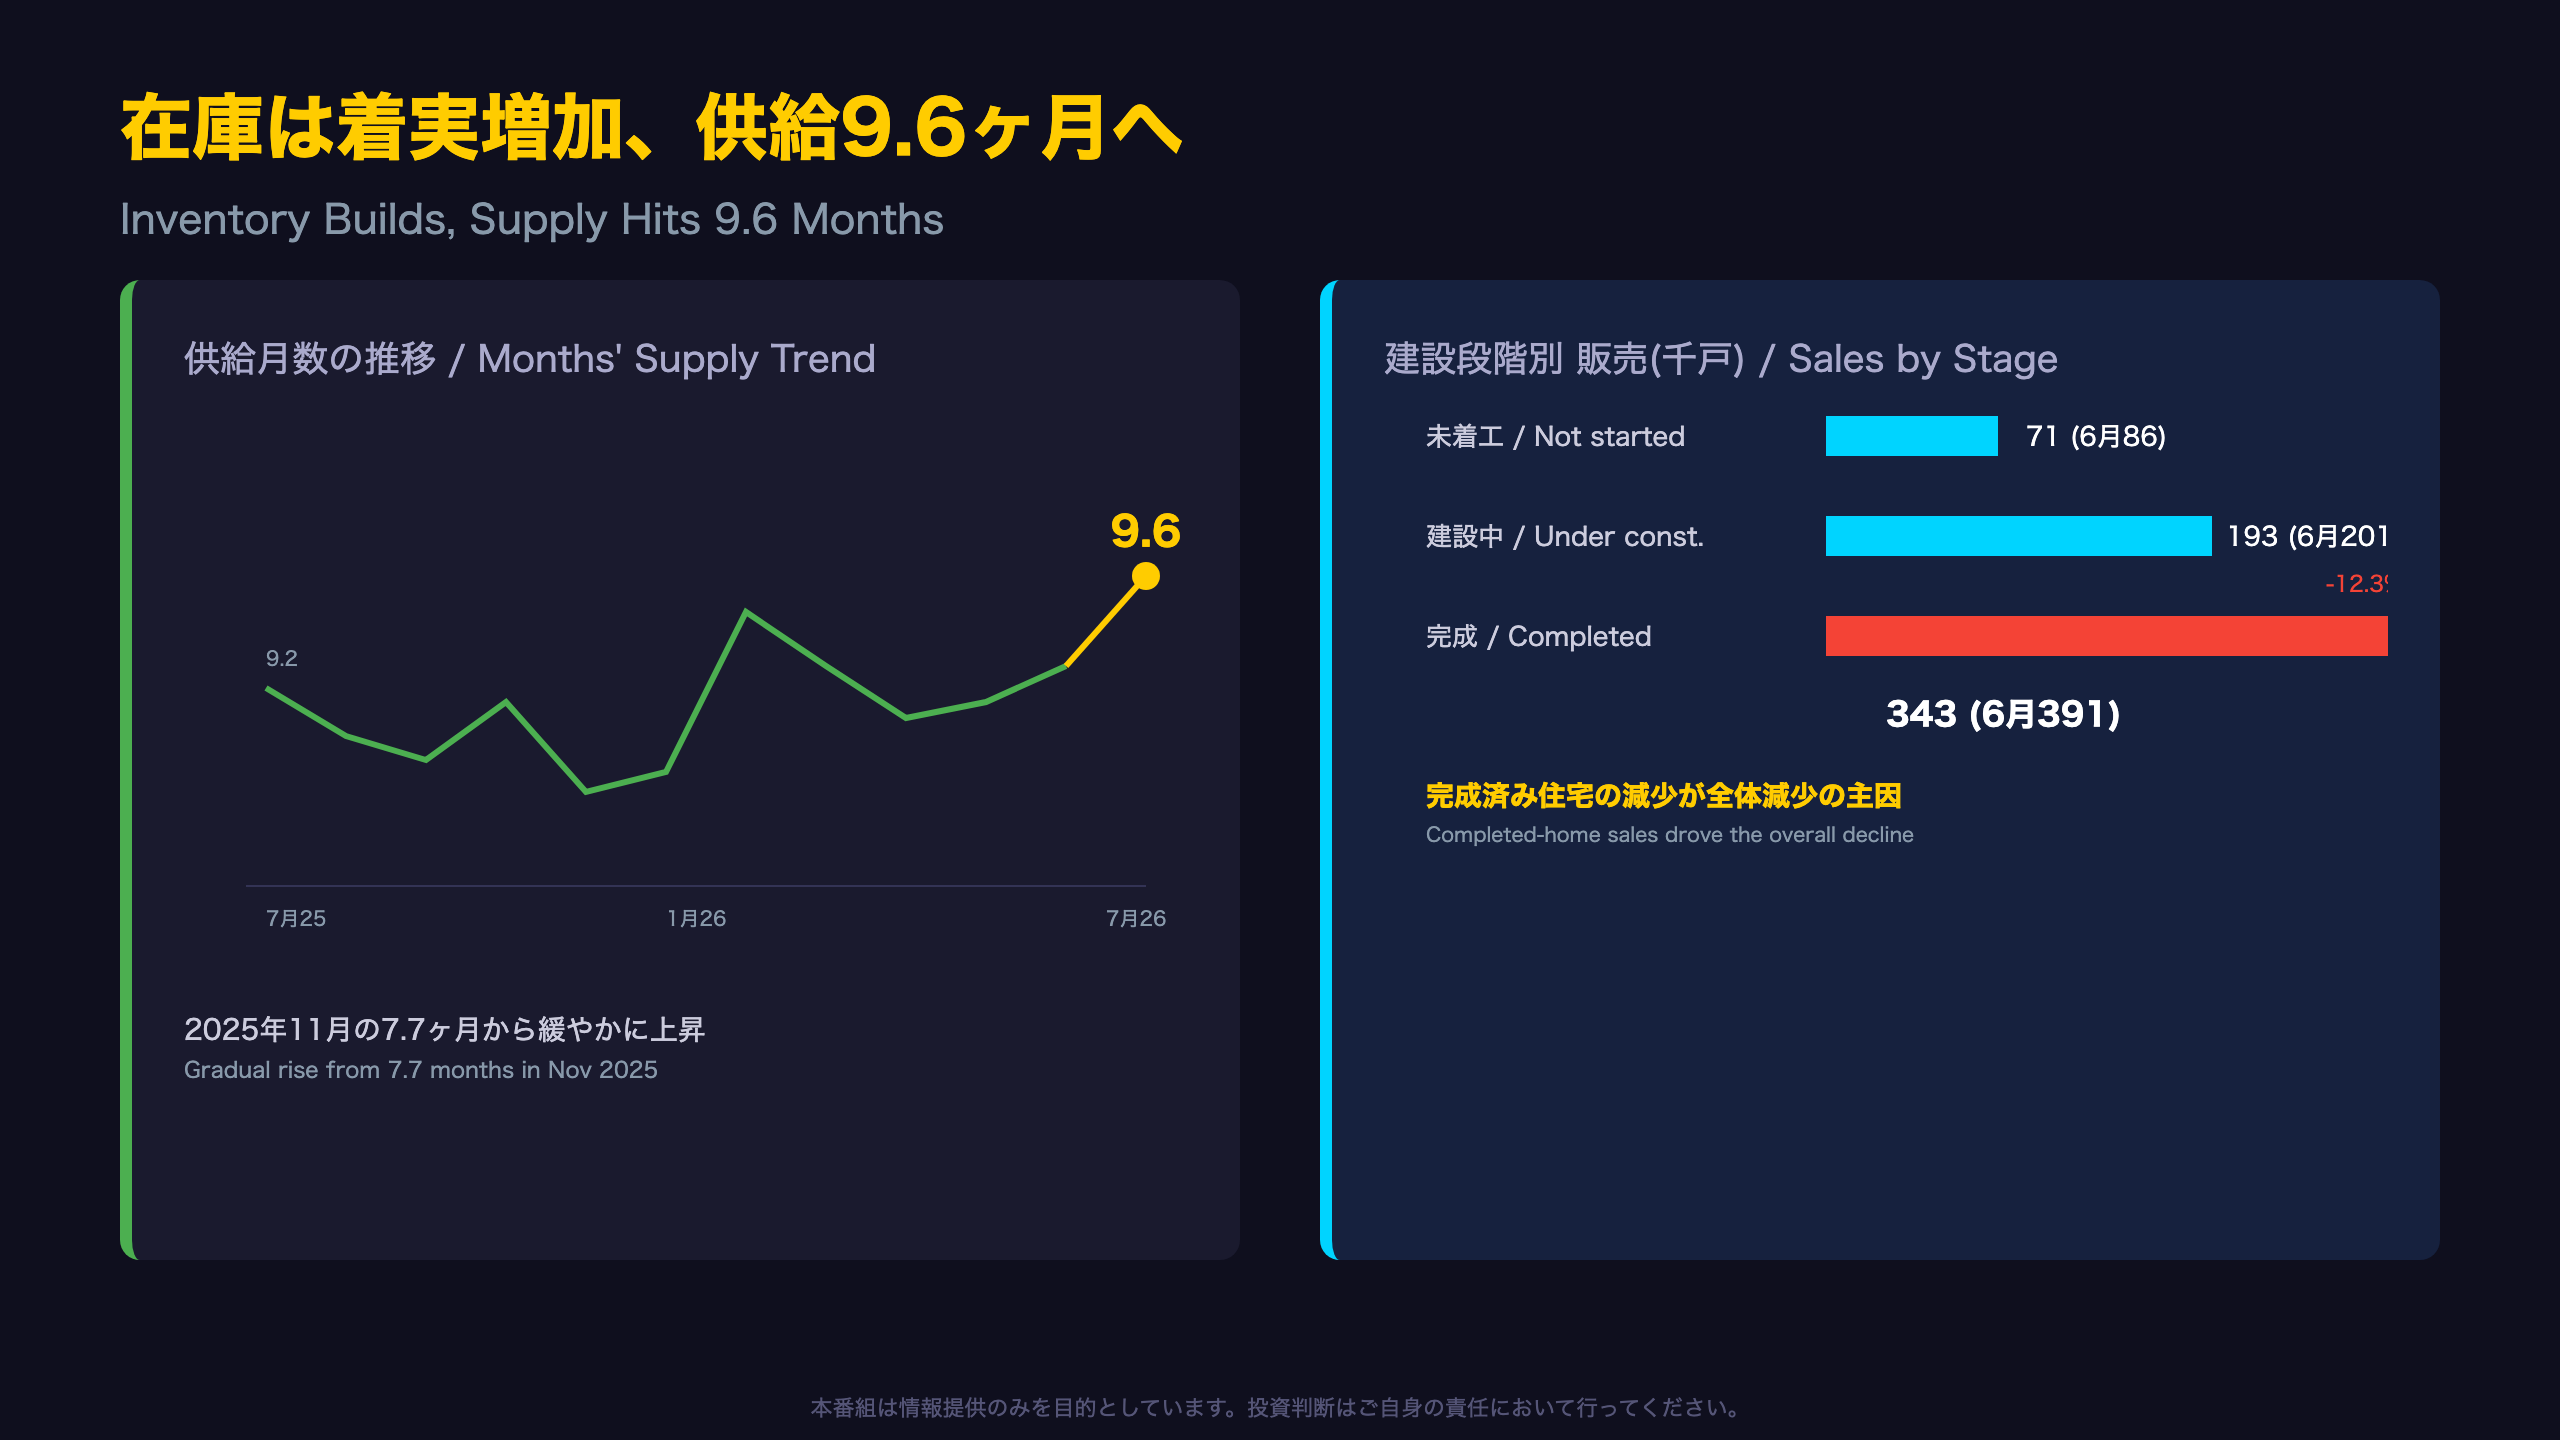
The rise in inventory to 488,000 units (+1.9% MoM, ±1.2%) stands out as one of the report’s few statistically confirmed data points. Months’ supply climbed to 9.6 — modestly above the 9.2 level seen a year earlier in July 2025, and the highest reading in over a year.
Breakdown by Construction Stage (SAAR, thousands)
| Stage | June | July |
|---|---|---|
| Not started | 86 | 71 |
| Under construction | 201 | 193 |
| Completed | 391 | 343 |
The drop in completed-home sales (down 48,000, or -12.3% MoM) was the single largest driver of the overall sales decline — a detail the headline figure alone doesn’t reveal.
A Curious Inventory Twist
Seasonally adjusted completed inventory rose modestly from 114,000 to 117,000 units. Yet the not-seasonally-adjusted median months-for-sale (time from completion to sale) actually shortened from 3.5 to 3.2 months. In other words: completed stock is building up, but what does sell is moving slightly faster — a seemingly contradictory signal. Still, 3.2 months remains meaningfully longer than the 2.6 months recorded a year ago, suggesting the broader trend toward longer selling times hasn’t reversed.
For context, U.S. housing analysts commonly cite 5-6 months’ supply as a rough equilibrium level for new homes. At 9.6 months, the market is running well above that threshold — a structural signal of a buyer’s market that homebuilders (and by extension, builder stocks and mortgage-rate-sensitive sectors) will need to navigate through pricing incentives and rate buydowns.
地域別格差 — 中西部の急落は「本物」
Regional Data Hides the Real Signal
While the national headline is statistically inconclusive, regional breakdowns reveal one genuinely confirmed shift.
The Midwest: The Only Confirmed Decline
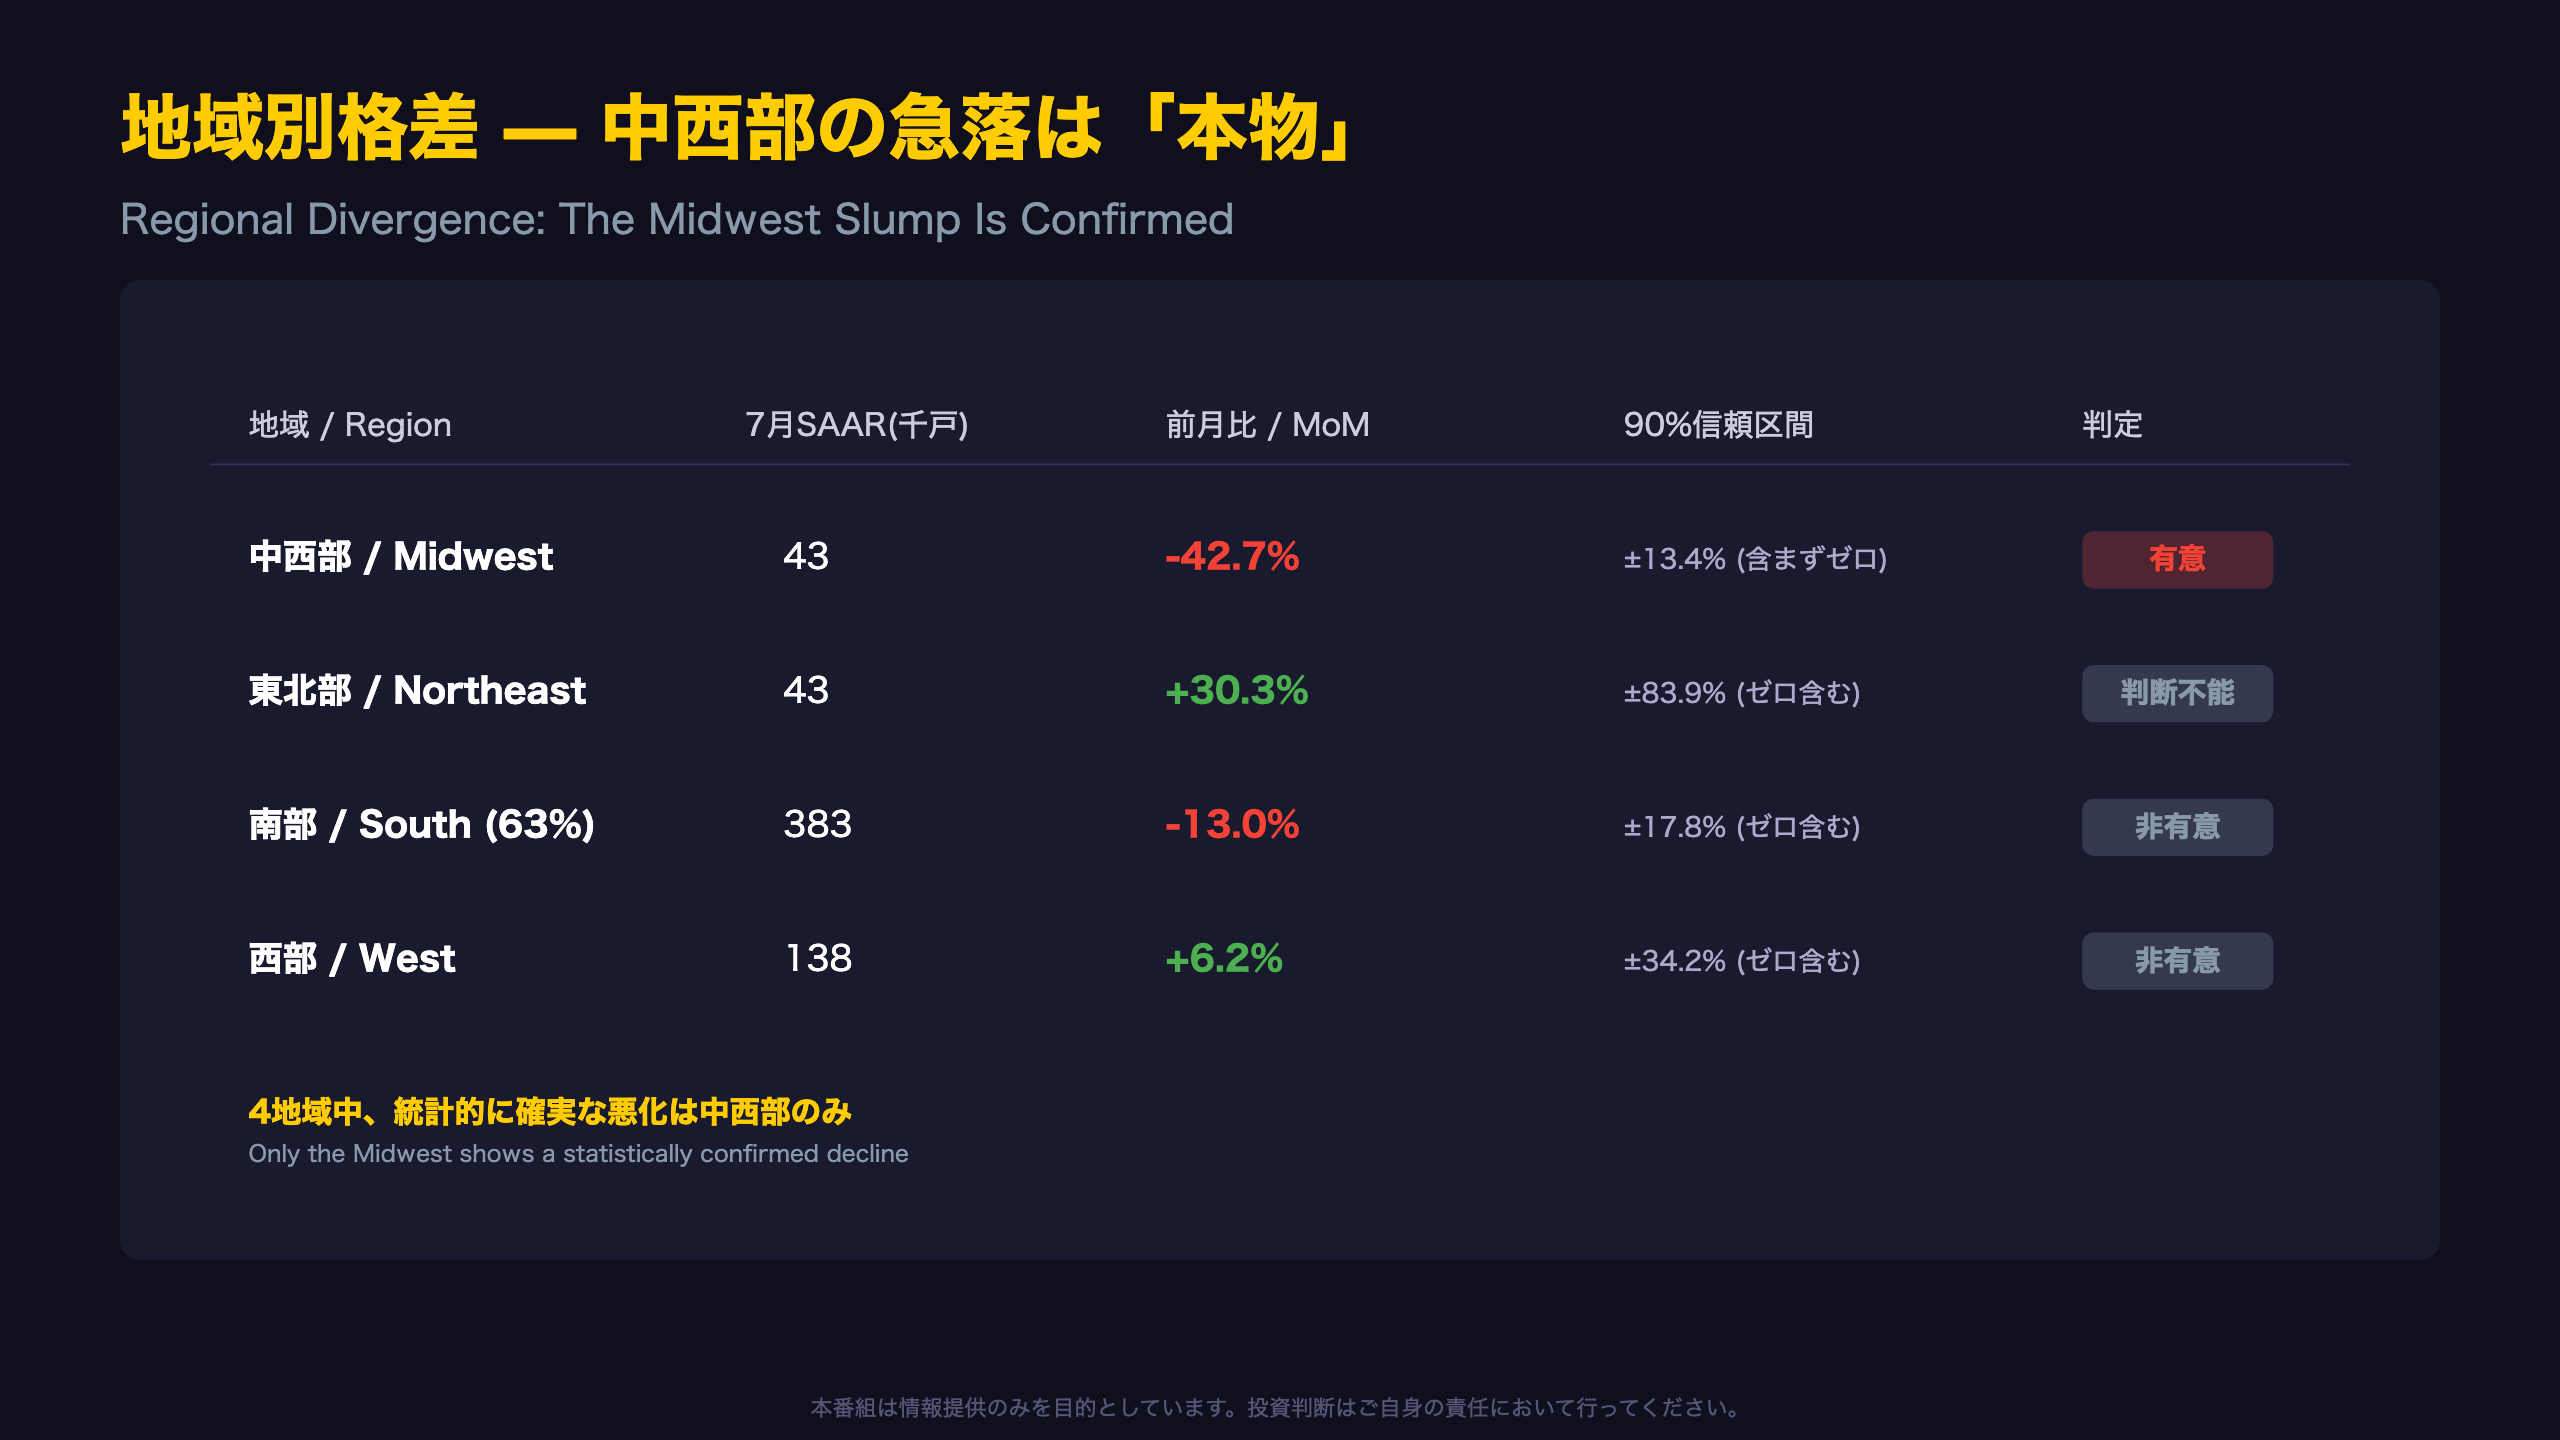
Midwest new home sales (SAAR) fell from 75,000 in June to 43,000 in July, a 42.7% drop with a ±13.4% confidence interval — a range of -56.1% to -29.3% that does not touch zero. Year-over-year, the region is down 50.6% (±10.6%), also confirmed. Among all four census regions, the Midwest is the sole area showing a statistically verified downturn, a distinction that matters for investors trying to separate signal from noise in a report otherwise dominated by non-significant swings.
The Northeast: A Surge Too Noisy to Trust
The Northeast rose from 33,000 to 43,000 units (+30.3%), but its confidence interval of ±83.9% is exceptionally wide — a reminder that the Northeast has the smallest sample size of the four regions, making month-to-month readings inherently volatile. The year-over-year figure of +95.5% (±147.3%) is even less reliable, with the lower bound of the range dipping into negative territory.
The South: America’s Largest New-Home Market Holds Steady
Accounting for roughly 63% of national sales, the South fell from 440,000 to 383,000 units (-13.0%, ±17.8%) — a large dollar-value move, but statistically inconclusive.
The West: A Modest, Unconfirmed Gain
The West edged up from 130,000 to 138,000 (+6.2%, ±34.2%), also within the margin of error.
For U.S. homebuilder investors (think D.R. Horton, Lennar, PulteGroup — all with meaningful Midwest and Sun Belt exposure), this regional lens matters more than the national print: only the Midwest downturn currently clears the bar of statistical confidence.
中央値↓平均値↑ のねじれと価格帯シフト
Why Median and Average Prices Diverged
The divergence between the median price ($393,800, -2.3%) and average price ($508,800, +4.1%) is a textbook signature of a price-mix shift — though neither change clears the statistical significance bar, so this reading should be treated as suggestive rather than conclusive.
Price Distribution Shift (Not Seasonally Adjusted, Table 2b)
| Price Bracket | June | July |
|---|---|---|
| Under $300K | 21% | 19% |
| $300K-$400K | 28% | 34% |
| $400K-$500K | 19% | 18% |
| $500K-$600K | 14% | 10% |
| $600K-$800K | 9% | 11% |
| $800K-$1M | 3% | 3% |
| $1M+ | 6% | 5% |
The $300K-$400K bracket expanded to become the single largest volume segment at 34%. But it’s worth noting that total unit sales (not seasonally adjusted) fell from 59,000 to 50,000 units — so this is a shift in relative composition within a shrinking pie, not an absolute surge in mid-tier demand.
The Fed/CPI Connection
Unlike the Consumer Price Index’s Owners’ Equivalent Rent component (which the Fed watches closely for inflation signals), new home sale prices are not seasonally smoothed for compositional effects in the same rigorous way. As the report’s own explanatory notes state: “Changes in sales price data reflect changes in the distribution of houses by region, size, etc., as well as changes in the prices of houses with identical characteristics.” In plain terms: a falling median price doesn’t necessarily mean builders are cutting prices — it may simply mean more mid-tier homes sold relative to entry-level ones.
Both median and average price series carry an average RSE of just 4-5%, relatively precise compared to other series in this release, but the month-over-month directional split is still not one to over-interpret as a single data point.
住宅市場とFRB政策への含意

Reading a Report That Cuts Both Ways
If this report had to be summarized in one line, it would be: “the headline looks weak, but confirmed changes are narrower than the headline suggests.”
What’s Statistically Confirmed
- Inventory: 488,000 units (+1.9%, significant)
- Midwest sales: 43,000 units (-42.7%, significant)
- Completed-home sales: 343,000, down from June’s 391,000 in raw terms
What’s Not Statistically Confirmed
- National sales: 607,000 units (-10.5%, not significant)
- South region sales: 383,000 units (-13.0%, not significant)
- Median price: $393,800 (-2.3%, not significant)
The Fed Policy Connection
Housing is one of the most interest-rate-sensitive sectors of the U.S. economy and a key transmission channel the Federal Reserve watches closely. At 9.6 months, supply sits well above the commonly cited equilibrium range of 5-6 months, hinting that demand may not be keeping pace with elevated mortgage rates, allowing inventory to build. That said, this is a single-month statistical signal, not strong enough evidence on its own to move the needle on the Fed’s rate-cut trajectory — investors watching Fed funds futures or the 10-year Treasury for housing-driven cues should treat this release as one data point among many, not a standalone catalyst.
The Census Bureau states plainly: “The August report is scheduled for release on September 24, 2026.”
What to Watch Next
- Whether the Midwest weakness persists into August (recall: trend confirmation requires four months of data)
- Whether months’ supply climbs into double digits
- The direction of revisions to the June and July figures (historically averaging about 5.0%)
For investors tracking U.S. homebuilders (Lennar, D.R. Horton, PulteGroup) or mortgage-rate-sensitive assets, the lesson from this release is clear: check the confidence intervals and regional/construction-stage breakdowns before reacting to the topline number alone.
Disclaimer: This article is for informational purposes only. All investment decisions are made solely at your own risk.







