📺 Watch the Full Video Analysis
This article was automatically generated by the NFC Market Live AI analysis system. (Updated: 2026-08-22 21:46 JST)
📄 Primary Source
米国労働省(DOL)— 新規失業保険申請件数
https://www.dol.gov/newsroom/releases/eta/eta20260820
米国エネルギー情報局(EIA)— 週間石油状況レポート
https://www.eia.gov/petroleum/supply/weekly/pdf/highlights.pdf
連邦準備制度理事会(FRB)— H.4.1 バランスシート
https://www.federalreserve.gov/releases/h41/current/h41.htm
📊 This week’s top 3 U.S. macro releases, explained.
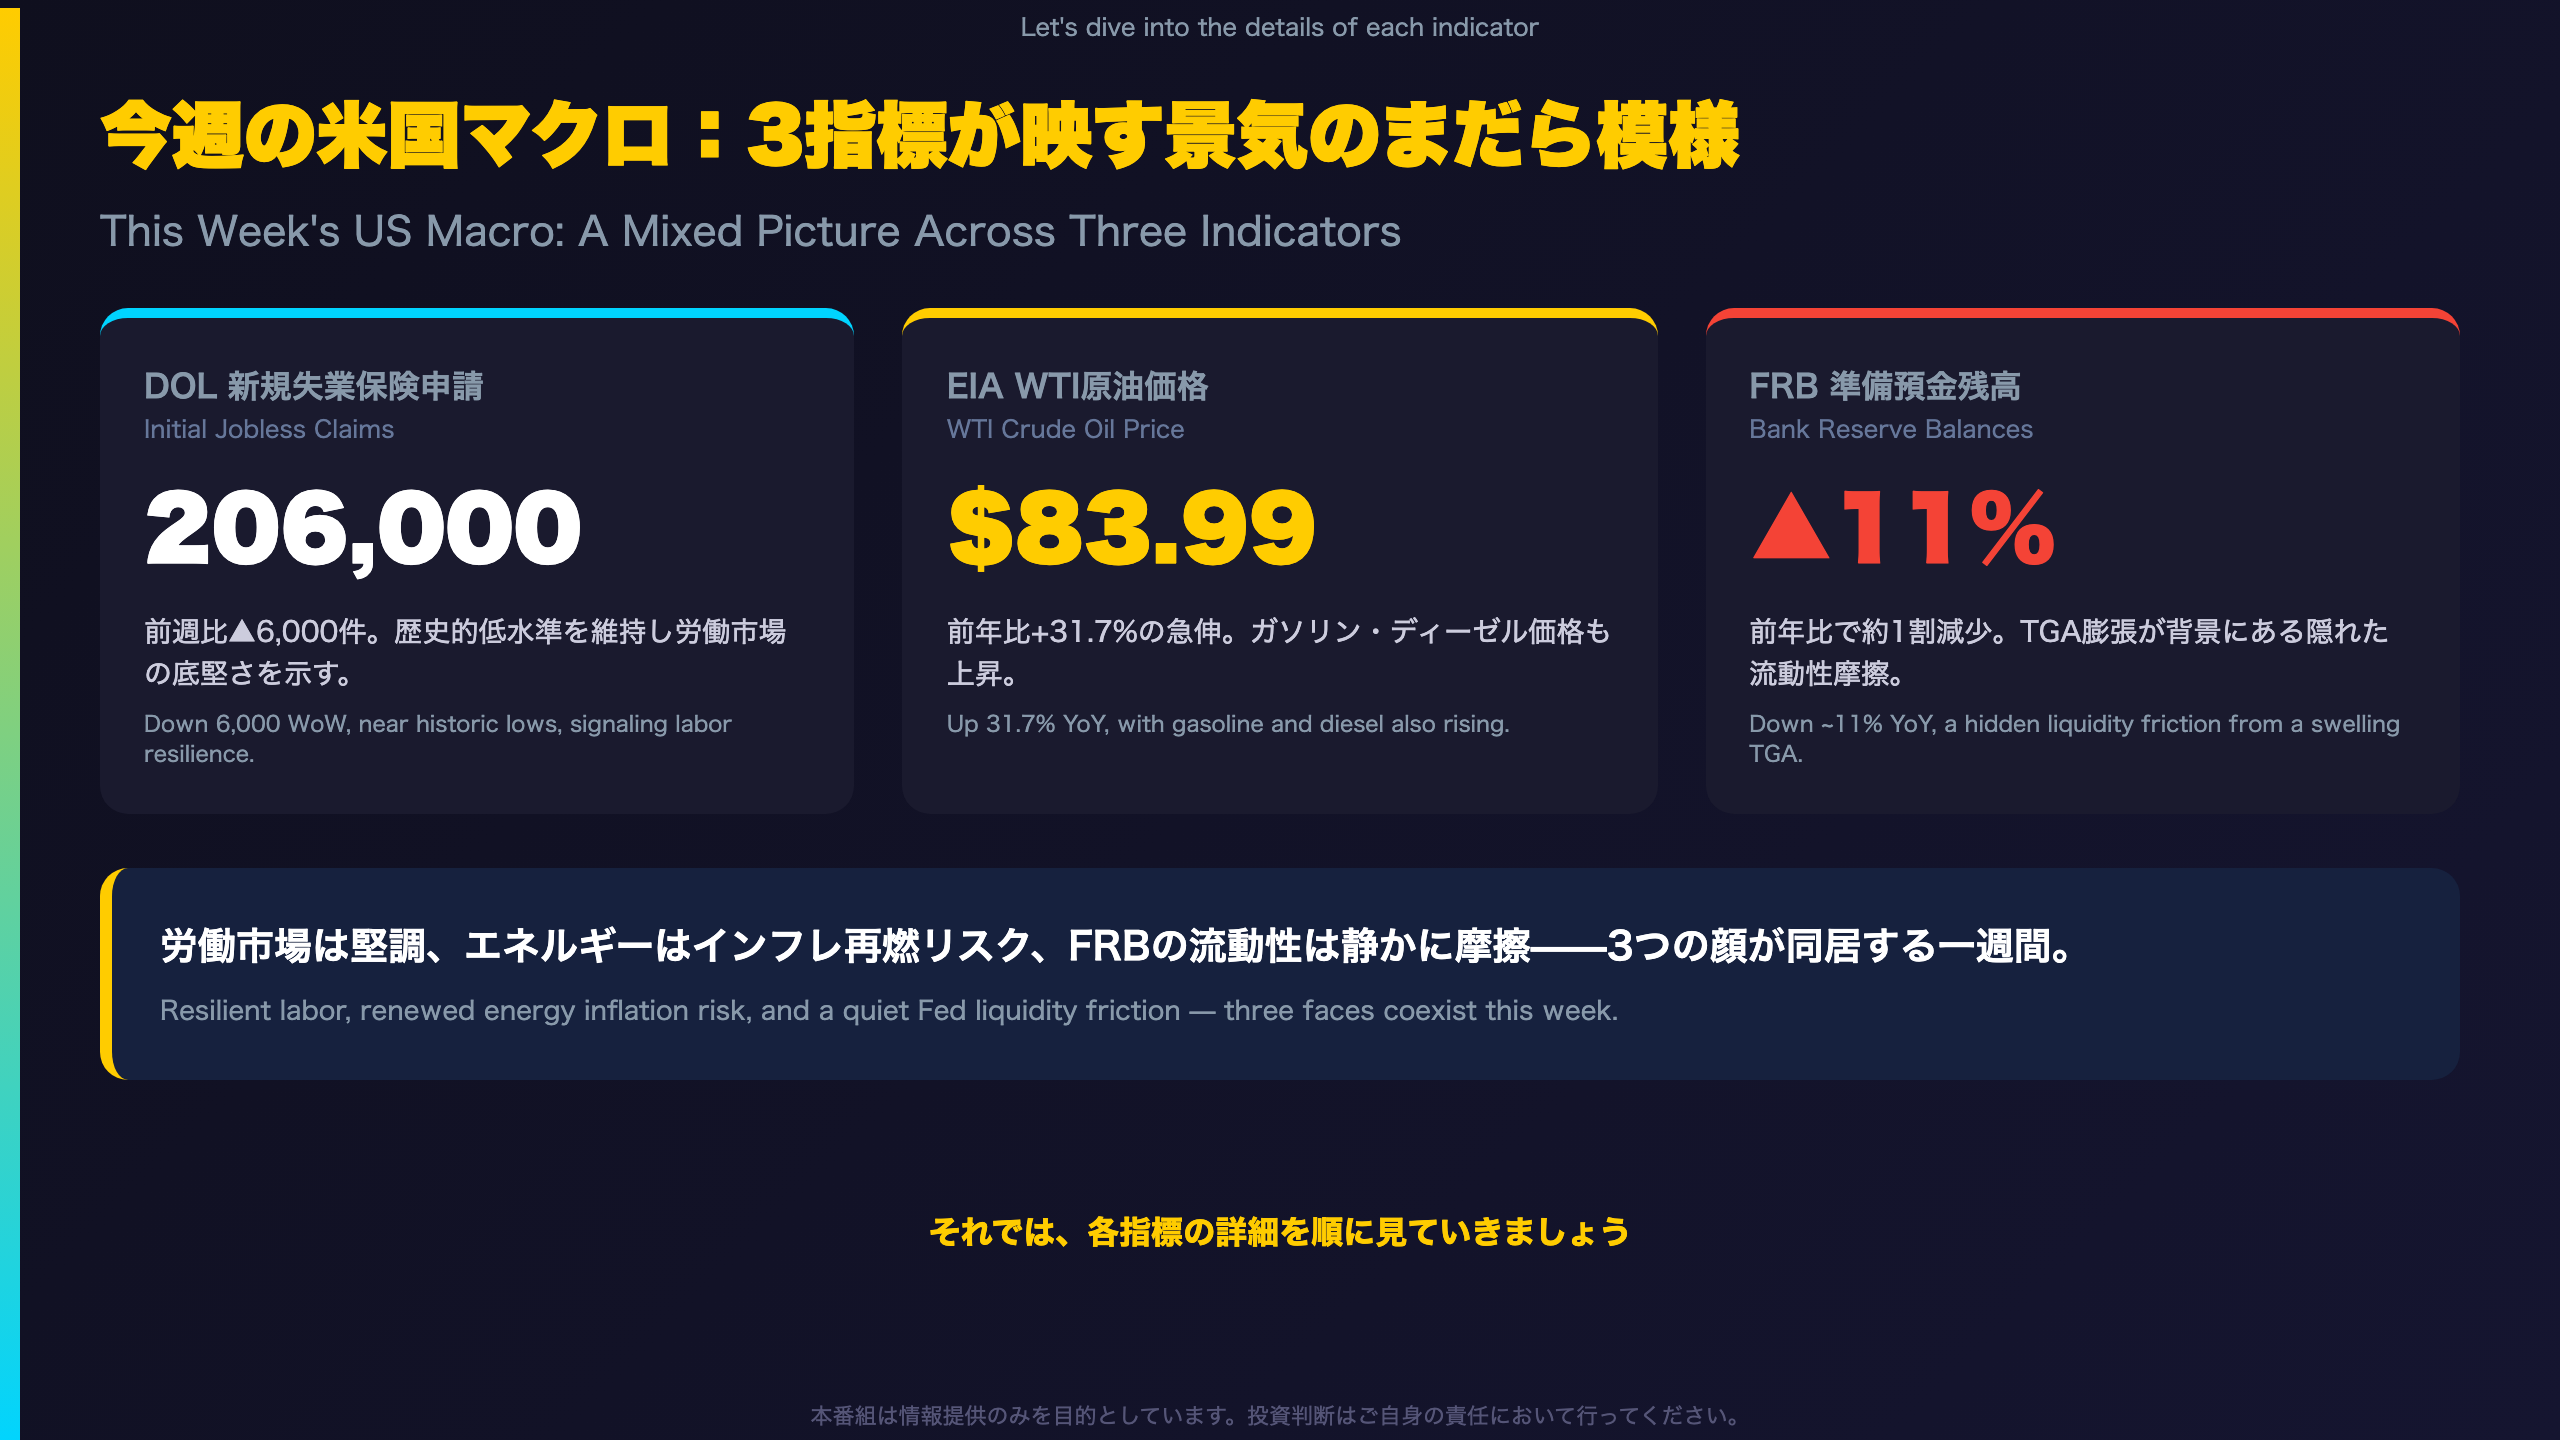
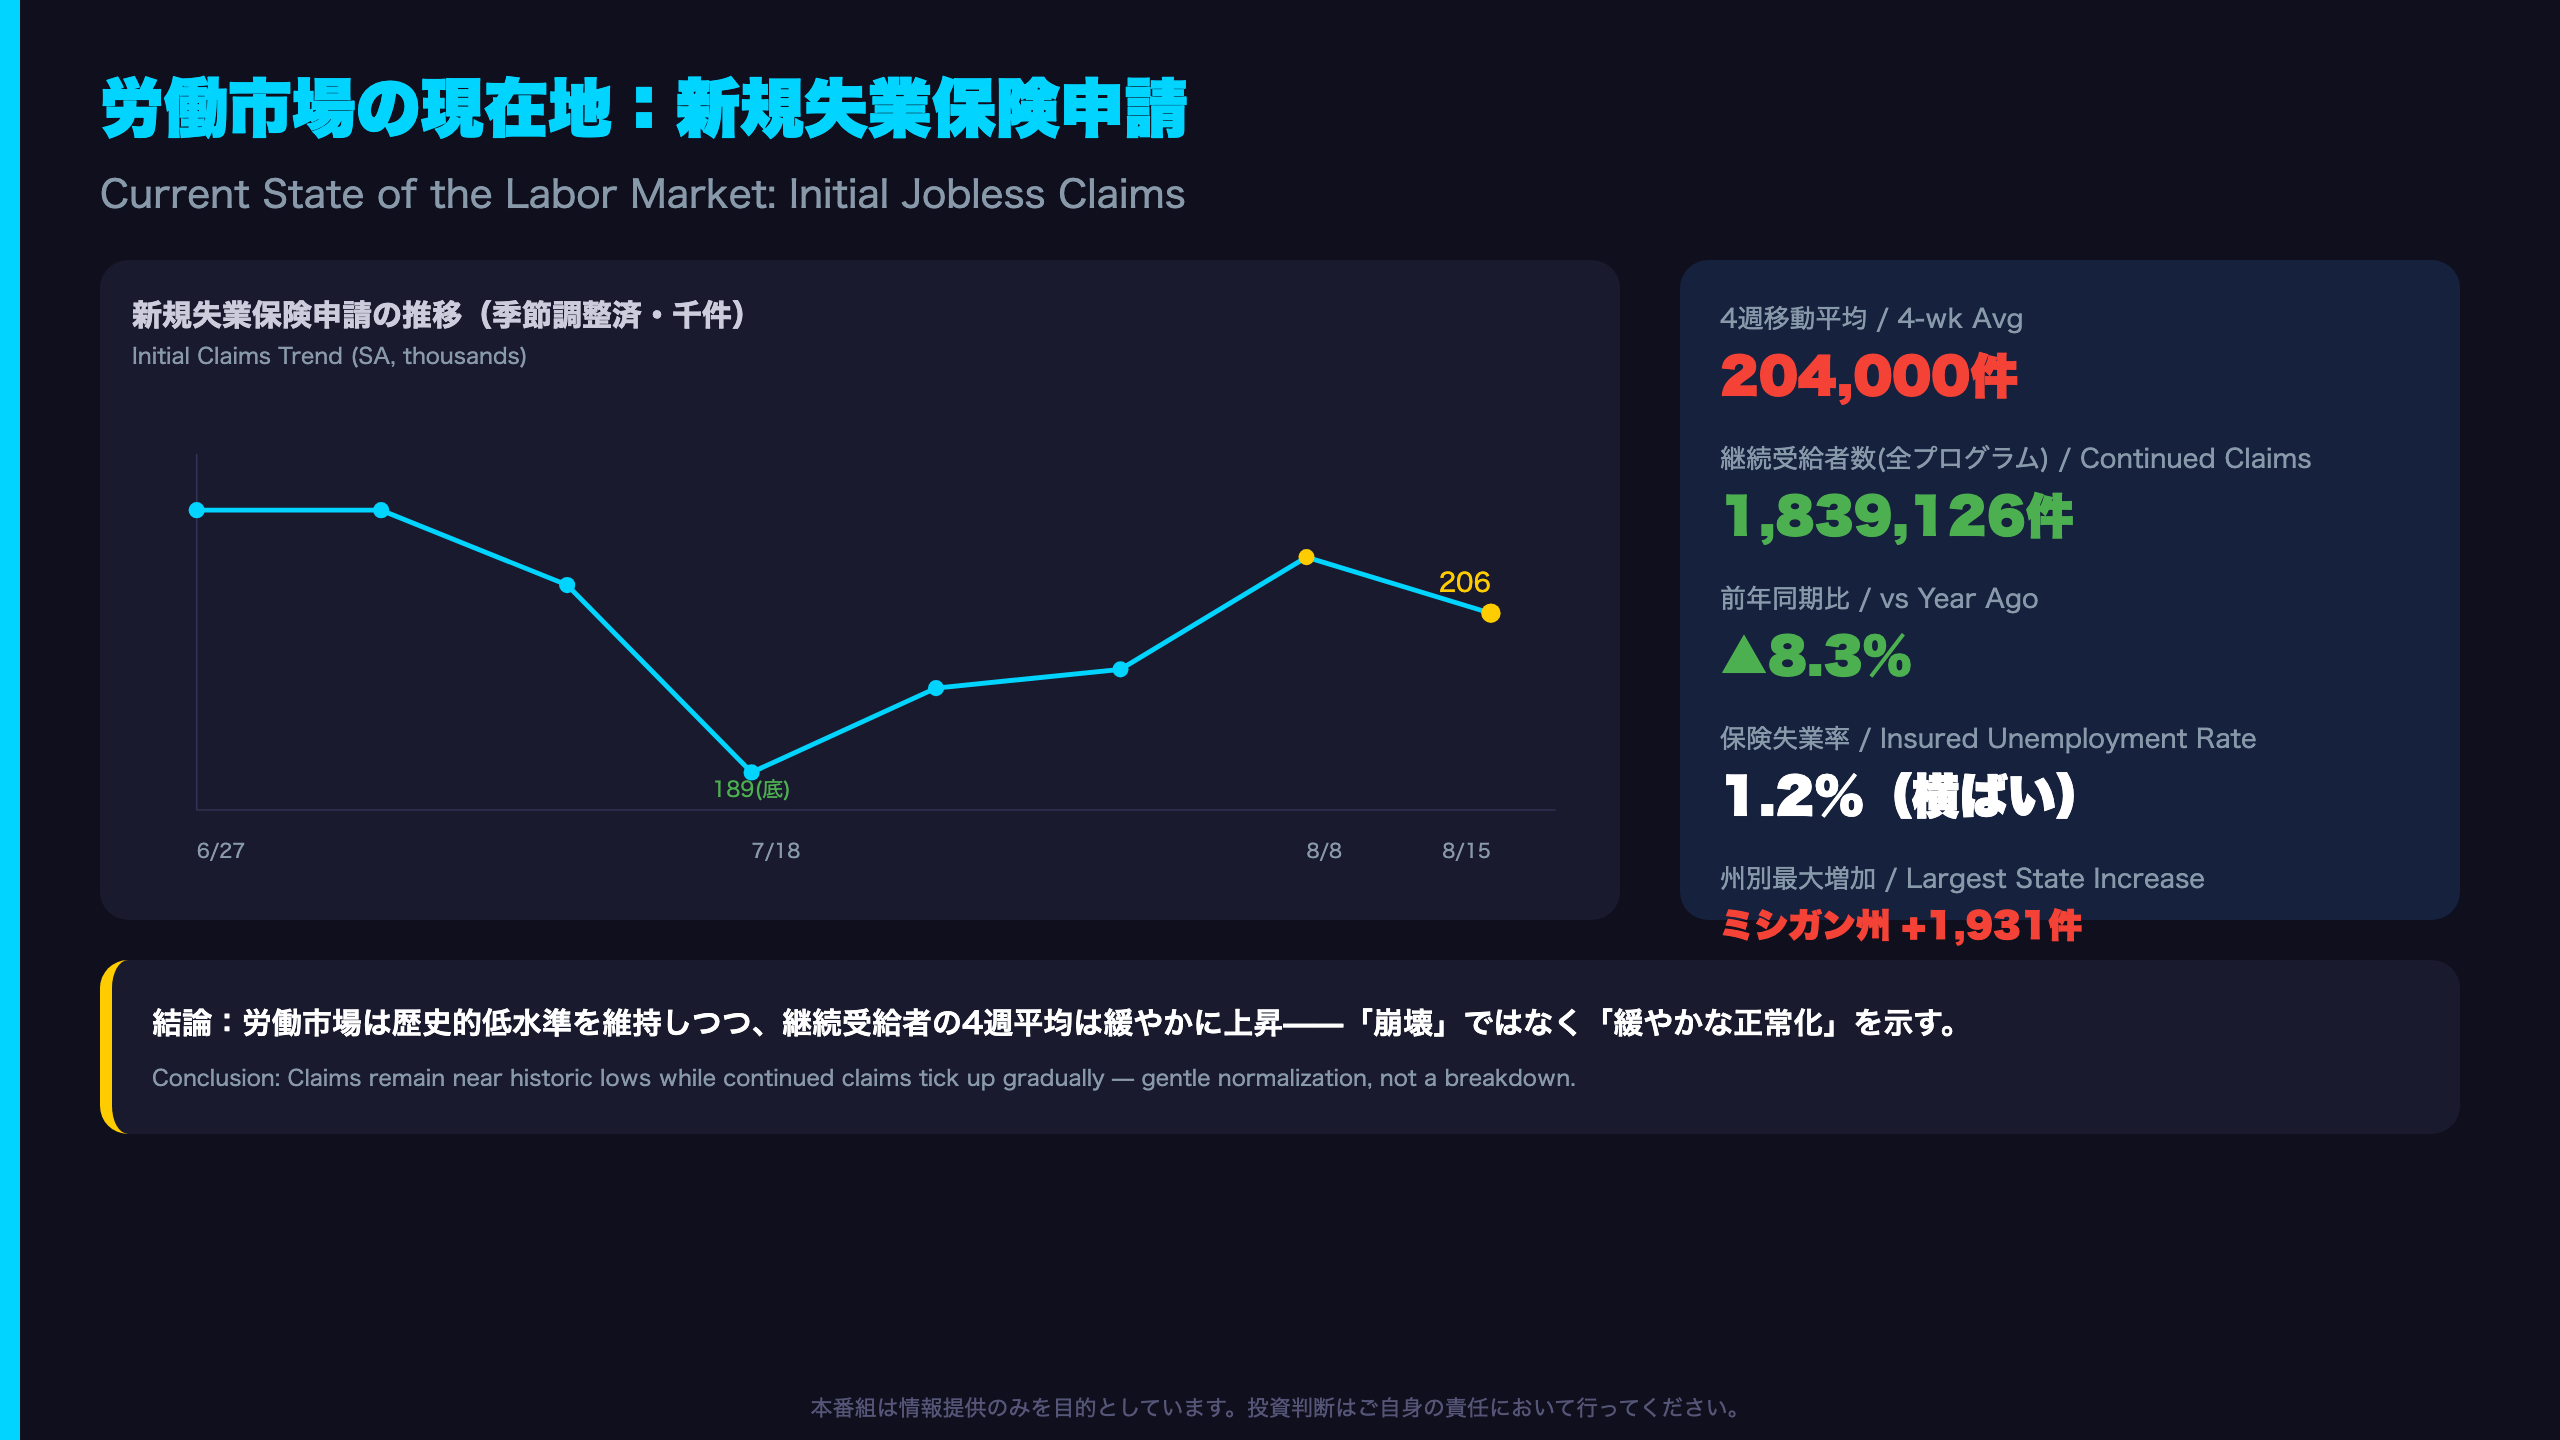
💼 DOL initial jobless claims held near historic lows at 206K, signaling labor market resilience
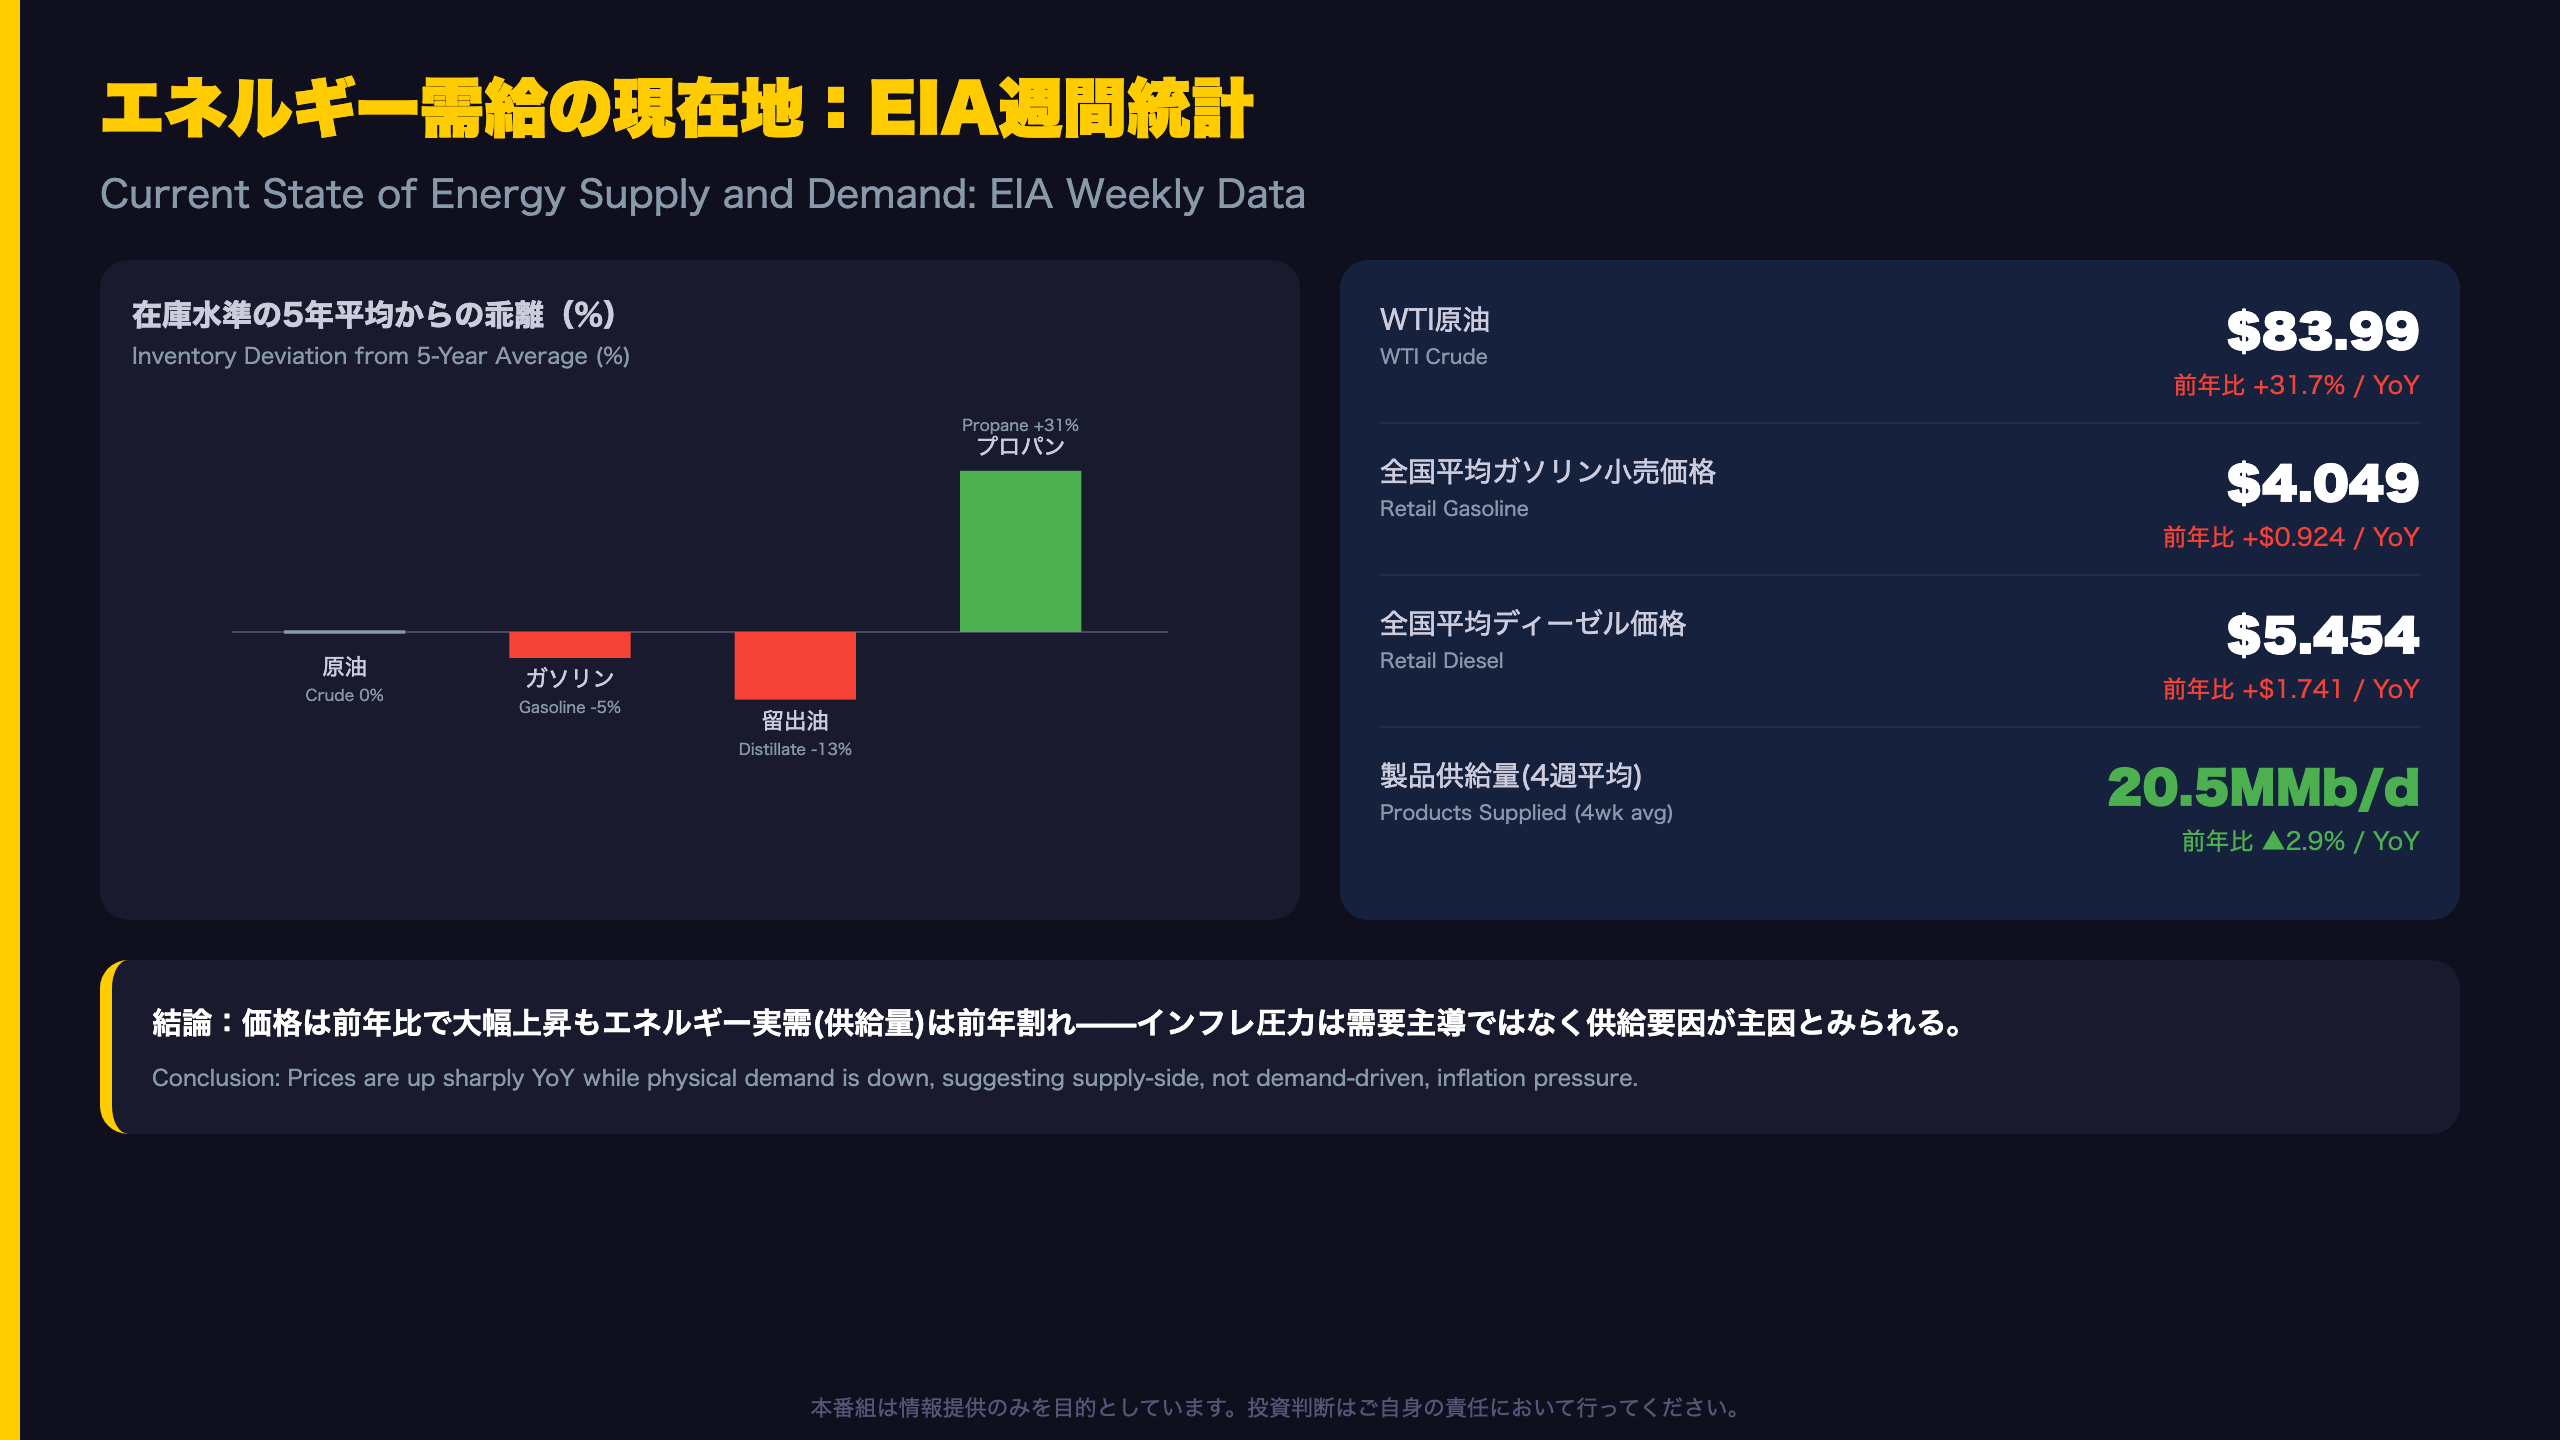
⛽ WTI crude jumped to $83.99/bbl, up 31.7% YoY, with gasoline and diesel prices also rising
🏦 The Fed’s securities holdings rose YoY, hinting QT has paused, even as bank reserves fell ~11% YoY amid a swelling Treasury General Account
Labor, energy, and liquidity — three lenses on the U.S. economy, plus next week’s key catalysts.
今週のアルティメット・サマリー
Three Weekly Gauges, One Week
Each week, three separate U.S. releases offer a composite read on the economy. The Department of Labor’s jobless claims report measures labor market temperature; the EIA’s petroleum status report captures energy supply/demand and the price channel feeding into CPI; and the Fed’s H.4.1 release tracks the size of the central bank’s balance sheet — the plumbing of the financial system.
Why It Matters Internationally
For readers less familiar with H.4.1, it is the weekly, granular version of quantitative tightening (QT) — the process of shrinking the Fed’s bond holdings built up during pandemic-era QE. This week, securities held outright actually rose year-over-year, a technical hint that QT may have effectively paused, echoing debates at the ECB over balance sheet normalization.
Market Implications
Resilient labor data alongside a 31.7% year-over-year jump in WTI crude complicates the Fed’s inflation-versus-growth calculus. Bond markets may focus on declining bank reserves, while commodity desks watch crude’s renewed upward momentum. With the report’s own regime model flagging statistical anomalies but no outright transition, a ‘monitor, don’t overreact’ stance looks appropriate heading into next week.
労働市場の現在地(DOL詳細)
Context: What Are Jobless Claims?
The DOL’s weekly initial claims report is one of the most closely watched high-frequency U.S. labor indicators — comparable to weekly unemployment filings in the UK’s Claimant Count, though reported far more frequently. Economists treat the four-week moving average as the cleaner signal, since weekly figures are volatile and difficult to seasonally adjust.
Sub-Indicator Detail
State-level data this week showed New York explicitly citing layoffs in professional/scientific/technical services, construction, and healthcare — a rare instance of a state attributing job losses to specific industries. Michigan’s increase, by contrast, came with no stated cause.
Two Readings
Bears will note continued claims’ four-week average has now risen for two straight periods. Bulls will counter that continued claims remain 8.3% below year-ago levels, arguing the labor market is tighter than a year ago, not looser.
Market Implications
For a Fed data-watching market, claims near historic lows keep rate-cut urgency low, while insured unemployment’s slight uptick provides ammunition for doves. The next release lands August 27; watch whether the four-week average clearly breaks above 210,000.
エネルギー需給の現在地(EIA詳細)
Understanding the EIA Weekly Report
The EIA’s Weekly Petroleum Status Report is the U.S. equivalent of the API inventory data watched globally, and its five-year seasonal averages provide crucial context that raw weekly numbers lack. This week’s data reveals a striking divergence: crude stocks matched the five-year average, while distillate (diesel/heating oil) inventories sit roughly 13% below normal — the tightest balance among major products.
Direct Quote
The report states: “Distillate fuel inventories decreased by 1.5 million barrels last week and are about 13% below the five-year average for this time of year.”
Two Readings
Inflation hawks will point to WTI’s 31.7% year-over-year surge and retail gasoline’s nearly 30% rise as fresh CPI risk. Inflation doves will counter that four-week average products supplied fell 2.9% year-over-year — implying softer physical demand, meaning higher prices reflect supply constraints rather than an overheating economy.
Market Implications
For global energy traders, the distillate shortfall ahead of the autumn refinery maintenance season and winter heating demand is the key threshold to watch. The next EIA release is due August 26.
FRB流動性の現在地(H.4.1詳細)
What Is H.4.1, and Why It Matters
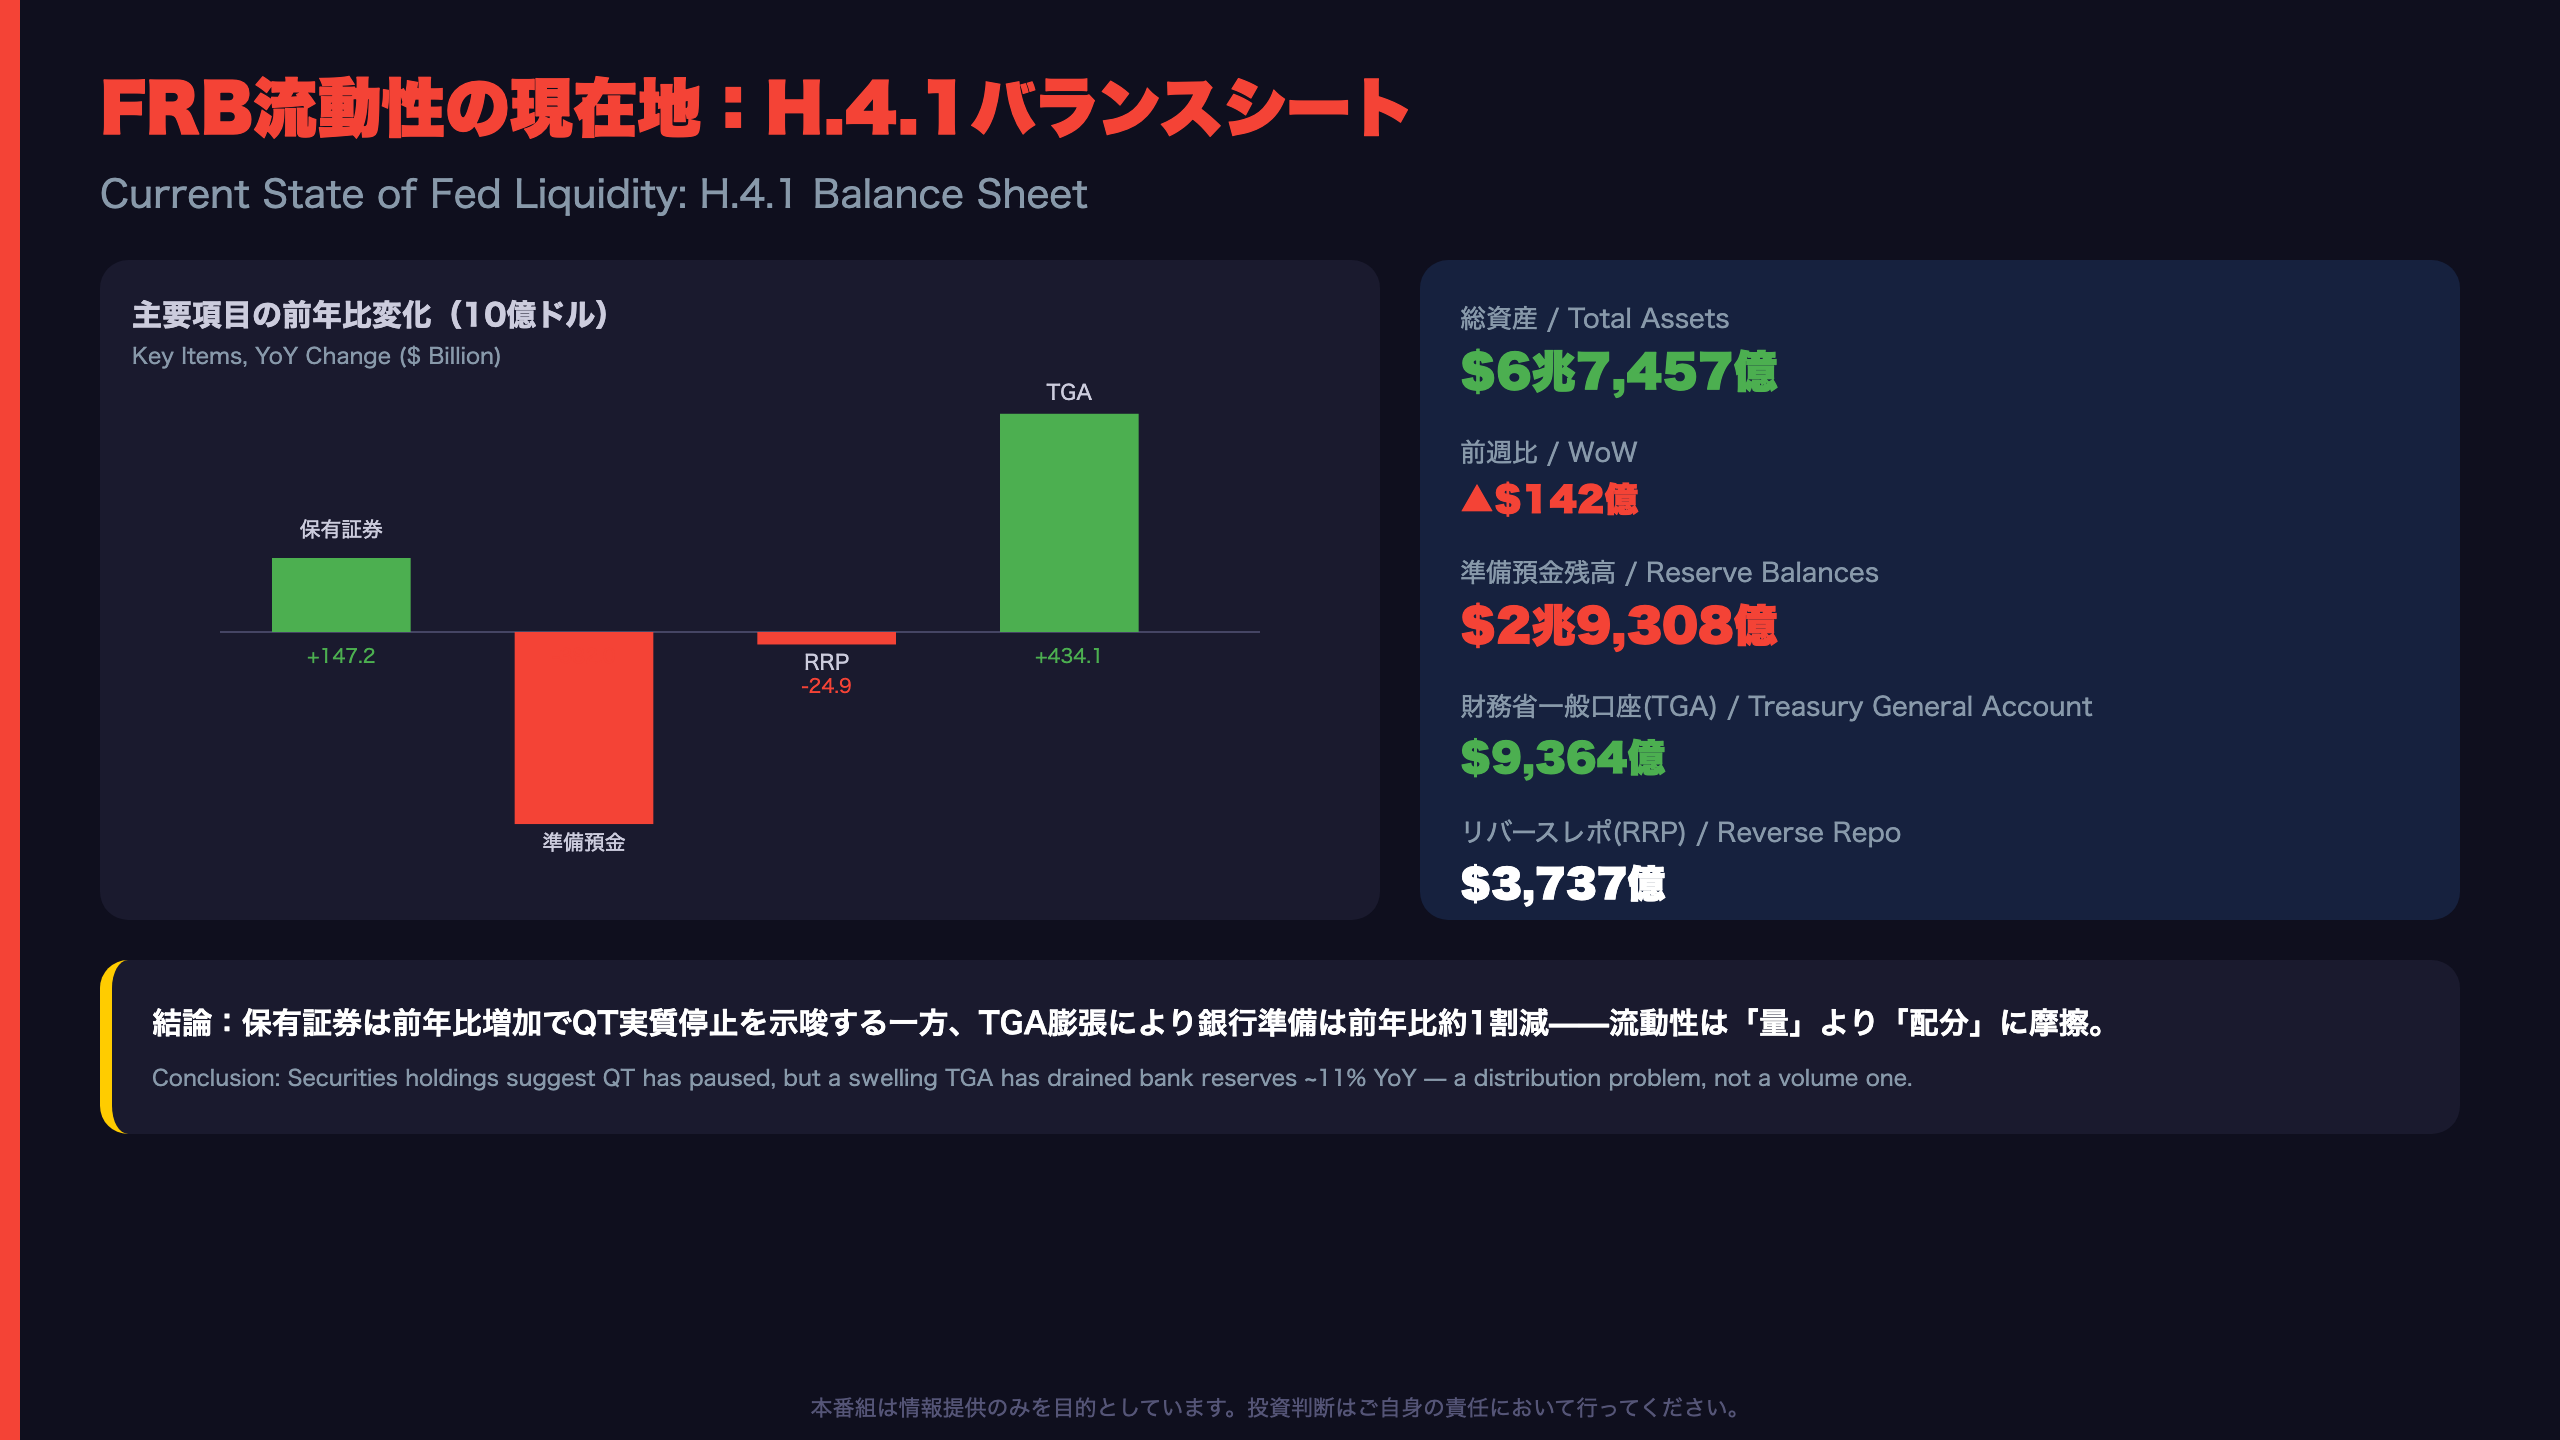
The Fed’s H.4.1 release is the weekly balance sheet statement that underpins the entire QT narrative markets have tracked since 2022. This week, securities held outright rose both week-over-week (+$5.1bn) and year-over-year (+$147.2bn) — a technical signal that QT may have effectively paused, a milestone comparable to the ECB’s own reinvestment debates.
The Hidden Liquidity Story
Despite stabilizing assets, bank reserve balances fell roughly 11% year-over-year to $2.93 trillion. The culprit: the Treasury General Account (TGA), the government’s checking account at the Fed, which stood $410.3 billion higher than a year ago. A larger TGA drains reserves from the banking system by definition — a mechanical, not policy-driven, tightening.
Two Readings
Doves see paused QT as an easing signal. Hawks counter that with reverse repo (RRP) balances well below historical peaks, there’s limited buffer left to absorb further TGA growth without repo market stress reminiscent of September 2019.
Market Implications
Watch whether TGA approaches the $1 trillion mark and whether reserves test the psychologically important $2.9 trillion level. The next H.4.1 release is due August 27.
ストラテジスト総括:3指標の連関と来週の注目シナリオ
Reading the Underlying Regime Model
Beyond the three headline reports, the accompanying weekly Hidden Markov Model (HMM) regime classification has held the same ‘R0’ regime with 100% probability for five consecutive weeks — comparable to a diffusion index showing no structural break. Yet the model’s own within-regime distance metric has crept up gradually since July, suggesting a quiet drift away from typical conditions even without a full regime change.
Anomalies Worth Watching
The largest flagged deviations are the labor force participation rate (Z=3.35) and total petroleum products supplied (Z=3.03), both well beyond the model’s 3.0 threshold for ‘significant deviation that tends to rise ahead of regime transitions,’ per the report’s own methodology note. Elevated gasoline and airfare CPI (both roughly +25% YoY) reinforce the energy-inflation narrative from the EIA data.
Two Readings
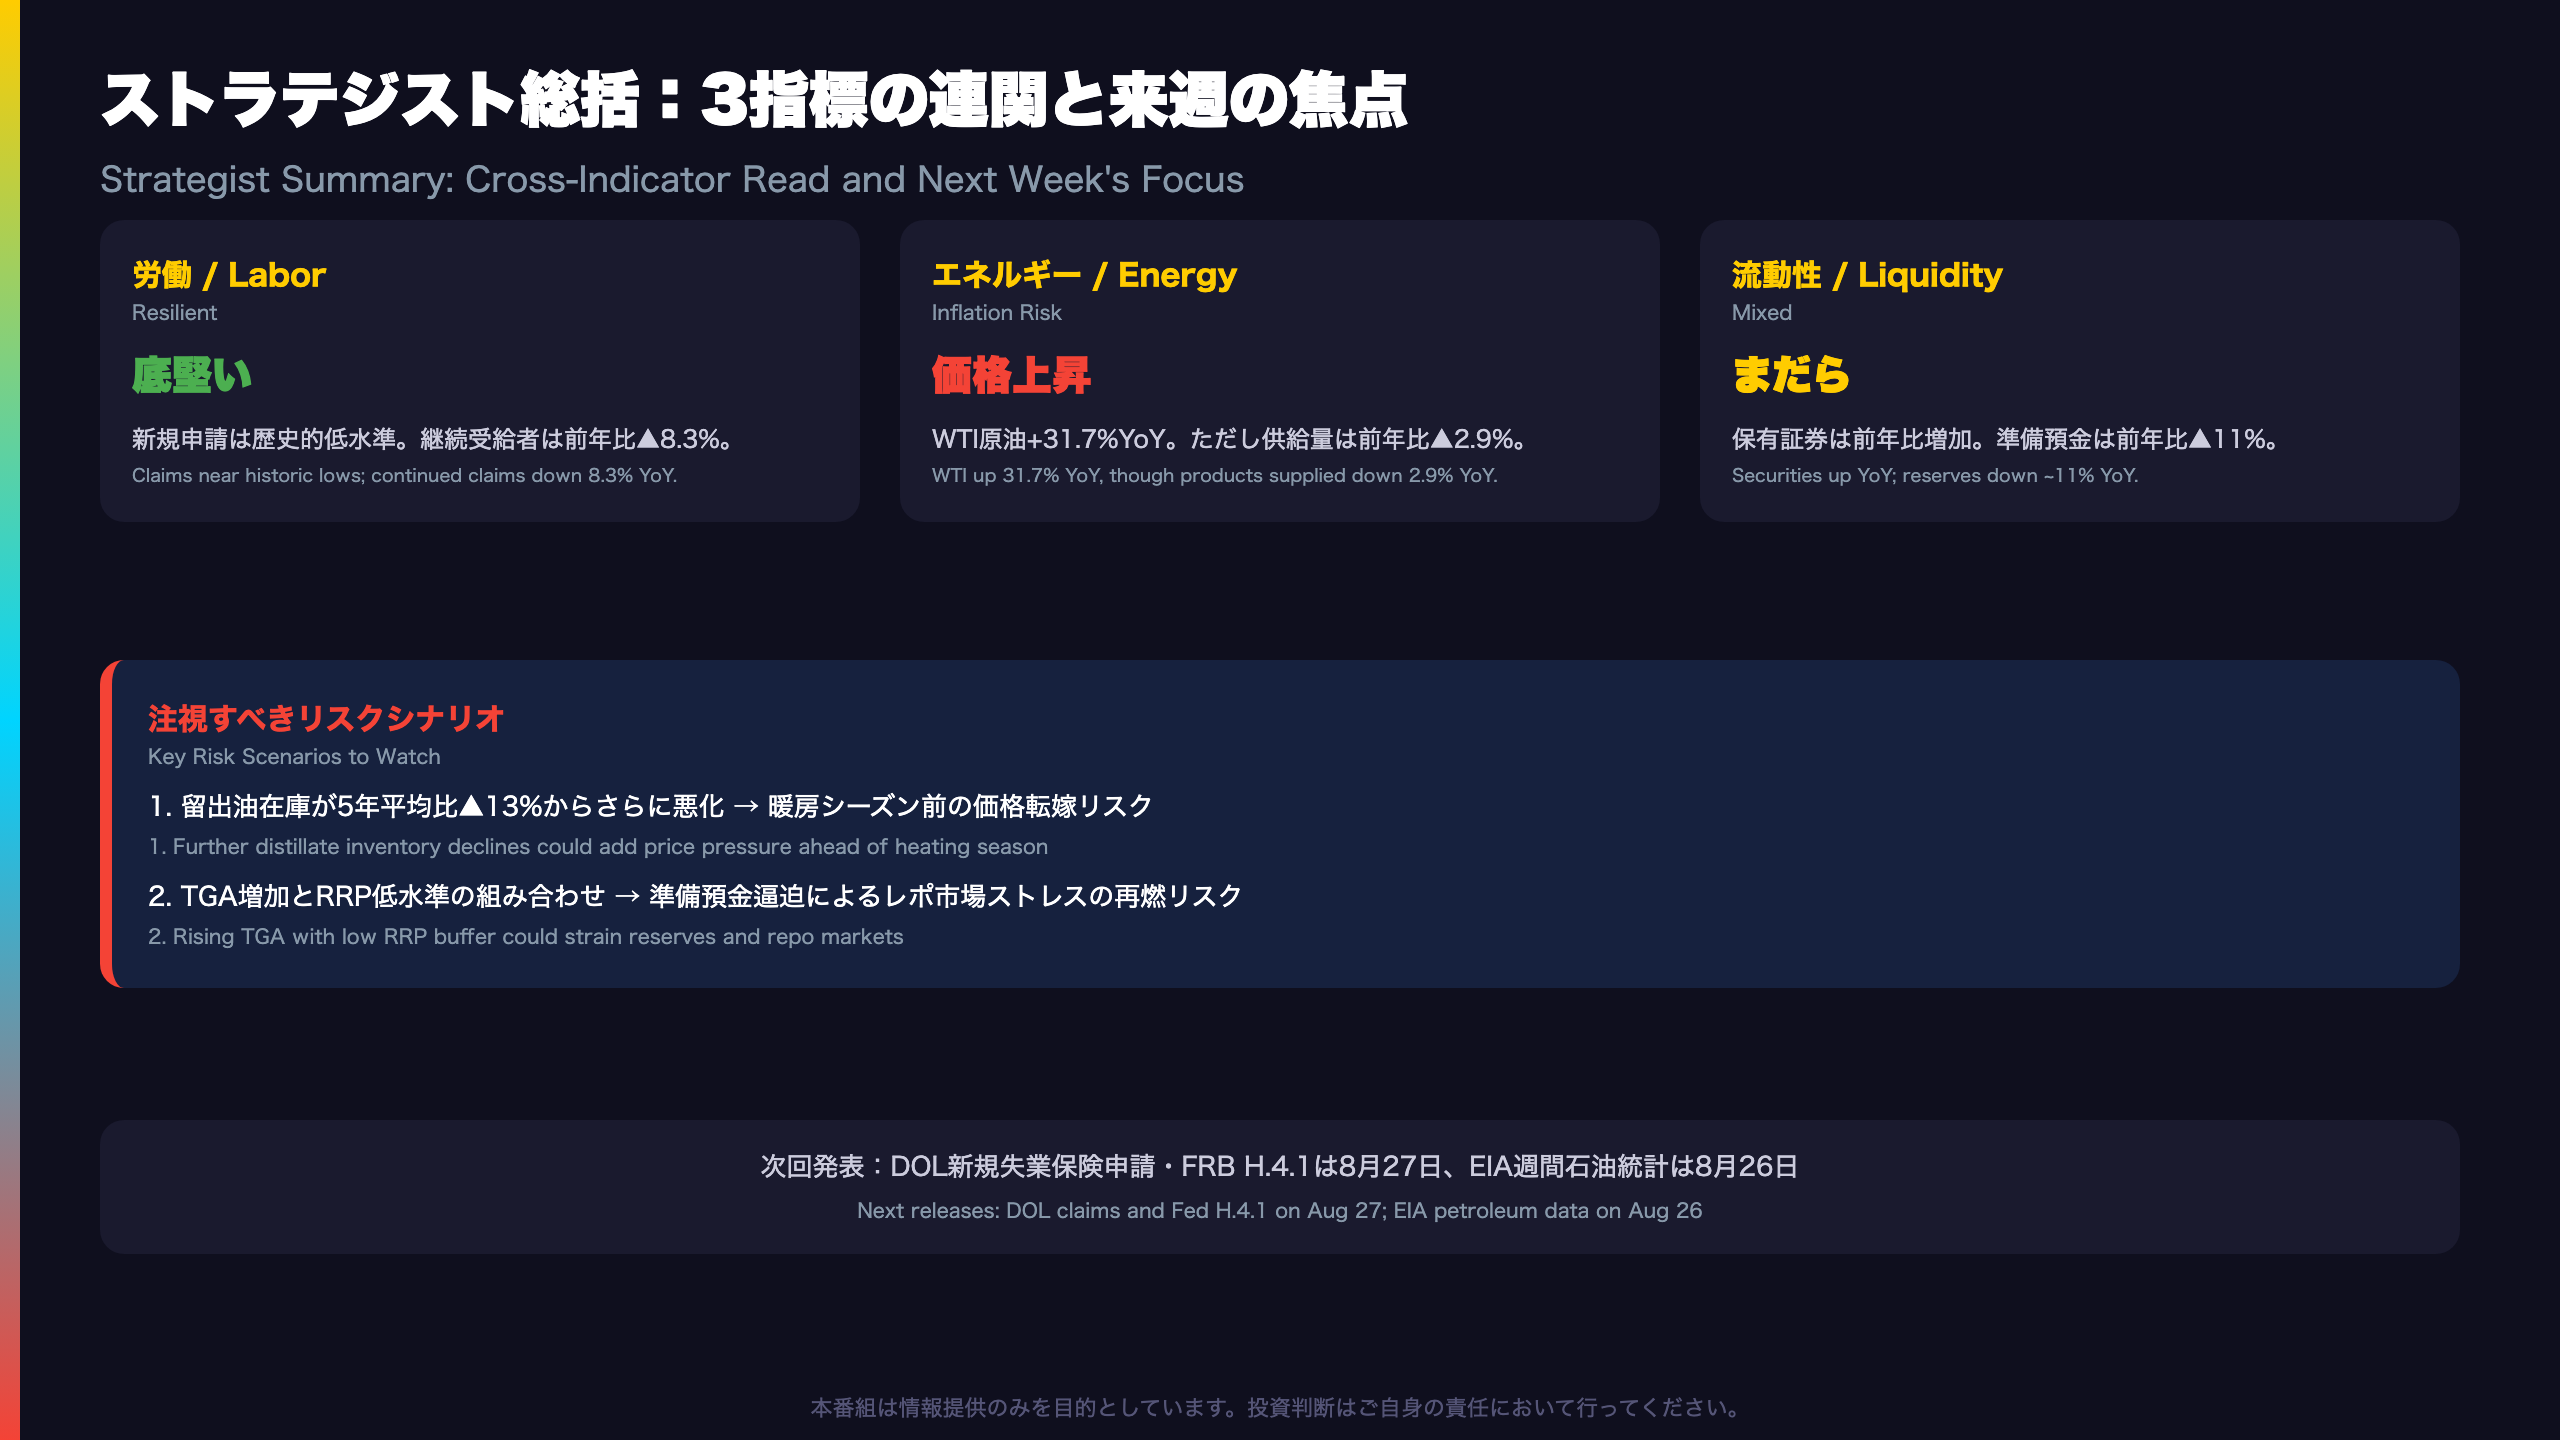
Bulls combine low jobless claims with paused QT for a soft-landing narrative. Bears combine falling labor force participation, declining government payrolls, and resurgent energy CPI into a stagflation-adjacent risk case.
What to Watch Next
Key thresholds: distillate inventories relative to the five-year average, and whether reserve balances test $2.9 trillion as TGA grows. Next releases: DOL claims and H.4.1 on August 27; EIA petroleum data on August 26.
Disclaimer: This article is for informational purposes only. All investment decisions are made solely at your own risk.







