📺 Watch the Full Video Analysis
This article was automatically generated by the NFC Market Live AI analysis system. (Updated: 2026-08-26 21:44 JST)
📄 Primary Source
U.S. Bureau of Economic Analysis
https://www.bea.gov/sites/default/files/2026-08/gdp2q26-2nd.pdf
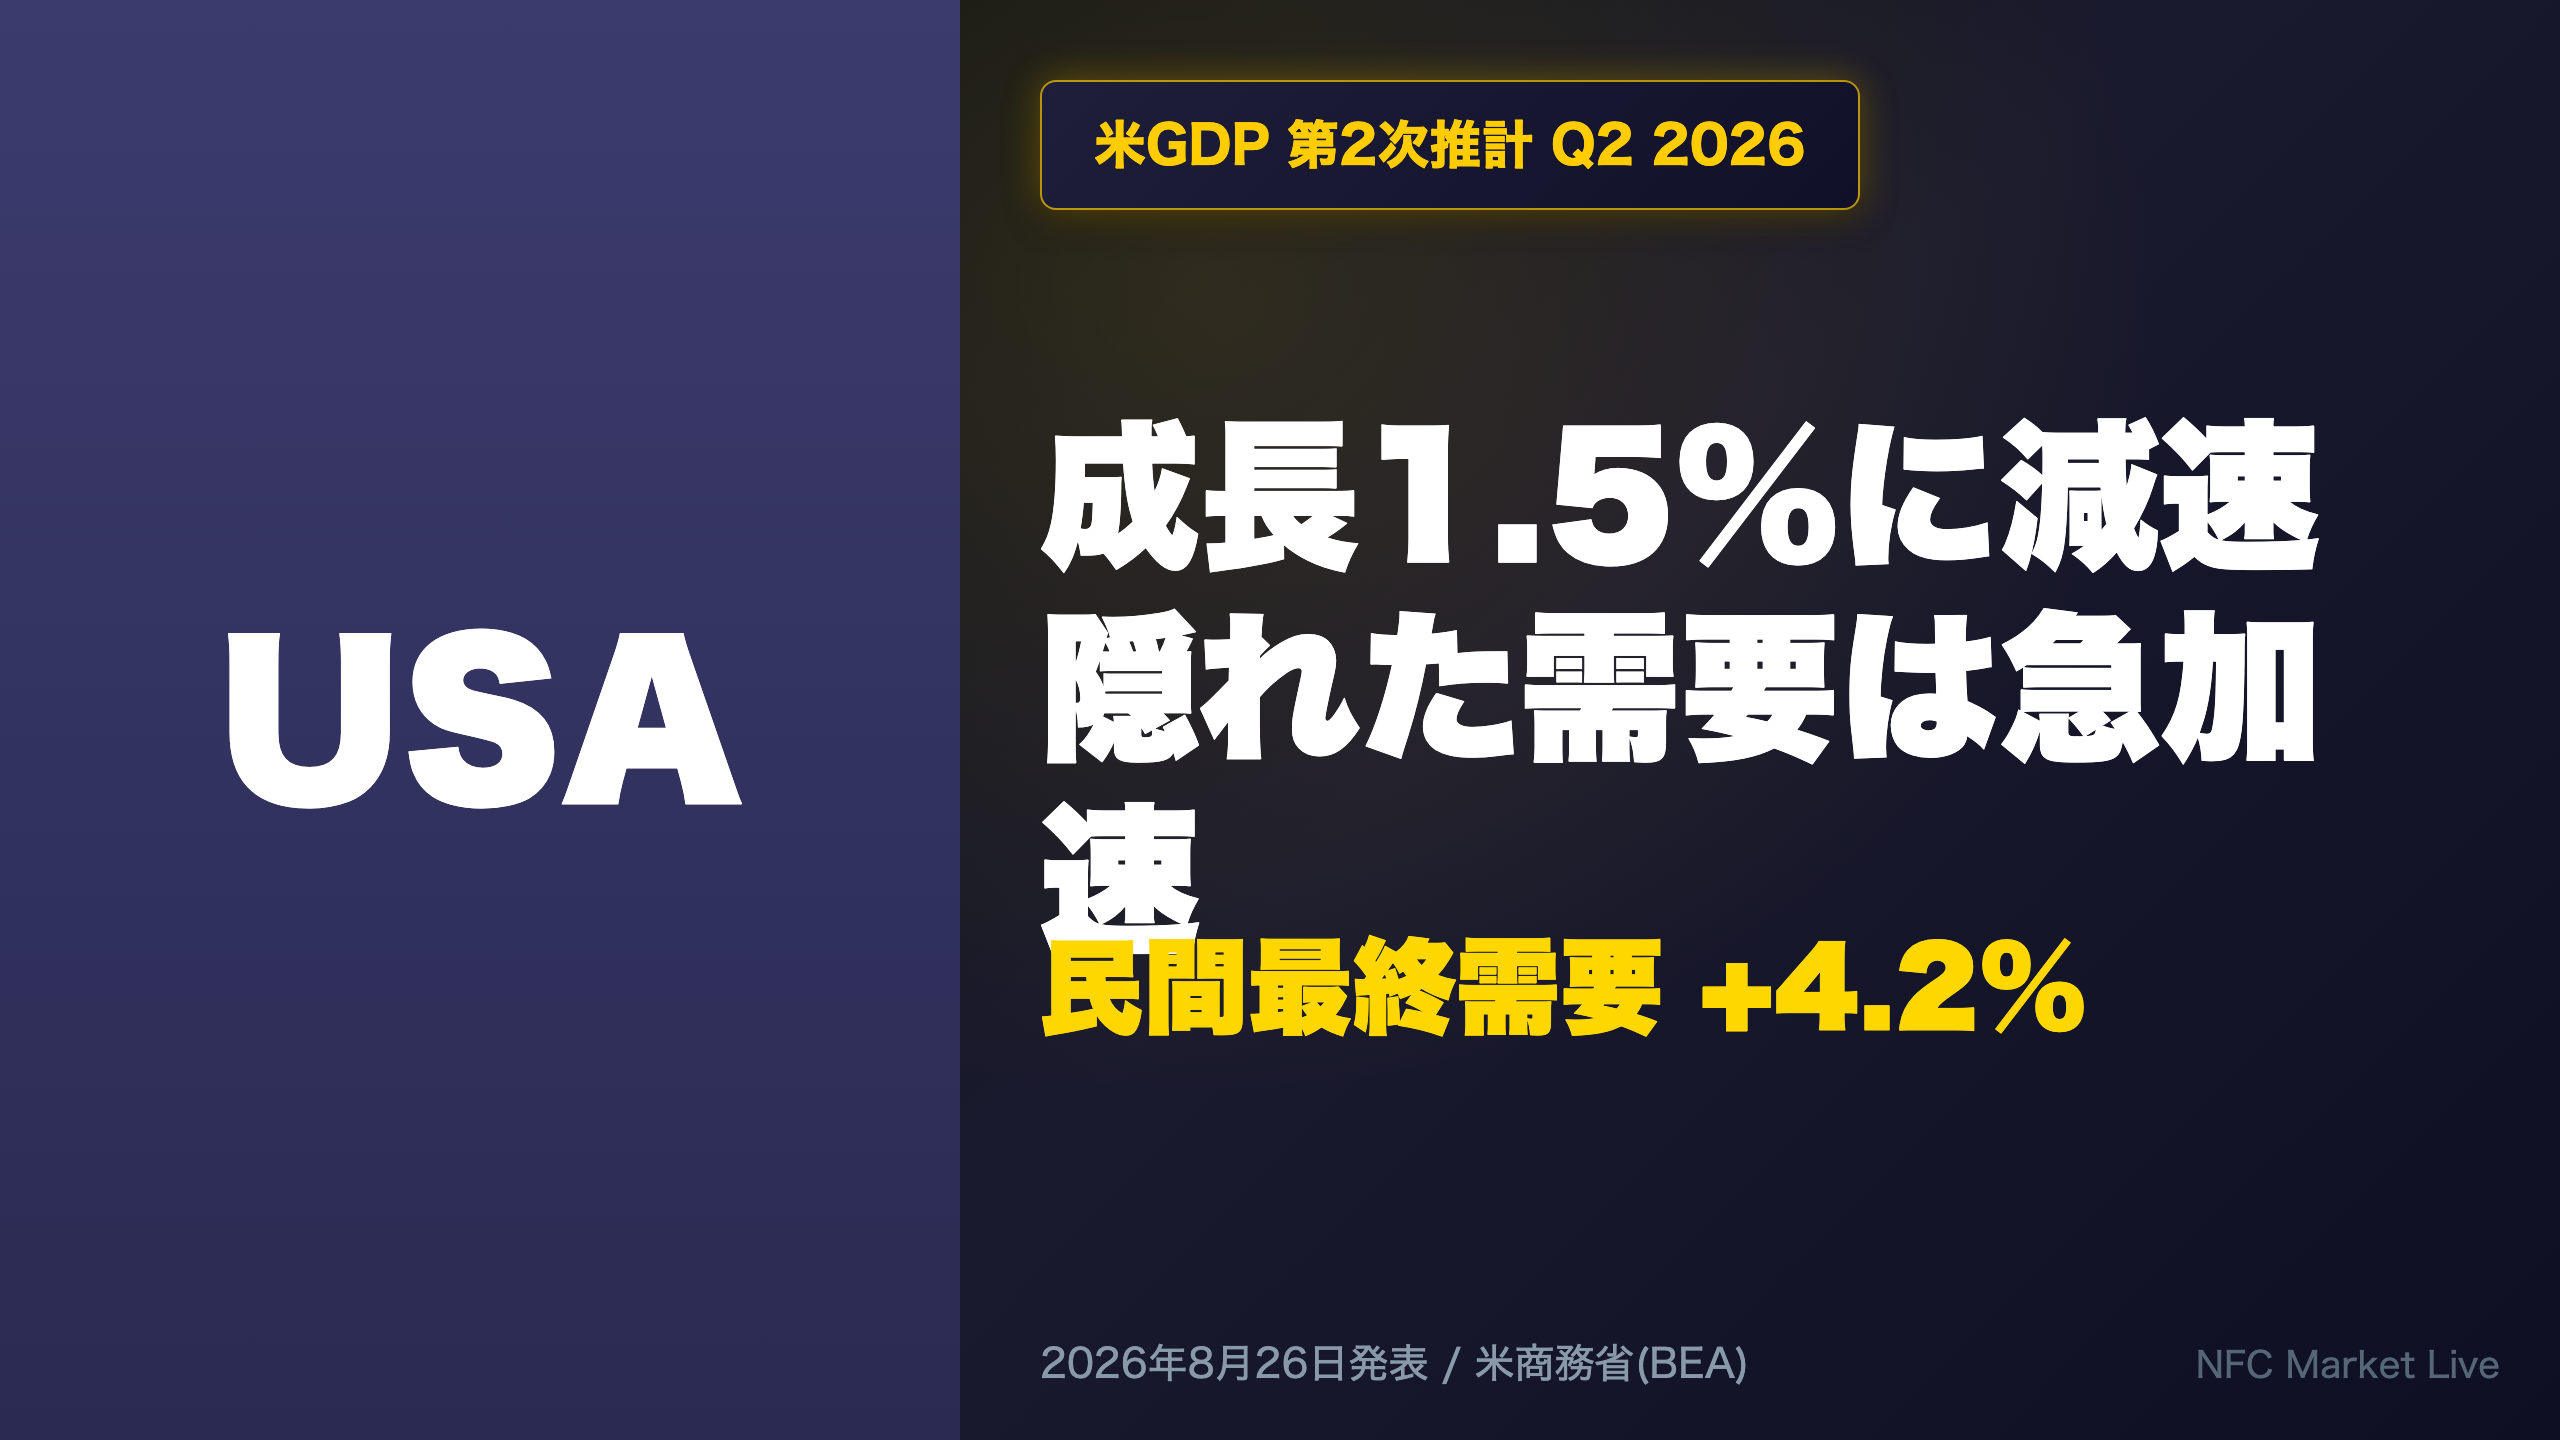
📊The US Bureau of Economic Analysis (BEA) released its Second Estimate of Q2 2026 GDP.
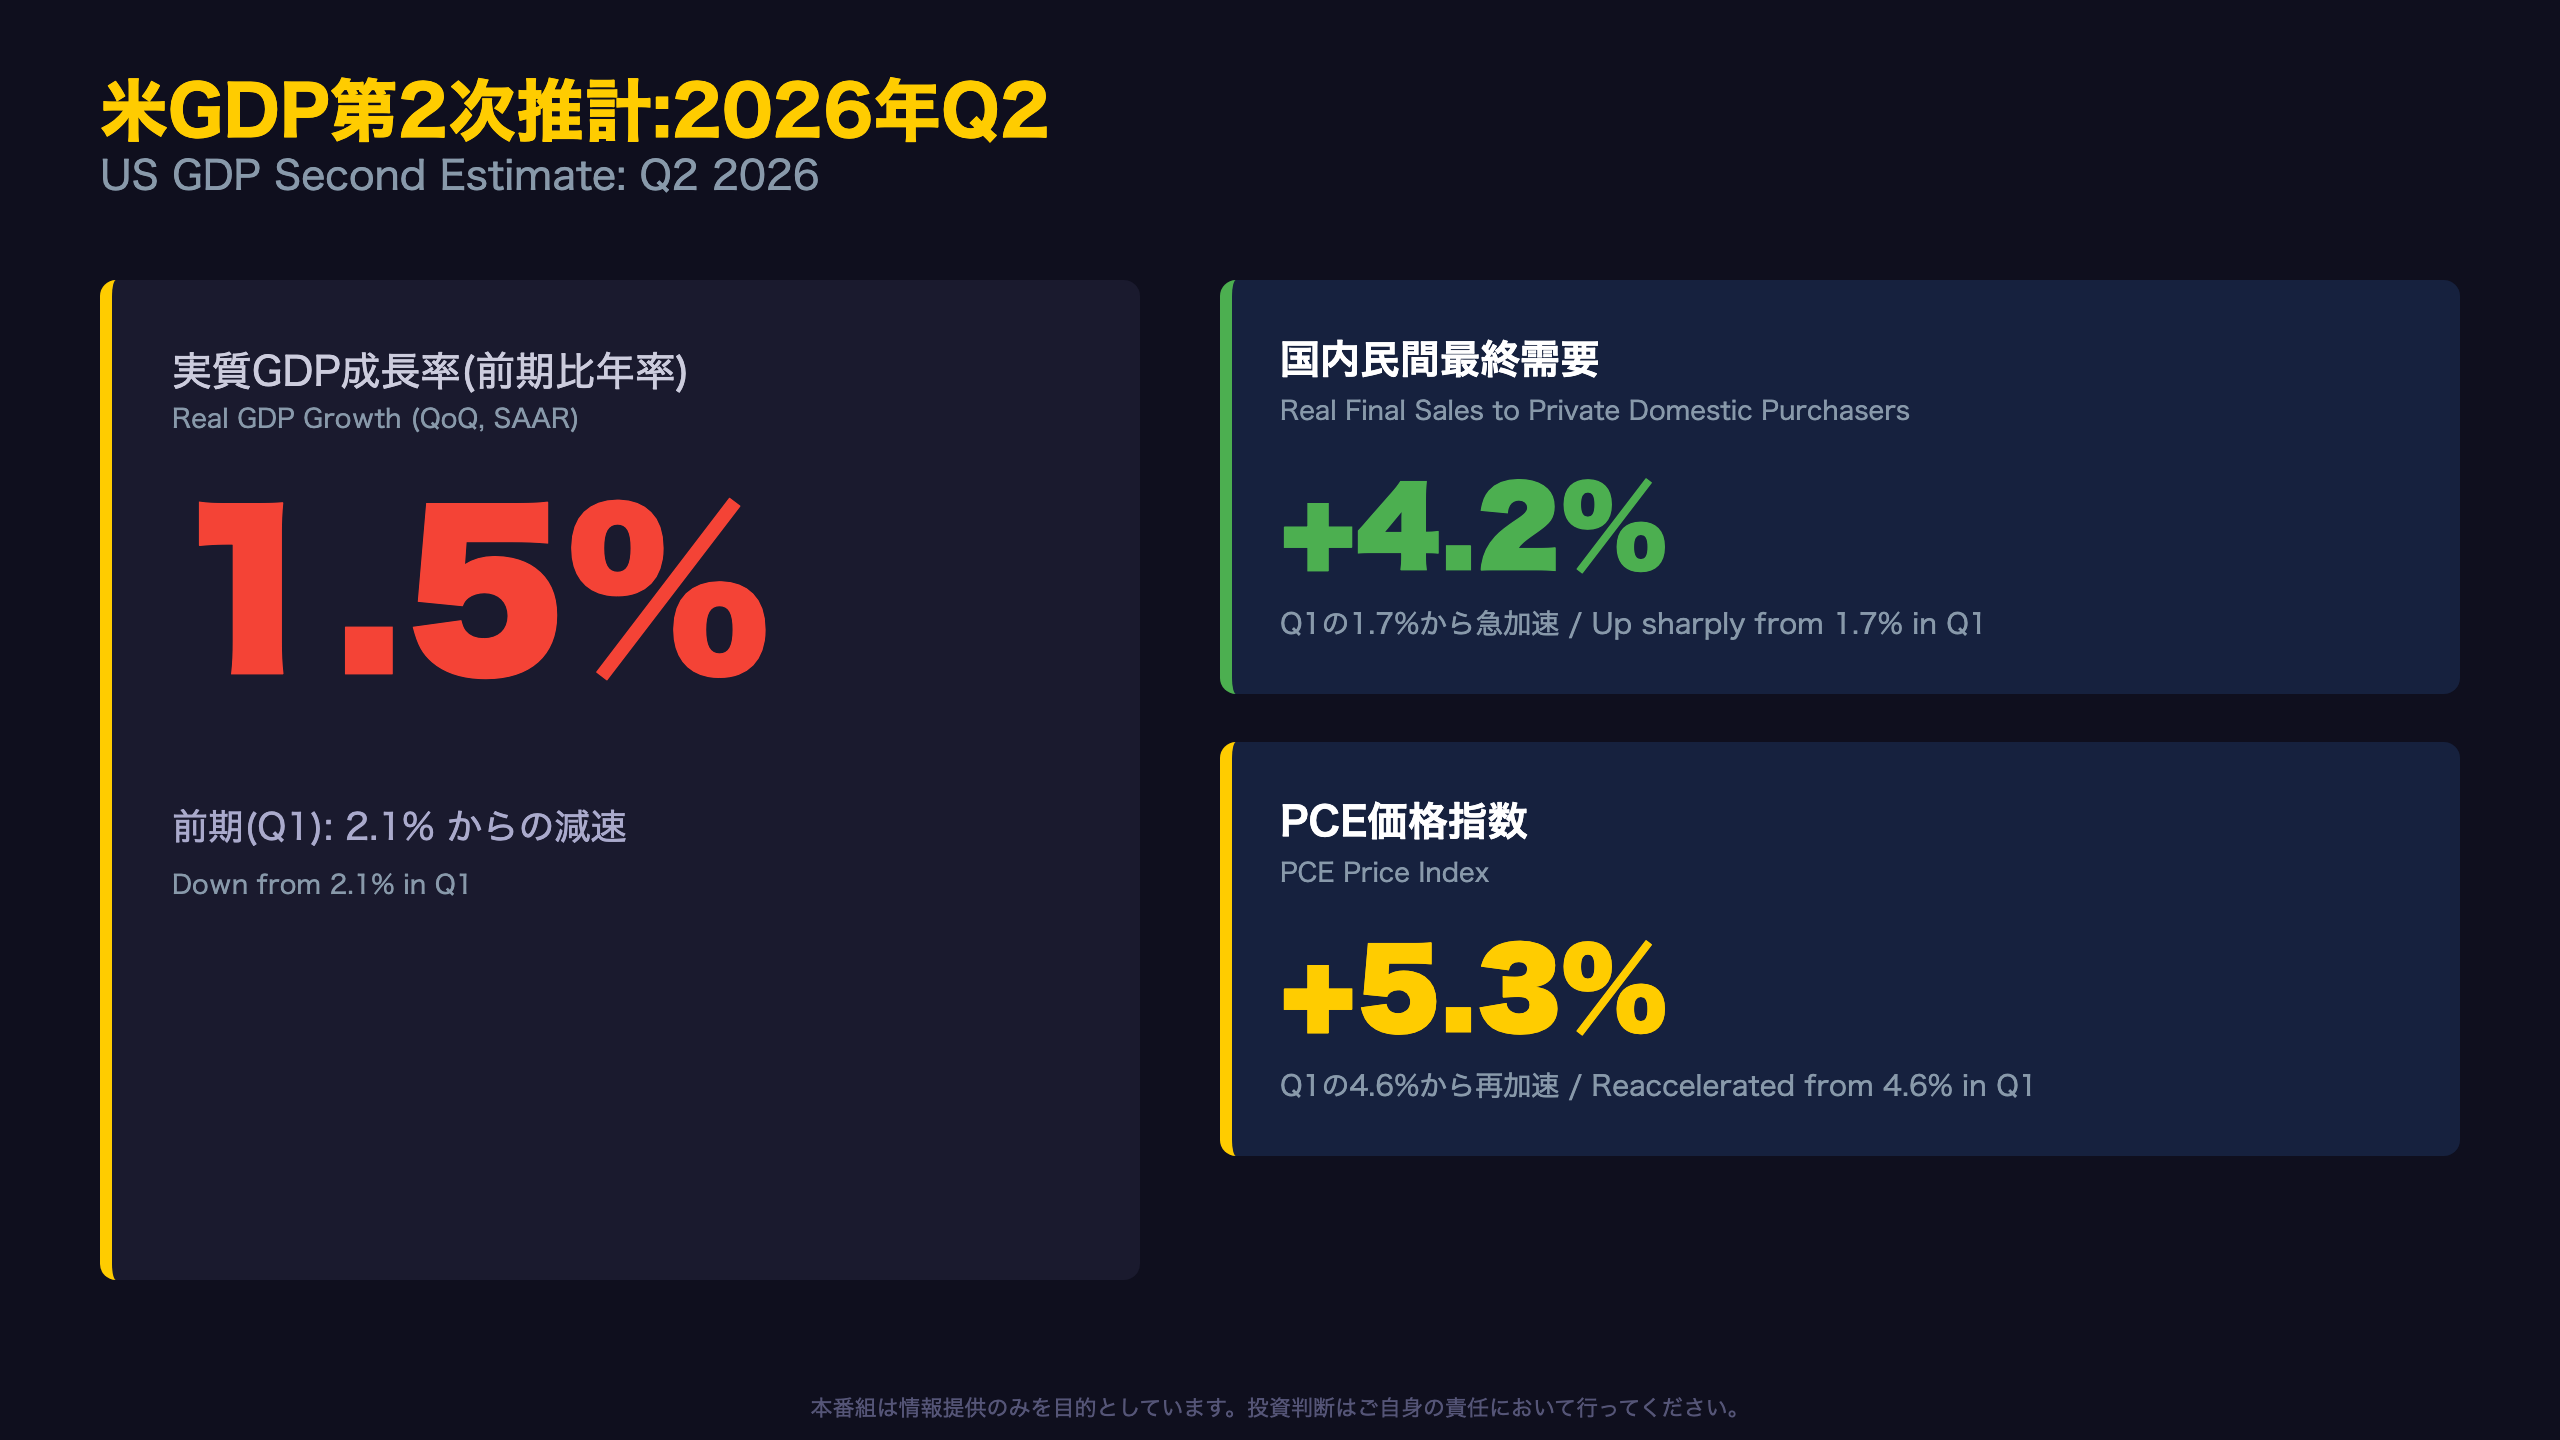
Headline growth slowed to 1.5% from 2.1% in Q1.
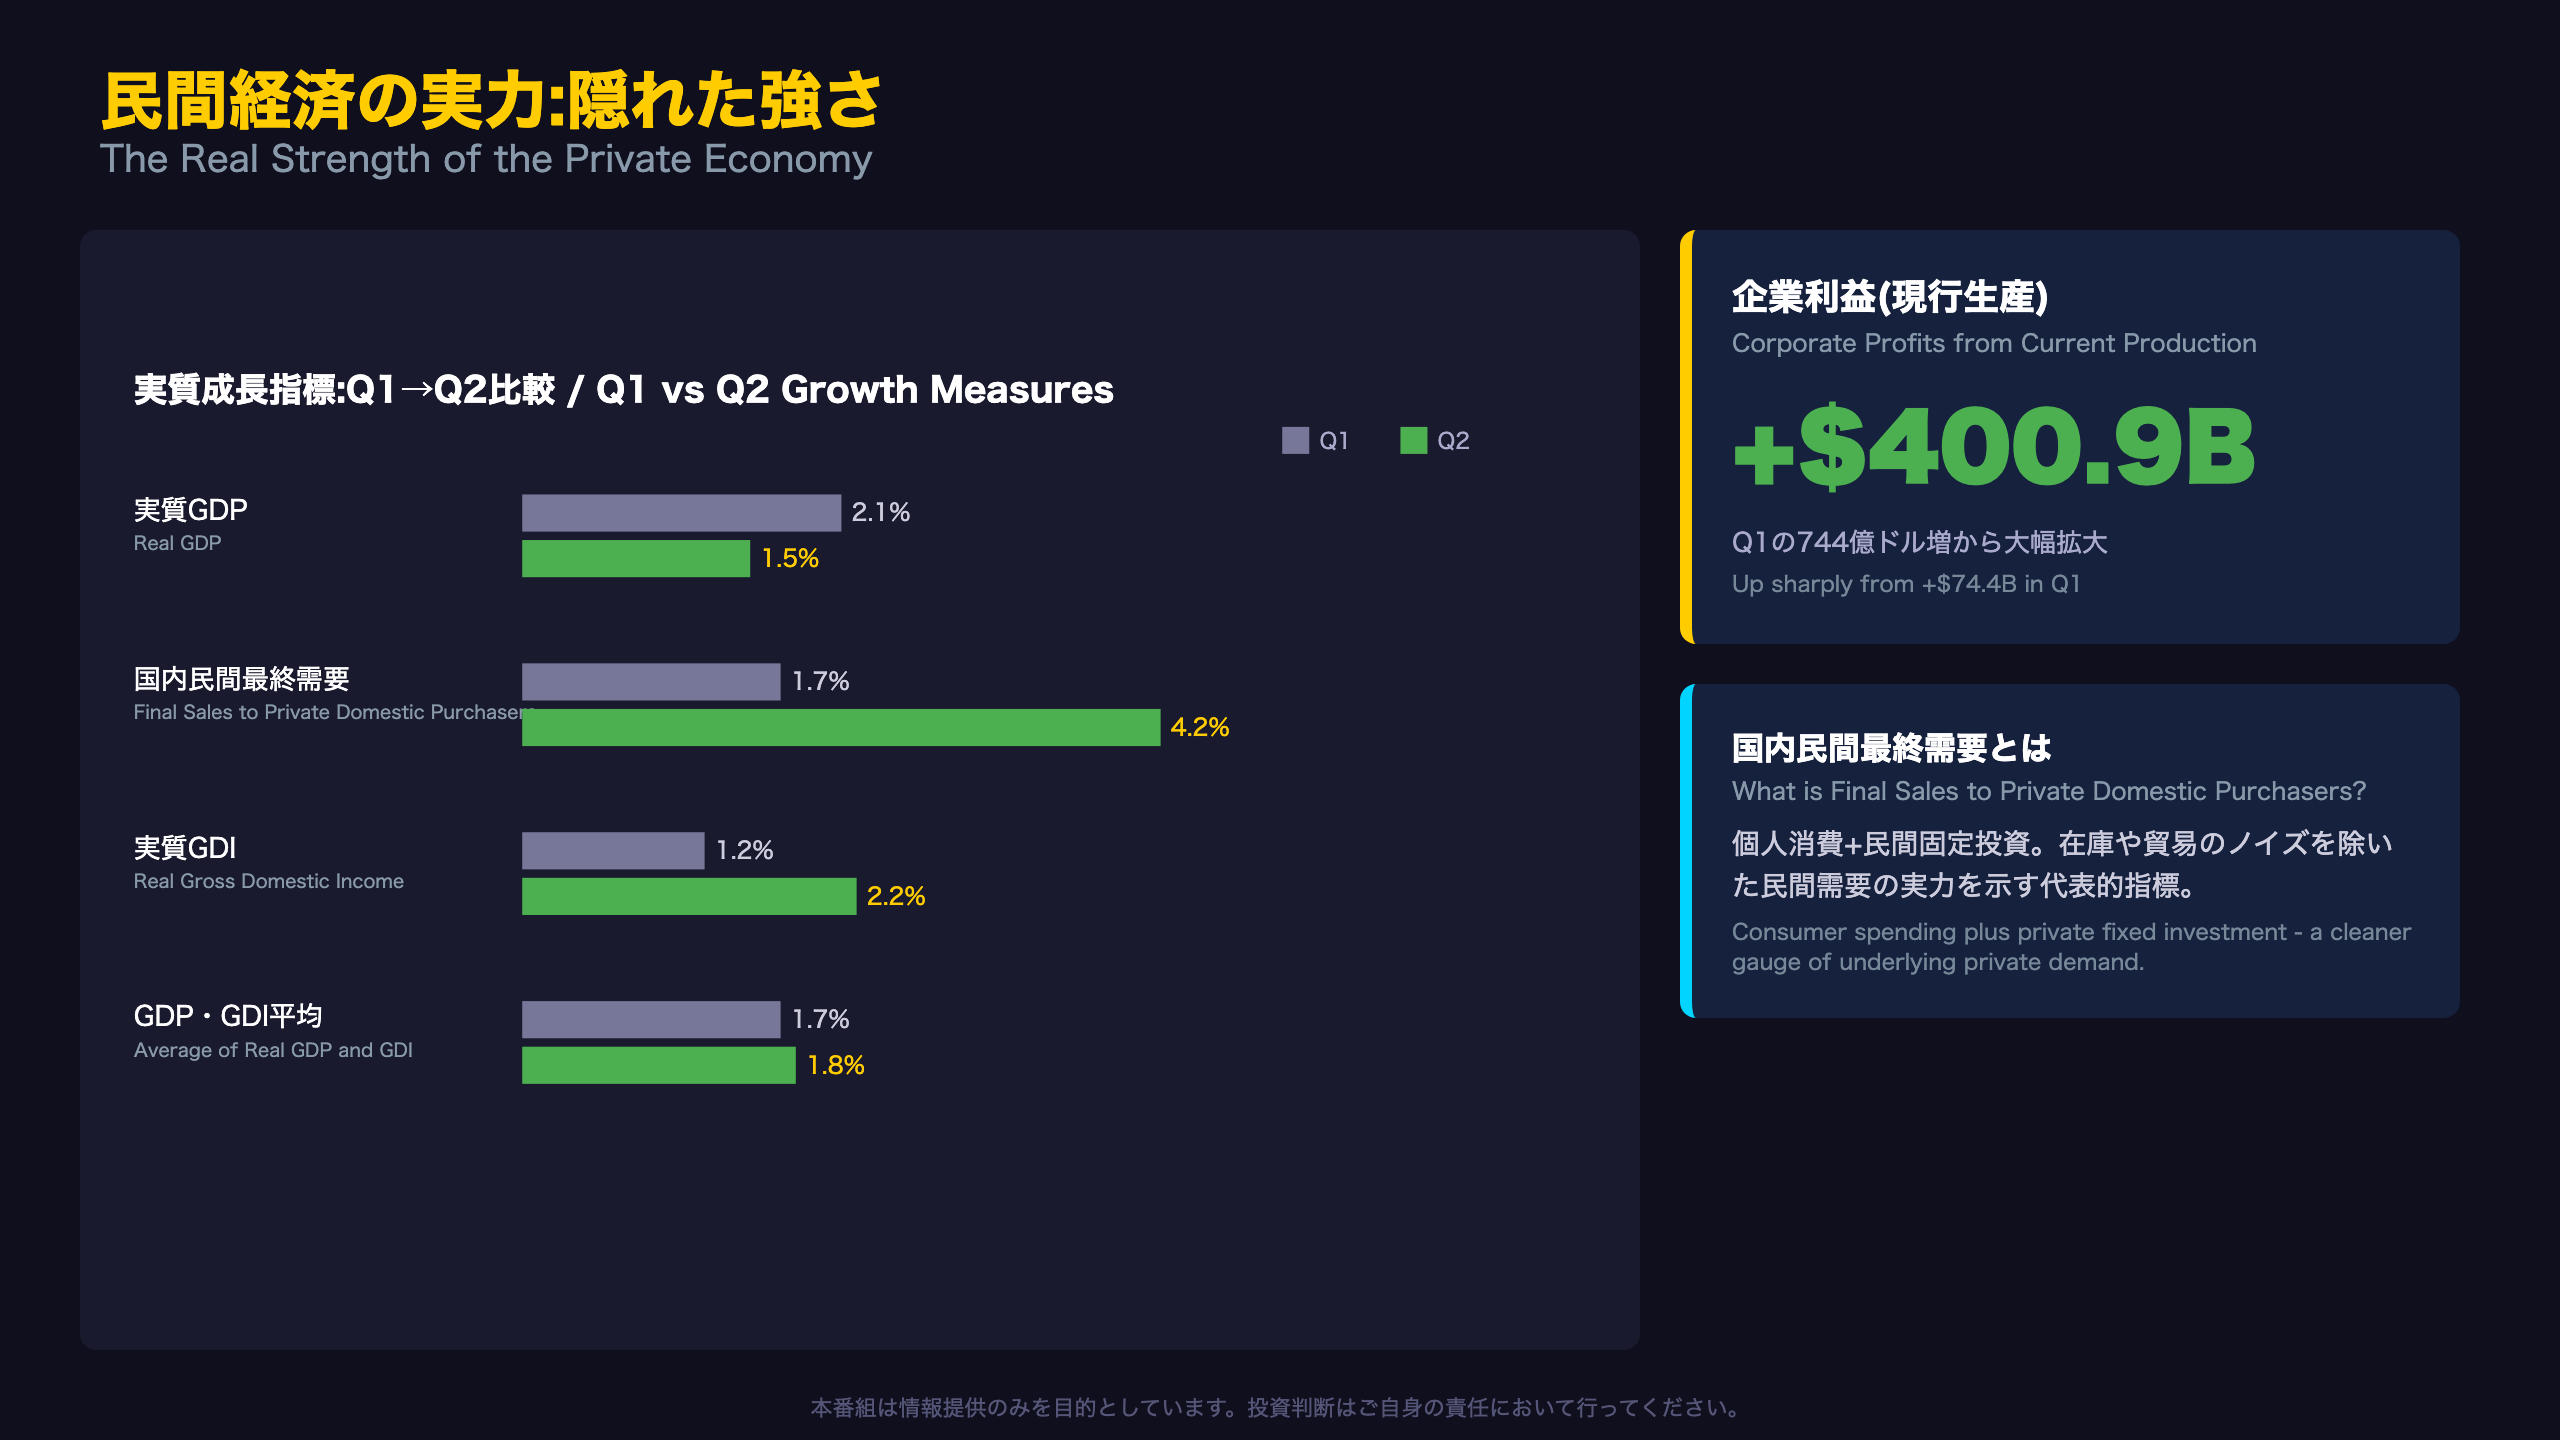
📈Yet private final domestic demand surged from 1.7% to 4.2%, and corporate profits jumped from +$74.4B to +$400.9B.
⚠️Meanwhile, headline PCE inflation reaccelerated to 5.3% from 4.6%, staying above 5%, even as core PCE cooled to 3.6%.
💡A genuinely mixed picture that complicates the Fed’s next move.
Next release: GDP Third Estimate on September 30, 2026.
The Ultimate Summary: 減速の裏で加速する需要
What is the “Second Estimate”?
Today’s release is BEA’s Second Estimate for Q2 2026, updating the Advance Estimate published July 30. The headline growth rate is unchanged at 1.5%, but BEA’s technical notes disclose a downward revision of “less than 0.1 percentage point” before rounding – a reminder that GDP figures are built from incomplete source data and continuously refined.
Understanding SAAR
U.S. GDP is reported at a Seasonally Adjusted Annual Rate (SAAR), unlike many economies that emphasize quarter-on-quarter percentages. BEA’s own footnote clarifies that the non-annualized quarterly growth rate was just 0.4%, far more modest than the eye-catching “1.5%” headline suggests.
“Real gross domestic product (GDP) increased at an annual rate of 1.5 percent in the second quarter of 2026 … In the first quarter, real GDP increased 2.1 percent.”
For investors comparing across countries, this SAAR convention makes direct comparison with quarterly-rate economies tricky. The next data point – the Third Estimate on September 30, alongside industry and state-level GDP data – will offer a fuller picture of where this economy stands.
減速の内訳:政府支出とSPRという技術要因
Investment and Trade: The Details Behind the Headlines
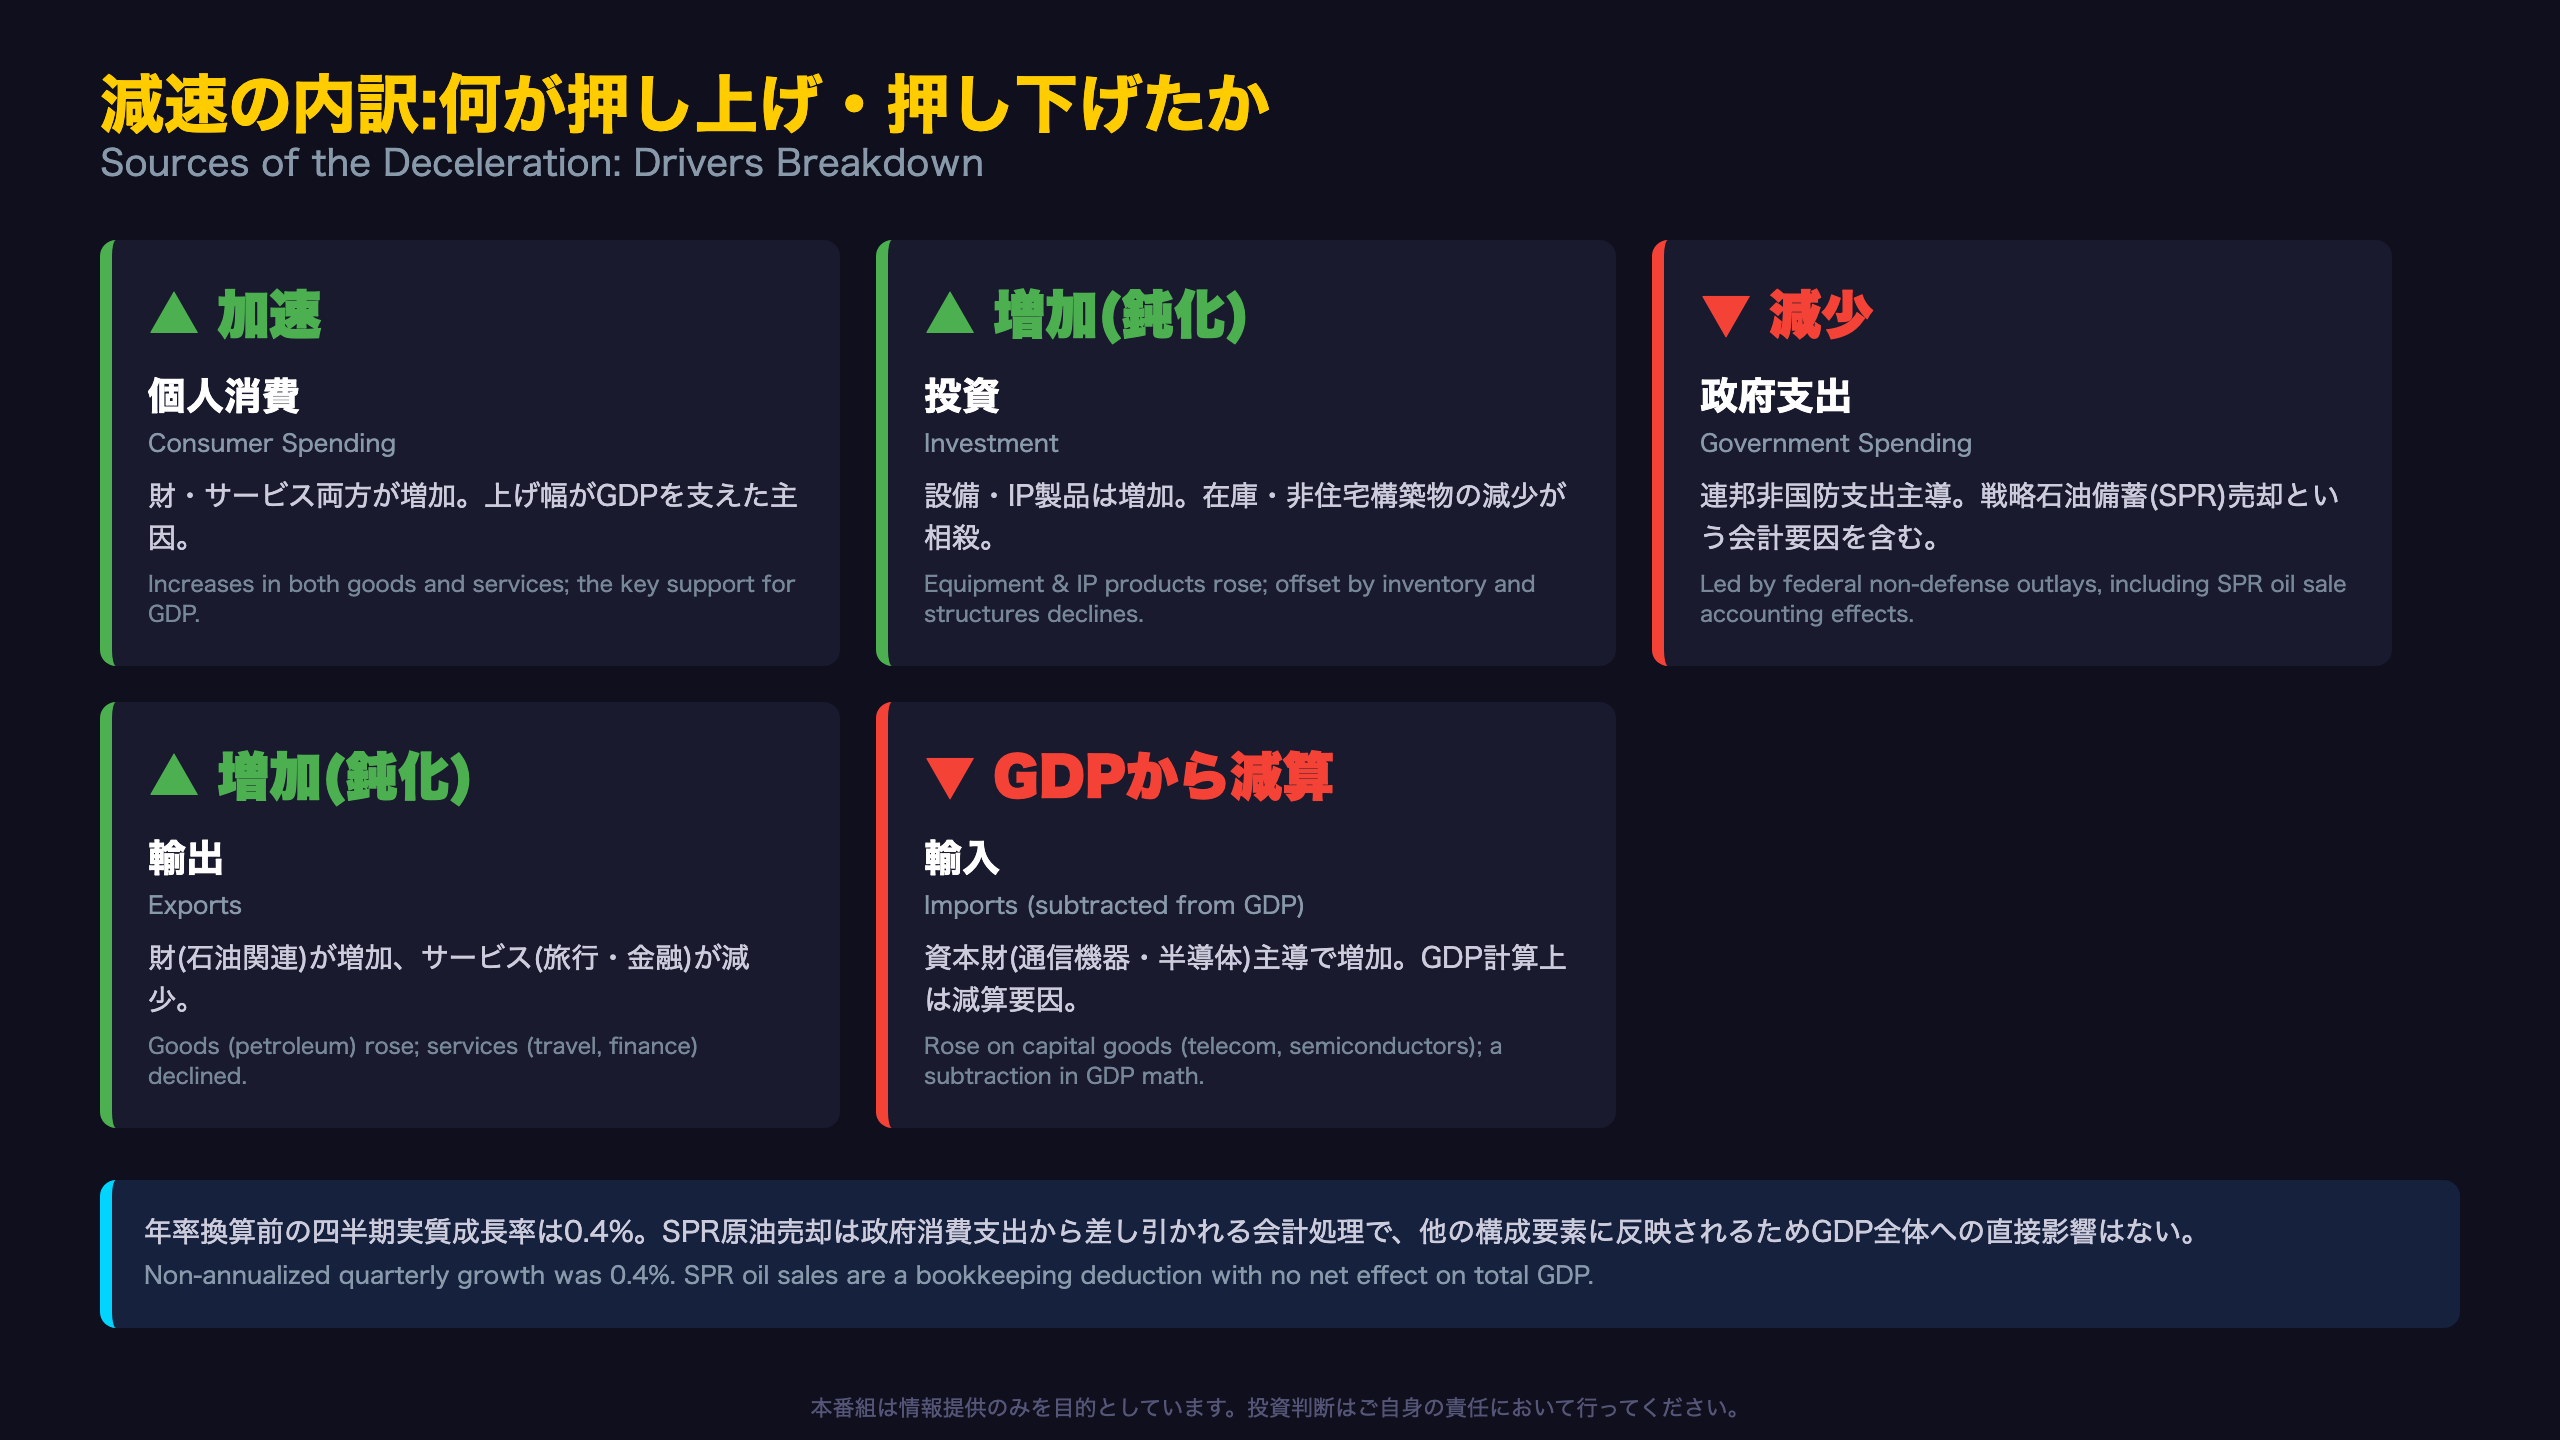
BEA’s technical notes reveal that the investment increase was led by equipment (industrial, transportation, and information-processing equipment) and intellectual property products (software, R&D), while a decline in private inventory investment (concentrated in wholesale trade) and nonresidential structures (led by manufacturing construction) partially offset the gains.
A Tale of Two Trade Flows
Exports rose on goods (notably petroleum products) but fell in services – particularly travel and financial services such as portfolio management. Imports, meanwhile, increased sharply in capital goods: telecommunications equipment, semiconductors, and industrial machinery.
“The increase in investment primarily reflected increases in equipment and intellectual property products that were partly offset by decreases in private inventory investment and nonresidential structures.”
One possible reading: rising capital-goods imports may reflect strong domestic corporate capex appetite. That said, this is a single-quarter observation and should not be read as a durable trend – the data instead points to investment-driven import demand rather than pure consumer import demand.
民間経済の実力:隠れた強さ
Inside Consumer Spending: What Actually Drove It
BEA’s granular detail shows consumer spending strength was broad-based. Within goods, growth was led by “other nondurable goods” (mainly prescription drugs), new light trucks, and furniture. Within services, food services/accommodations and financial services (particularly portfolio management) led the gains.
What Changed in the Revision
The upward revision to consumer spending was driven by health care (hospitals and physician services, per newly available Census survey data), partly offset by downward revisions to recreational goods/vehicles and gasoline/energy goods.
“The upward revision to consumer spending reflected an upward revision to services that was partly offset by a downward revision to goods… led by health care.”
GDP vs. GDI: A Useful Cross-Check
U.S. GDP is unusual among major economies in that BEA also publishes Gross Domestic Income (GDI) – the same economy measured from the income side rather than expenditure. This quarter, GDI grew 2.2%, notably stronger than GDP’s 1.5%, and the average of the two – a gauge some Fed economists view as more reliable – came in at 1.8%, suggesting headline GDP alone may understate the economy’s true momentum.
物価の分裂:ヘッドライン再加速、コア鈍化
Two Different Price Gauges in One Report
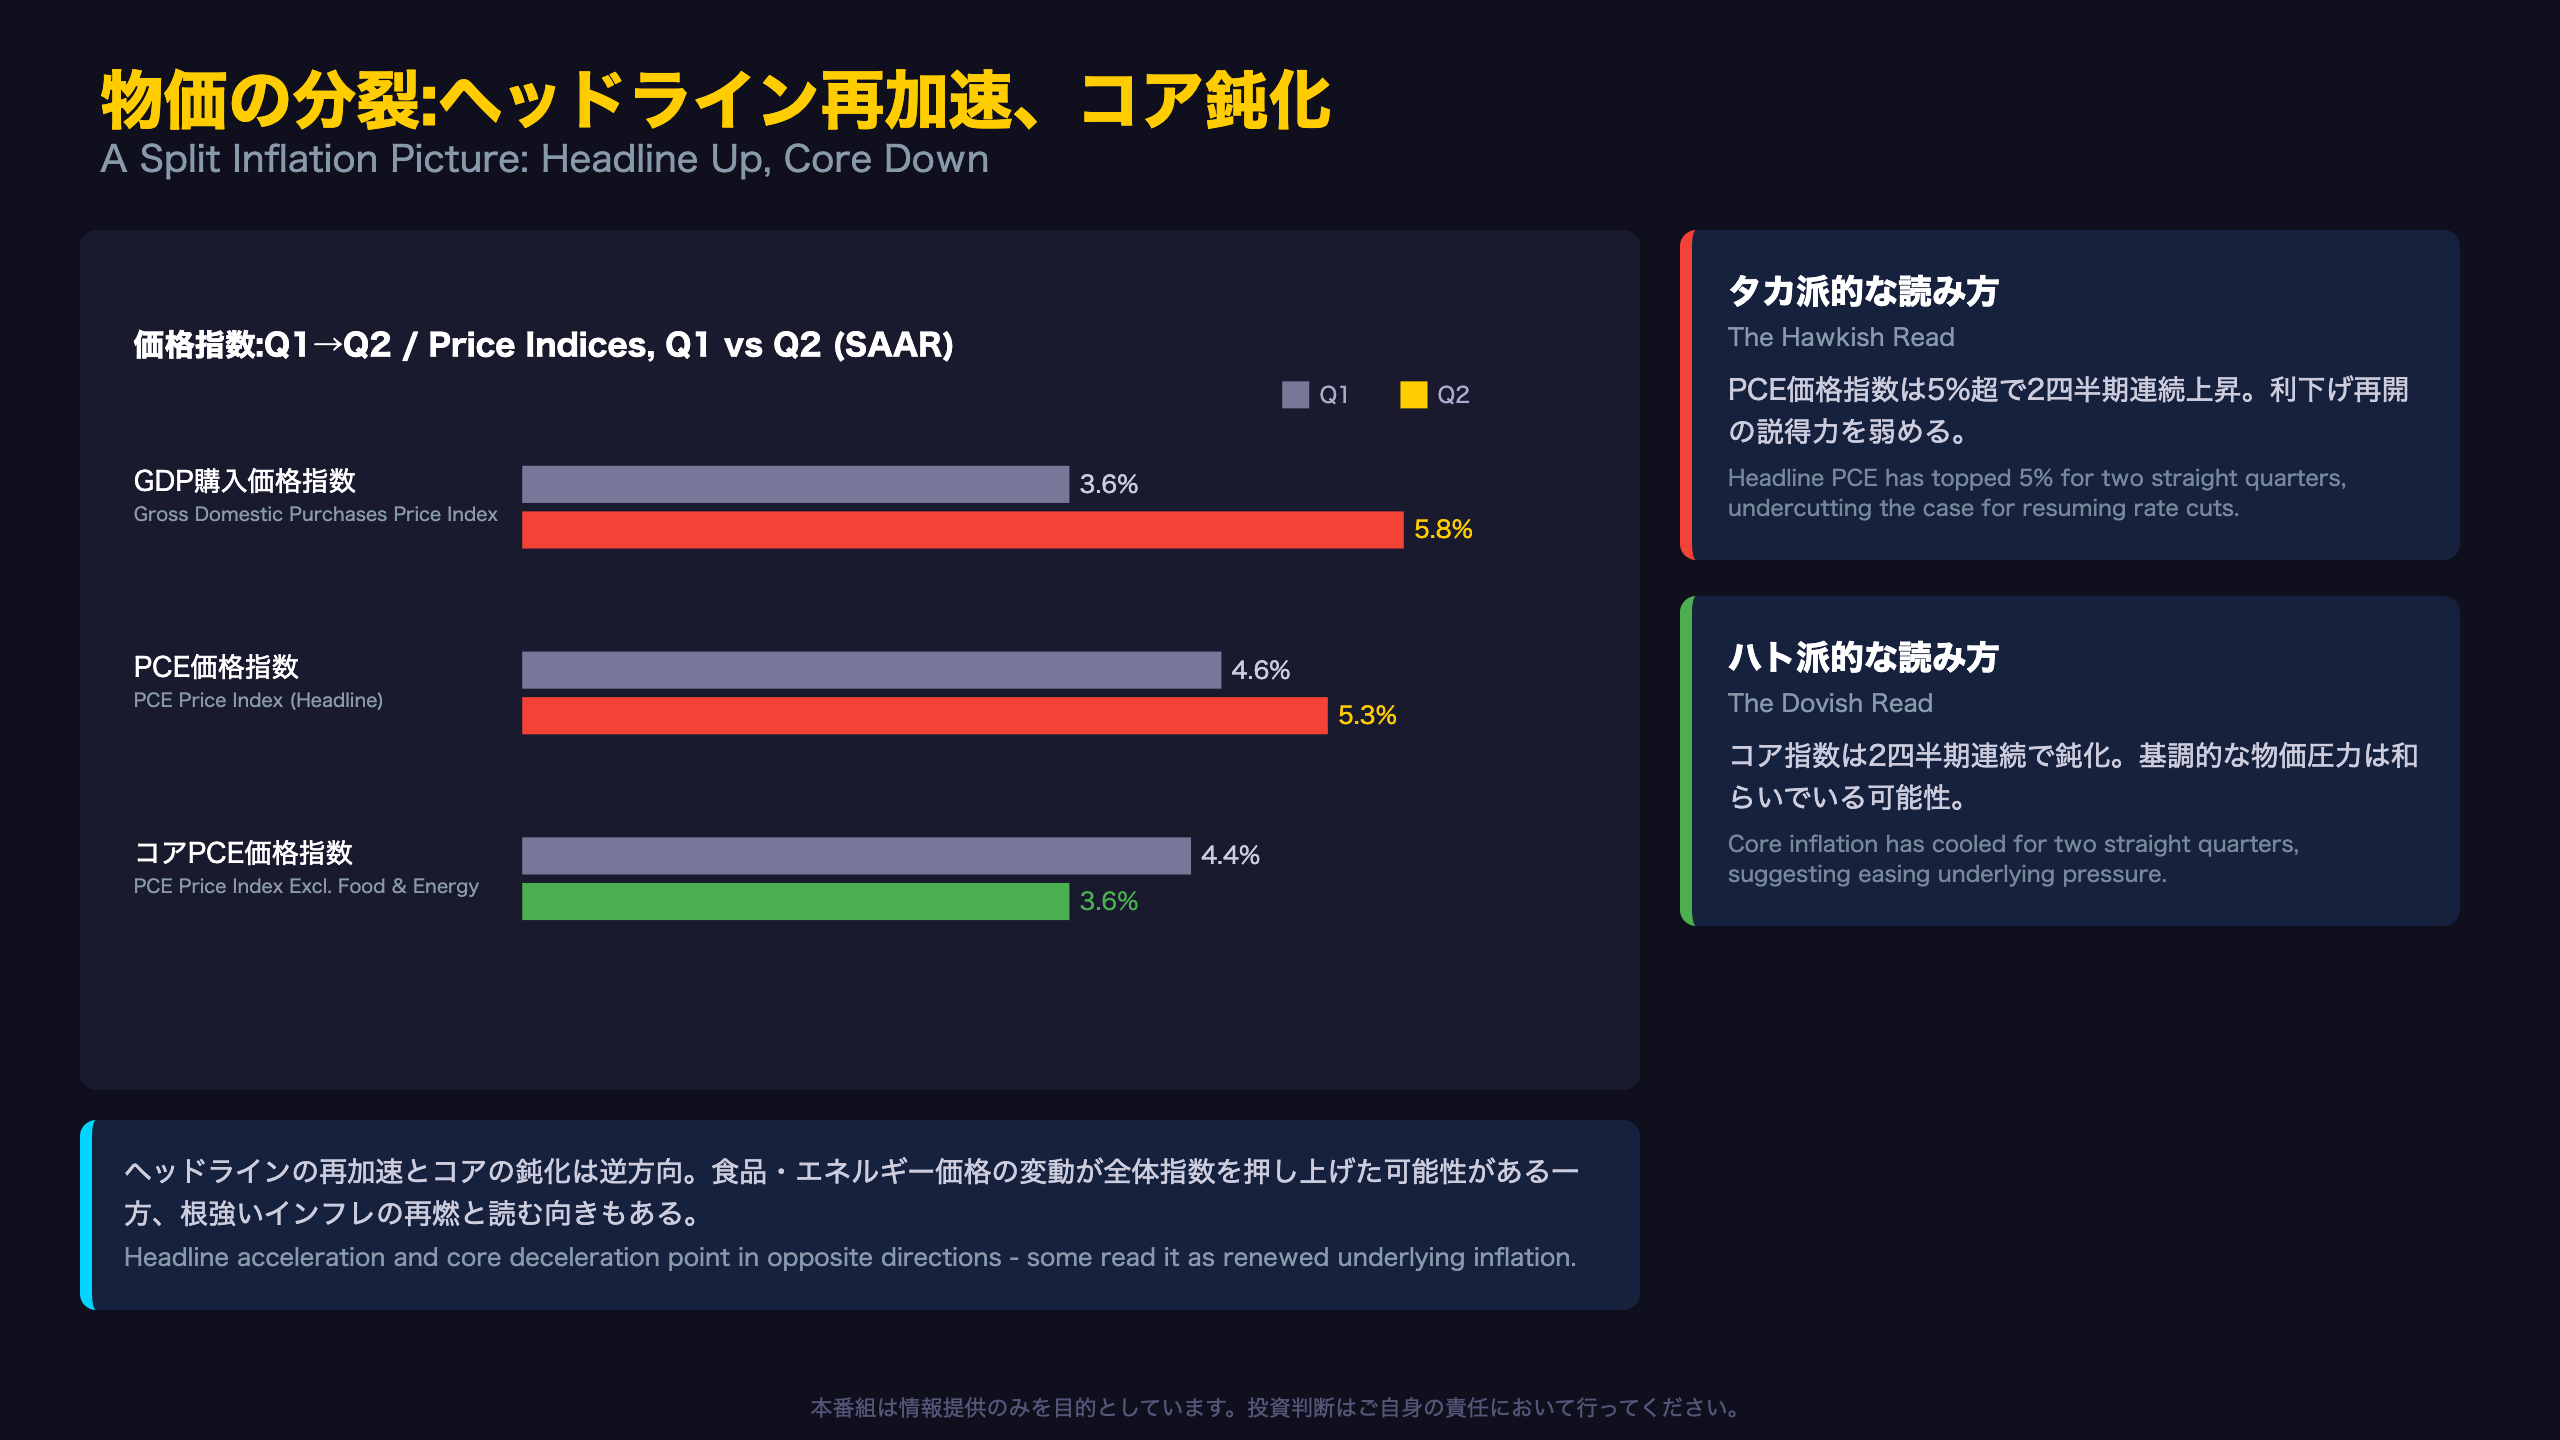
BEA’s GDP release contains two distinct price measures: the Gross Domestic Purchases Price Index (covering purchases by consumers, businesses, and government alike) and the narrower PCE Price Index (consumer spending only) – the latter being the Fed’s preferred inflation gauge.
Two Straight Quarters Above 5%
Headline PCE inflation ran at 4.6% in Q1 and 5.3% in Q2 – both far above the Fed’s 2% longer-run target. That said, core PCE (ex food and energy) decelerated from 4.4% to 3.6%, suggesting volatile food and energy components may be doing the heavy lifting on the headline number, rather than broad-based price pressure.
“The personal consumption expenditures (PCE) price index increased 5.3 percent, revised up 0.2 percentage point, and the PCE price index excluding food and energy increased 3.6 percent.”
All Revisions Point the Same Way: Higher
Notably, every price measure in this release was revised upward from the Advance Estimate. Whether the September 30 Third Estimate confirms or reverses this upward drift will be an important data point for rate-path expectations.
FRBのジレンマ:減速する成長、消えないインフレ
Reading Across Markets
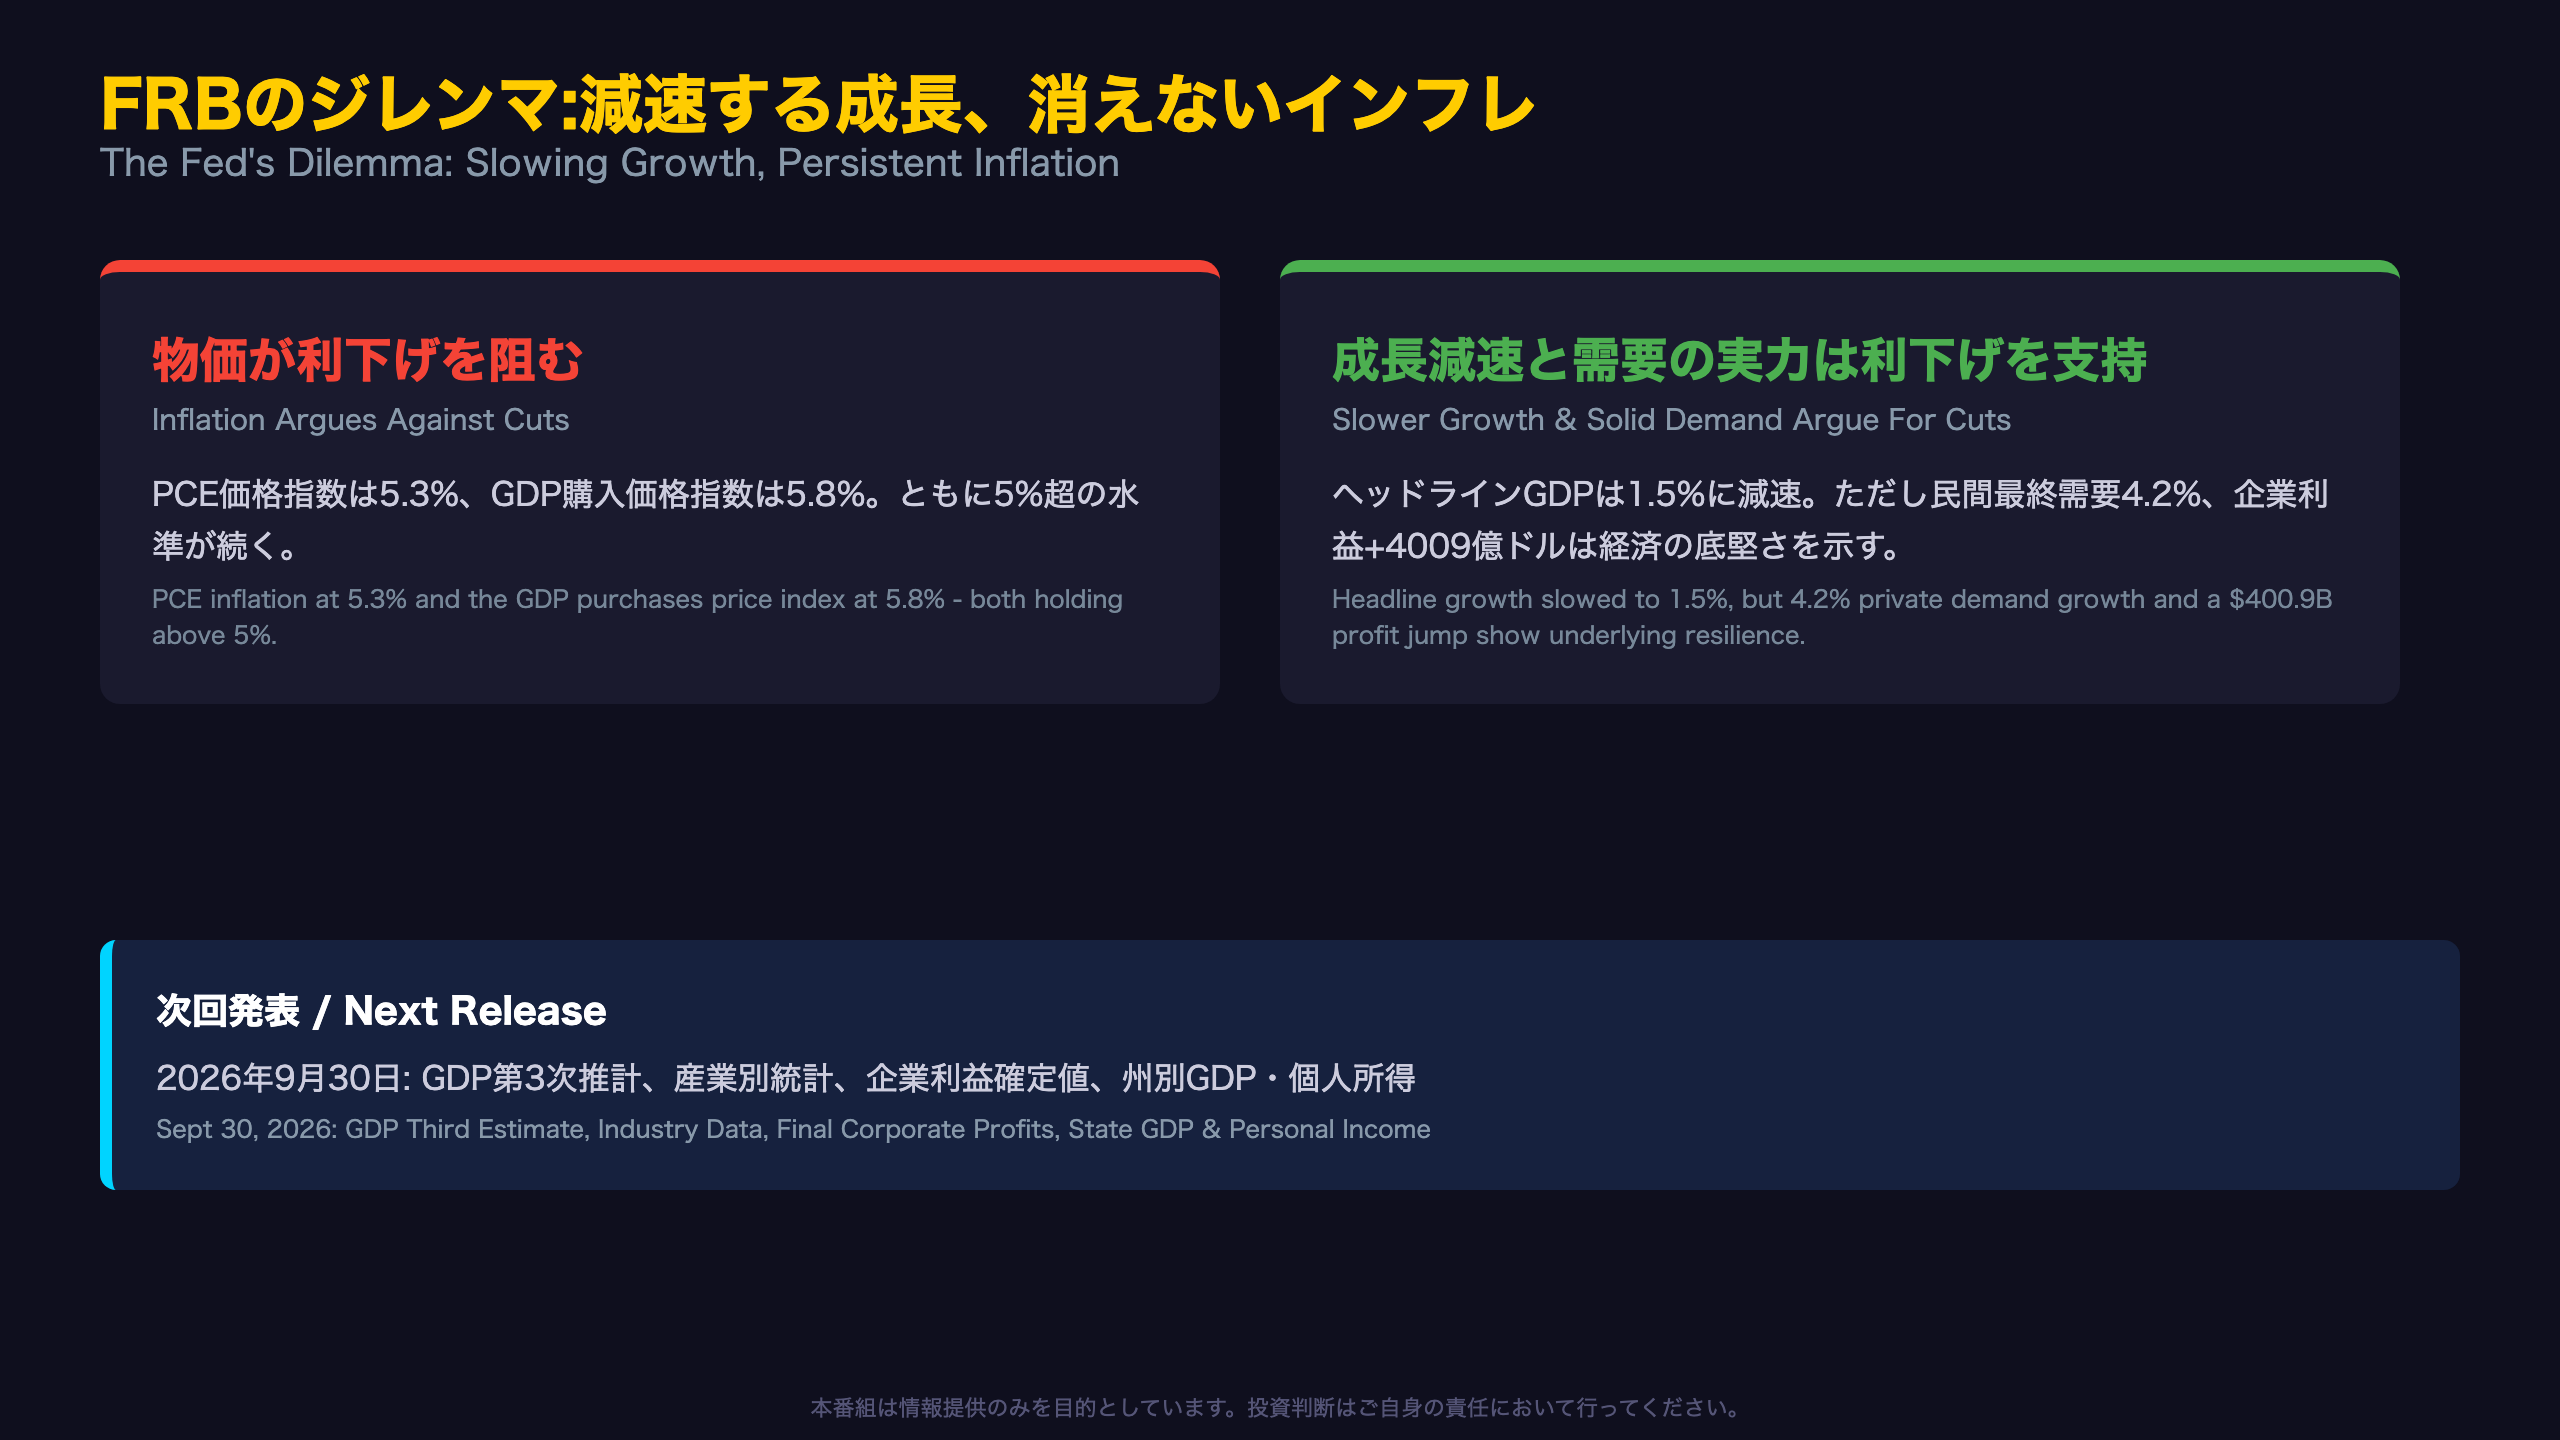
This release carries different implications for rates, currencies, and equities. Current-dollar (nominal) GDP grew 8.0%, and the $400.9 billion jump in corporate profits is a potential tailwind for equities, particularly earnings-sensitive sectors.
Rate Markets
With PCE inflation above 5% for two consecutive quarters, the case for the Fed to aggressively resume rate cuts remains weak. At the same time, cooling core inflation and robust private final demand support the counter-argument that the economy is not overheating. Rate markets are likely to stay caught between these two competing signals rather than move decisively in either direction.
Currency Markets
Persistently elevated inflation could support higher real yields, a dollar-supportive dynamic. But the growth slowdown itself could cap dollar upside by feeding expectations of eventual policy easing.
“Profits from current production…increased $400.9 billion in the second quarter, compared with an increase of $74.4 billion in the first quarter.”
The next data point – the Third Estimate on September 30 – will show whether core inflation continues cooling or the upward revision trend seen in this report persists.
Disclaimer: This article is for informational purposes only. All investment decisions are made solely at your own risk.







