
📺 Watch the Full Video Analysis
This article was automatically generated by the NFC Market Live AI analysis system. (Updated: 2026-08-17 21:44 JST)
📄 Primary Source
NFC Market Live
https://www.newyorkfed.org/medialibrary/media/survey/empire/empire2026/2026_08_empire-state-manufacturing-survey.pdf
📊 Deep dive into the August NY Fed Empire State Manufacturing Survey.
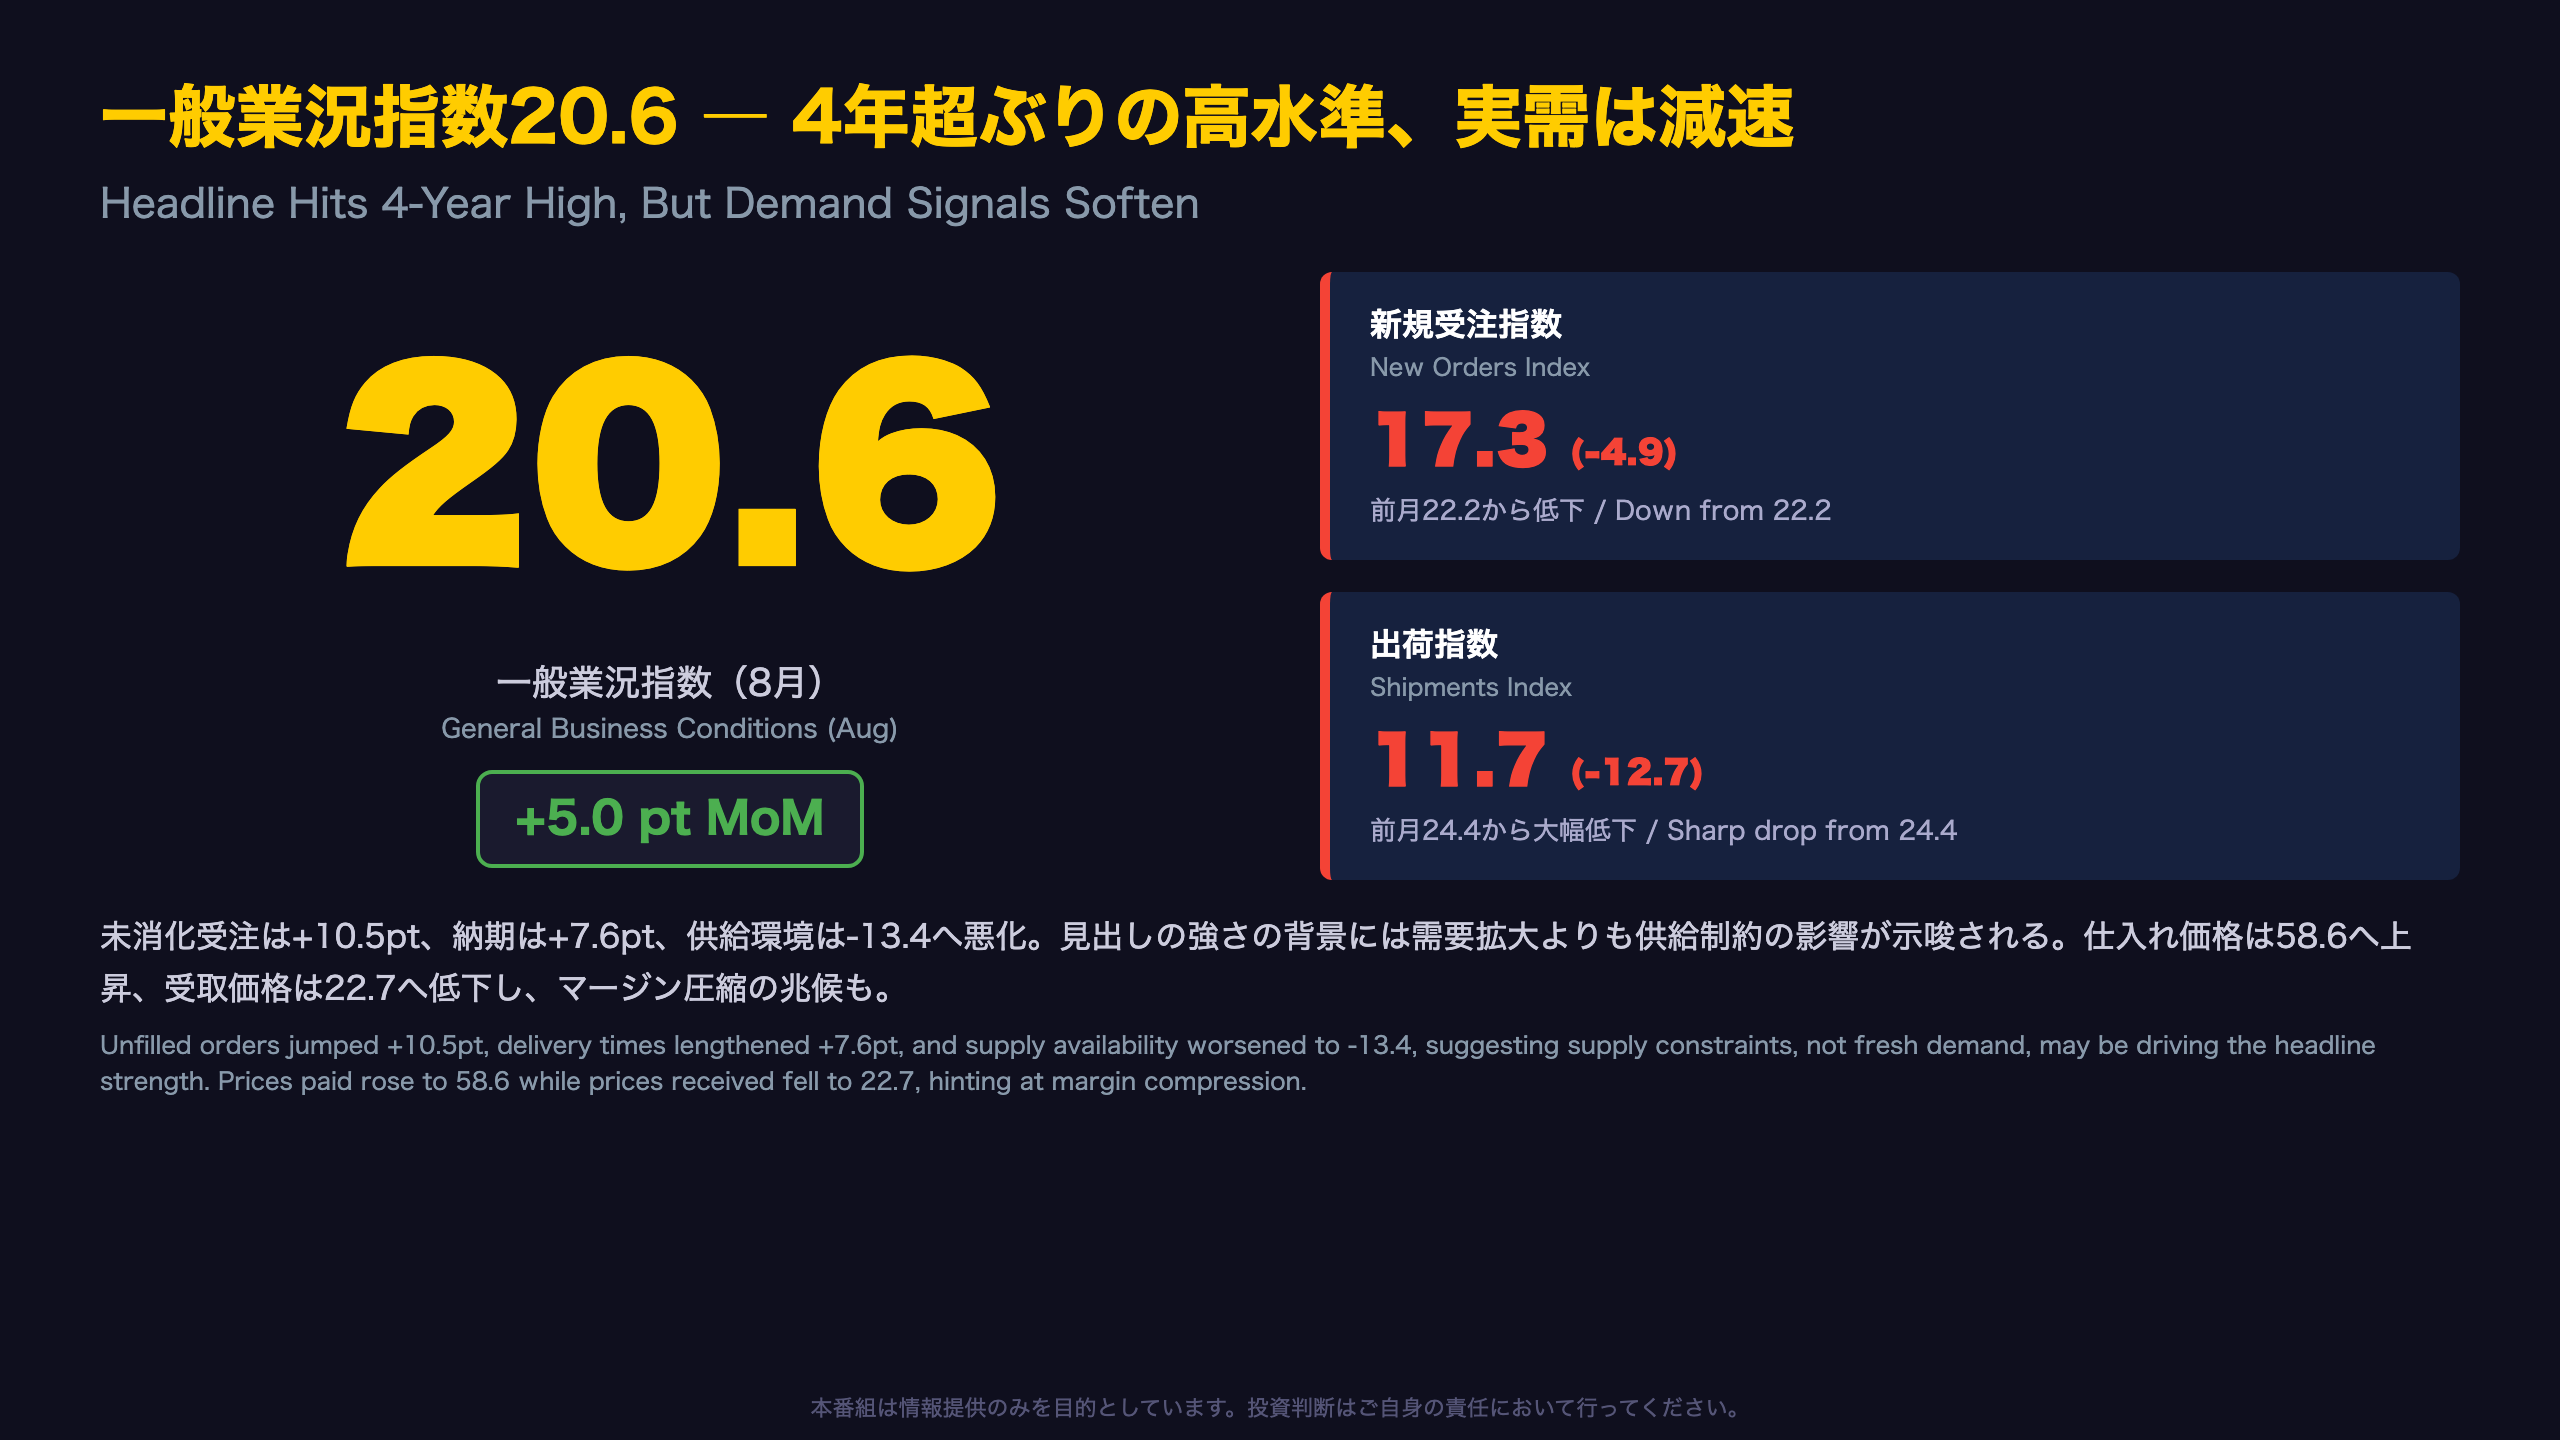
The headline General Business Conditions index jumped to 20.6, its best reading in over four years.
📉 But New Orders (17.3) and Shipments (11.7) both declined from July.
⚠️ Unfilled orders surged, delivery times lengthened, and supply availability worsened.
💡 A widening Prices Paid (58.6) vs Prices Received (22.7) gap hints at margin pressure.
What’s really behind the strong headline? We break it down.
一般業況指数20.6 ― 4年超ぶりの高水準、実需は減速
What Is the Empire State Manufacturing Survey?
The Empire State Manufacturing Survey is a monthly poll of manufacturers conducted by the Federal Reserve Bank of New York, one of the twelve regional Federal Reserve banks. It is one of the earliest regional manufacturing surveys released each month, making it a closely watched leading indicator ahead of the national ISM Manufacturing PMI. Data for this release were collected between August 3 and August 10, with 97 firms responding.
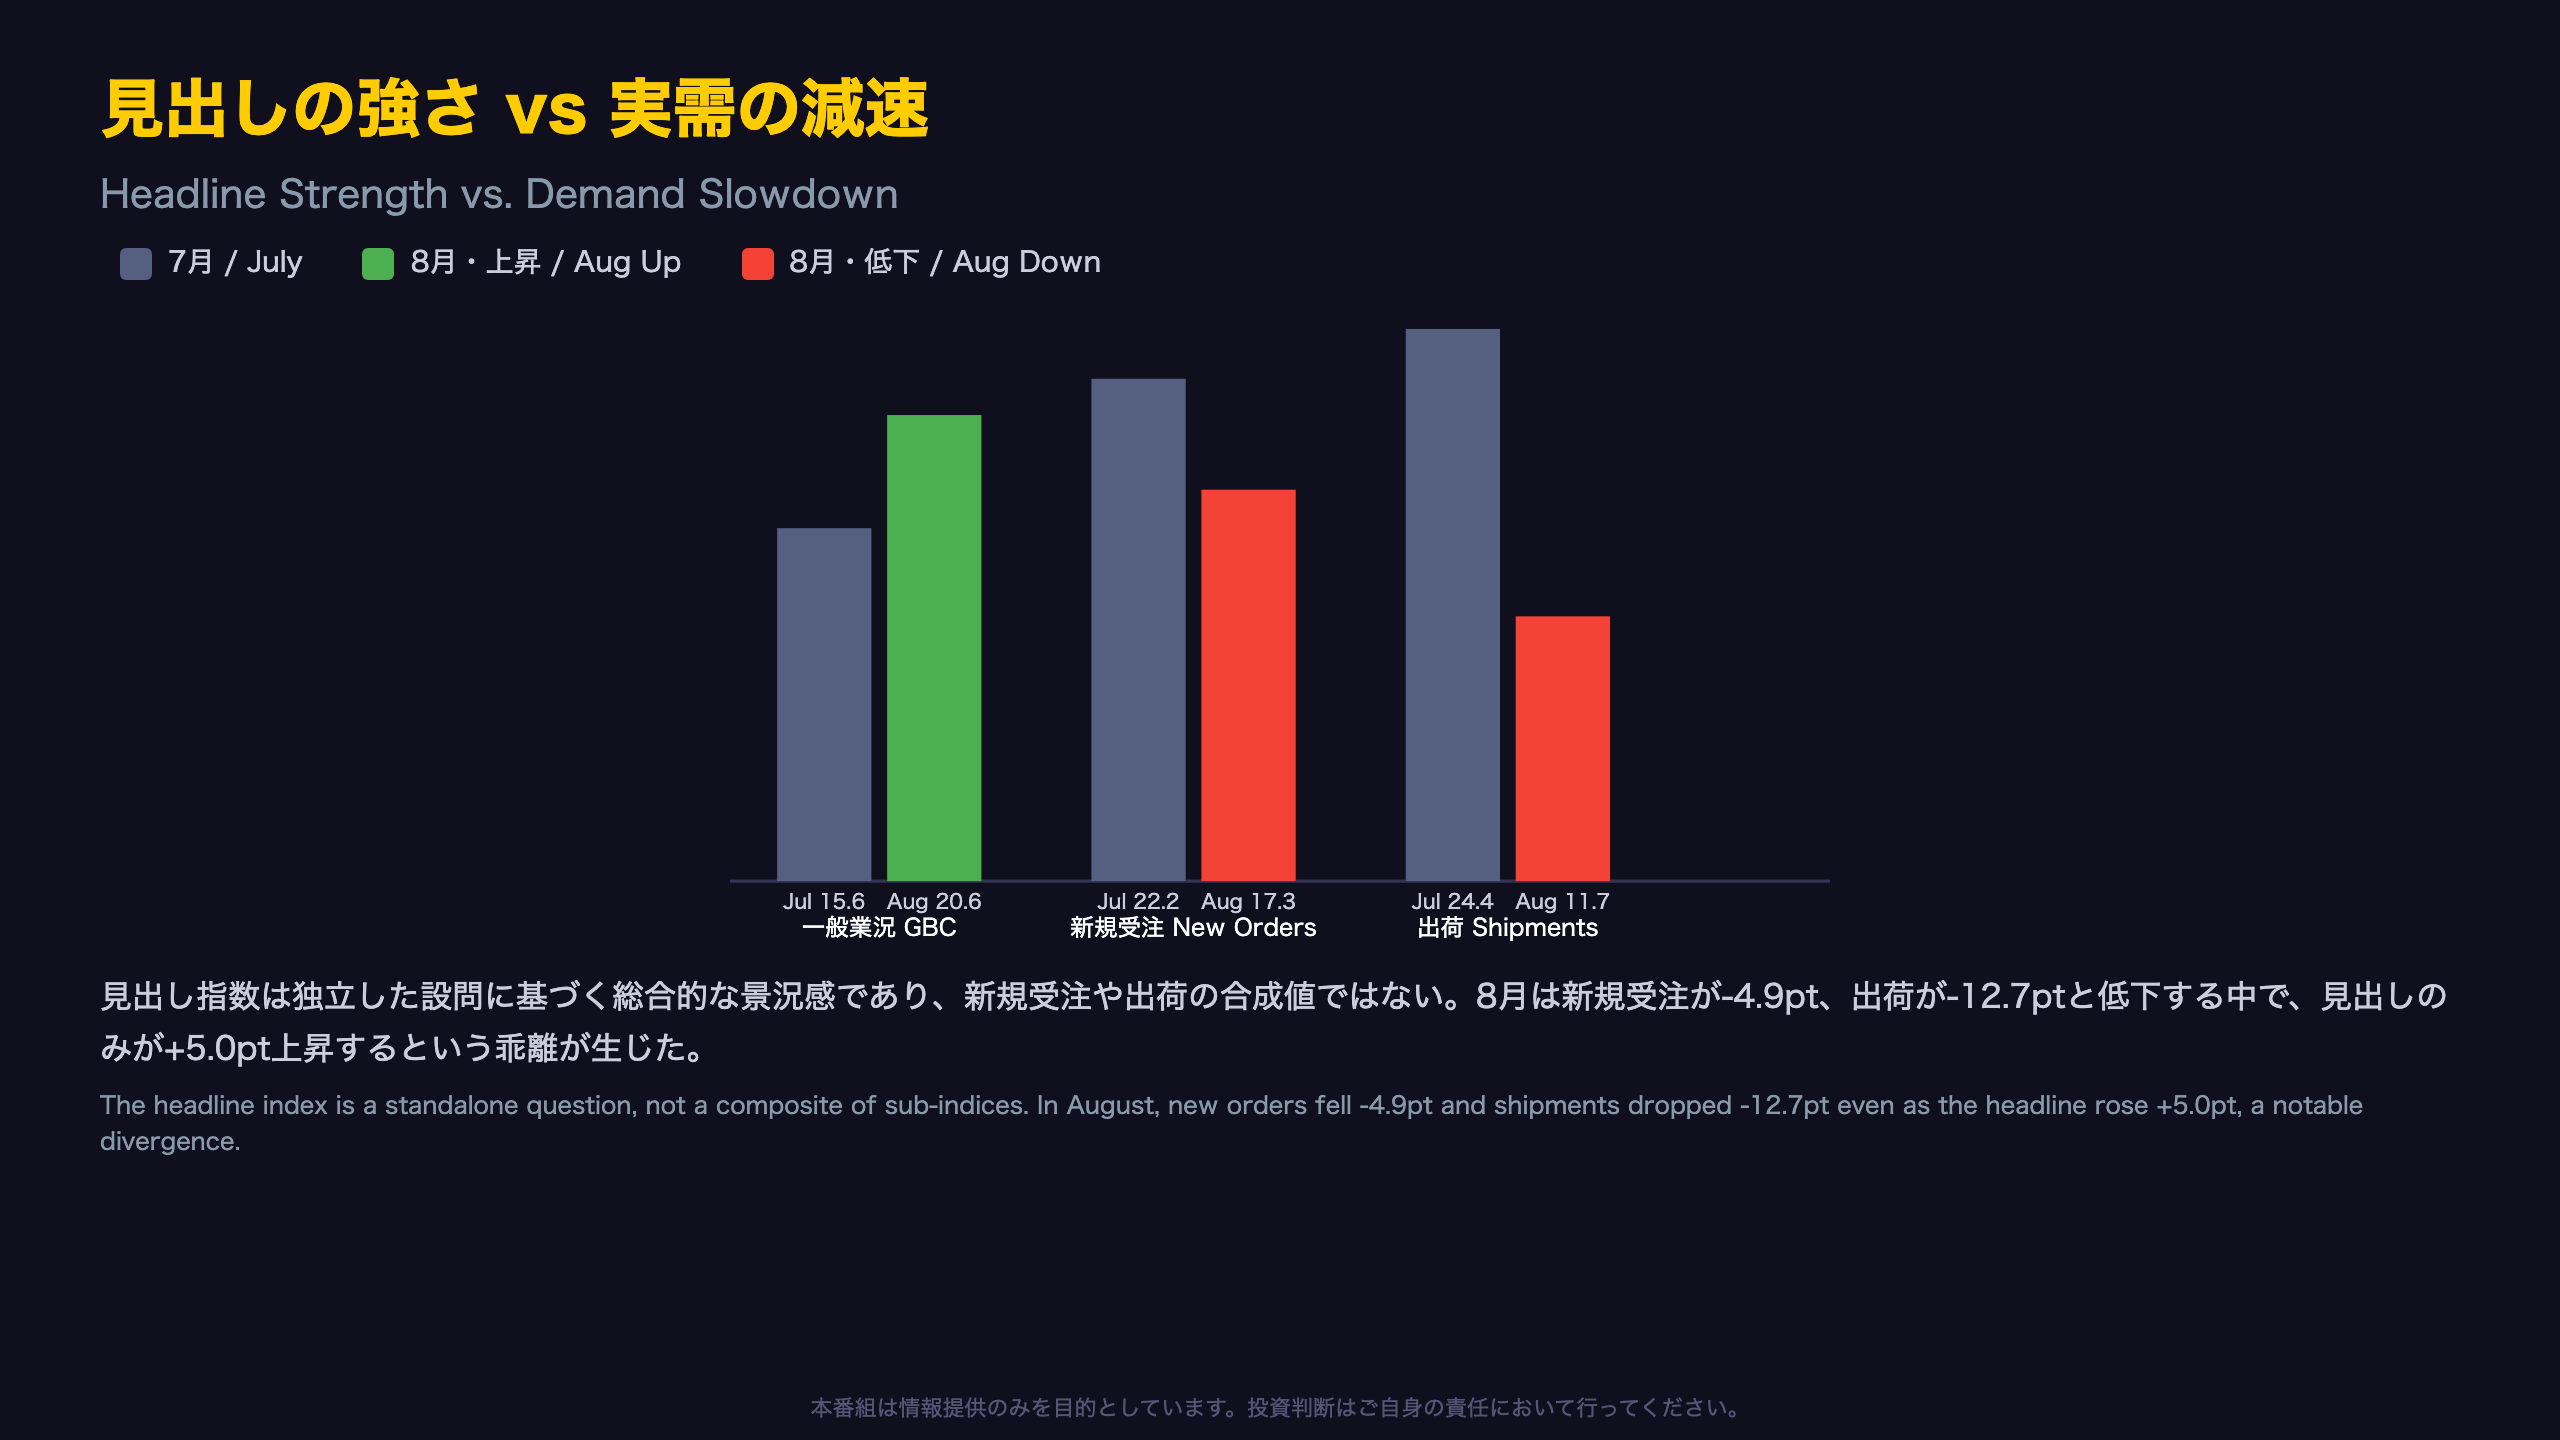
Headline vs. components: August’s General Business Conditions index rose to 20.6 (+5.0pt), its best reading since 2022. But New Orders (17.3, -4.9) and Shipments (11.7, -12.7) both fell, a divergence worth flagging because the headline is a standalone question, not built from these sub-indices.
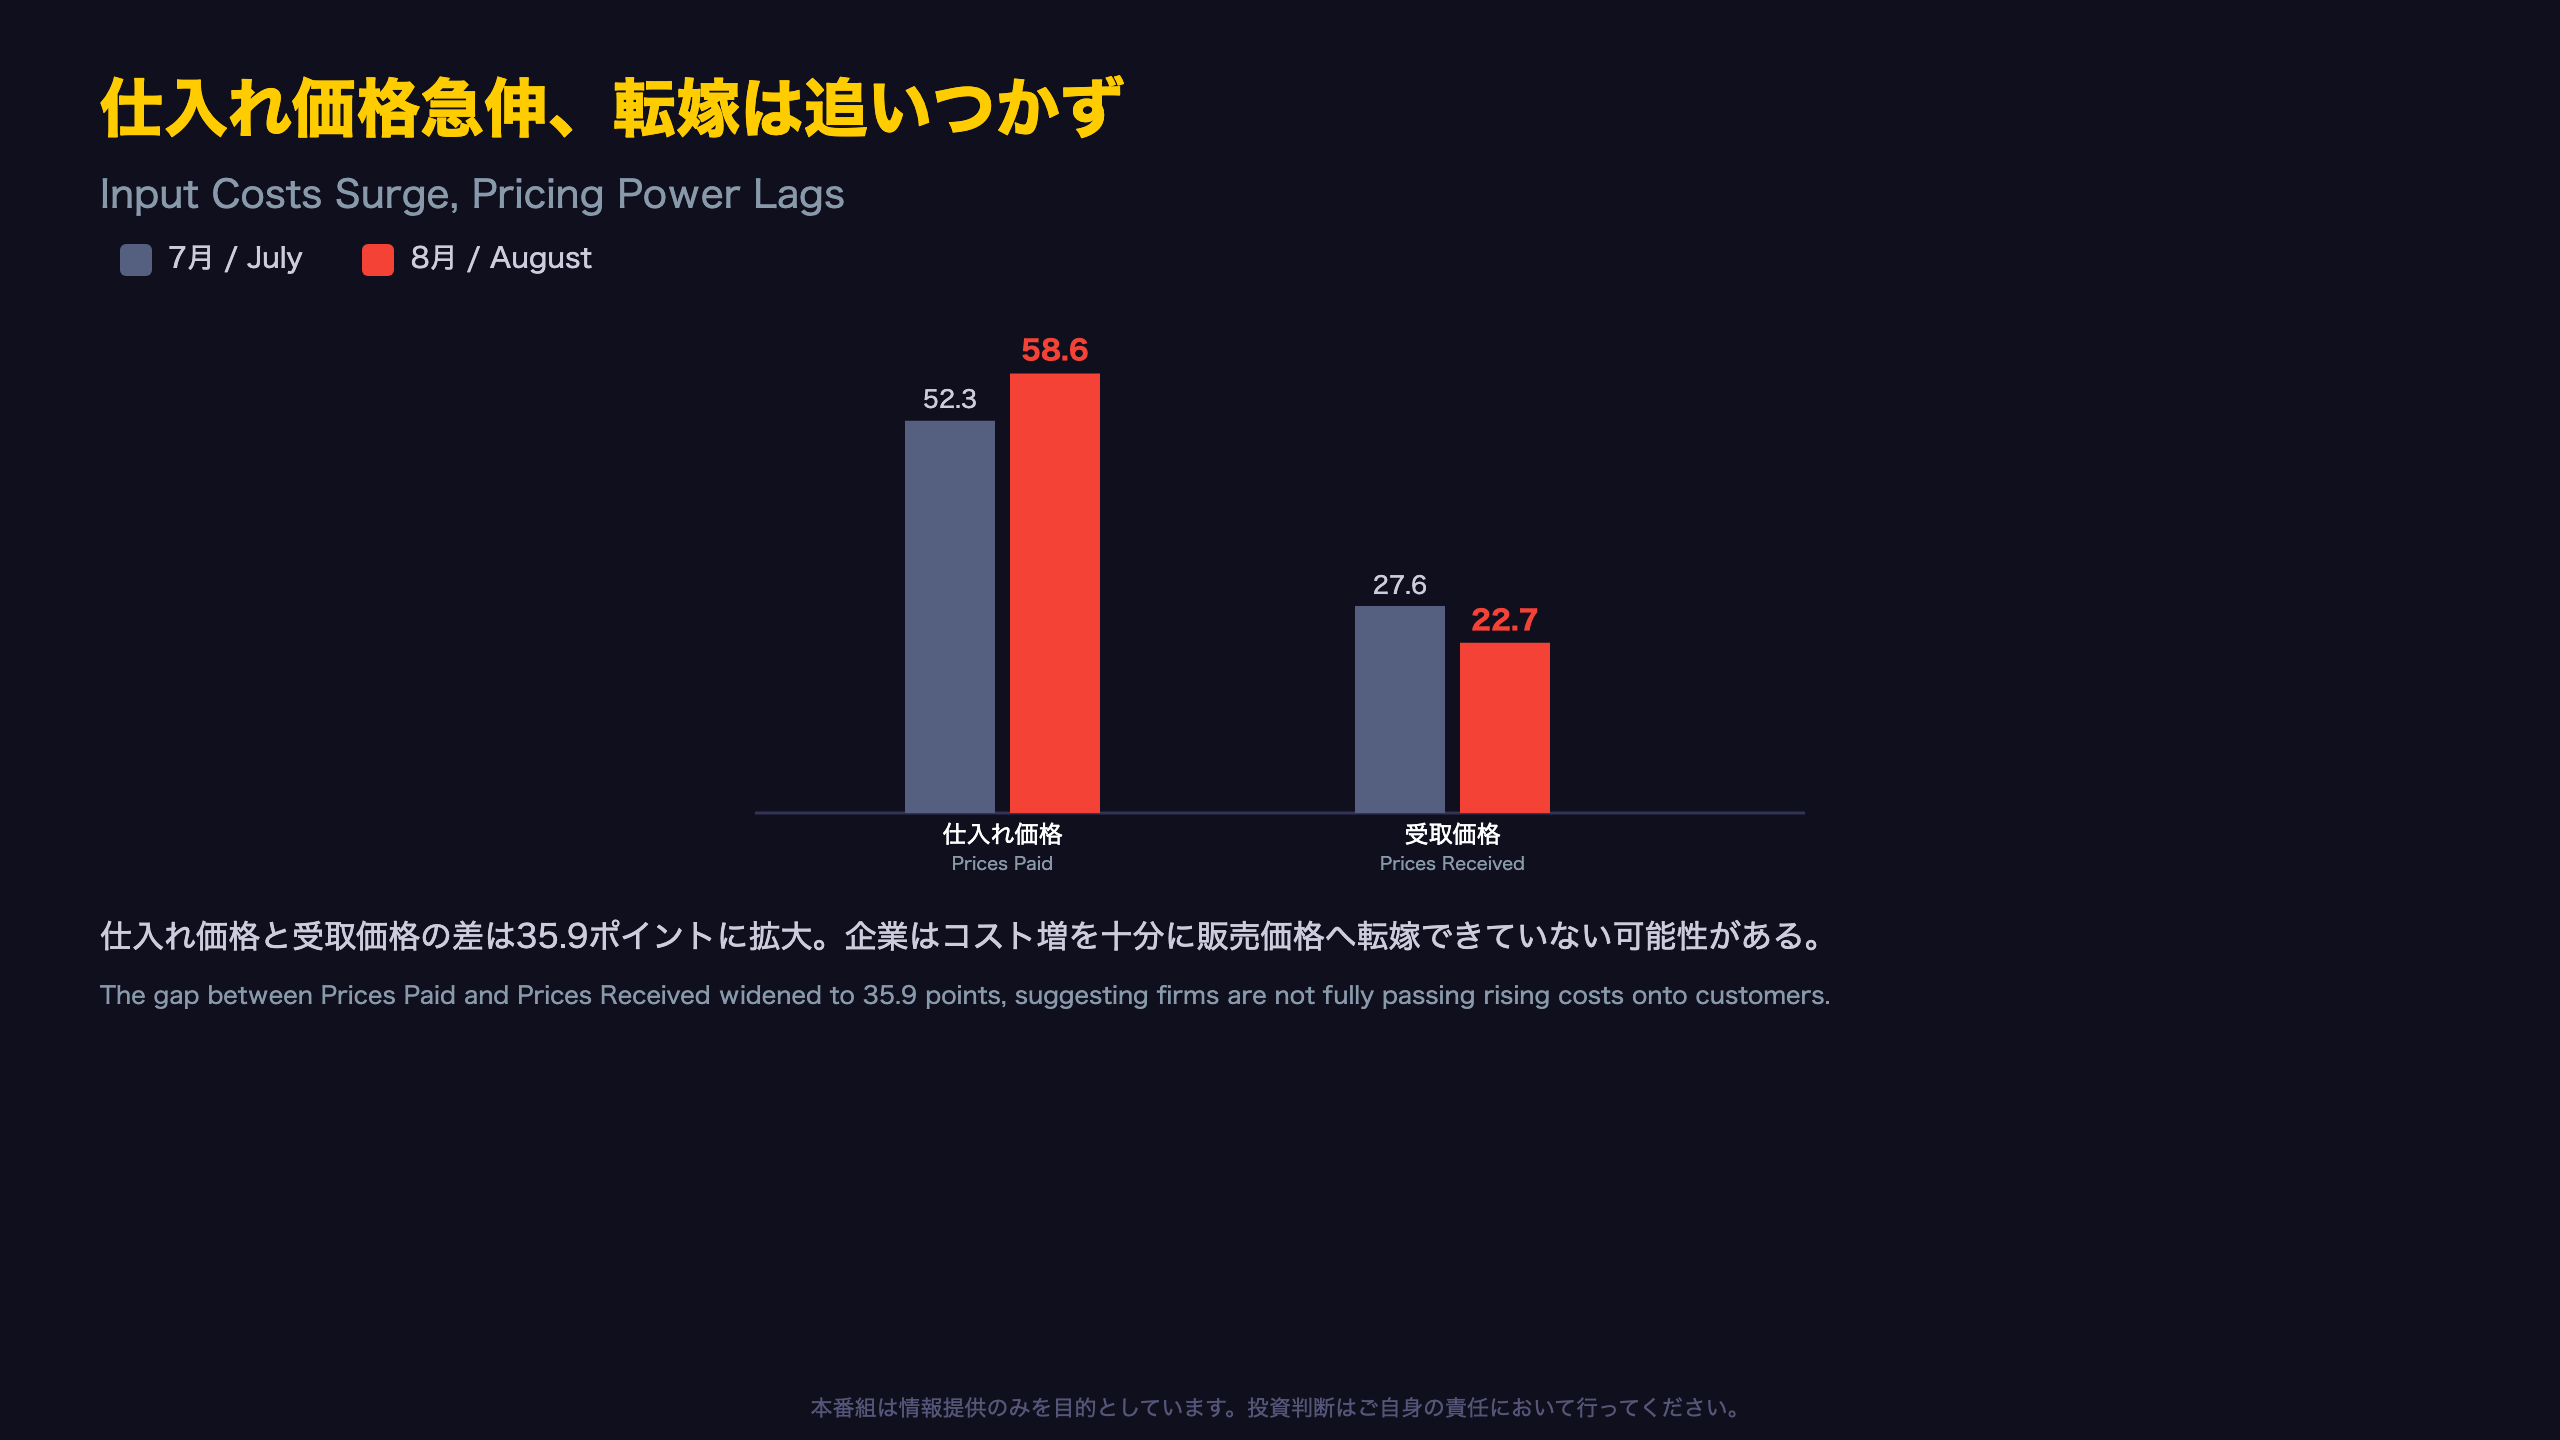
Cost pressure: Prices Paid rose to 58.6 while Prices Received slipped to 22.7, a nearly 36-point gap suggesting margin pressure on New York manufacturers.
For US investors, this print is comparable in spirit to a strong regional PMI reading that masks softer new orders, a pattern that, if repeated in ISM data, could complicate the market’s read on both growth momentum and the Fed’s inflation outlook. A single regional survey should not be extrapolated to the national manufacturing sector, but it is an early data point worth tracking into the ISM release.
見出しの強さ vs 実需の減速
Reading Between the Lines: Diffusion Index Mechanics
Empire State Survey indices are diffusion indices: each index equals the percentage of firms reporting an increase minus the percentage reporting a decrease. In August, 43.8% of firms reported improving business conditions versus 23.1% reporting worse conditions (vs. 39.0%/23.4% in July), pushing the headline index up. But for New Orders, the “improving” share fell to 39.8% from 46.4%, and for Shipments it fell to 37.4% from 45.3%.
Why this matters: Because the General Business Conditions question is asked independently of New Orders and Shipments, a firm can report better conditions for reasons unrelated to fresh customer demand, such as easing input costs, inventory drawdowns, or backlog clearance.
US comparison: This is analogous to a scenario where the ISM Manufacturing PMI headline rises while its New Orders sub-index falls, a pattern ISM watchers treat as an early warning that the composite may not reflect underlying demand strength. Since the Empire State survey typically precedes the national ISM report by roughly two weeks, this divergence is one of the first data points markets will cross-check against ISM’s own New Orders reading when it is published.
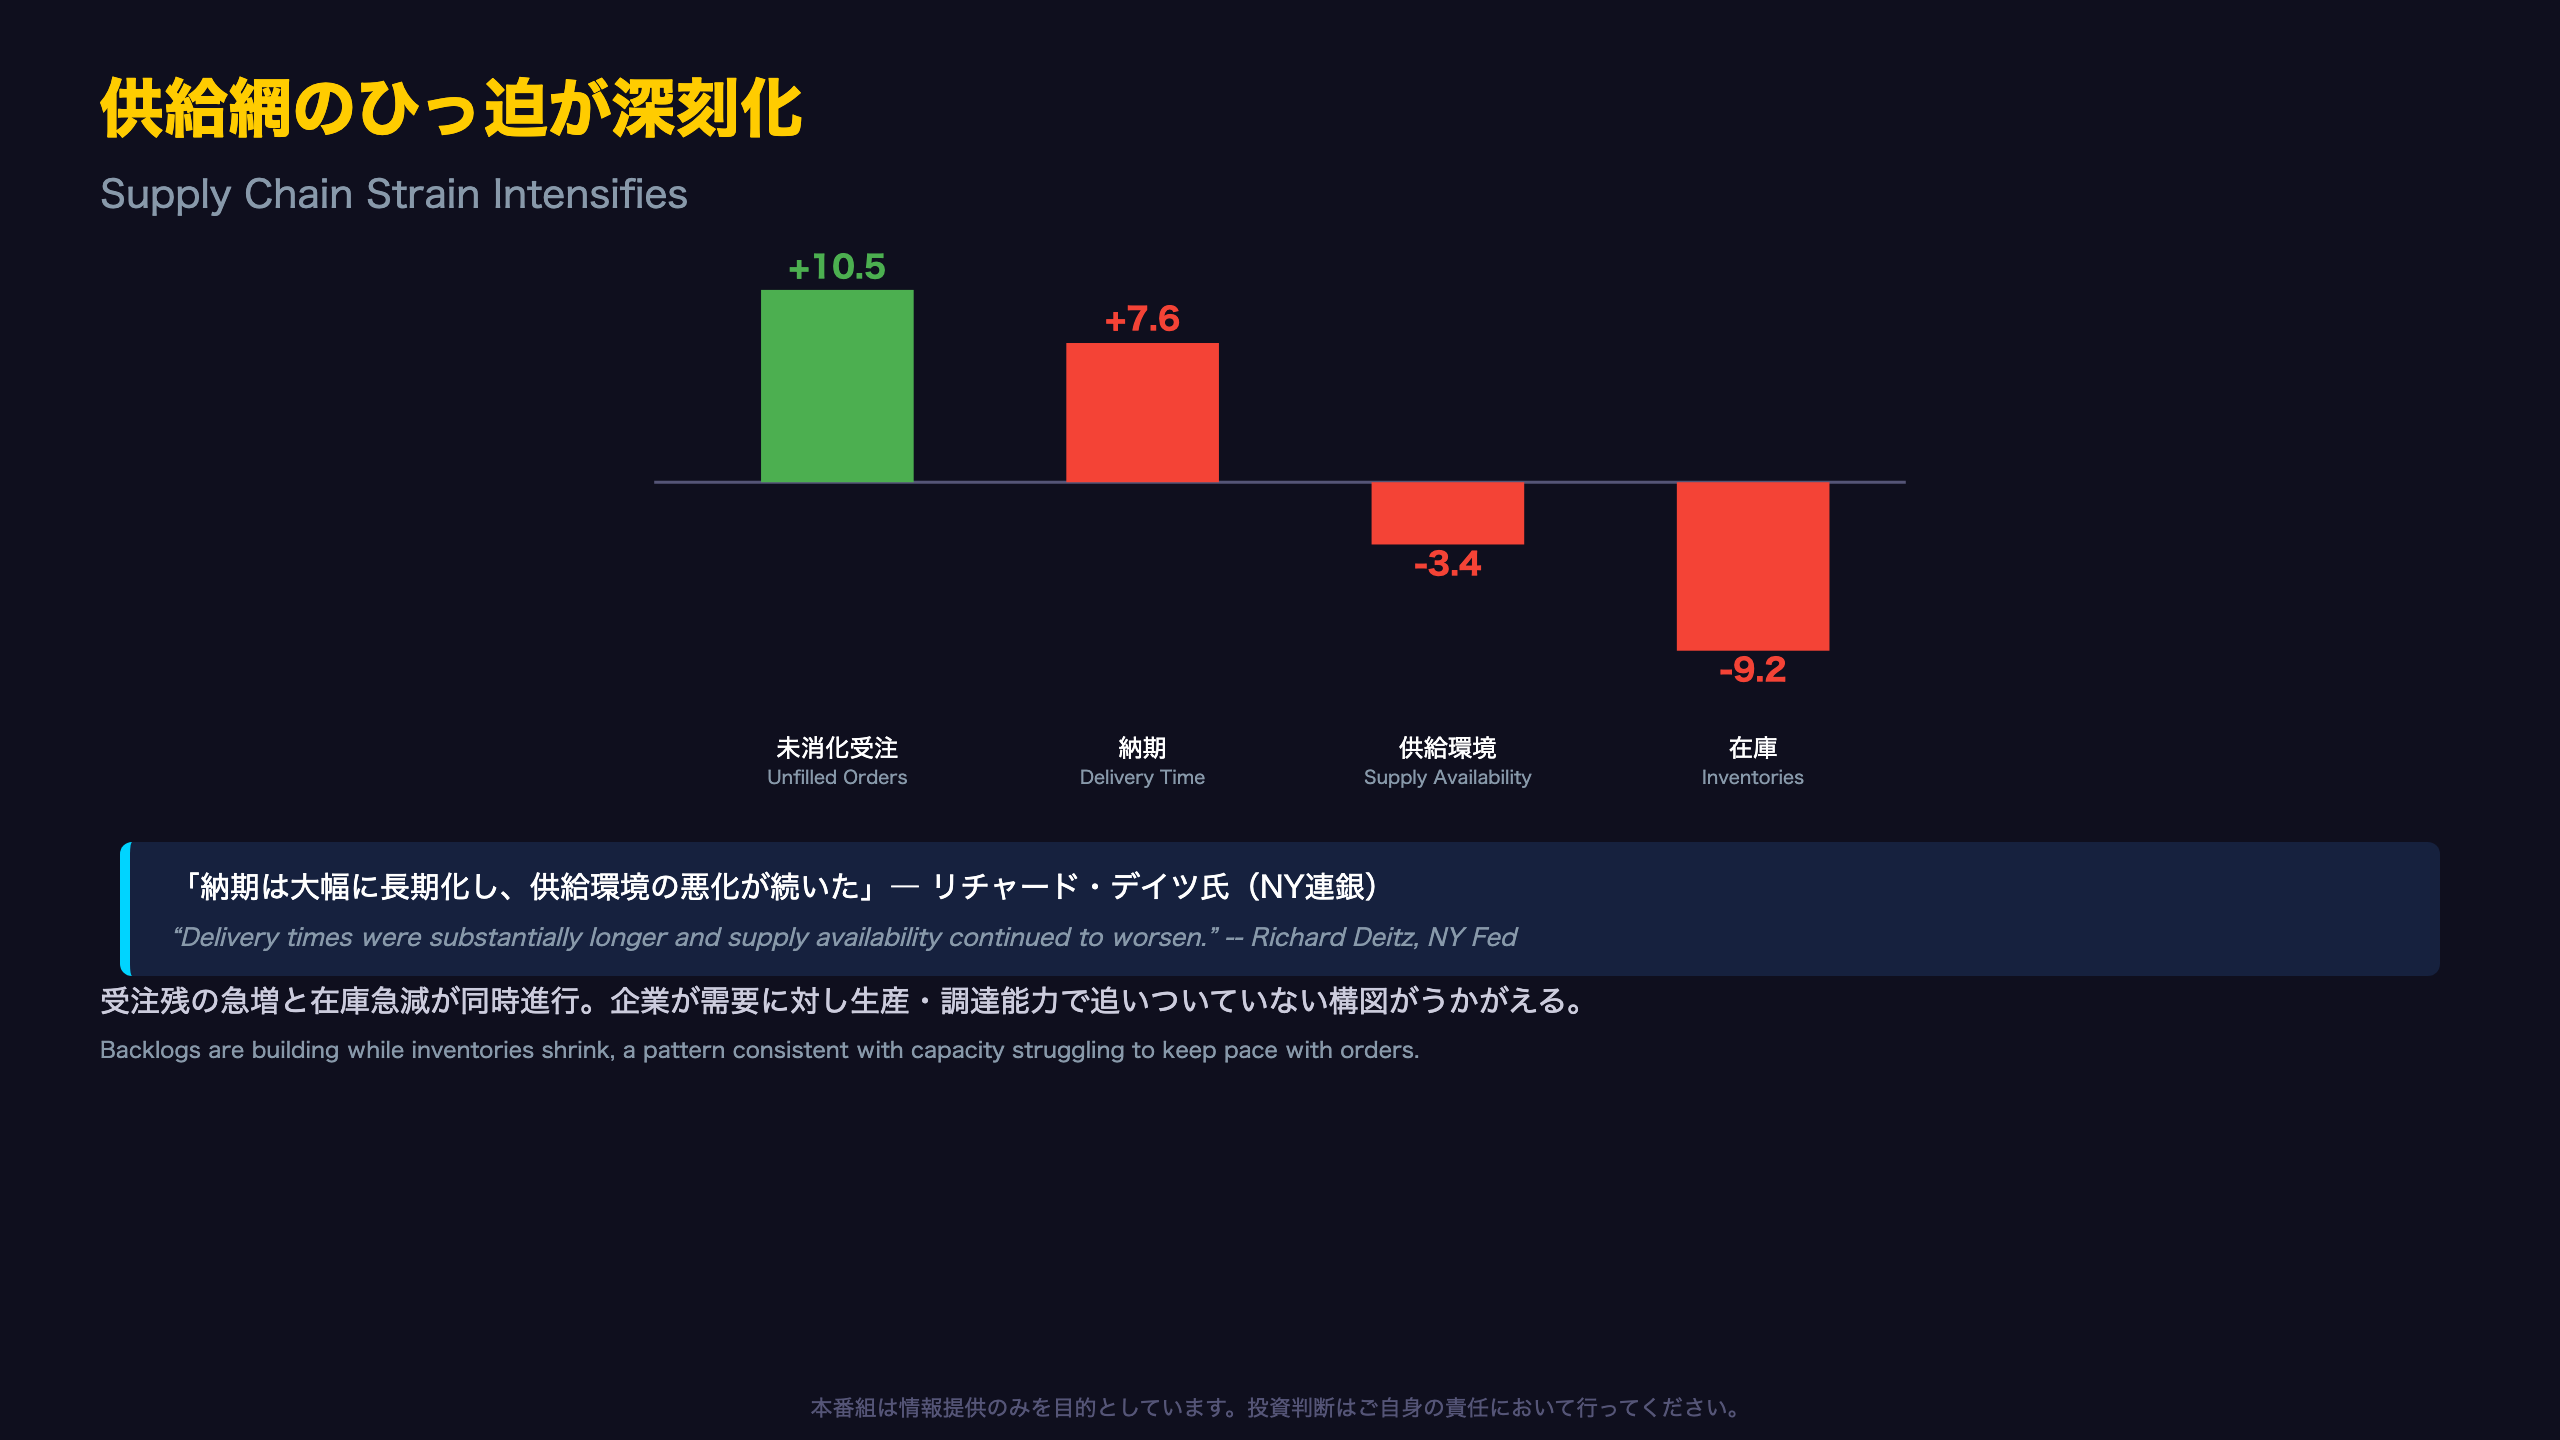
供給網のひっ迫が深刻化
Supply-Side Stress: A Newer Data Series Worth Watching
The Supply Availability index, which tracks whether firms can obtain the inputs and materials they need, was only added to the Empire State survey in June 2024, with history backfilled to 2021. In August it fell to -13.4 from -10.0, continuing a multi-month deterioration.
Richard Deitz, Economic Research Advisor at the New York Fed, said: “New York State manufacturing activity increased at its fastest pace in over four years in August… However, delivery times were substantially longer and supply availability continued to worsen.”
The backlog-inventory scissors: Unfilled Orders jumped +10.5pt to 15.5 while Inventories fell -9.2pt to -5.2, firms are accumulating backlogs while drawing down existing stock, a combination consistent with capacity constraints rather than a broad-based demand boom.
Context for US readers: This echoes supply-chain bottleneck patterns seen in 2021-2022 US manufacturing data, though at a much smaller magnitude. Whether this reflects import friction, labor shortages, or component-specific shortages is not specified in this report; sector-level detail would require the national ISM Supplier Deliveries index for comparison.
仕入れ価格急伸、転嫁は追いつかず
Margin Compression: Prices Paid vs. Prices Received
The gap between Prices Paid (58.6) and Prices Received (22.7) widened to 35.9 points in August from 24.7 points in July, an 11.2-point deterioration in a single month. This gap is a rough proxy for manufacturers’ pricing power, or lack thereof: firms are absorbing higher input costs without fully passing them on to customers.
Six-month expectations: Looking ahead, firms expect Prices Paid to rise further (57.7) but Prices Received to catch up more (48.7), narrowing the expected gap to just 9.0 points, suggesting firms anticipate improved pass-through over time rather than a permanent margin hit.
International comparison: For US investors tracking inflation risk, a widening Prices Paid/Received gap in a regional manufacturing survey is one of several early signals (alongside ISM Prices Paid) that can foreshadow producer price pressures later reflected in the national PPI. It does not, by itself, indicate a resurgence in headline CPI, since Empire State price indices are diffusion measures of direction, not magnitude.
雇用は緩やかに増加、先行き期待は大幅改善
Hours Worked as a Bridge to Hiring
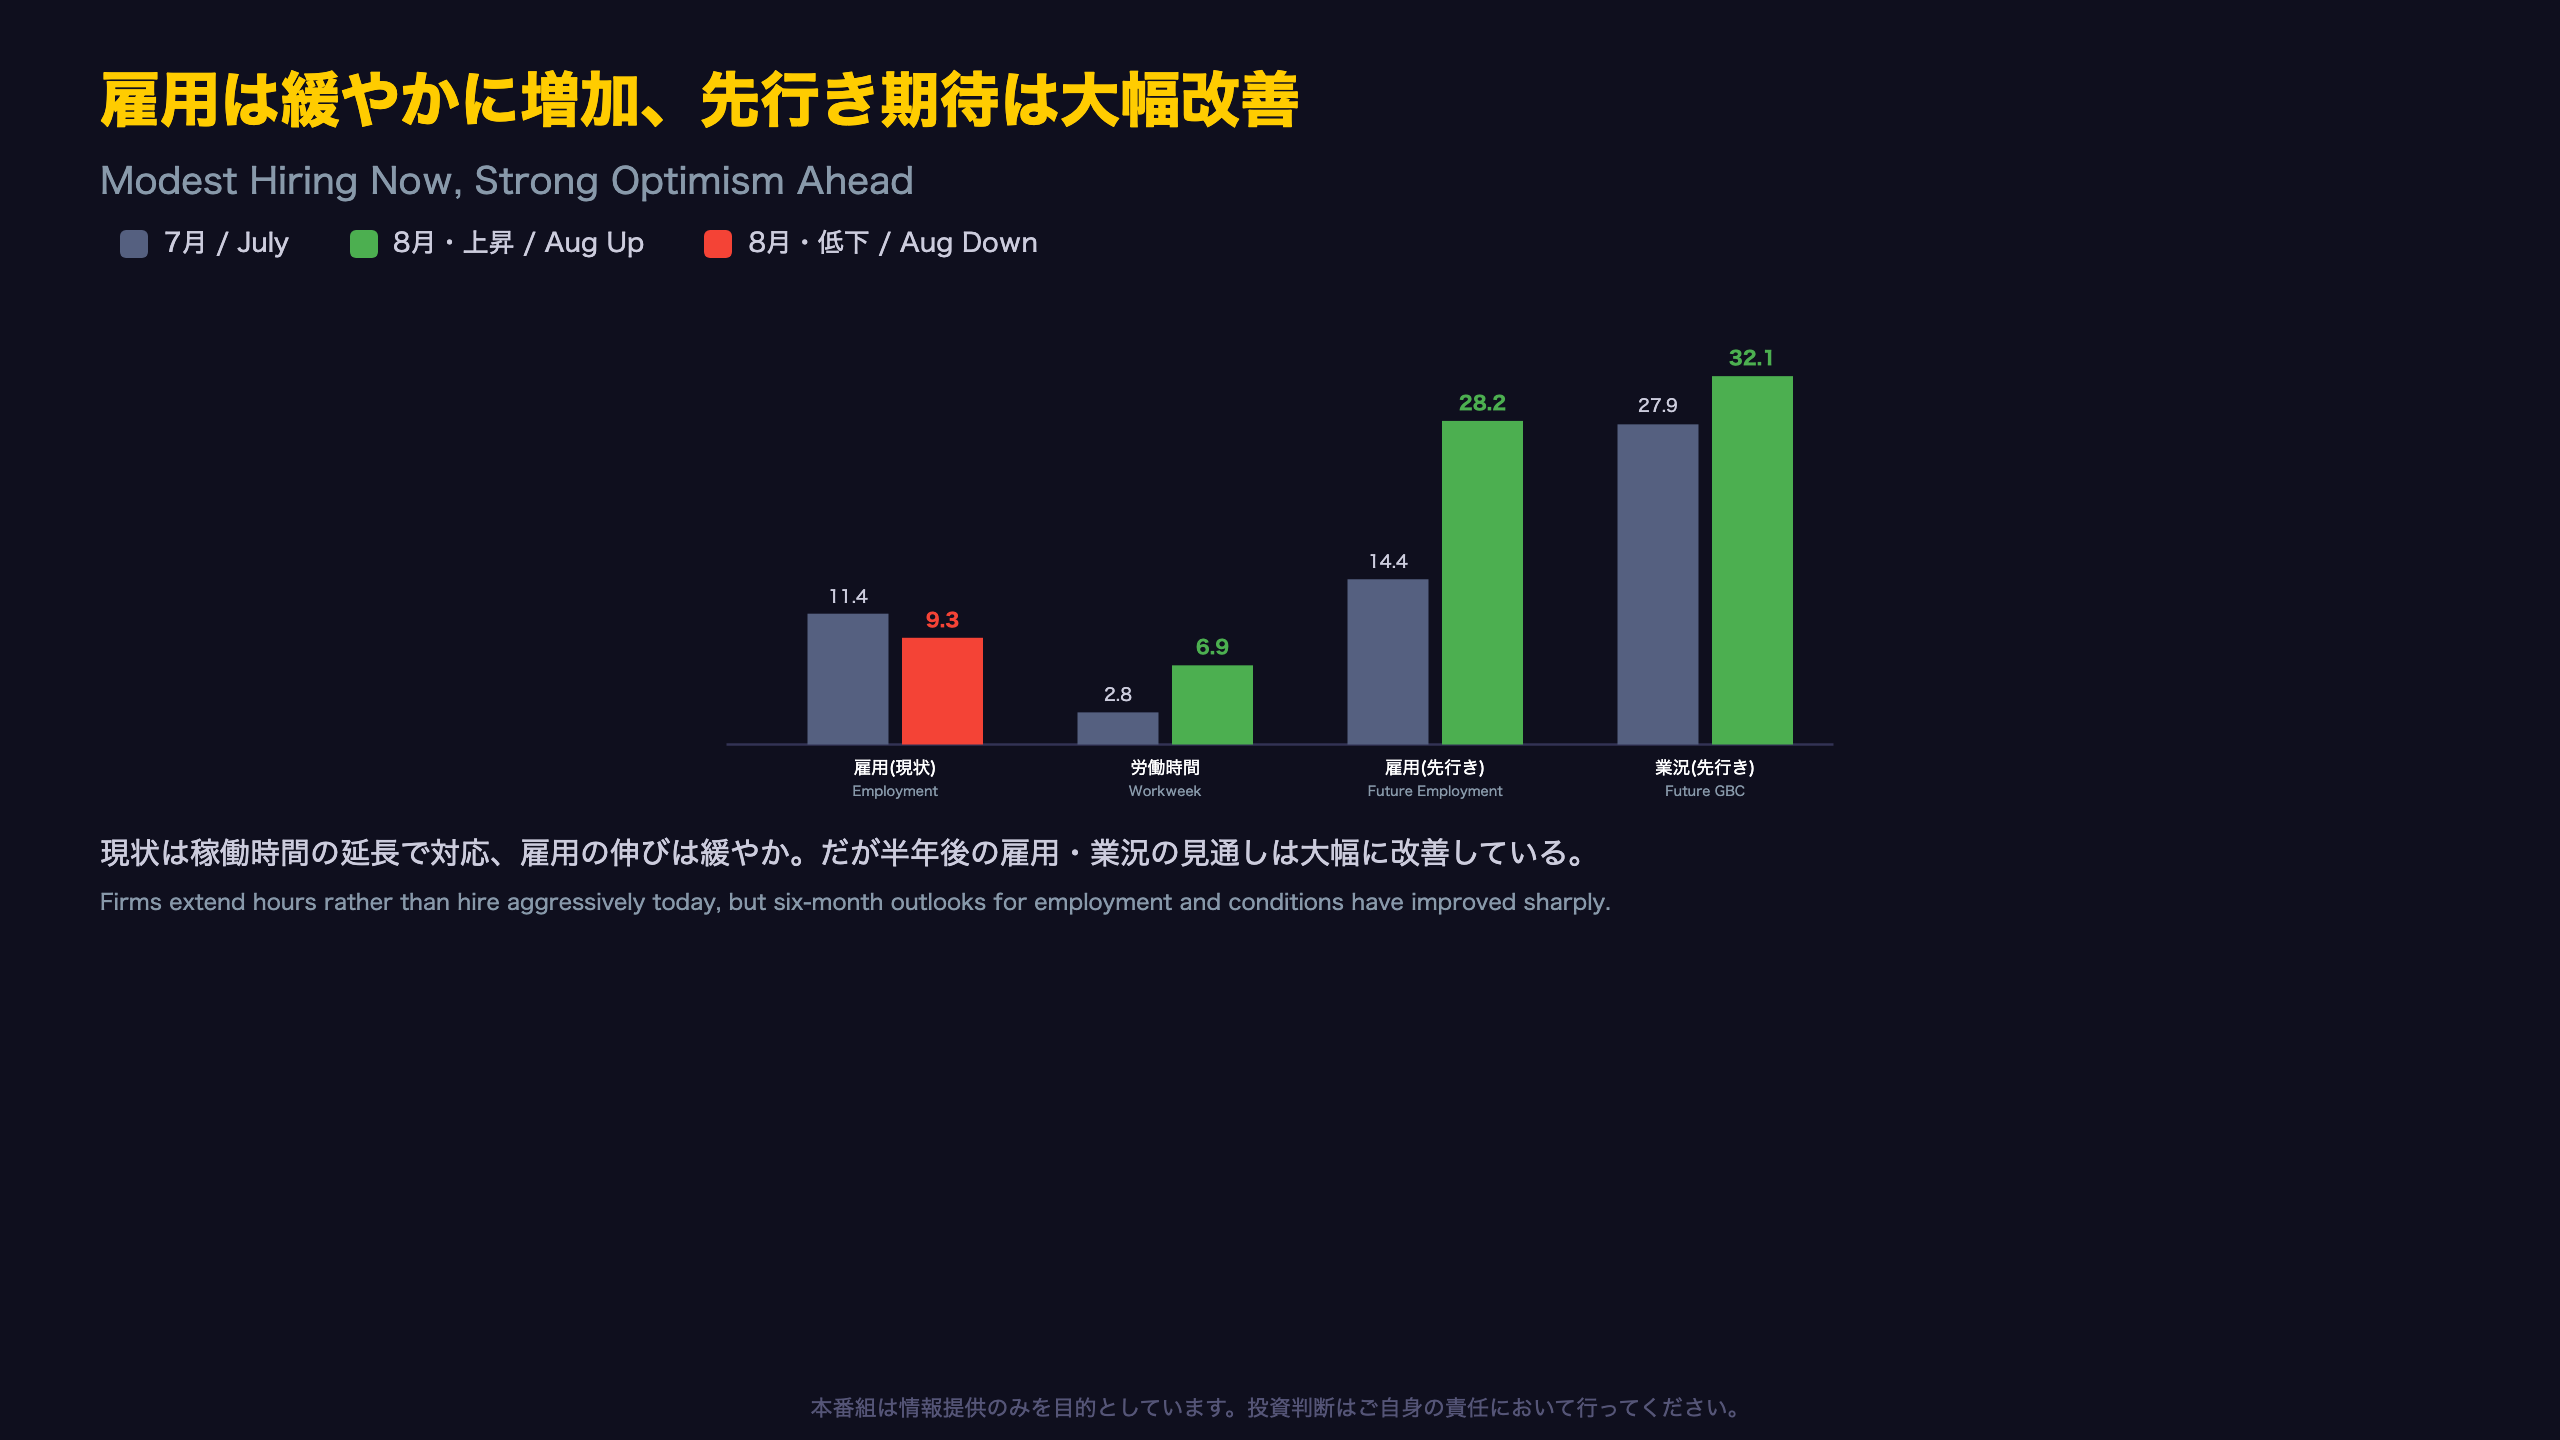
The Number of Employees index fell to 9.3 from 11.4, but the Average Workweek index rose sharply to 6.9 from 2.8. Economists often treat the workweek as a leading indicator for headcount: firms typically extend existing employees’ hours before committing to new hires, especially when demand signals are uncertain.
Six-month outlook diverges sharply from current data: The future Employment index jumped to 28.2 from 14.4, one of the largest single-month increases in this series, while future Capital Expenditures rose only modestly, to 16.5 from 15.0.
What this means for US labor-market watchers: A surge in hiring intentions without a matching rise in capex plans suggests firms expect to need more labor without committing to expanded physical capacity, a pattern that, if confirmed in coming months, would be more consistent with backlog-clearing hires than with a structural capacity expansion. This regional data point precedes the national JOLTS and nonfarm payrolls releases, but should not be used to forecast them directly.
FRBと市場への含意
Why the Fed Will Read This Report Carefully
The Empire State Manufacturing Survey does not directly drive FOMC decisions, but regional Fed surveys are referenced in the Fed’s Beige Book and inform staff’s real-time read on regional economic conditions between employment and CPI releases.
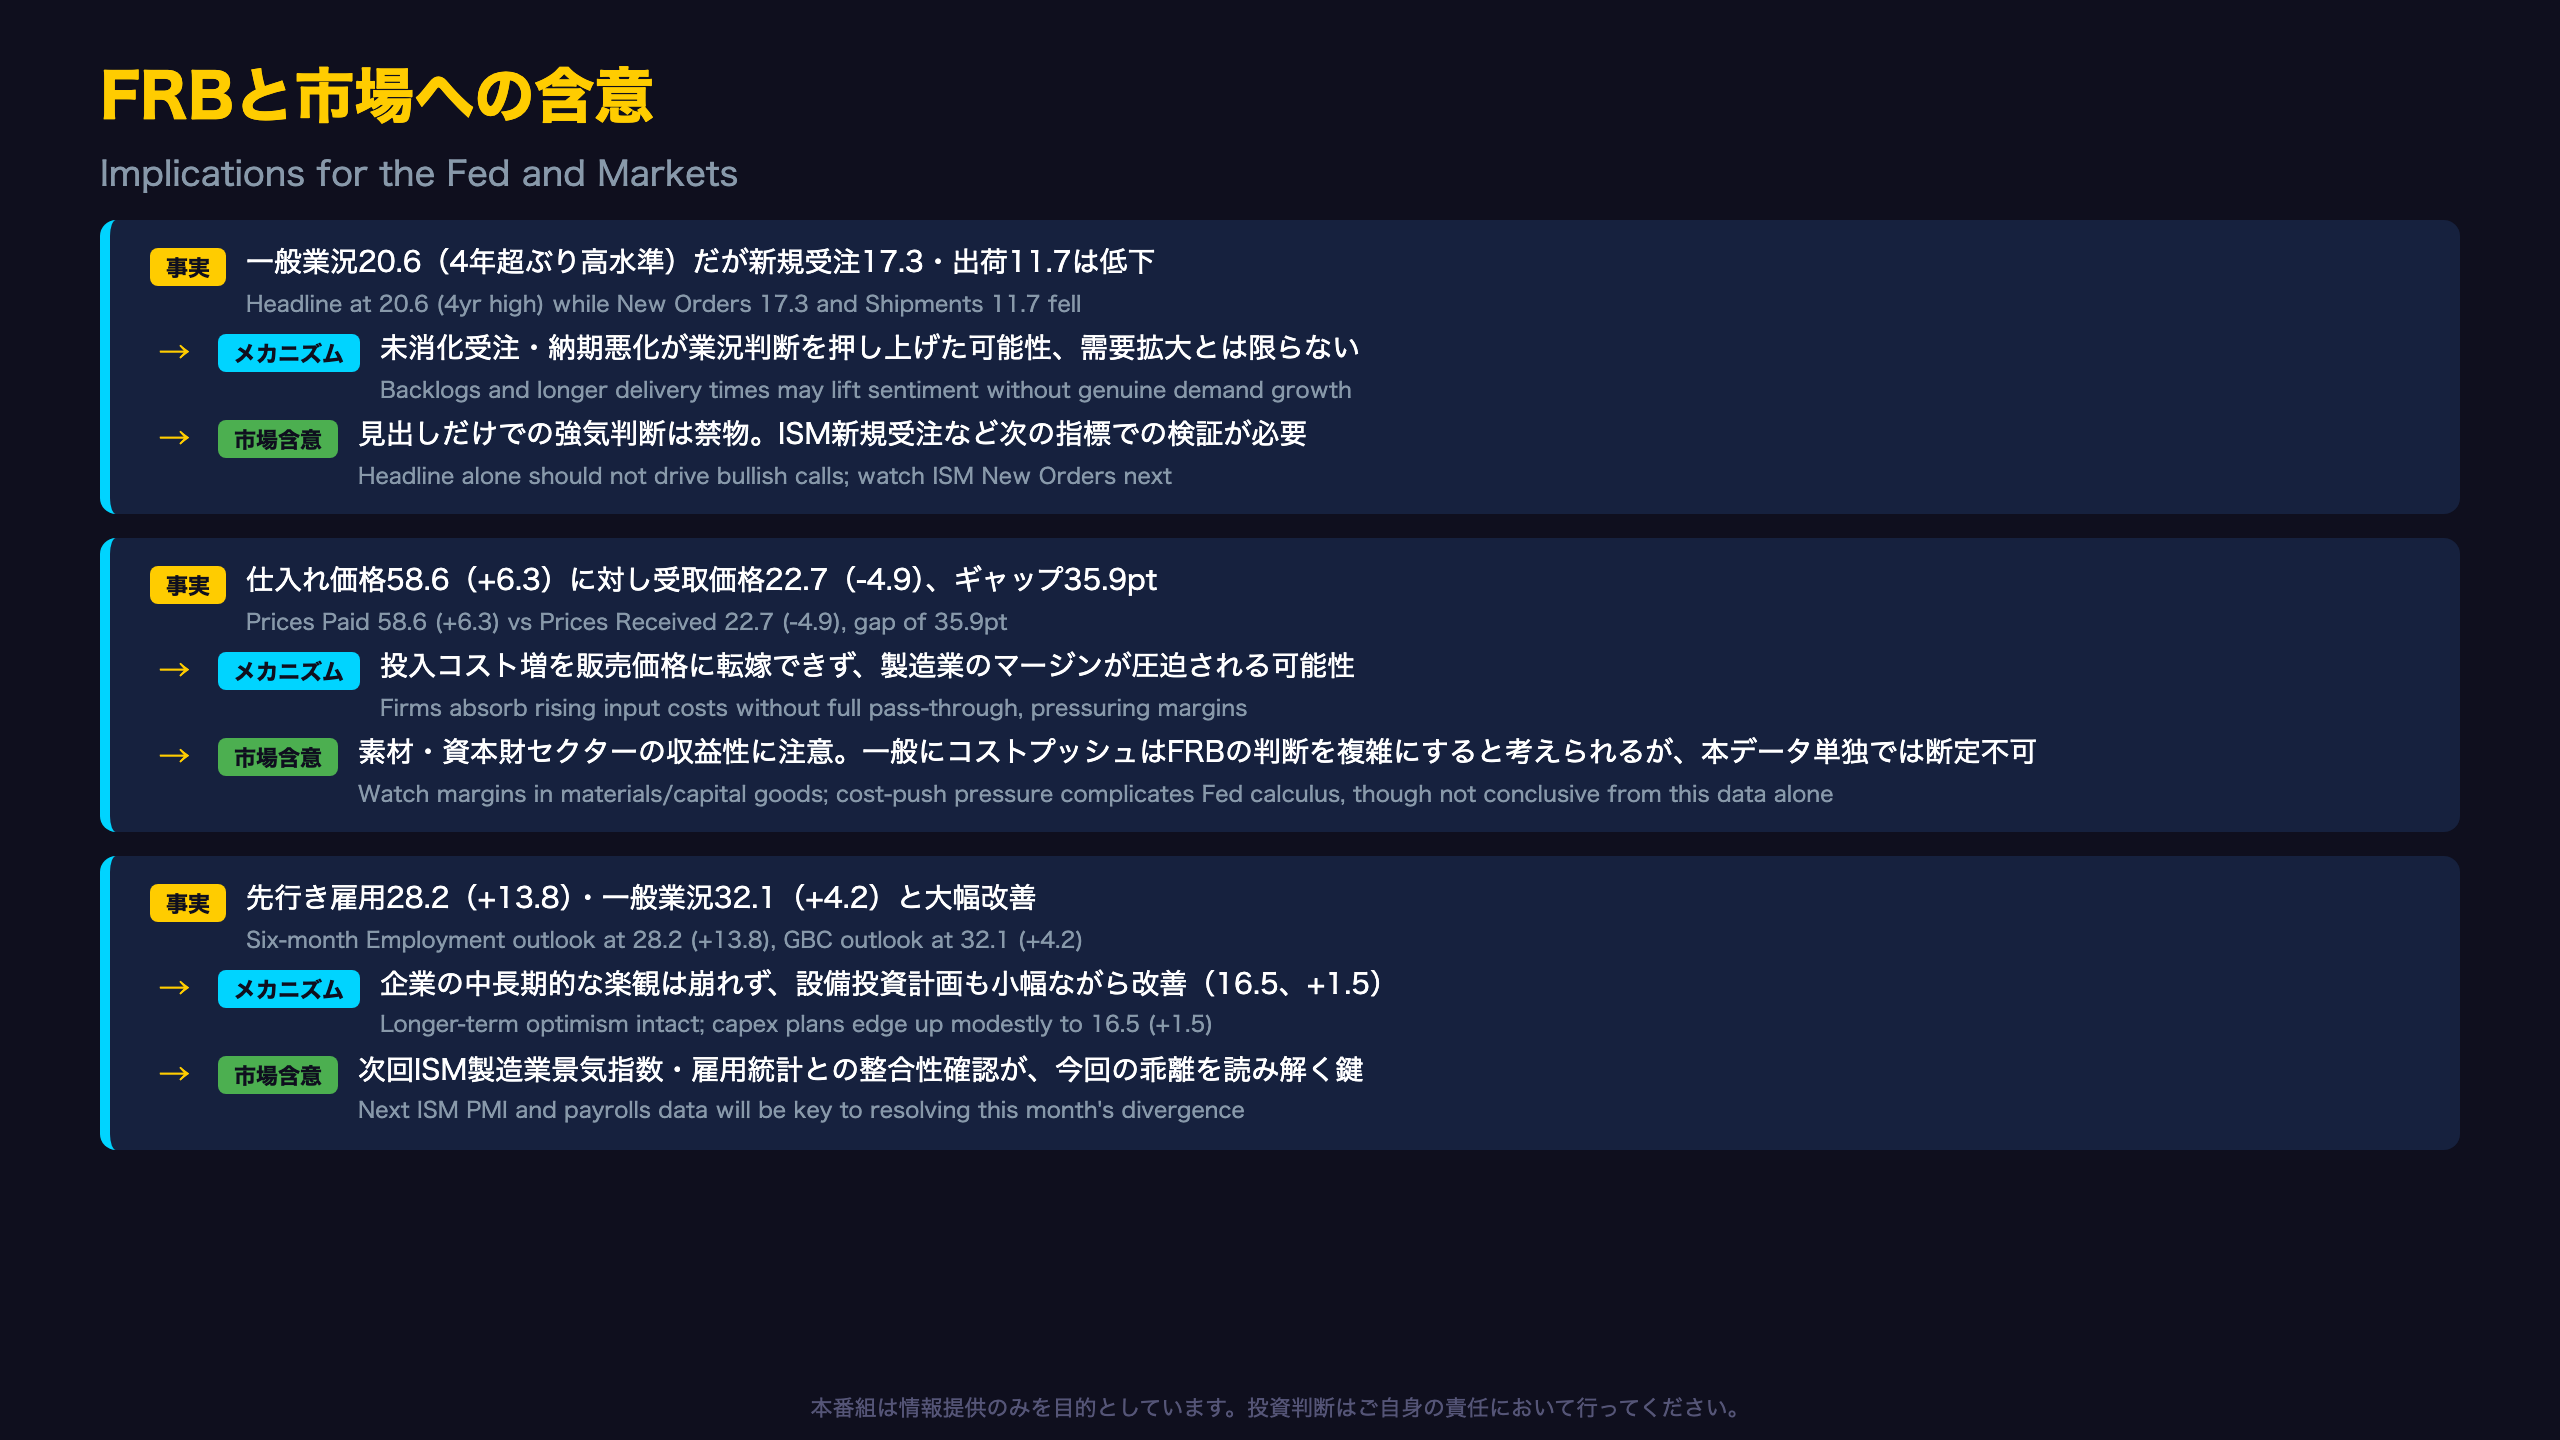
This month’s report presents the Fed with a genuinely mixed signal: a four-year-high headline reading alongside falling New Orders and Shipments, worsening supply availability, and a widening Prices Paid/Received gap. It is commonly believed that supply-driven cost pressure complicates a central bank’s ability to cut rates without risking a reacceleration in inflation, but this single regional survey, covering only 97 firms in one Fed district, cannot on its own determine the Fed’s policy path.
What to watch next: The national ISM Manufacturing PMI (typically released in the following days) and the New York Fed’s next Empire State release will show whether this month’s divergence between headline sentiment and hard order/shipment data persists or resolves.
Disclaimer: This article is for informational purposes only. All investment decisions are made solely at your own risk.







