📺 Watch the Full Video Analysis
This article was automatically generated by the NFC Market Live AI analysis system. (Updated: 2026-08-18 15:51 JST)
📄 Primary Source
Office for National Statistics
https://www.ons.gov.uk/employmentandlabourmarket/peopleinwork/employmentandemployeetypes/bulletins/uklabourmarket/latest
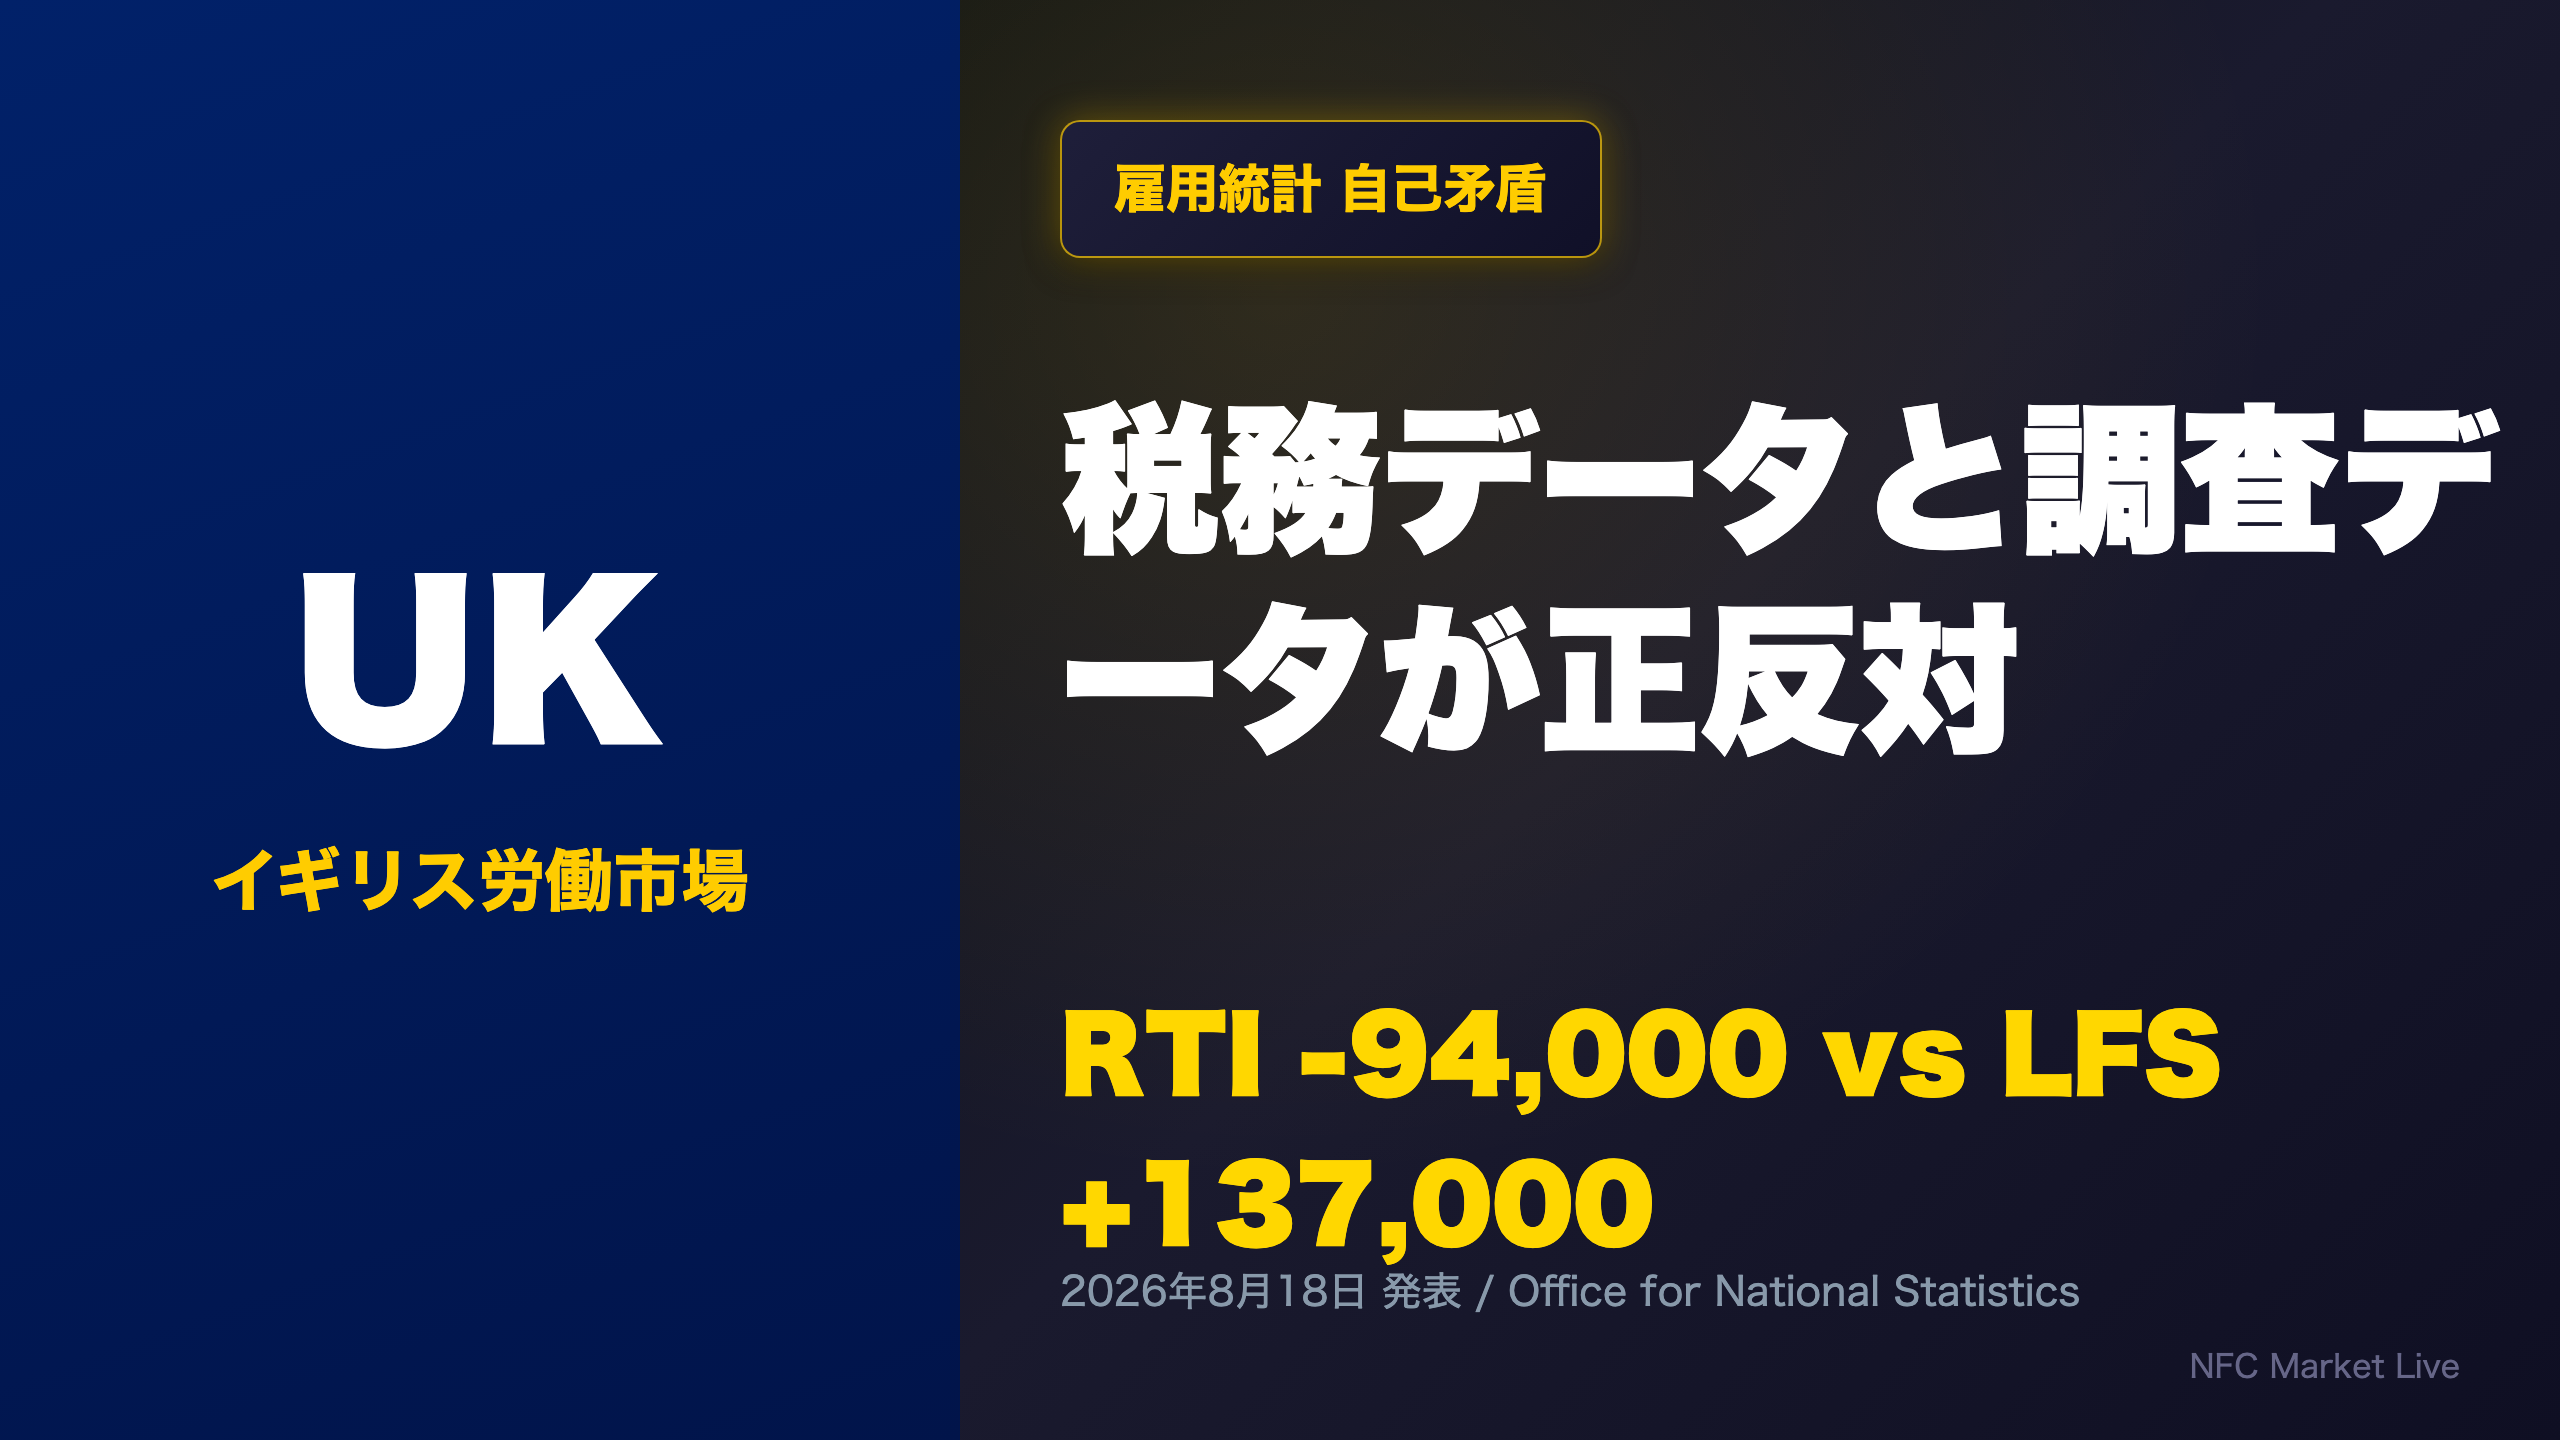
The UK’s official labour statistics are contradicting themselves.
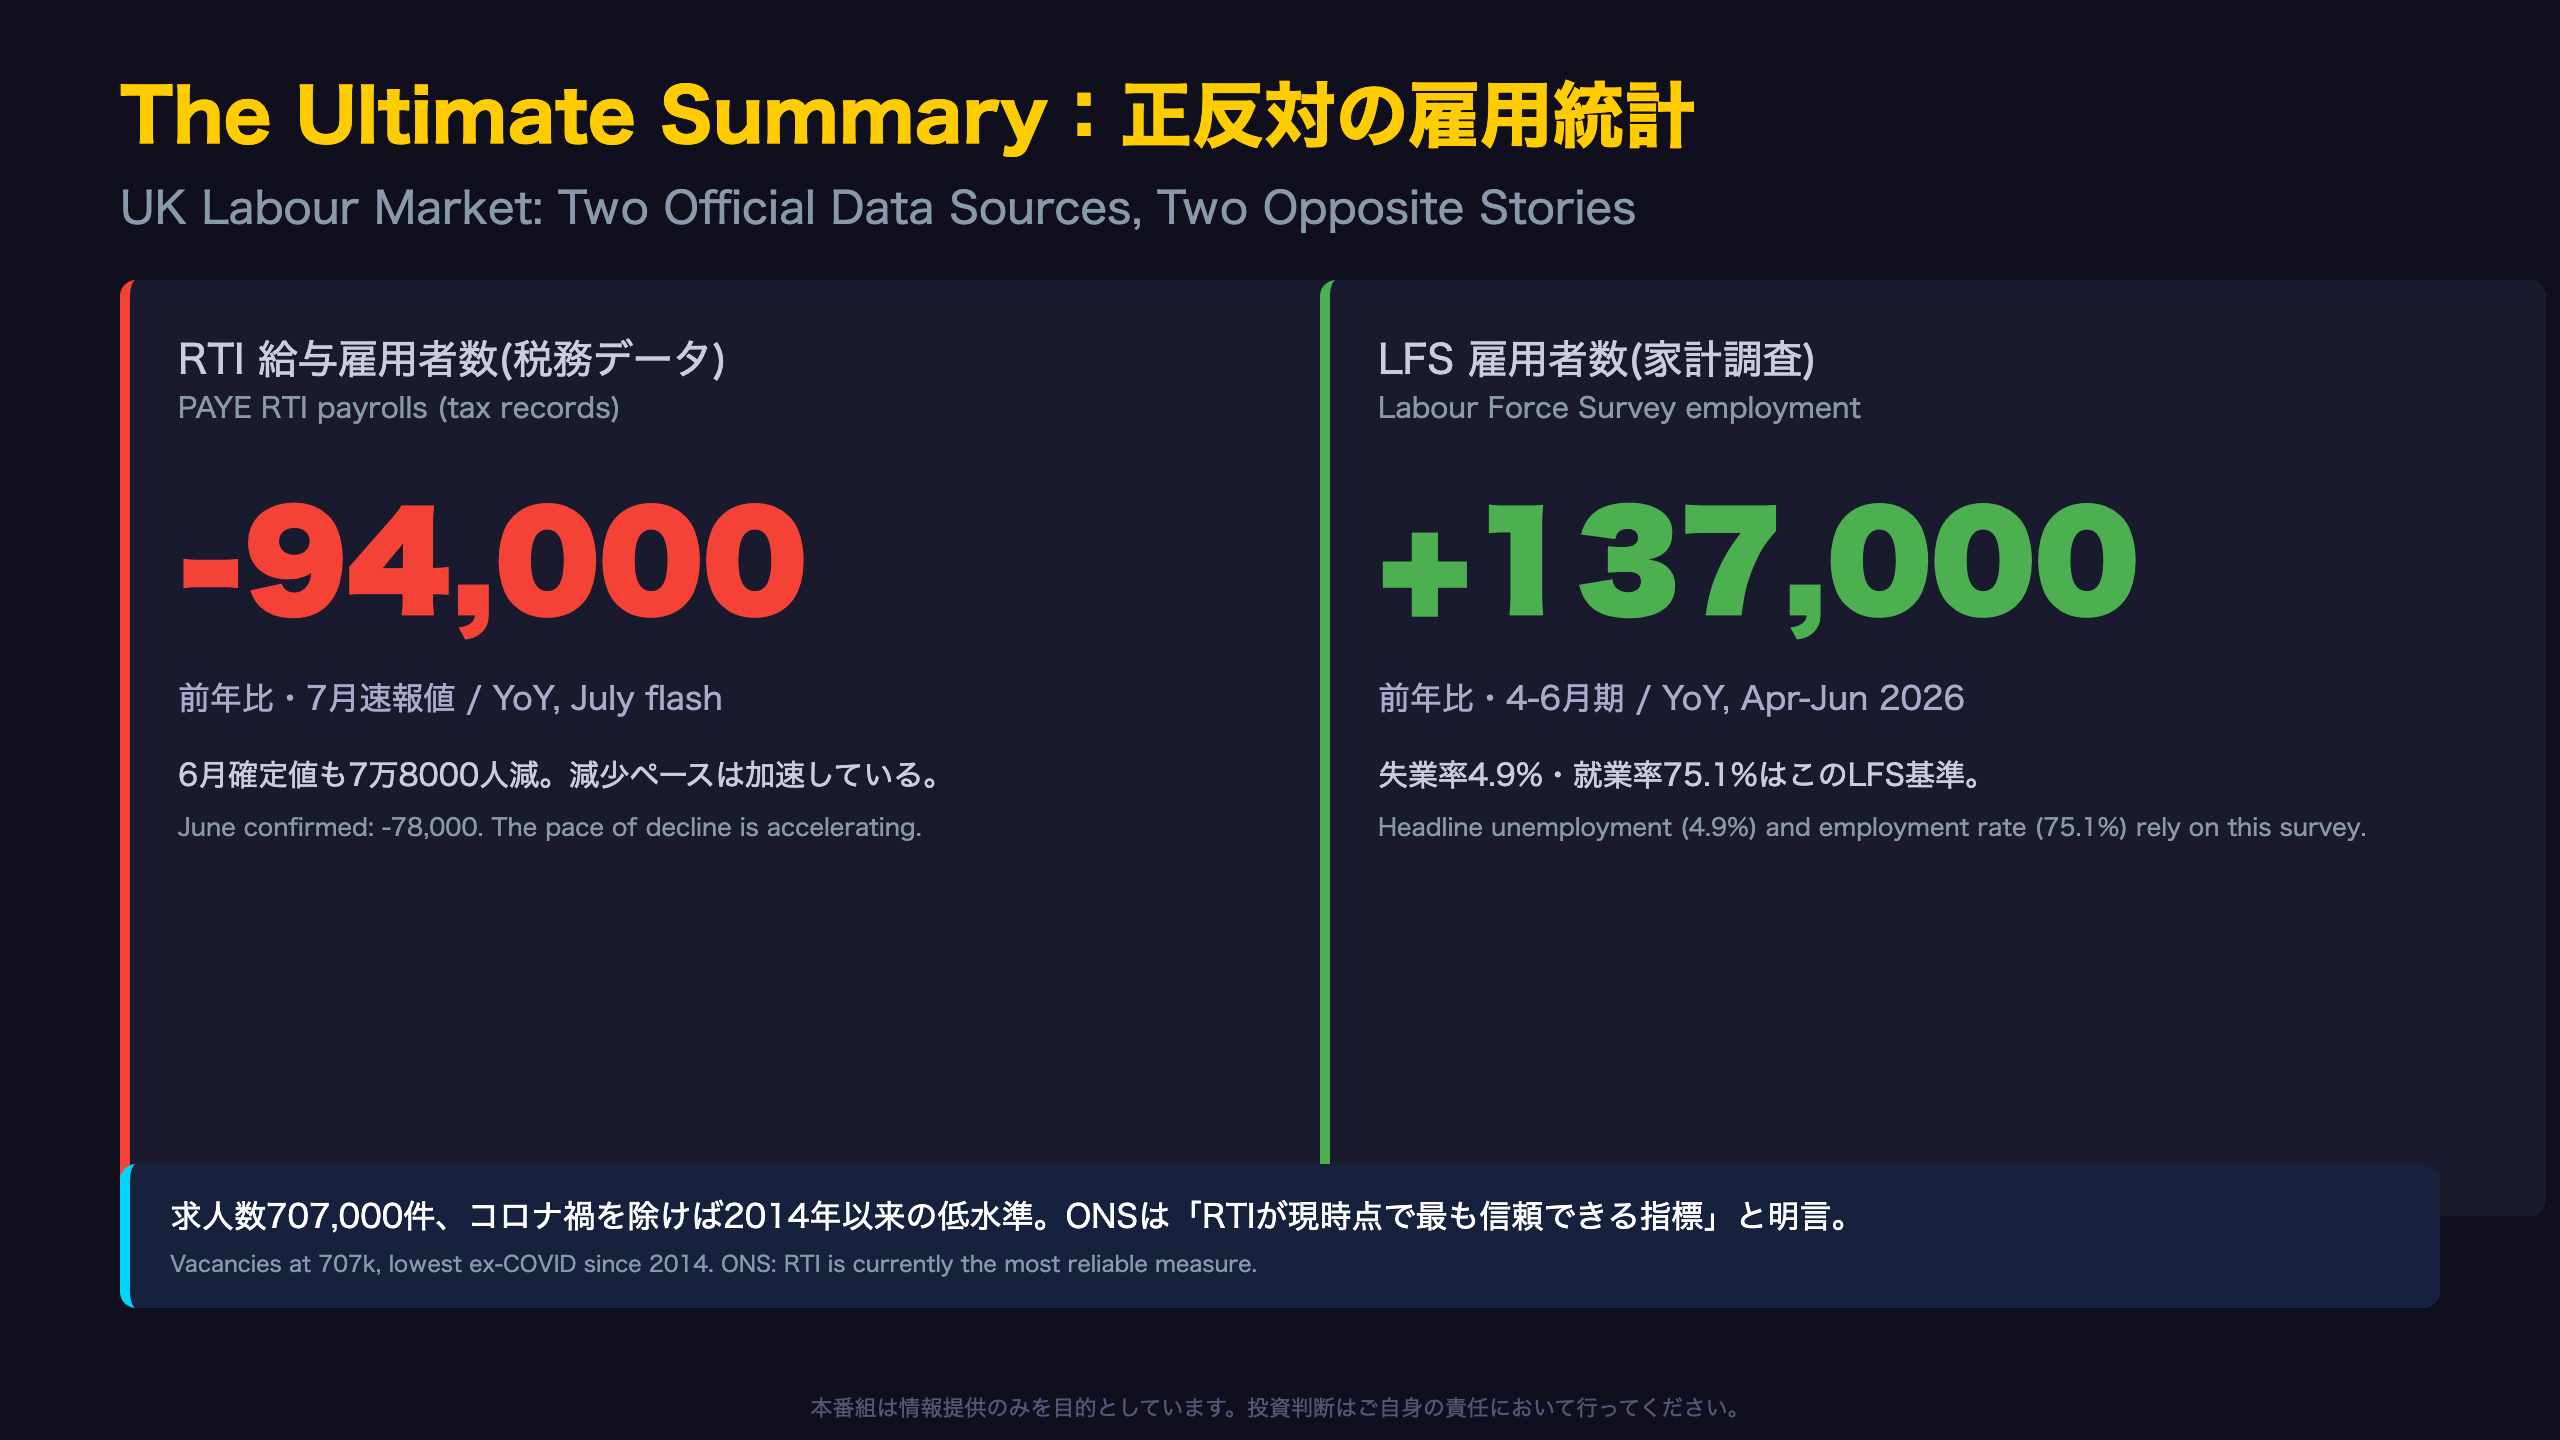
📊 Tax-record based RTI payrolls fell 94,000 YoY (July flash), an accelerating decline.
📈 Yet the household-survey based LFS shows employment UP 137,000 YoY for the same period.
⚠️ Vacancies slipped to 707,000, the lowest outside COVID since 2014.
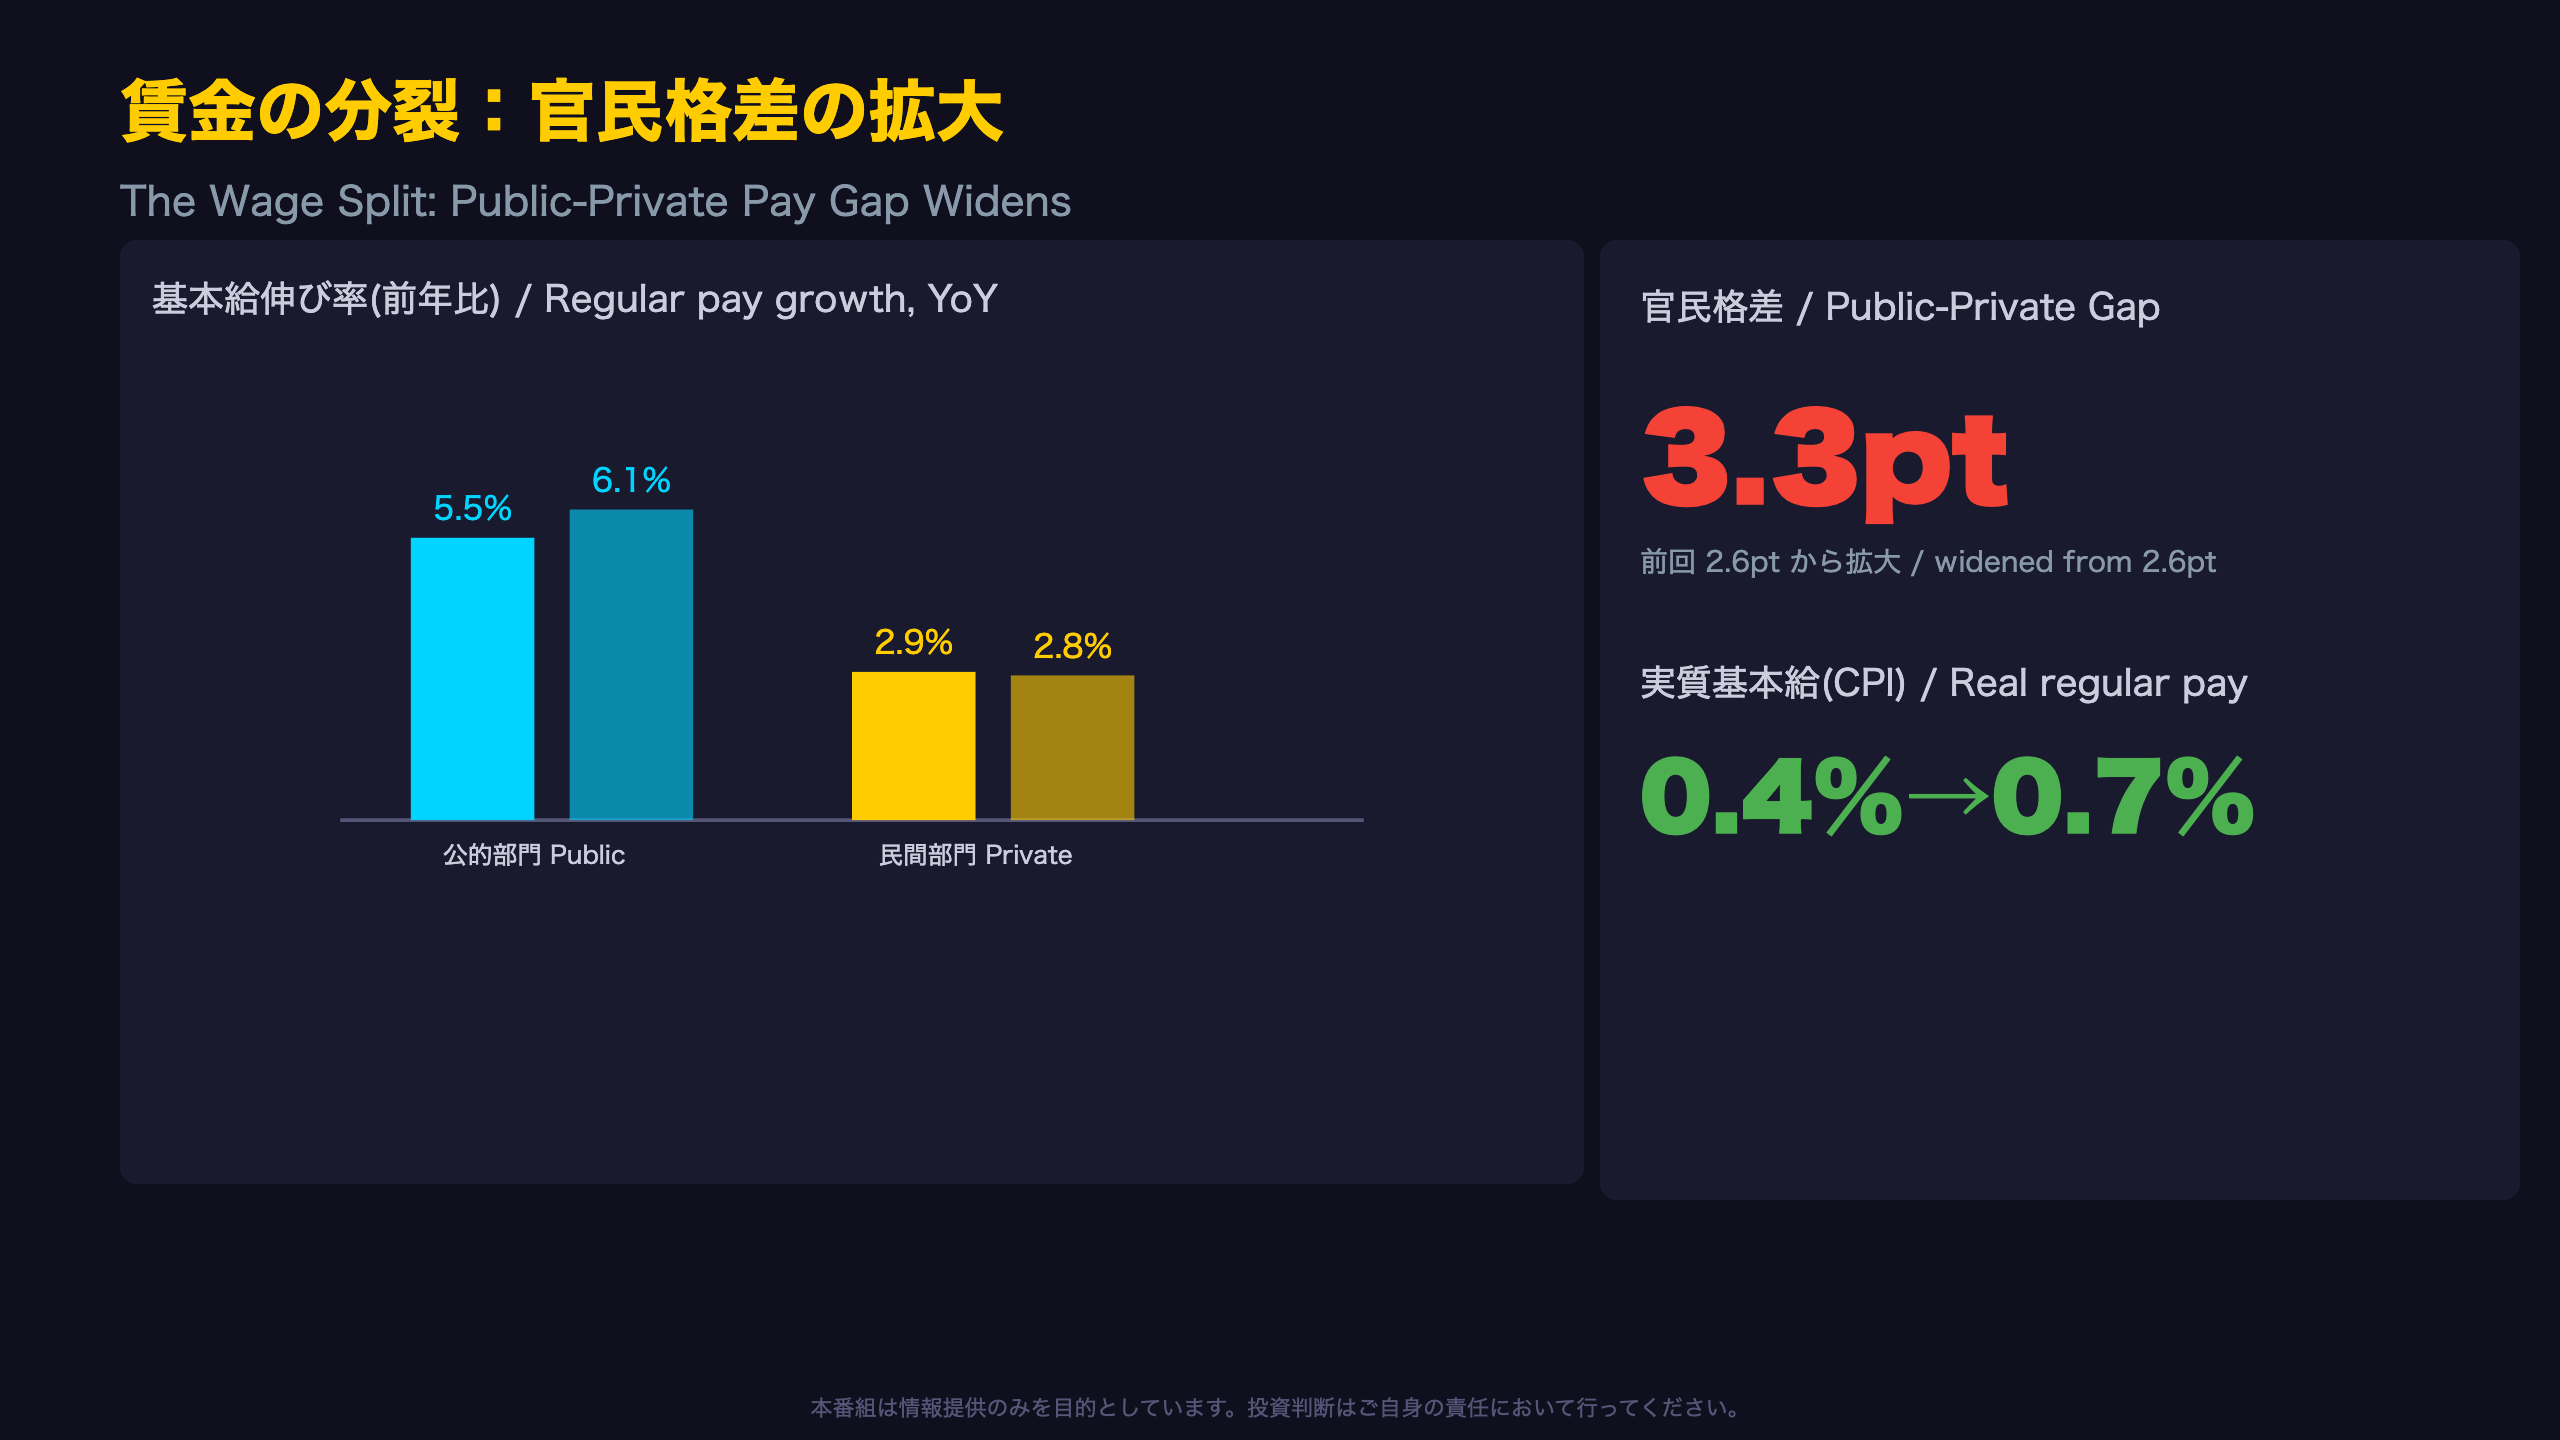
💡 The public-private pay gap widened to 3.3 points, complicating the BoE’s wage-inflation read.
We dive deep into what this data contradiction means for GBP and UK gilts.
The Ultimate Summary:正反対の雇用統計
A familiar problem, UK style
Readers familiar with the US labor market may recognize this pattern: the divergence between the UK’s Labour Force Survey (LFS, a household survey) and PAYE RTI (an administrative payroll dataset from HMRC) echoes the periodic “establishment vs household survey” debates around US Non-Farm Payrolls. The UK’s LFS, however, suffered an acute post-pandemic response-rate crisis, forcing the ONS to suspend and rebuild the survey in 2023-2024.
A quiet reclassification
On 11 August 2026, the ONS notified the Office for Statistics Regulation (OSR) that LFS- and APS-derived outputs will move from “official statistics in development” to full “official statistics” — but notably, the ONS said it will not seek re-accreditation, redirecting efforts toward the future Transformed Labour Force Survey (TLFS).
Why this matters for markets
Bank of England policymakers use the employment rate (75.1%) and unemployment rate (4.9%) — both LFS-derived — as core inputs into labour market slack assessment. If administrative RTI data is correct and LFS is overstating employment, the MPC could be underestimating labour cooling, a risk skewed more dovish than current pricing may reflect.
乖離の深掘り:拡大を続ける統計間ギャップ
Context: The LFS’s post-pandemic crisis
Few outside the UK are aware that the ONS suspended LFS publication entirely in October 2023 due to a collapse in survey response rates — a step with no direct US or Eurozone parallel. The survey was rebuilt with new weighting from January 2024, and while response levels have since recovered close to pre-pandemic norms, the ONS continues to flag “volatility” in short-term readings.
A widening, not narrowing, gap
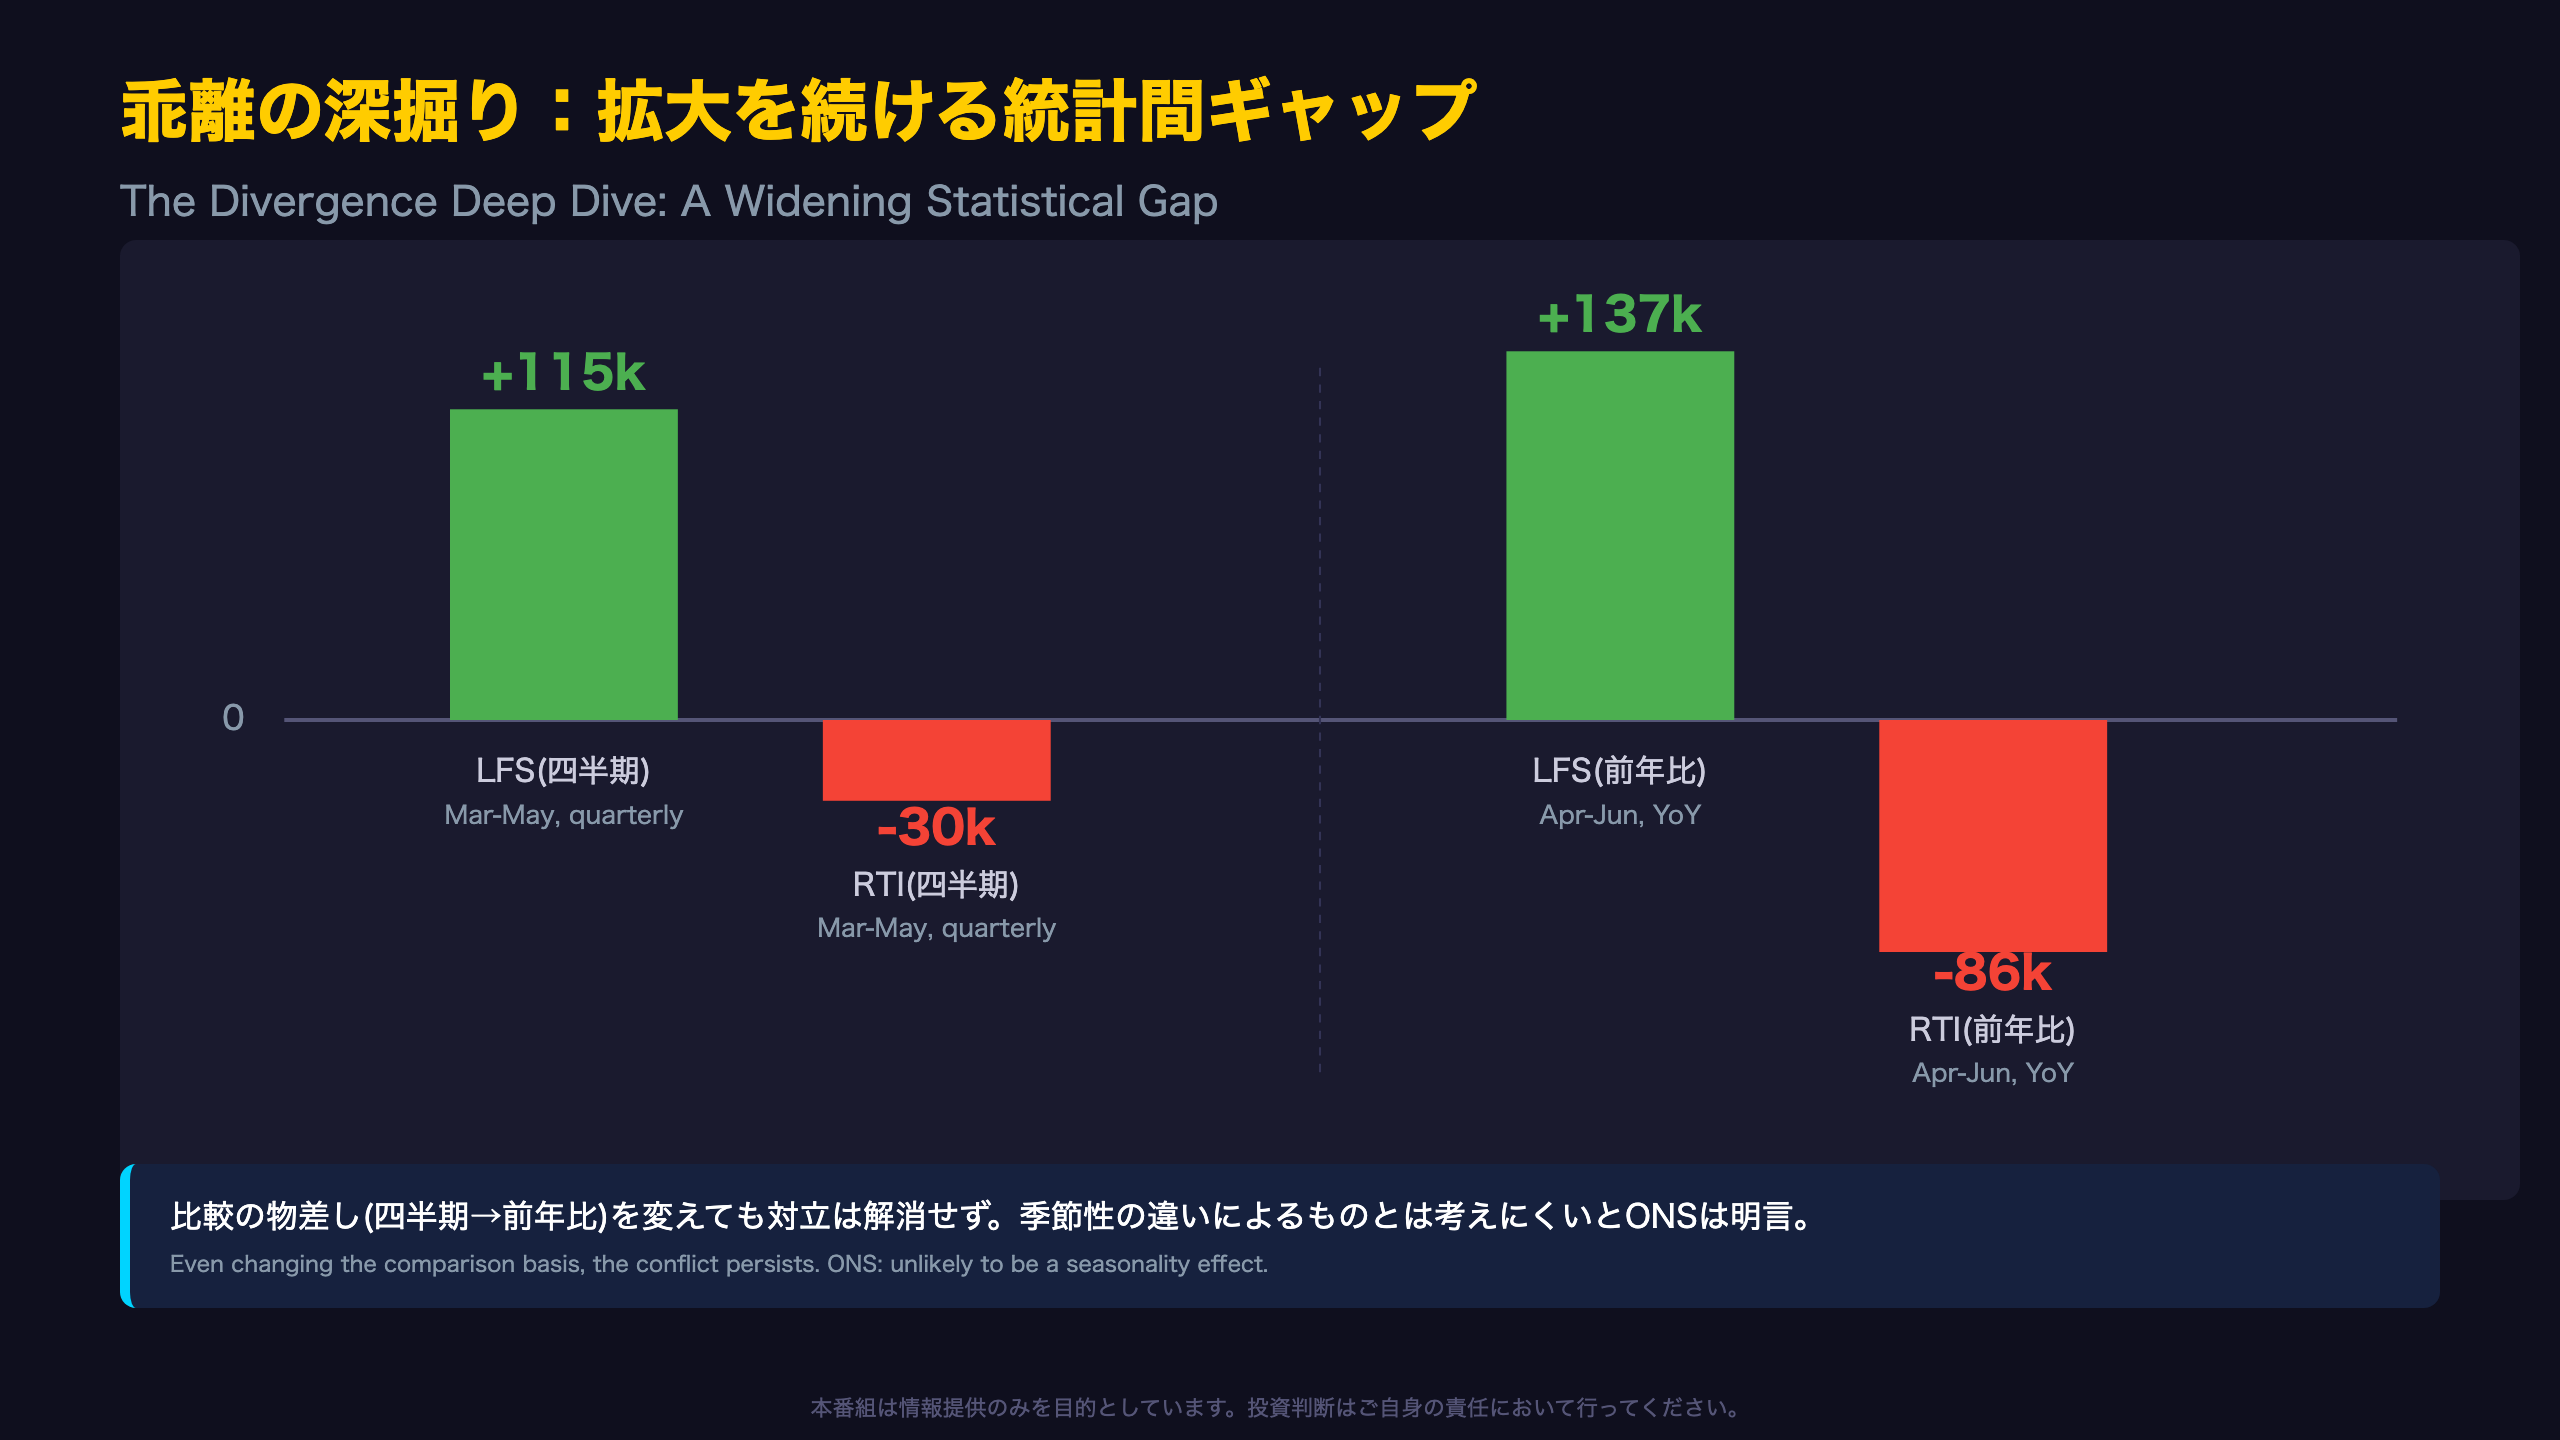
July’s release framed the divergence quarterly: LFS +115,000 vs RTI -30,000 for March-May 2026. August’s release, framed annually, shows the gap persisting: LFS +137,000 vs RTI -86,000 for April-June 2026. Critically, the ONS says this pattern holds in both seasonally adjusted and non-adjusted data — ruling out a simple seasonality explanation.
Why traders should care
For GBP and gilt markets, this is not a one-off blip — it is a structural measurement problem the Bank of England must navigate when calibrating its “gradual and careful” rate-cut path. Expect elevated data-driven volatility around each monthly labour release until the ONS’s LFS-RTI linkage project, due autumn 2026, delivers clarity.
求人と給与雇用者数:緩やかな地盤沈下
The “why” behind vacancy weakness
The ONS bulletin includes a rare qualitative data point: “Feedback from our Vacancy Survey suggests that some small firms may not be recruiting because of increases in labour costs and other operating expenses.” This is consistent with — though not explicitly attributed by ONS to — rising employer costs, and should be read as one plausible contributing factor rather than a confirmed causal driver.
Benchmarking against 2014
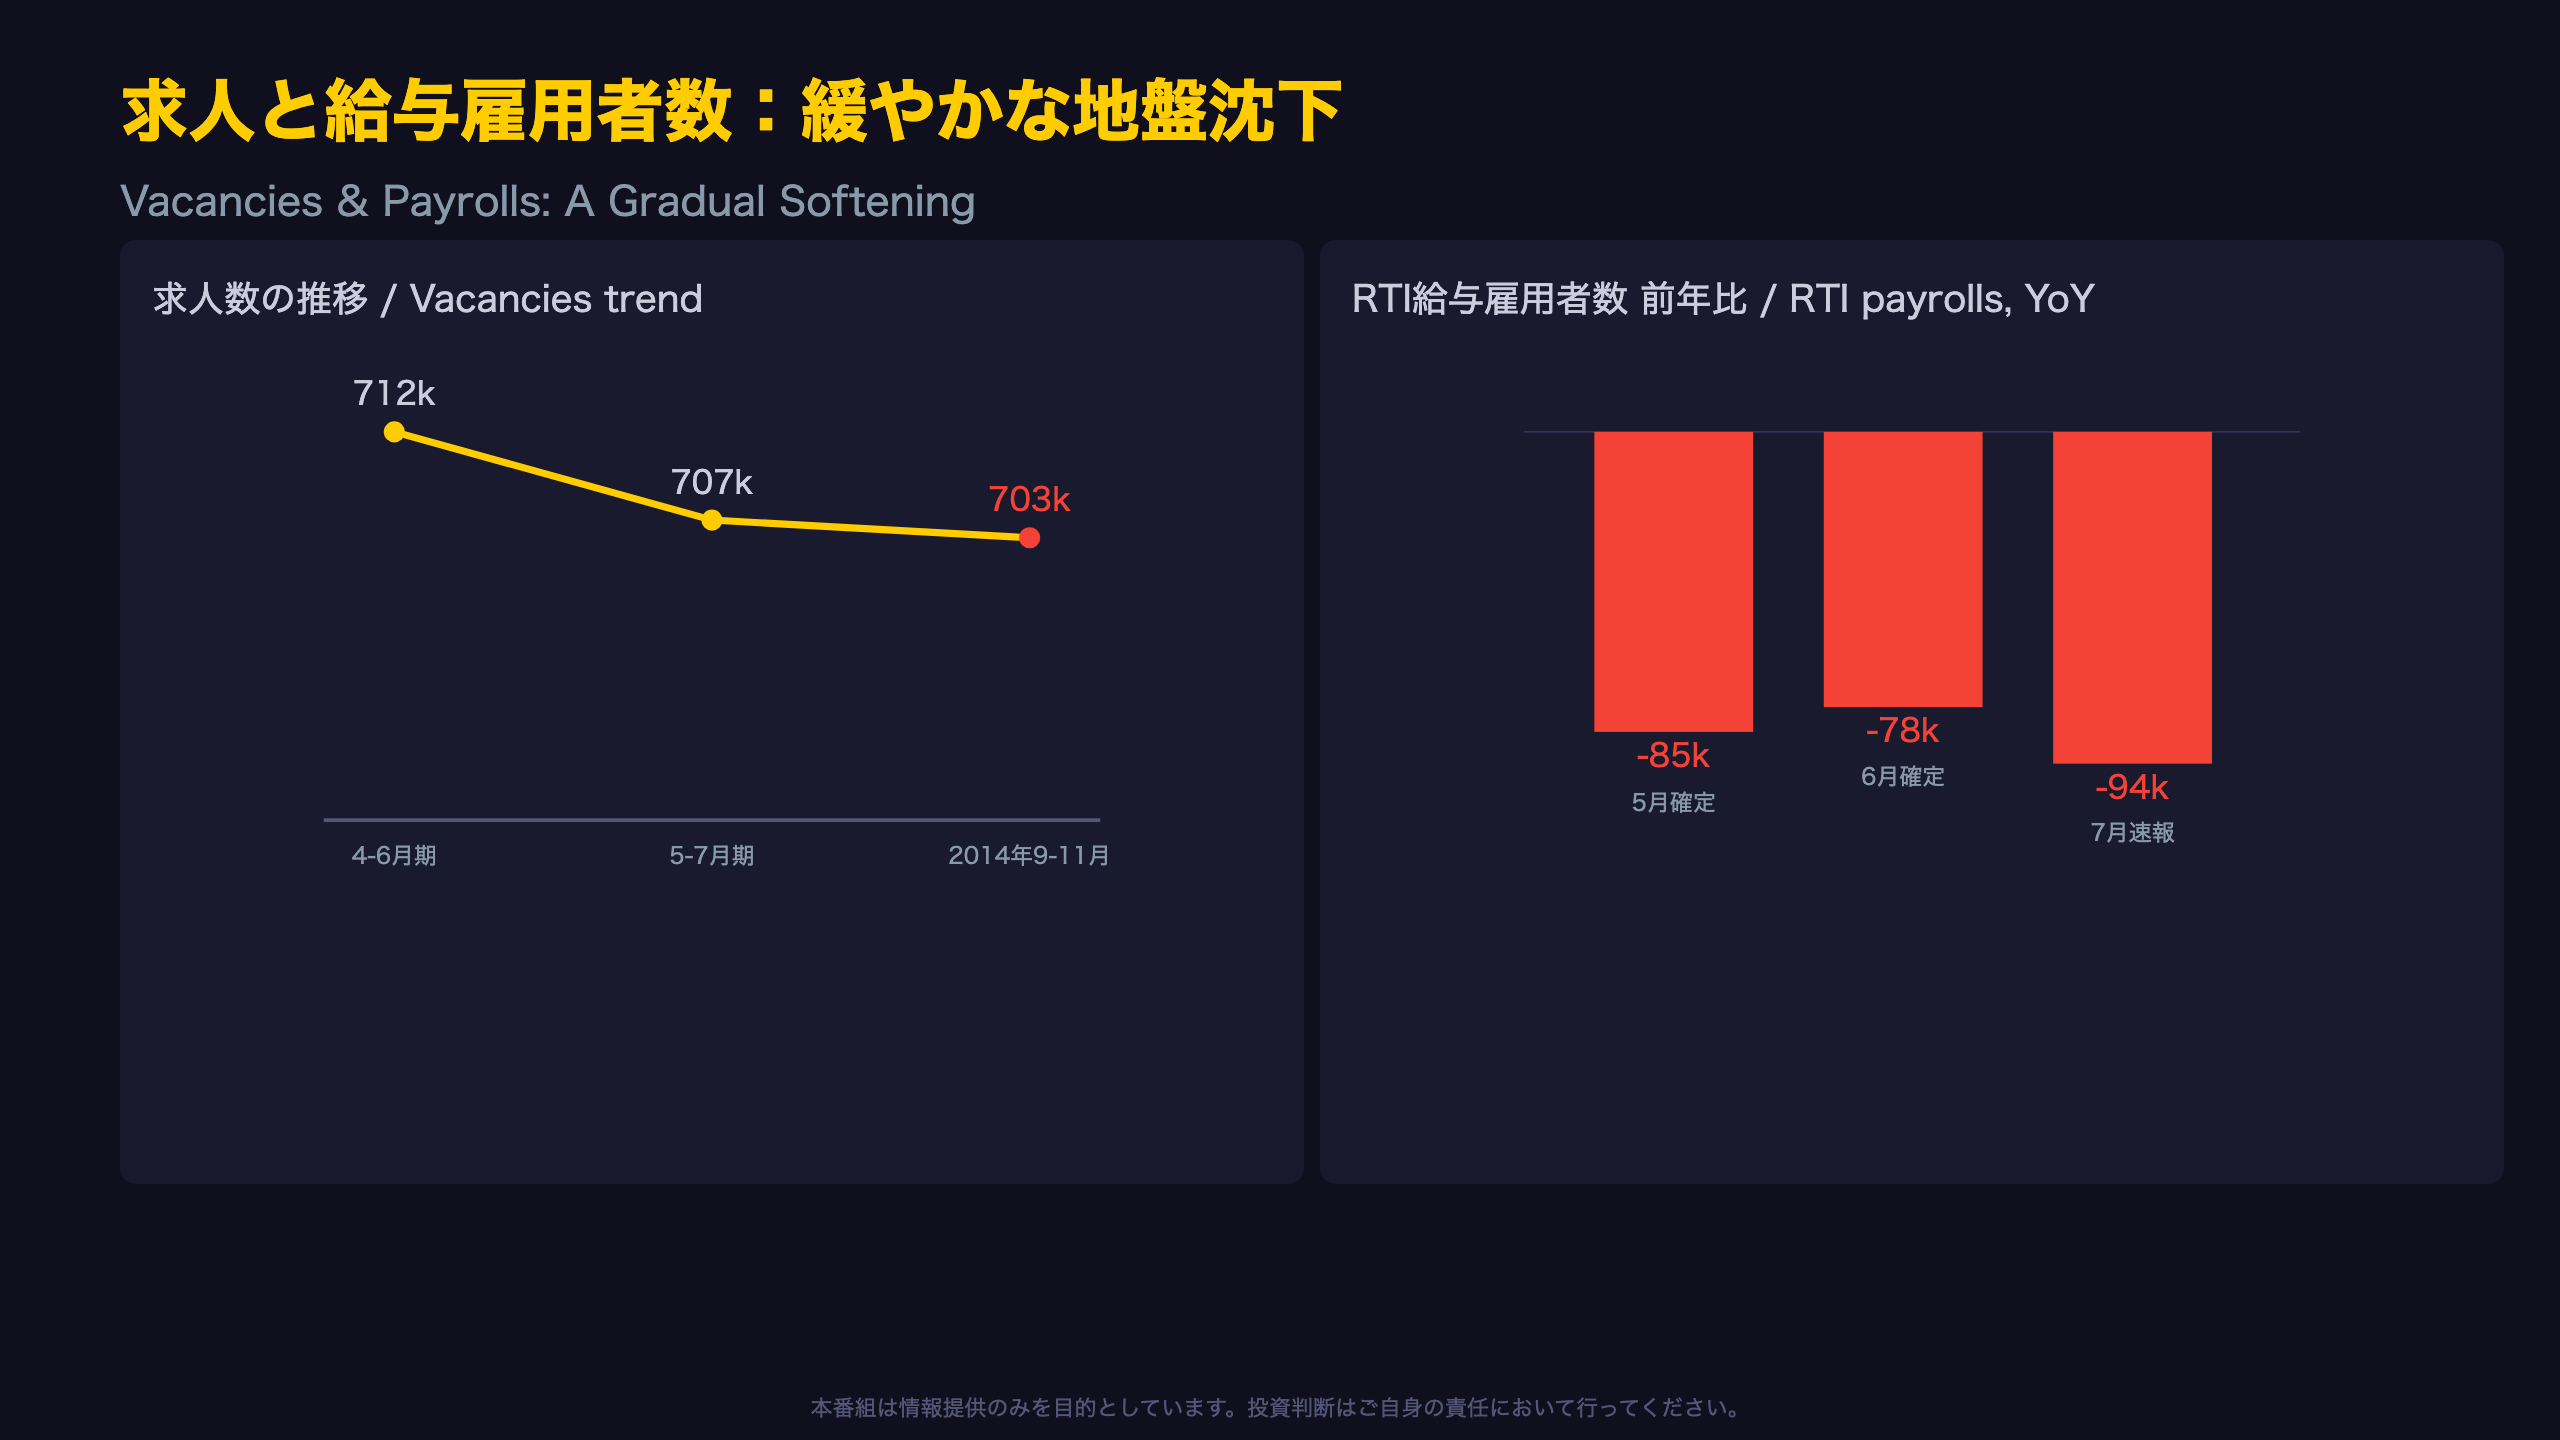
The 707,000 vacancy count is the lowest outside the COVID-19 period since September-November 2014 (703,000) — a rare 12-year benchmark, even though the pace of decline has actually moderated slightly (-6,000 in the latest quarter vs -7,000 previously).
Revision risk is asymmetric
UK payroll data (RTI) has a documented downward-revision bias for flash estimates: June’s initial flash of -71,000 YoY was later confirmed at -78,000 YoY, a 7,000 downward revision. If July’s flash of -94,000 YoY follows the same pattern, the confirmed figure due in the September release could show an even steeper annual decline — a risk skewed toward further labour-market softening that markets should factor in.
賃金の分裂:官民格差の拡大
Timing effects complicate the headline
The ONS explicitly cautions that “public sector annual pay growth continues to be affected by variations in the timing of pay awards this year” — meaning the jump from 5.5% to 6.1% may partly reflect calendar effects in when settlements were recorded, rather than a pure acceleration in underlying public-sector wage costs.
Labour disputes tick up
Working days lost to labour disputes nearly doubled month-on-month, from 26,000 in May to 47,000 in June 2026. While still modest by historical UK strike-wave standards, the increase coincides with the widening public-private pay gap and could reflect renewed friction over public-sector settlements.
Real wages: a genuine bright spot
CPI-adjusted real regular pay growth improved from 0.4% to 0.7%, and real total pay held at 1.3%. For UK consumers this is unambiguously positive — but the improvement was driven primarily by cooling inflation rather than accelerating nominal wage growth, since private-sector regular pay actually decelerated from 2.9% to 2.8%, a distinction that matters for the Bank of England’s read on underlying wage-price dynamics.
インプリケーション:BOE・ポンド・英国債への示唆

Next data point: September 15, 2026
The next ONS labour market release lands on 15 September 2026. Two things to watch: whether July’s flash payroll decline of -94,000 YoY is revised further downward (following the established pattern), and whether the LFS-RTI divergence widens for a third consecutive month — which would raise serious questions about the reliability of the LFS-derived unemployment and employment rates that anchor BoE policy discussions.
An asymmetric signal in data quality
It matters that the ONS itself states RTI is “currently the most reliable measure of employees.” For investors modelling BoE reaction functions, this suggests policymakers may weight the weaker RTI payroll trend more heavily than the stronger LFS employment reading when assessing labour market slack — tilting the risk balance toward a more dovish Bank of England than the unchanged 4.9% unemployment rate might suggest.
A threshold to watch
Private-sector regular pay growth at 2.8% is a key number for the MPC’s services-inflation framework. A further slide would likely embolden the case for a faster cutting cycle; a stabilization or a widening public-private pay gap feeding into broader wage expectations would argue for caution. Gilts and GBP are likely to show heightened sensitivity to this specific series relative to headline unemployment prints.
Disclaimer: This article is for informational purposes only. All investment decisions are made solely at your own risk.