📺 Watch the Full Video Analysis
This article was automatically generated by the NFC Market Live AI analysis system. (Updated: 2026-10-01 08:58 JST)
📄 Primary Source
日本銀行
https://www.boj.or.jp/statistics/tk/yoshi/tk2609.htm
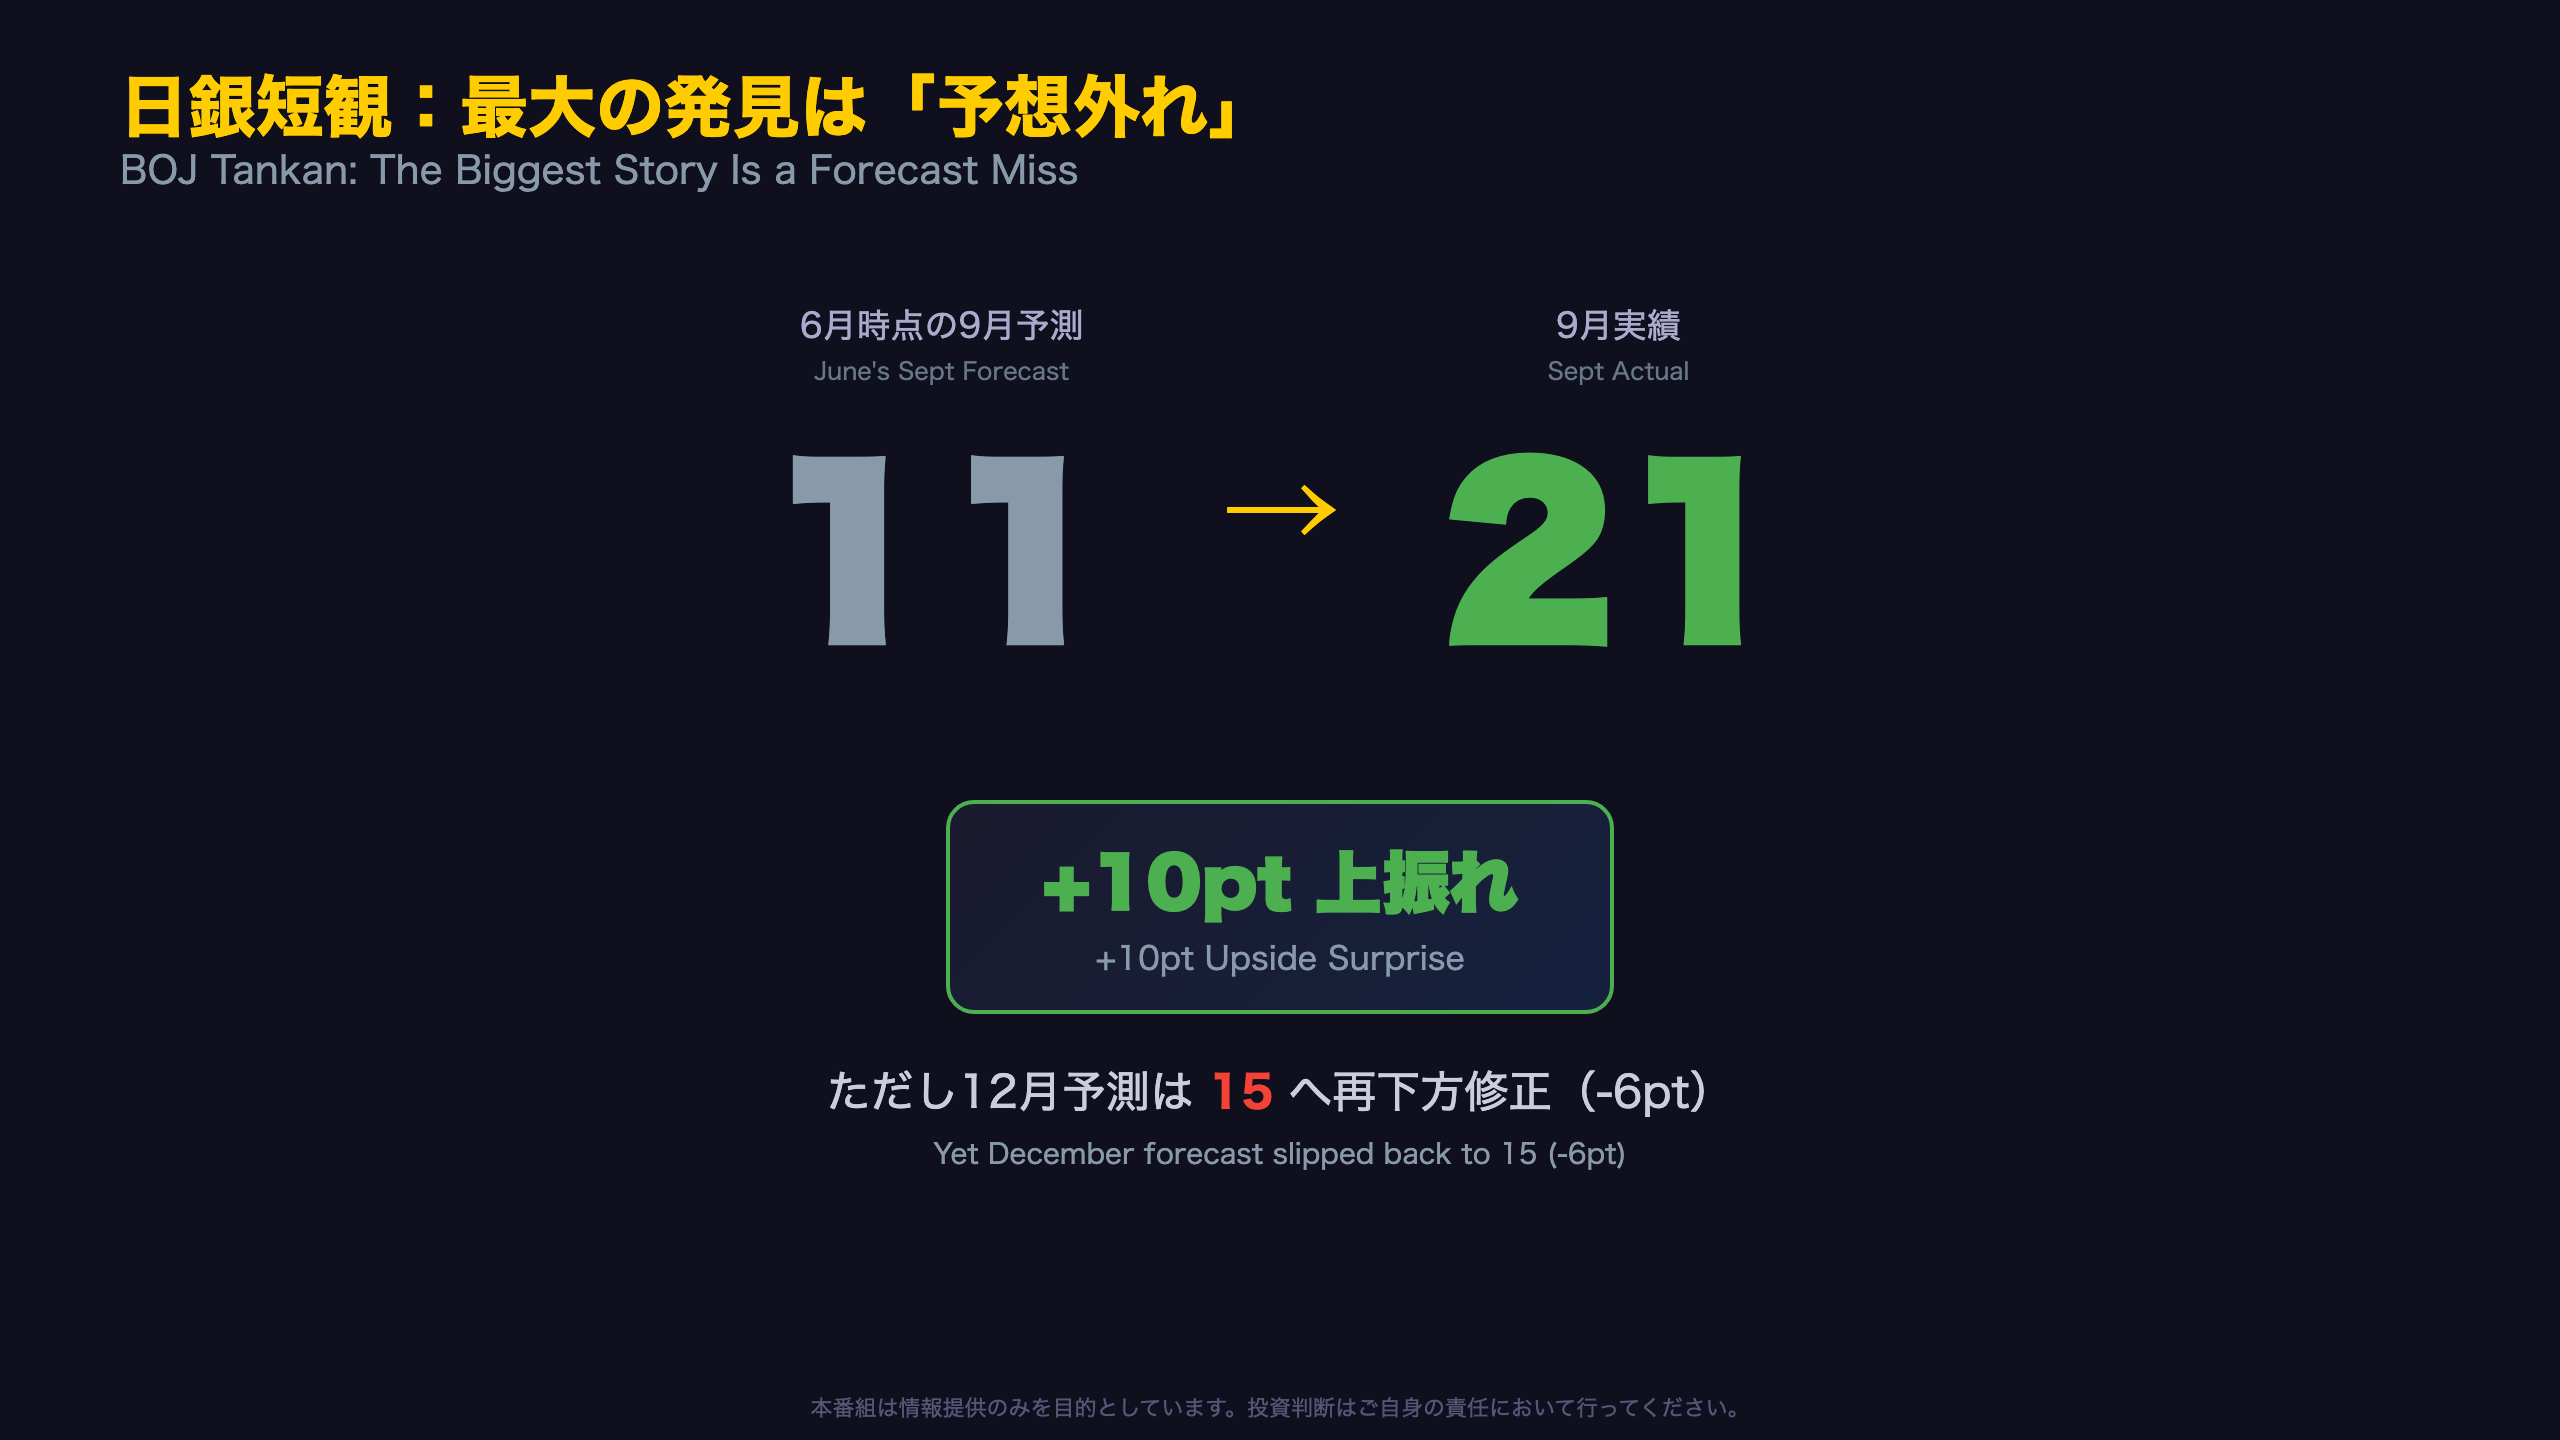
The September 2026 BOJ Tankan delivered a striking upside surprise: companies forecast a headline DI of just 11 back in June, but actual results hit 21 — a 10-point beat. 📊
Manufacturing improved across all firm sizes, while non-manufacturing stalled. Large manufacturers’ FY2026 ordinary profit plan swung from -6.7% to +13.6%, a massive upward revision. 💹
Meanwhile, the borrowing rate DI jumped 7 points nationwide, with further increases expected by December. Labor shortage sentiment also deepened. ⚠️
The key caveat: companies’ own December forecasts were revised down across every category. Is this improvement a genuine recovery, or just a temporary plateau? Full analysis inside.
日銀短観:最大の発見は「予想外れ」
When Corporate Pessimism Gets Overturned
The most striking feature of the September 2026 BOJ Tankan Survey is the gap between corporate expectations and reality. In June, Japanese companies projected a headline sentiment DI (all industries, all sizes) of just 11 for September. The actual reading came in at 21 — a 10-point beat.
Context for International Readers
The Tankan (short for “Tanki Keizai Kansoku Chosa”) is the Bank of Japan’s quarterly business sentiment survey, roughly analogous to the U.S. ISM Manufacturing/Services PMI, but broader in scope, covering over 9,000 firms across all sizes and sectors. The Diffusion Index (DI) measures the percentage of firms reporting “favorable” conditions minus those reporting “unfavorable” — a positive number indicates net optimism.
The Forecast Miss, By Segment
| Segment | June’s Sept Forecast | Sept Actual | Beat |
|---|---|---|---|
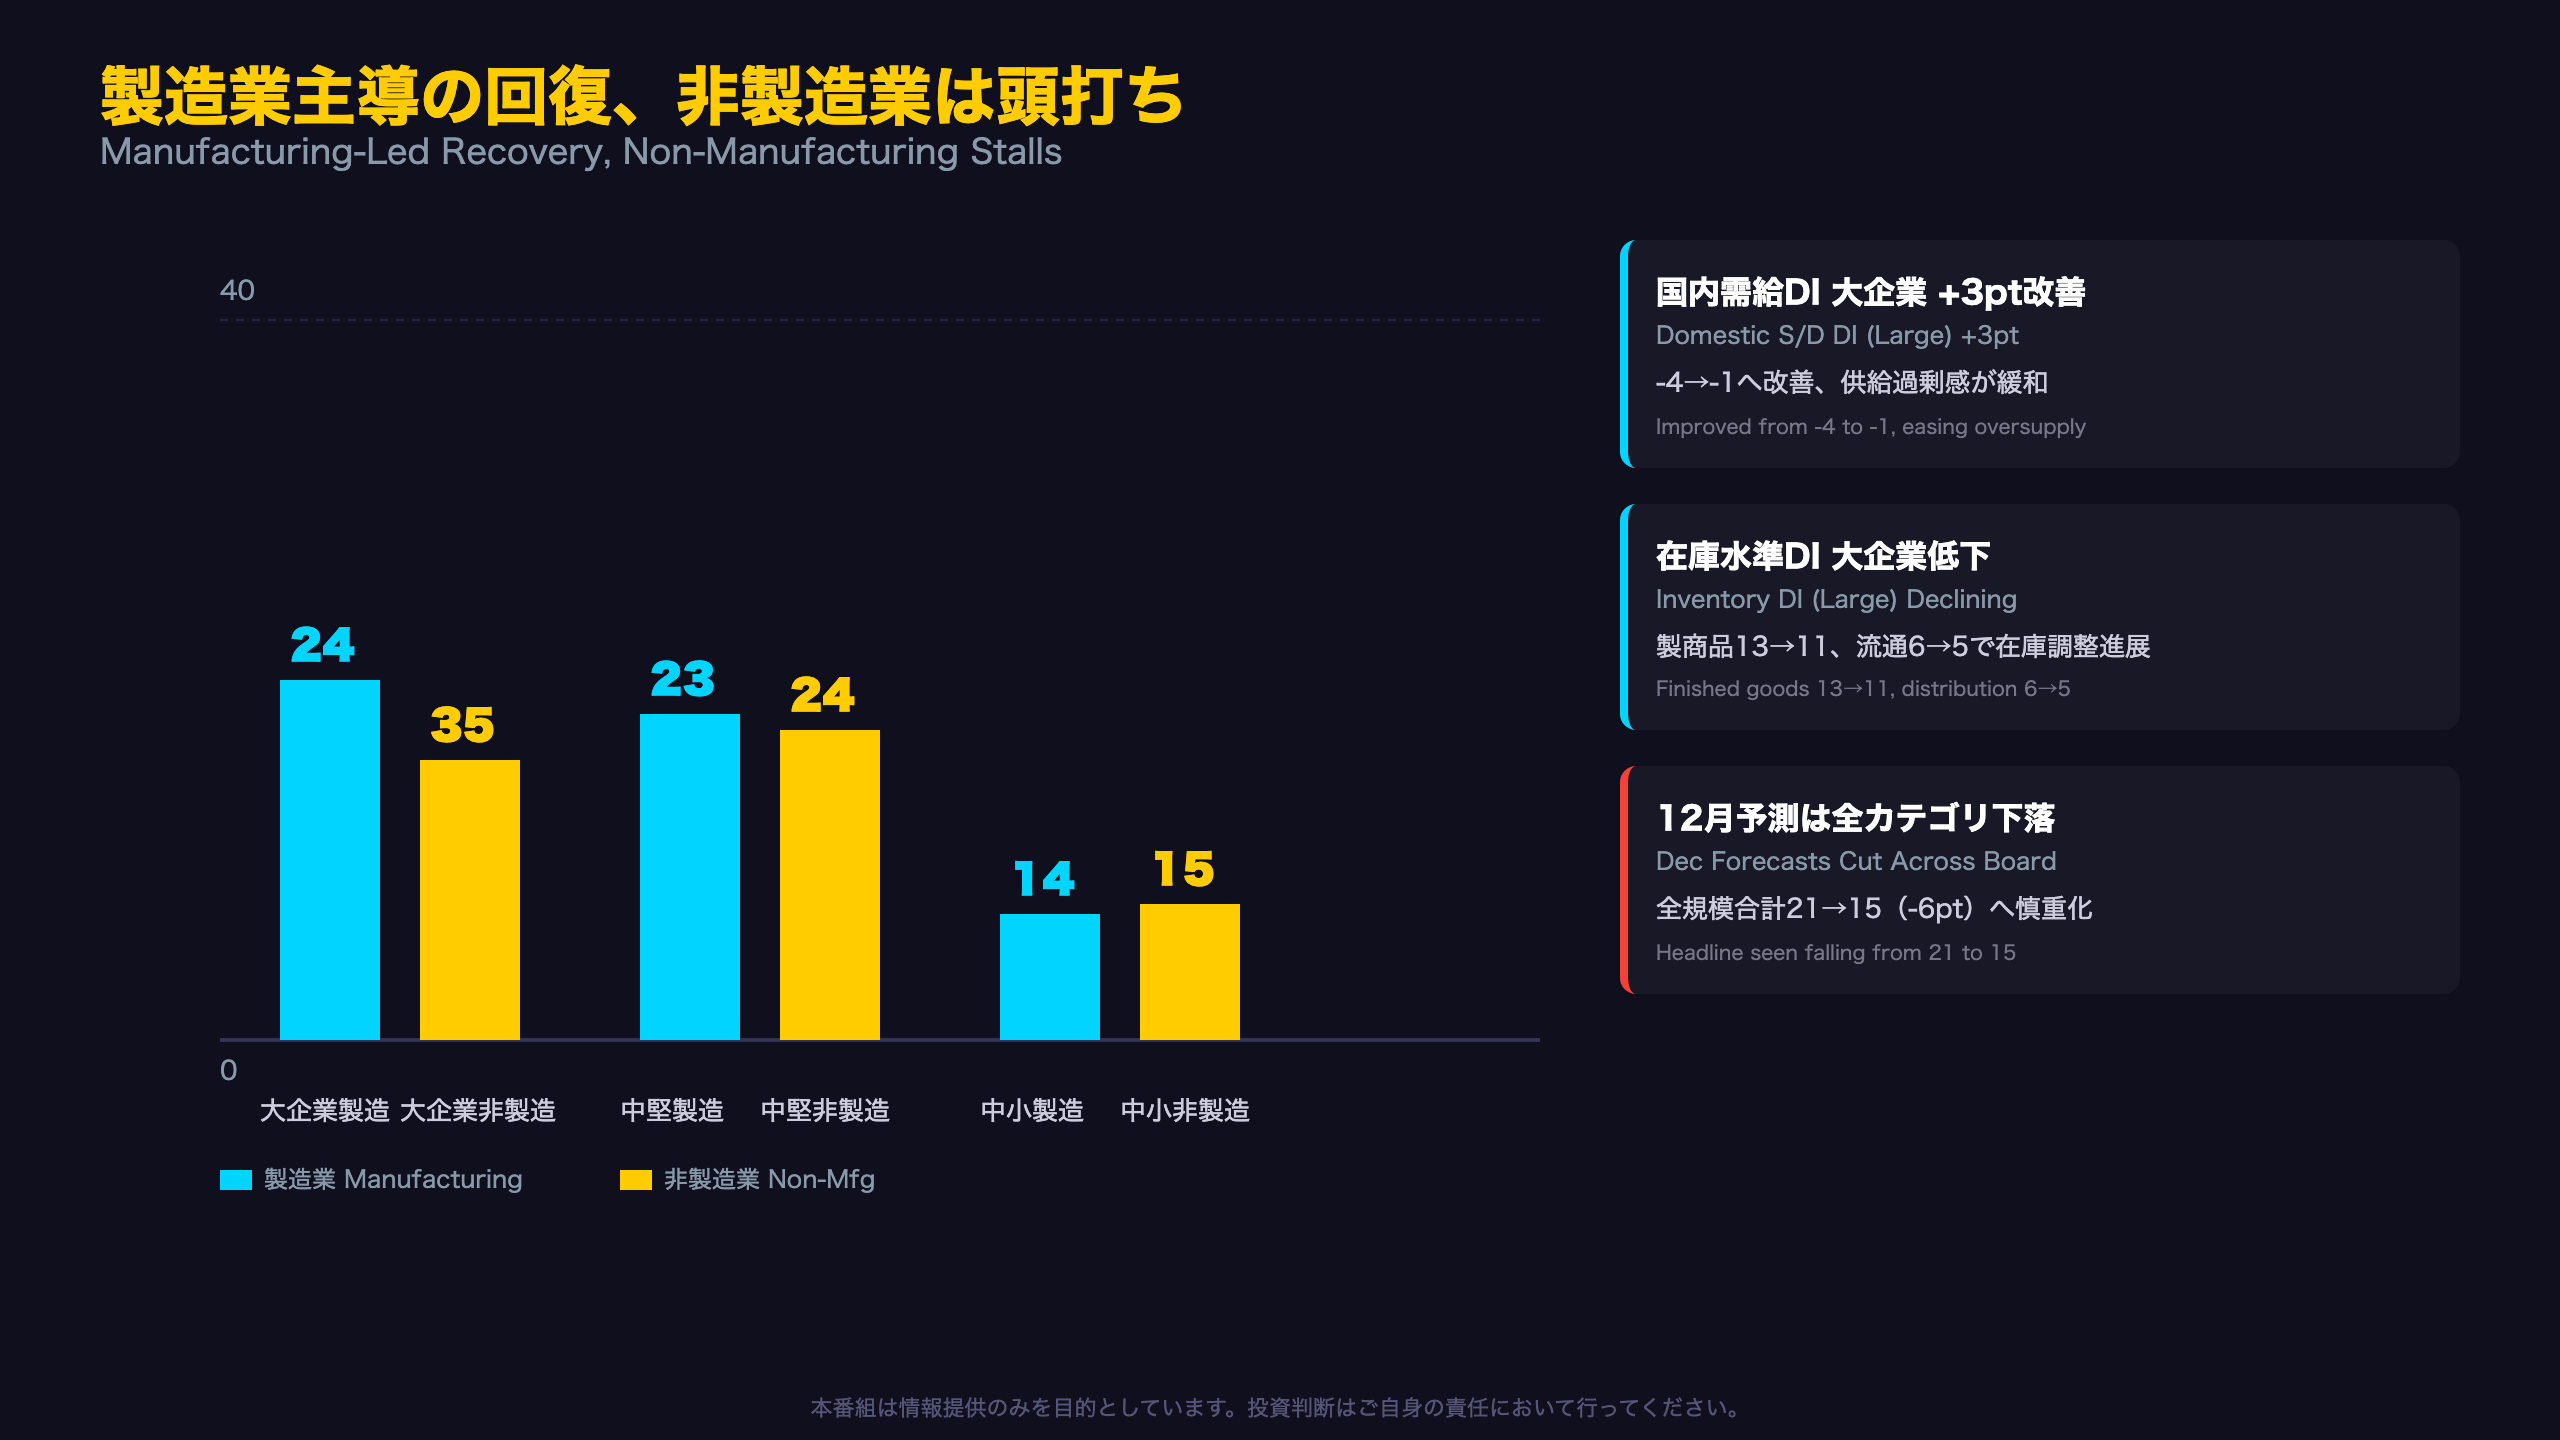
| Large Manufacturers | 17 | 24 | +7pt |
| Large Non-Manufacturers | 28 | 35 | +7pt |
| Mid-size Manufacturers | 9 | 23 | +14pt |
| Mid-size Non-Manufacturers | 16 | 24 | +8pt |
| SME Manufacturers | 2 | 14 | +12pt |
| SME Non-Manufacturers | 8 | 15 | +7pt |
Every single category beat its own forecast, with mid-size manufacturers showing the largest gap. This suggests corporate expectations set in June were unusually conservative — though the report itself offers no explicit causal explanation.
Market Implication
For yen-watchers and JGB investors, this kind of broad-based upside surprise typically reinforces the case for BOJ policy normalization, though the December forecast reversal (discussed in later slides) tempers that read.
製造業主導の回復、非製造業は頭打ち
Manufacturing Leads, Non-Manufacturing Stalls: What the Supply-Demand Data Reveals
The divergence between manufacturing and non-manufacturing sentiment is corroborated by underlying supply-demand indicators, giving the headline DI story more texture.
Domestic and Overseas Supply-Demand DI
| Indicator | June | Sept | Change |
|---|---|---|---|
| Domestic S/D DI (Large) | -4 | -1 | +3pt |
| Domestic S/D DI (SME) | -10 | -10 | 0pt |
| Overseas S/D DI (Large) | -3 | -1 | +2pt |
| Overseas S/D DI (SME) | -8 | -6 | +2pt |
Large manufacturers saw supply-demand conditions tighten (improve) both domestically and overseas, consistent with their rising sentiment DI. SMEs, however, saw no improvement in domestic conditions — suggesting the recovery’s benefits may be concentrated among larger firms.
Inventory Data Supports the Bullish Case
Finished goods inventory DI for large firms fell from 13 to 11, and distribution inventory DI fell from 6 to 5 — both indicating destocking is underway, a classic sign of a cyclical bottoming process in manufacturing.
Two Ways to Read Non-Manufacturing Softness
A bullish read: manufacturing’s improvement reflects genuine cyclical recovery alongside inventory normalization. A more cautious read: non-manufacturing’s stall could reflect slowing domestic demand momentum, though the report provides no explicit causal data to confirm this.
What to Watch Next
For context, Japan’s Tankan is the closest domestic equivalent to the U.S. ISM survey, but it separately tracks large, mid-size, and small firms — a granularity the ISM lacks. This sectoral divergence is something Fed-watchers comparing U.S. vs Japan cycles should note.
大企業経常利益、円安追い風で劇的好転
A Weaker Yen Powers the Profit Turnaround
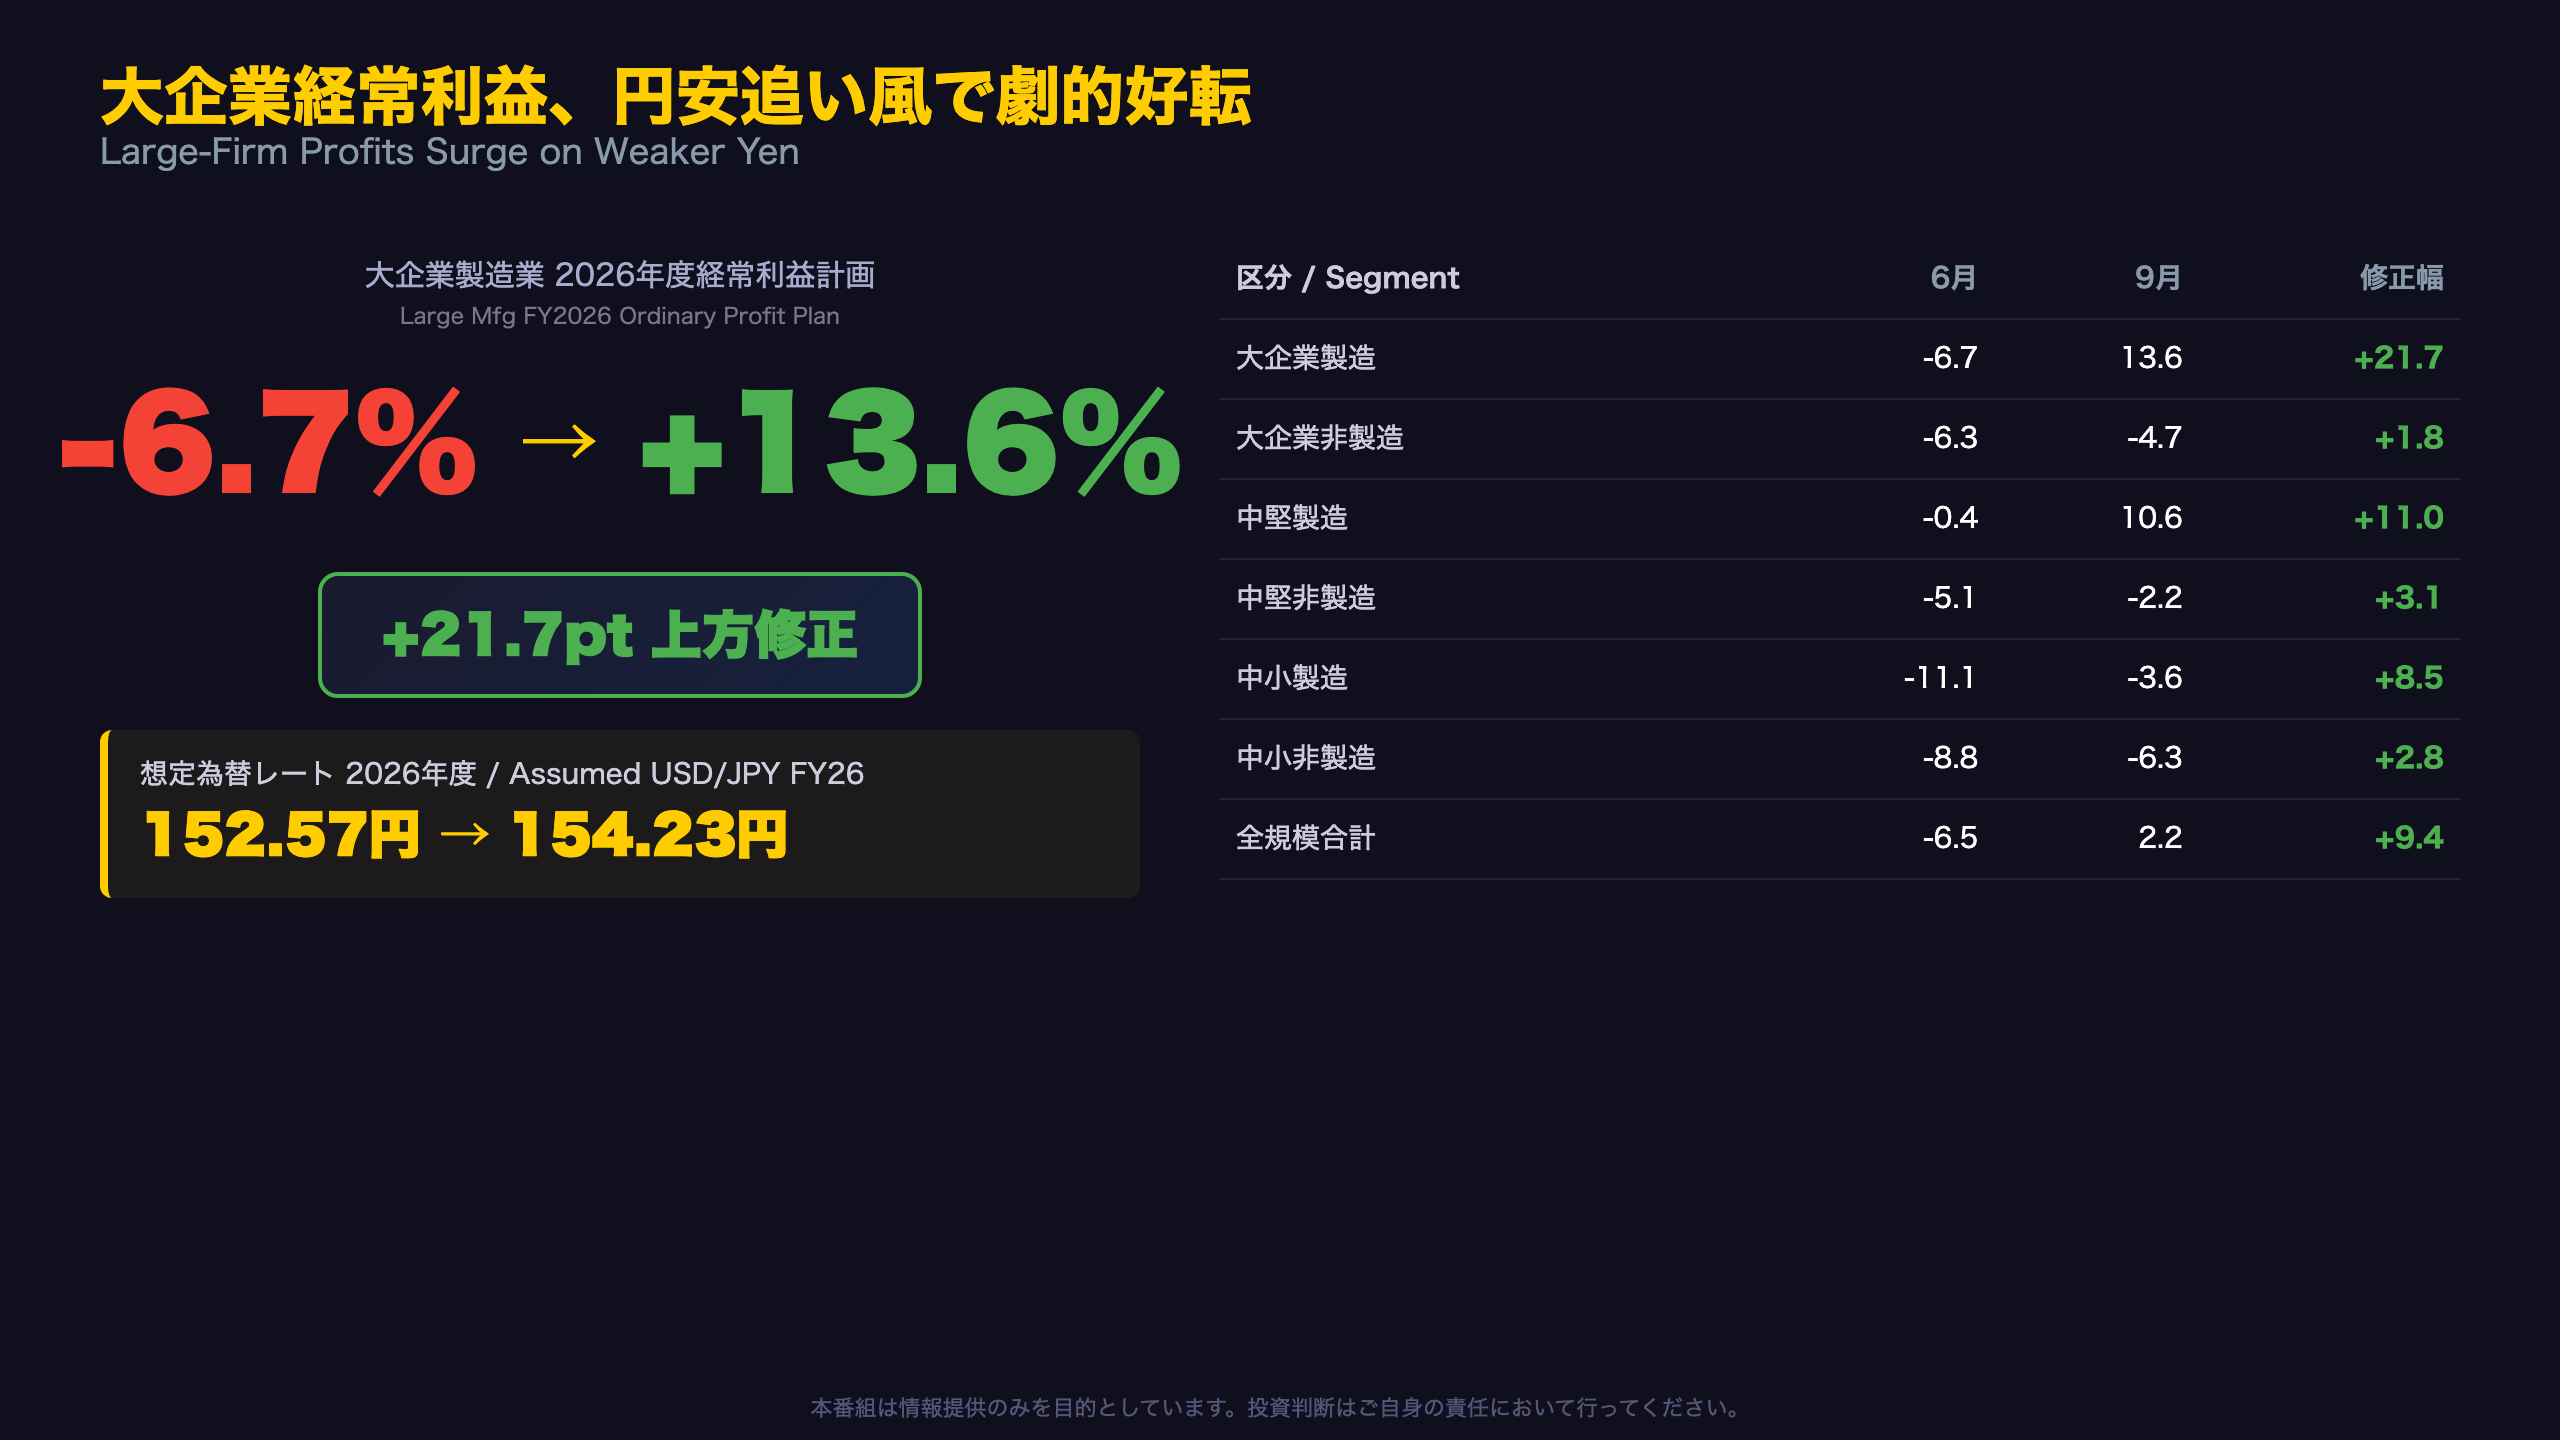
The swing in large manufacturers’ FY2026 ordinary profit plan — from -6.7% to +13.6%, a 21.7-point upward revision — is the single most dramatic number in this Tankan release.
Revision Magnitude by Segment
| Segment | June Plan | Sept Plan | Revision |
|---|---|---|---|
| Large Manufacturers | -6.7% | +13.6% | +21.7pt |
| Large Non-Manufacturers | -6.3% | -4.7% | +1.8pt |
| Mid-size Manufacturers | -0.4% | +10.6% | +11.0pt |
| Mid-size Non-Manufacturers | -5.1% | -2.2% | +3.1pt |
| SME Manufacturers | -11.1% | -3.6% | +8.5pt |
| SME Non-Manufacturers | -8.8% | -6.3% | +2.8pt |
| All Industries | -6.5% | +2.2% | +9.4pt |
Every segment was revised upward, though non-manufacturing plans remain in negative territory — profit improvement is concentrated in manufacturing.
Why the Yen Matters Here
Japanese firms set their FY2026 business plans assuming an average USD/JPY rate of 154.23, up from 152.57 in June — a roughly 1.1% depreciation assumption. For context, a weaker yen mechanically boosts the yen-value of overseas earnings for Japan’s export-heavy large-cap manufacturers (think auto and electronics names in the Nikkei 225 and TOPIX). This dynamic is analogous to how a weaker dollar benefits U.S. multinationals’ reported overseas revenue.
Consolidated Data Confirms the Trend
Consolidated (group-wide, including overseas subsidiaries) ordinary profit plans for manufacturers rose to +6.6% for FY2026, up from +5.4% in FY2025, with overseas sales still representing 61.41% of total manufacturing revenue — reinforcing how exposed these firms are to currency moves.
Market Implications
For USD/JPY traders, this signals corporate Japan’s planning assumptions have shifted decisively toward yen weakness — a data point the BOJ will likely weigh when assessing exporter profitability versus import-cost inflation risks ahead of its next policy meeting.
金利上昇観測と人手不足、二つの構造圧力
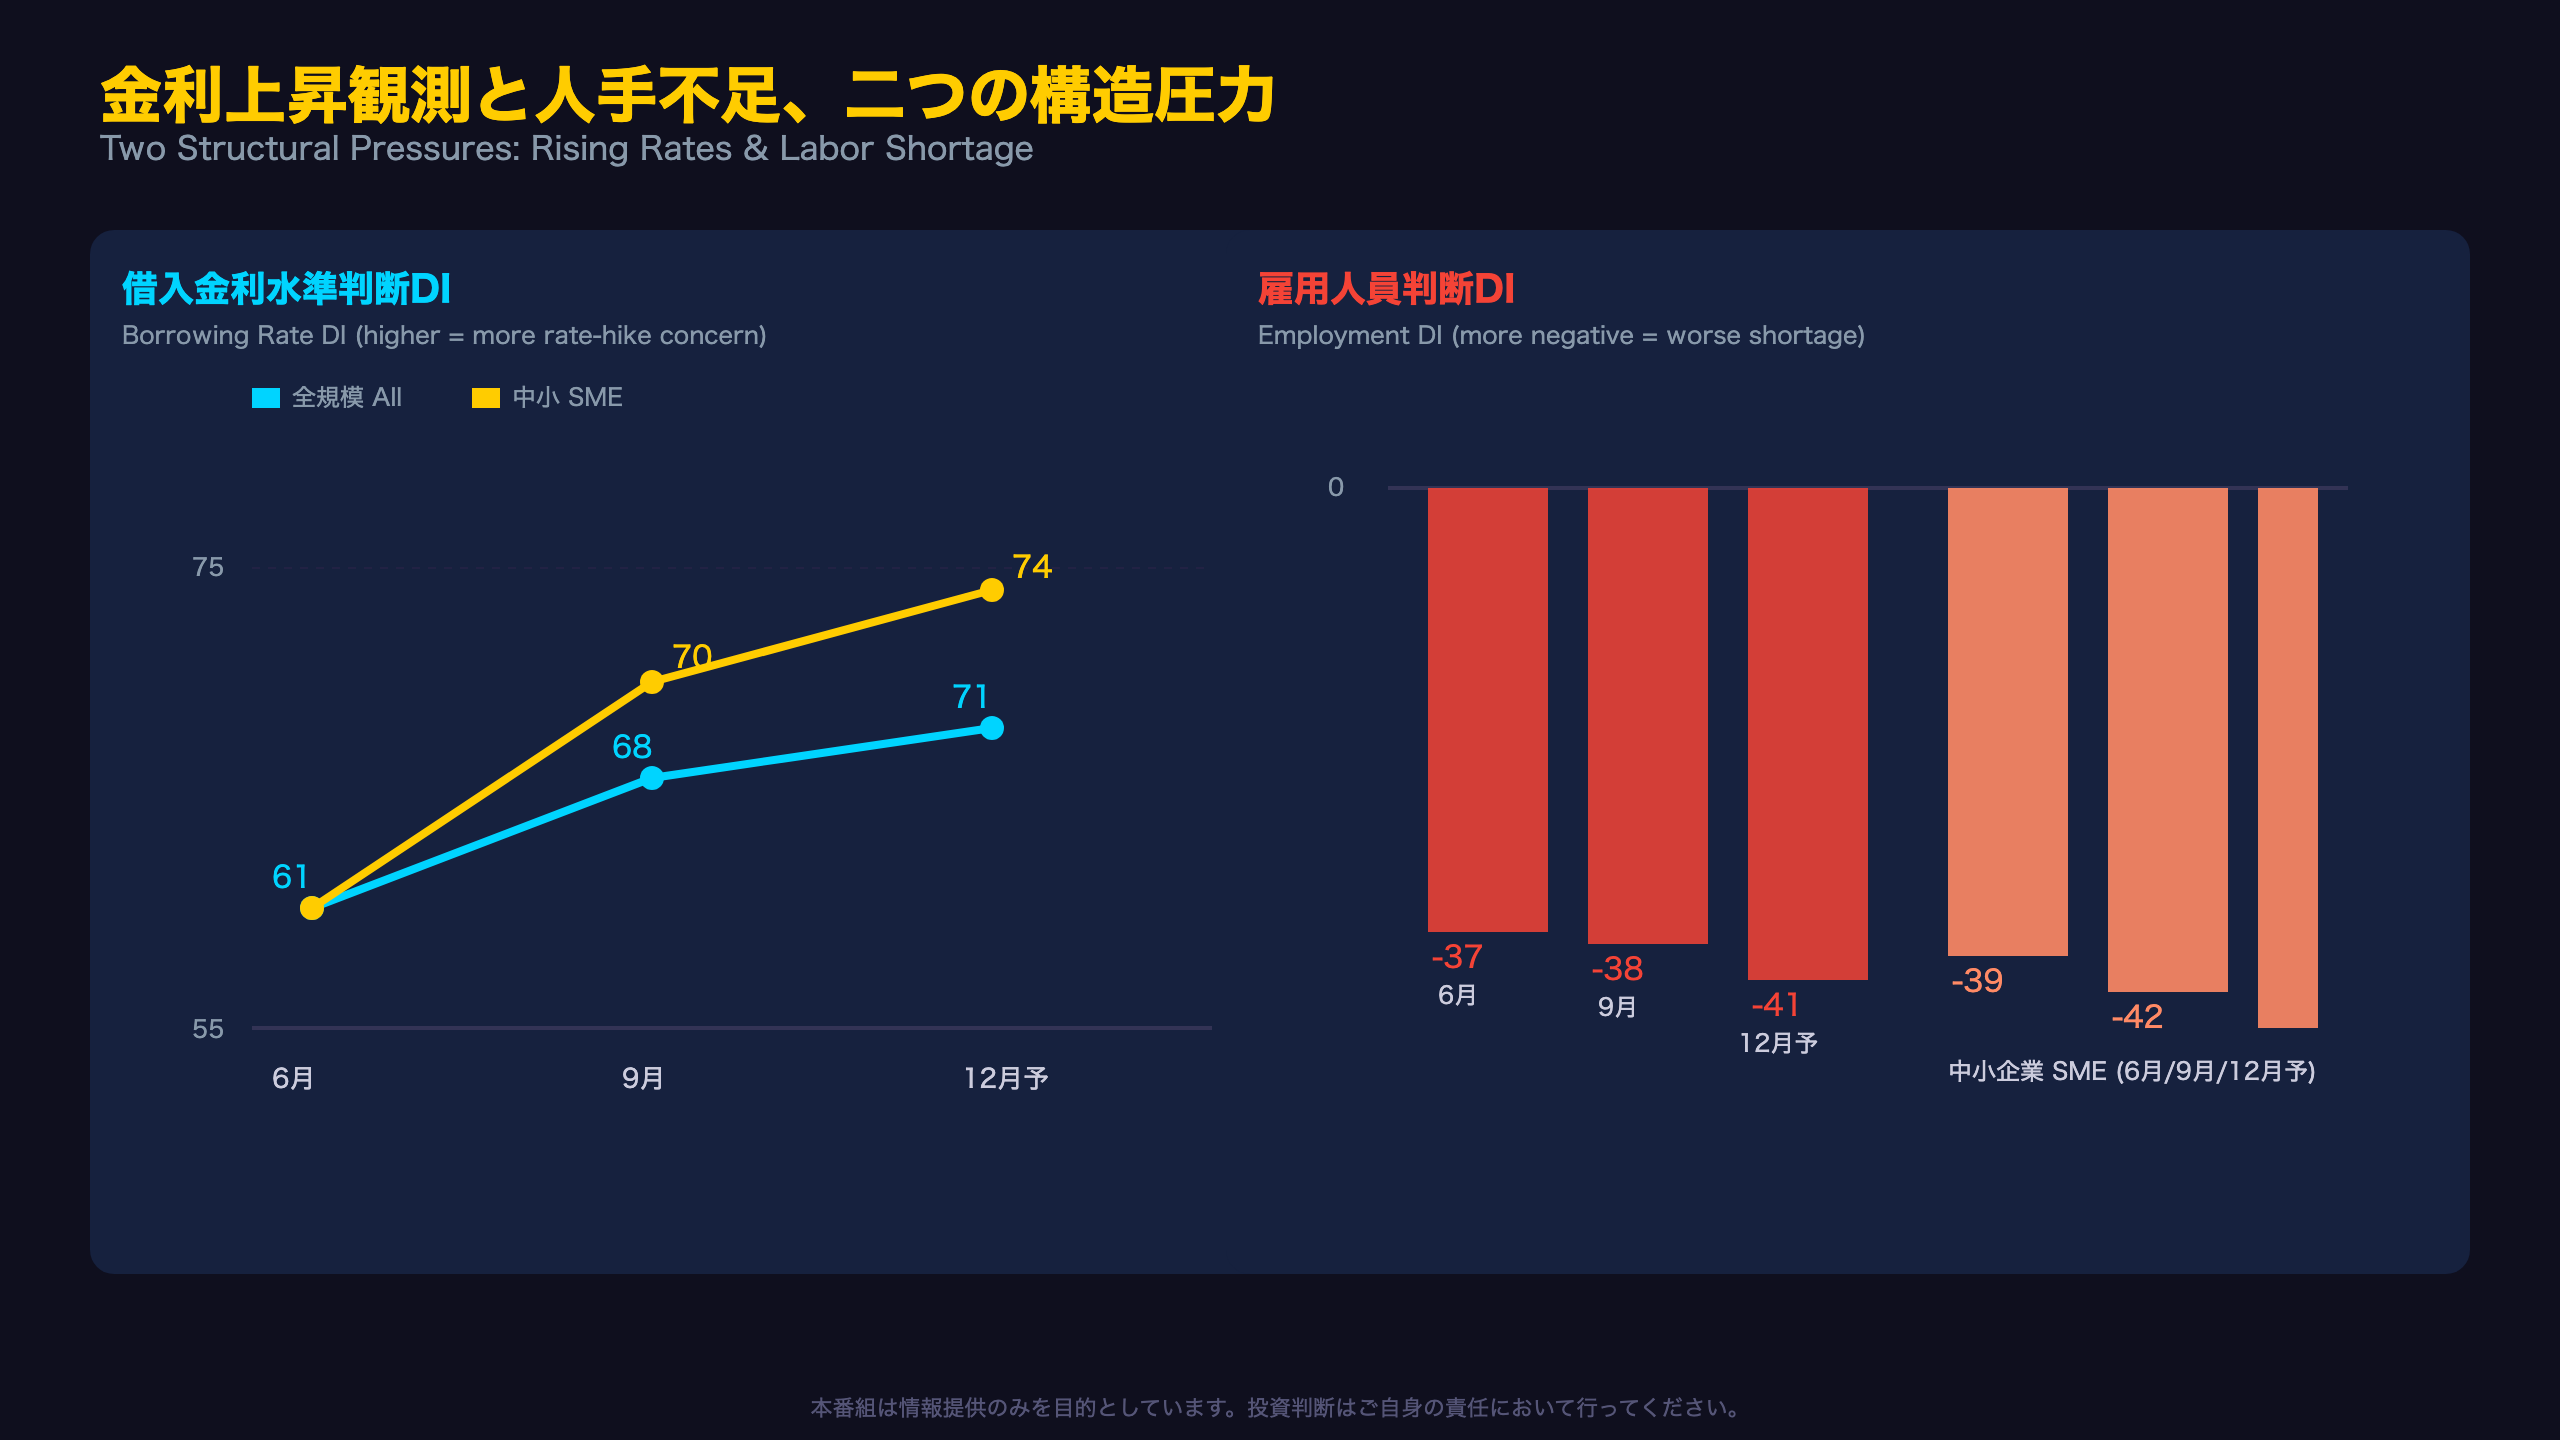
How Japanese Firms Are Pricing In a “World With Interest Rates”
The borrowing rate DI offers a direct window into how corporate Japan is internalizing expectations for Bank of Japan policy normalization — a theme of intense interest to global rates and FX traders.
Borrowing Rate DI by Firm Size
| Segment | June | Sept | Dec Forecast |
|---|---|---|---|
| Large | 59 | 65 | 67 |
| Mid-size | 62 | 67 | 70 |
| SME | 61 | 70 | 74 |
| All Sizes | 61 | 68 | 71 |
Notably, SMEs’ rate expectations rose faster (+9pt) than large firms’ (+6pt) — suggesting smaller, typically less creditworthy borrowers are more acutely sensitive to anticipated funding cost increases.
Lending Attitudes Haven’t Tightened — Yet
Critically, the lending attitude DI (a measure of whether banks are becoming stricter) was essentially flat (13 to 13 nationwide), and the cash flow DI also held steady at 11. This means Japanese banks aren’t restricting credit access; companies are simply pricing in higher base rates, consistent with market expectations for continued BOJ rate hikes.
Labor Shortage: A Persistent Structural Theme
| Segment | June | Sept | Dec Forecast |
|---|---|---|---|
| Large | -28 | -29 | -31 |
| Mid-size | -38 | -38 | -40 |
| SME | -39 | -42 | -45 |
| All Sizes | -37 | -38 | -41 |
For context, Japan’s employment DI has run persistently negative (indicating chronic labor shortage, not surplus) for years — a stark contrast to how U.S. labor market surveys are typically read. Every segment’s shortage is expected to deepen further by December.
Why This Matters for BOJ Watchers
The combination of rising rate expectations and worsening labor shortages — which typically fuels wage growth — gives the BOJ two separate, reinforcing arguments for continued policy normalization, a key theme for JGB yield curve positioning.
物価見通しは高止まり、次回の焦点
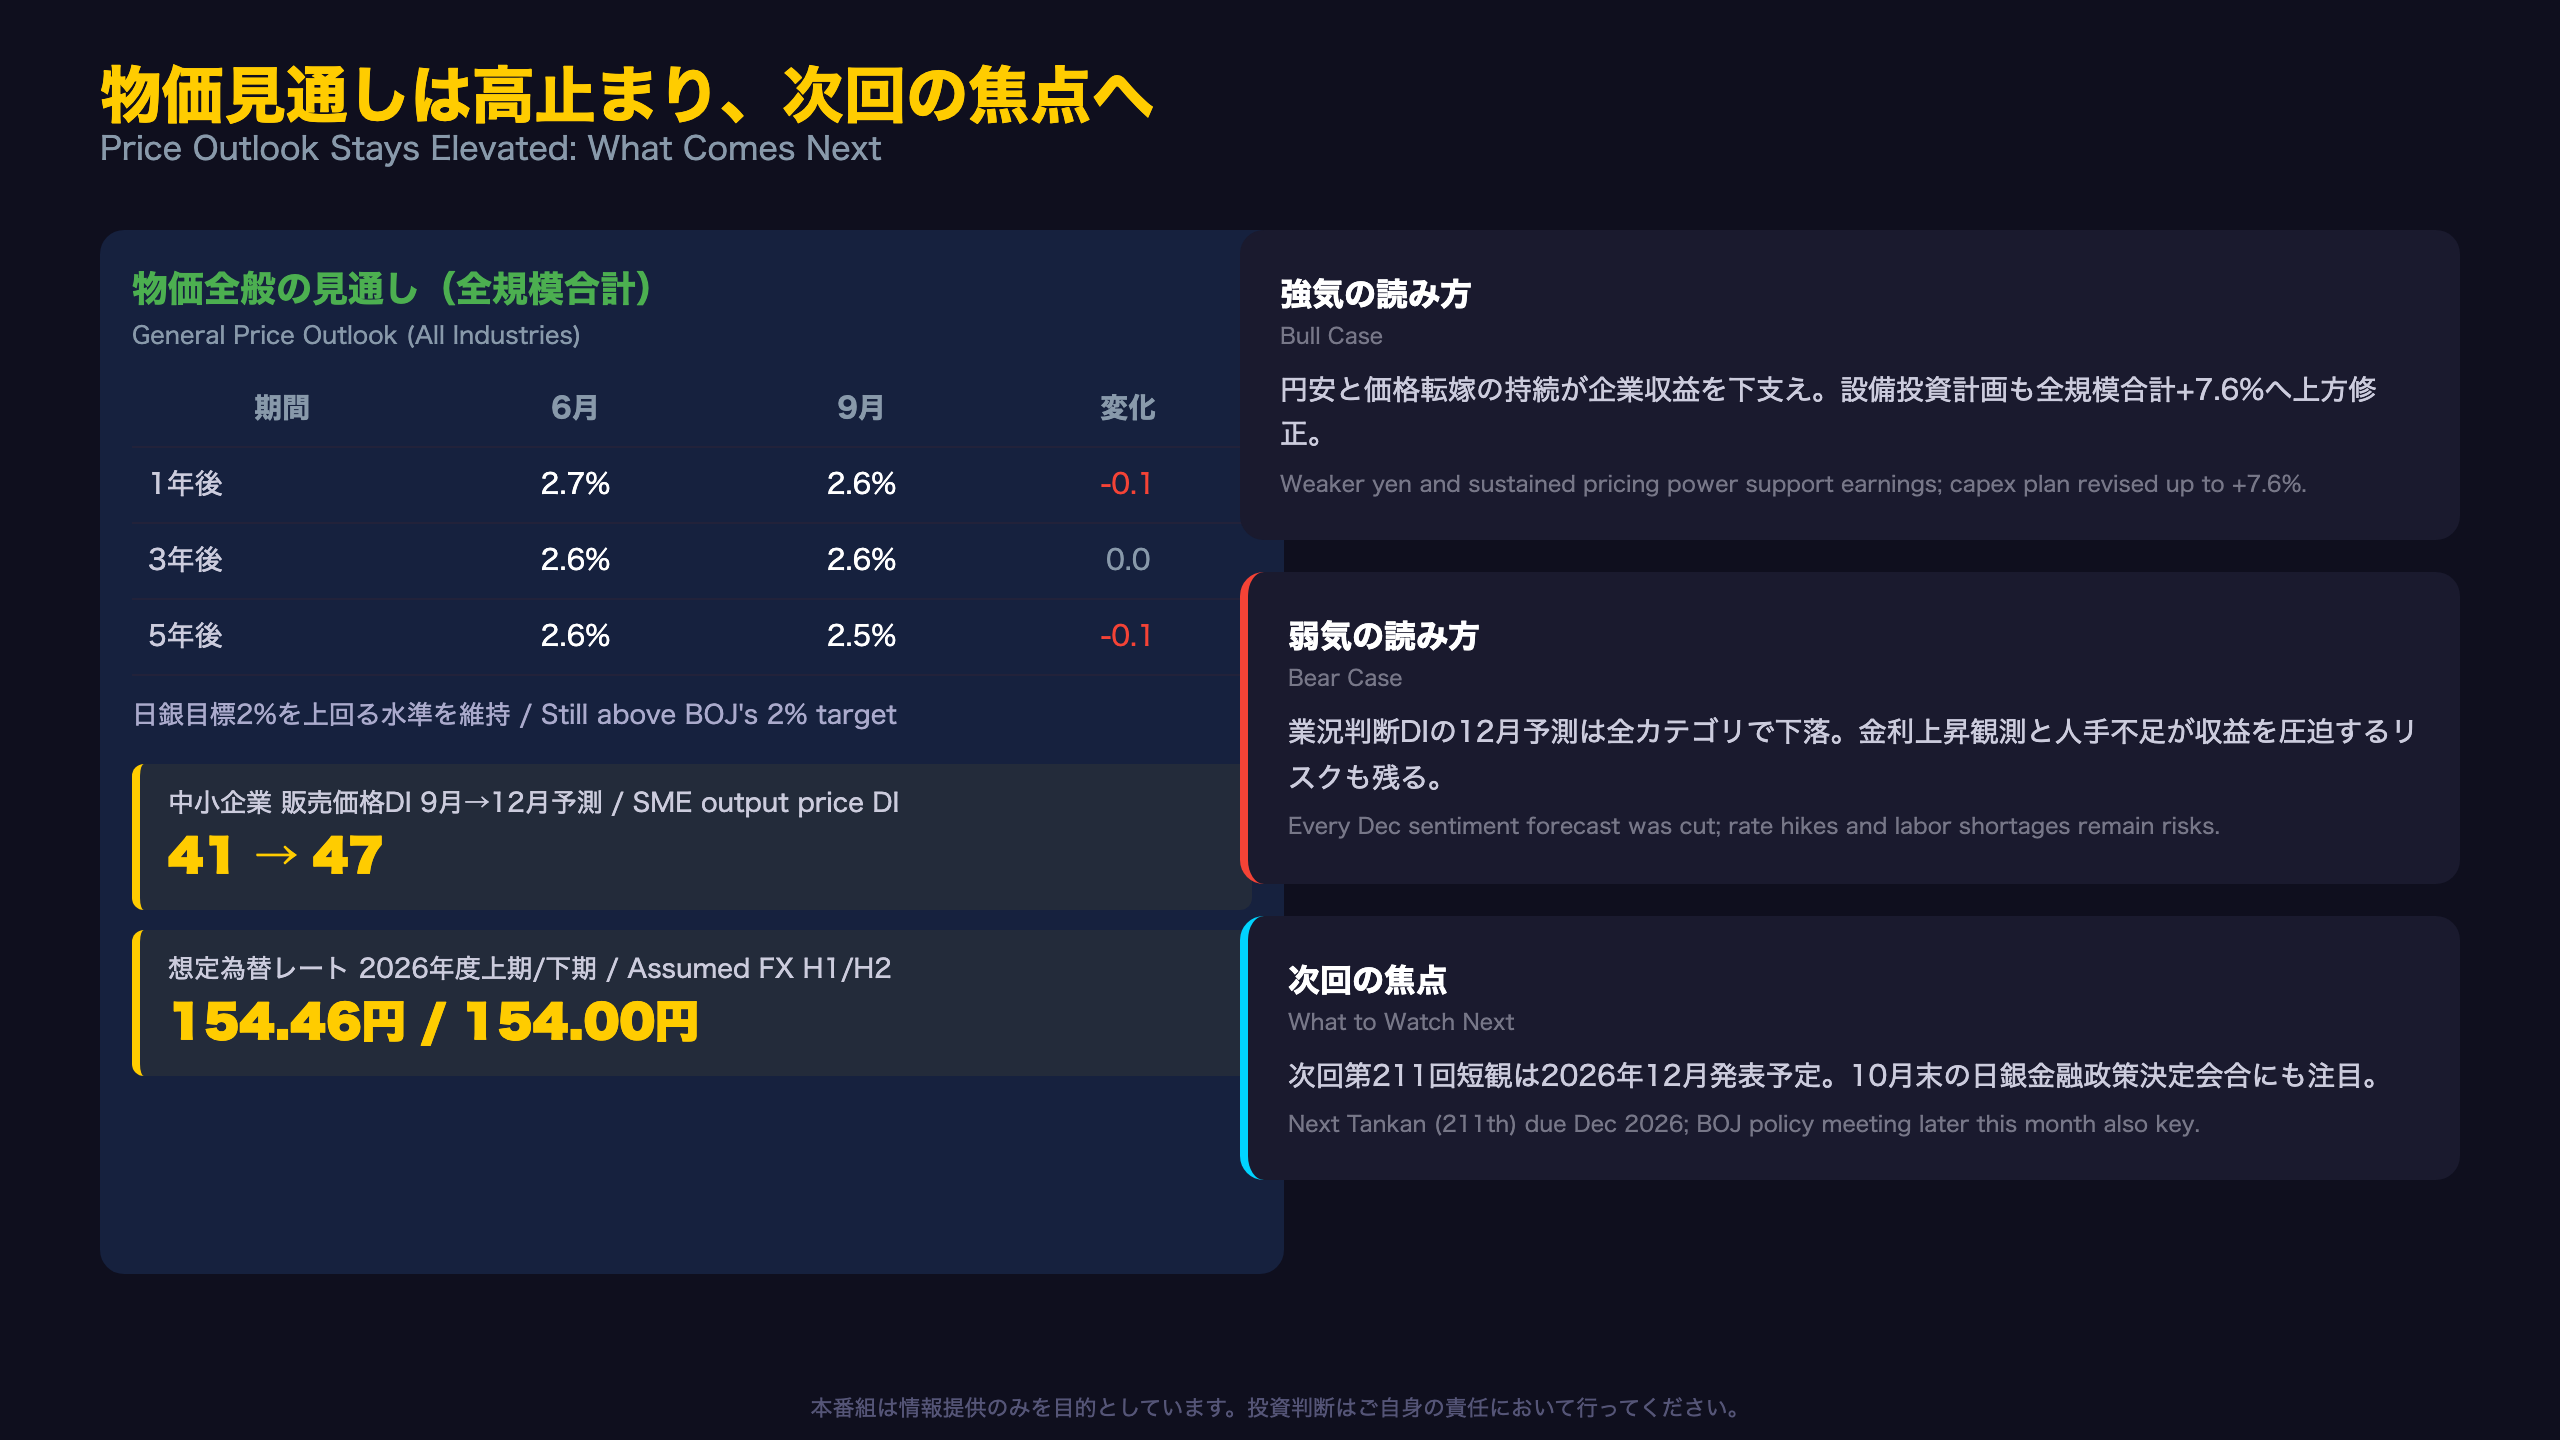
Inflation Expectations Stay Elevated, With a Subtle Softening Signal
Corporate inflation expectations are among the quietest but most policy-relevant data points in this Tankan release.
General Price Outlook (All Industries, All Sizes)
| Horizon | June | Sept | Change |
|---|---|---|---|
| 1-year | 2.7% | 2.6% | -0.1pt |
| 3-year | 2.6% | 2.6% | 0.0pt |
| 5-year | 2.6% | 2.5% | -0.1pt |
For international readers: this measure is Japan’s closest equivalent to the University of Michigan or New York Fed’s consumer/business inflation expectations surveys, but drawn directly from corporate respondents rather than consumers. All horizons remain comfortably above the BOJ’s 2% target — the inflation “anchor” remains intact, even as long-horizon expectations edged marginally lower.
SME Pricing Power Remains Intact
| Segment | 1yr Outlook June | 1yr Outlook Sept |
|---|---|---|
| Large Manufacturers | 3.2% | 3.2% |
| SME Manufacturers | 4.6% | 4.2% |
| SME Non-Manufacturers | 3.8% | 3.6% |
Despite easing input costs (SME input price DI fell from 76 to 71), the SME output price DI is still expected to climb from 41 to 47 by December — indicating firms aren’t giving up hard-won pricing power even as their own costs ease. This is a bullish margin signal for smaller Japanese firms.
FX Assumptions: A Consistent Weaker-Yen Tilt
FY2026 H1/H2 assumed rates moved to 154.46/154.00 yen per dollar, up from 152.62/152.51 in June — reinforcing the theme from the profit-plan data in the previous slide.
Bull vs Bear Case
Bull case: A weaker yen, resilient price pass-through, and upgraded capex plans (all-industry capex revised up to +7.6% for FY2026) together paint a picture of durable corporate strength.
Bear case: Every single December sentiment forecast was revised down, hinting the current improvement could be a plateau rather than a durable trend. Combined with rising borrowing costs and labor shortages (previous slide), margin pressure could resurface.
What Comes Next
The next Tankan survey (the 211th) is due in December 2026. The BOJ’s policy board meeting later this month will also be closely watched — particularly whether officials cite this survey’s mixed signals when discussing the path for further rate normalization.
Disclaimer: This article is for informational purposes only. All investment decisions are made solely at your own risk.







