📺 Watch the Full Video Analysis
This article was automatically generated by the NFC Market Live AI analysis system. (Updated: 2026-10-07 14:14 JST)
📄 Primary Source
内閣府経済社会総合研究所
https://www.esri.cao.go.jp/jp/stat/di/202608psummary.pdf
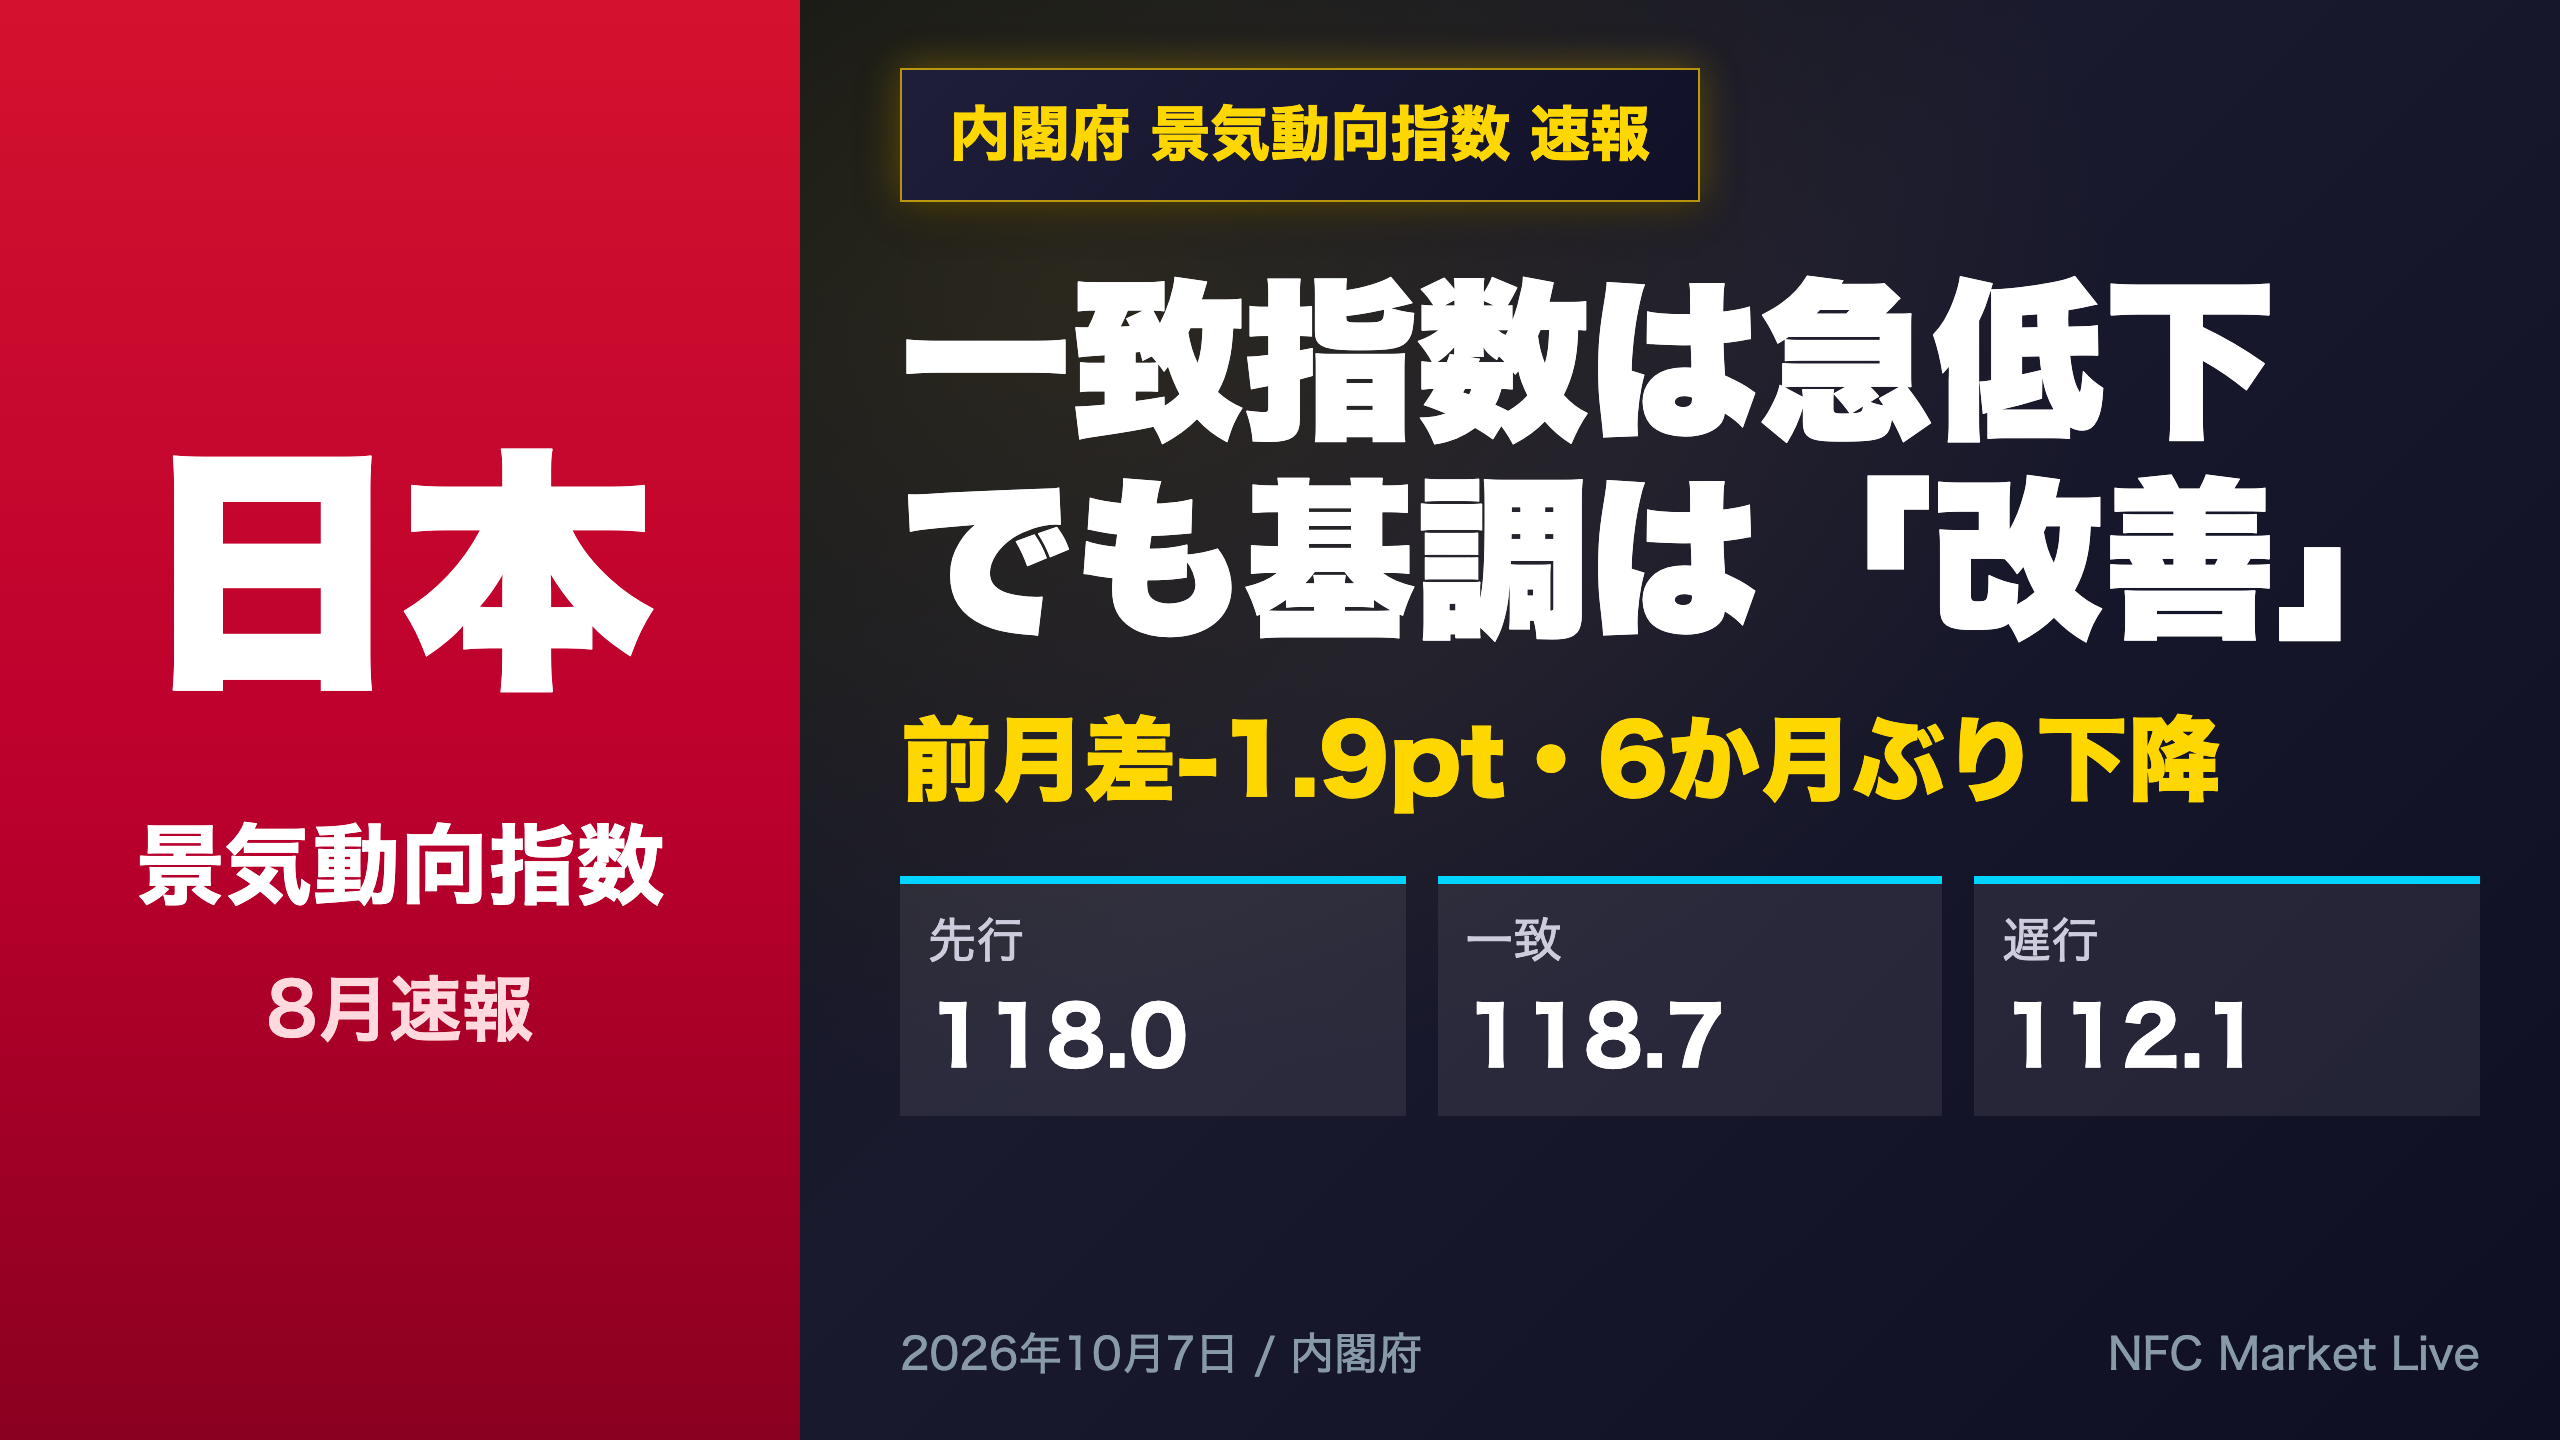
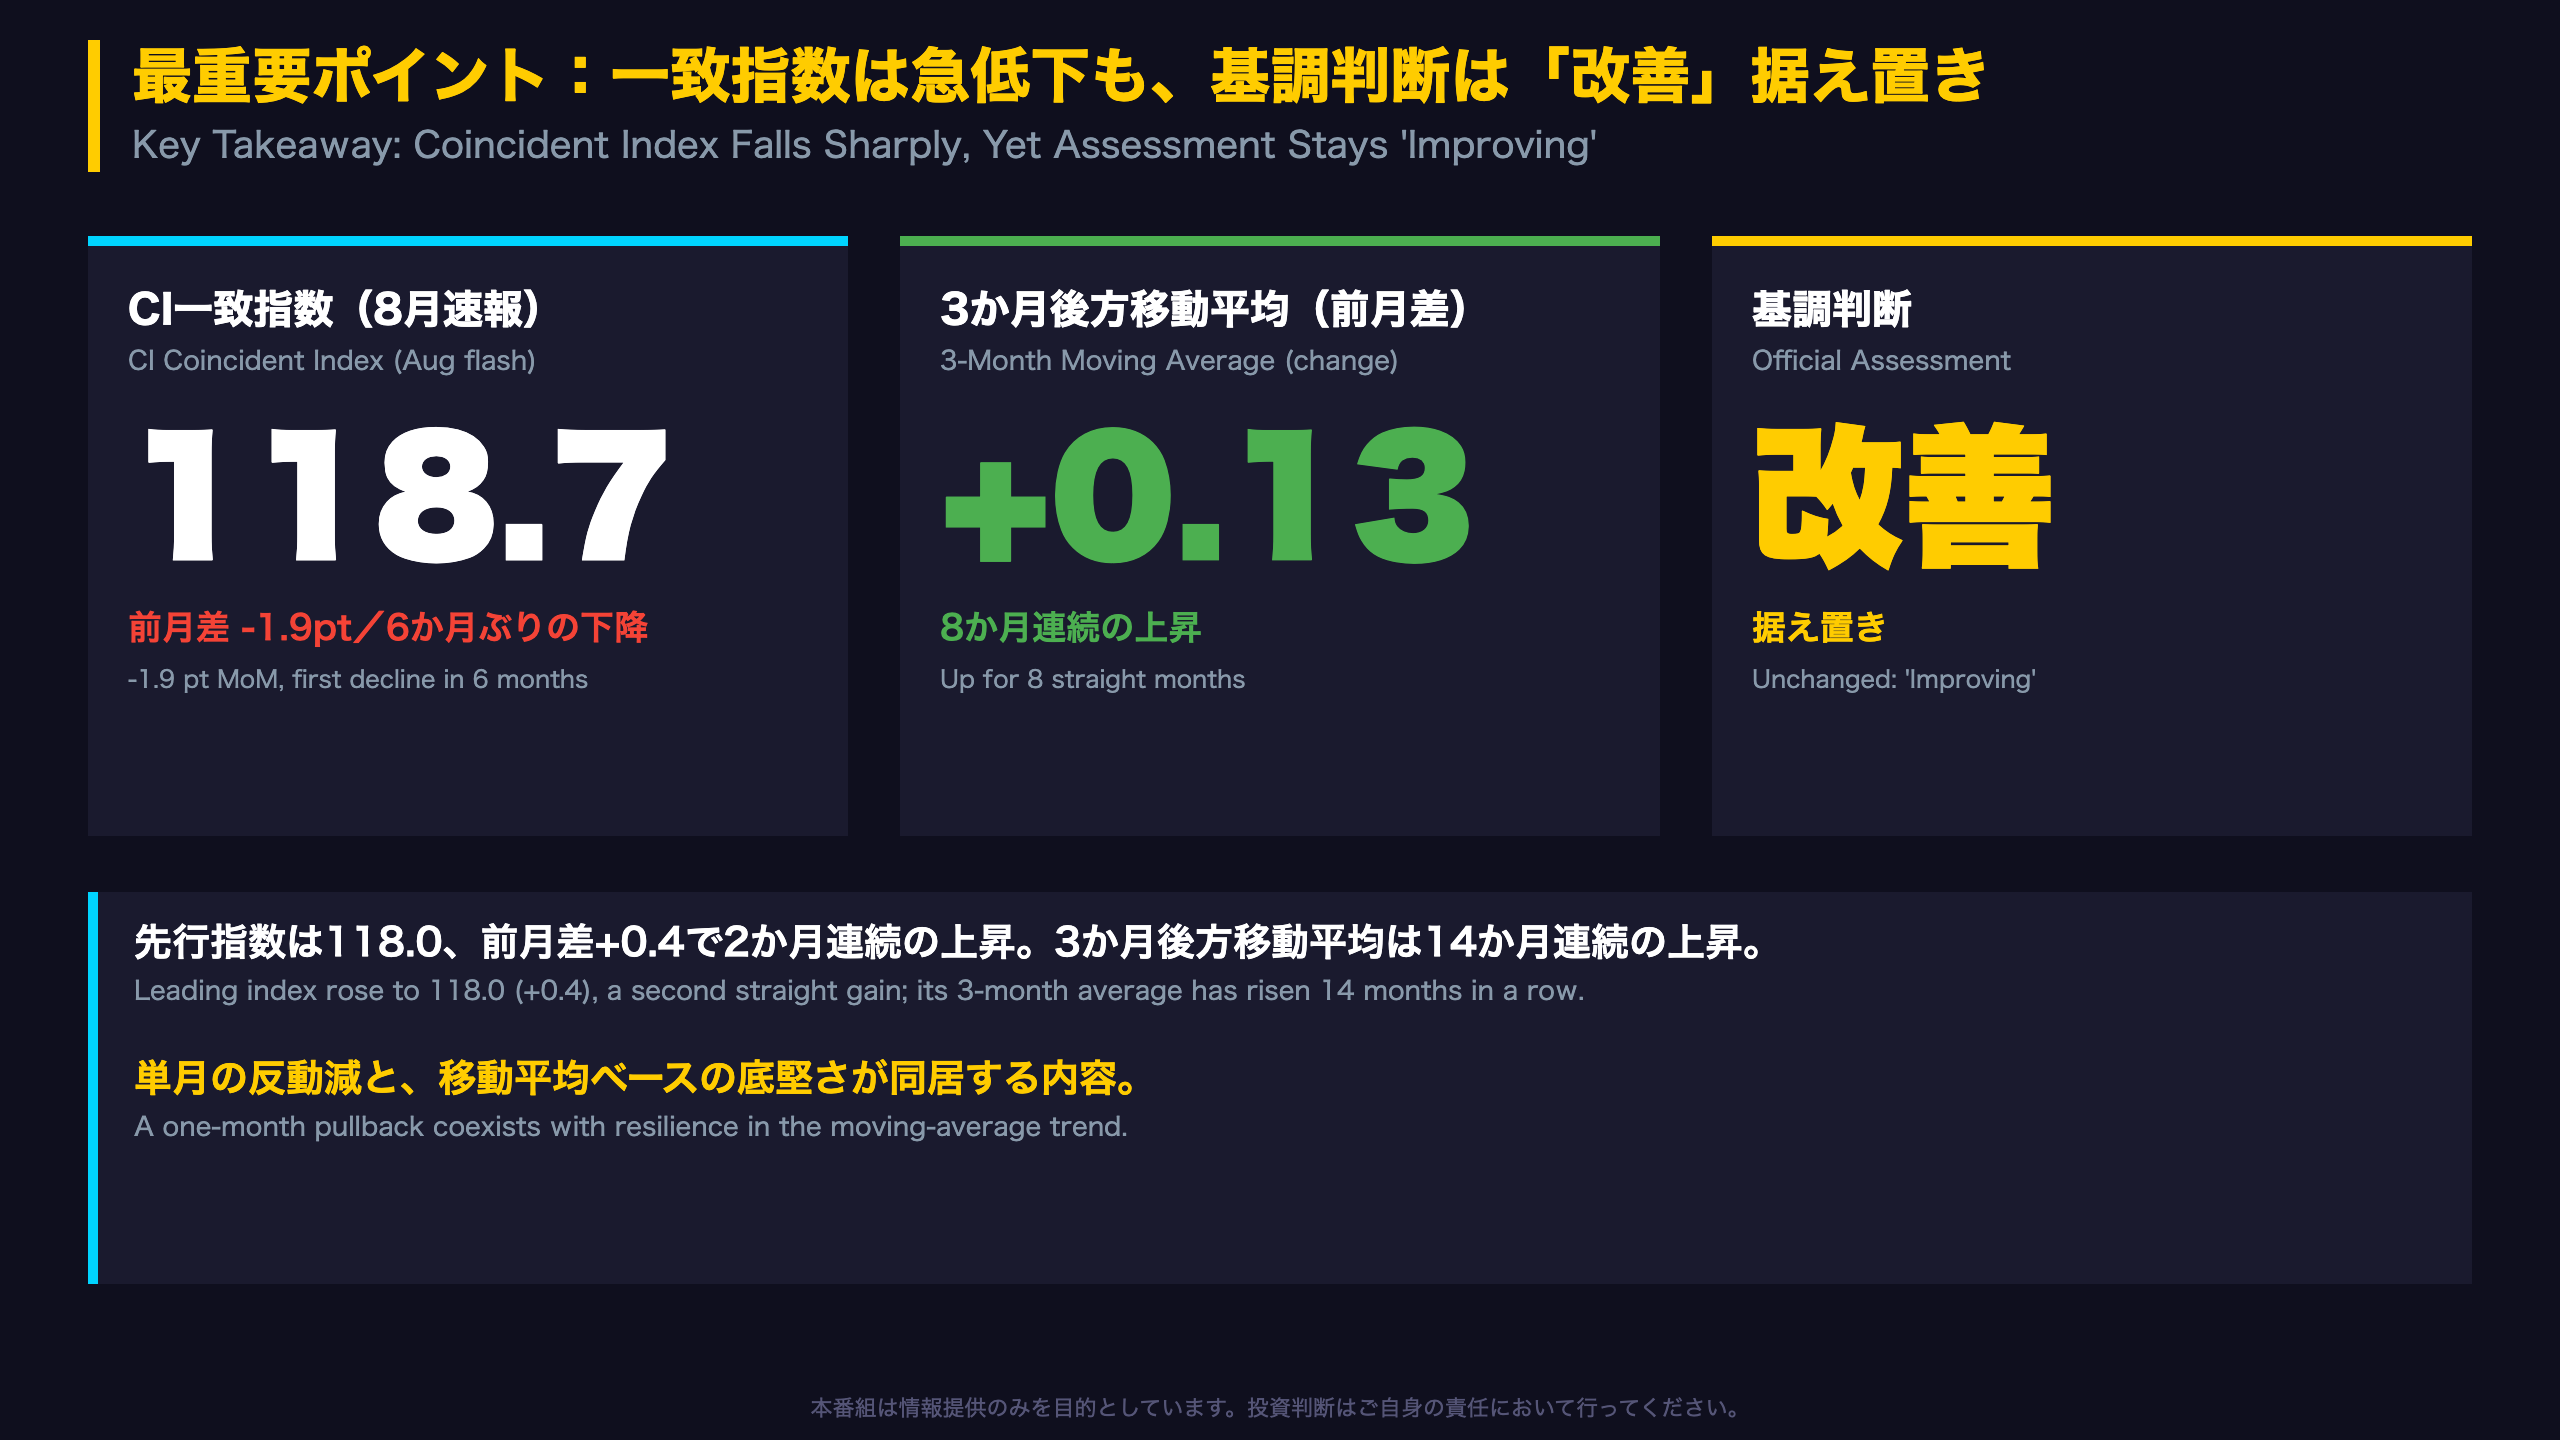
📊 Japan’s Cabinet Office released the August flash Composite Index. The coincident index fell 1.9 points to 118.7, its first decline in six months.
📈 Yet the three-month moving average still rose 0.13 pts for an eighth straight month, the leading index climbed to 118.0, and the official assessment stayed at ‘improving’.
⚠️ Four series (producer goods shipments, durable goods shipments, exports, industrial production) explain -1.75 pts of the drop. Payback from July’s jump and flash-revision risk both matter.
💡 Next focus: does the September data show a rebound in output and shipments?
最重要ポイント:急低下でも基調は「改善」据え置き
Reading Japan’s August Composite Index
What it is. The Composite Index (CI) is compiled by the Economic and Social Research Institute within Japan’s Cabinet Office. It blends leading, coincident and lagging indicators (2020 = 100). The coincident index merges 10 series such as industrial production, shipments, retail and wholesale sales and the job-offers ratio.
Headline numbers
- Coincident: 118.7 (-1.9 pts; first fall in six months)
- Leading: 118.0 (+0.4)
- Lagging: 112.1 (-0.9)
Why the verdict did not change
The Cabinet Office does not grade the cycle on a single month. It leans on three- and seven-month moving averages. The three-month average still rose 0.13 pts, its eighth straight gain, so the official call remained ‘improving’.
A U.S. comparison
The CI is similar in spirit to the Conference Board’s leading, coincident and lagging indexes in the United States. Japan’s coincident gauge, however, gives each of its 10 inputs equal weight and attaches explicit, rule-based wording to the cycle (‘improving’, ‘pausing’, ‘worsening’).
Market angle
For global investors, a sharp one-month drop alongside a steady moving-average trend is a mixed signal for the yen and Japanese equities. July’s strong print (+1.7 pts) means part of August’s fall may be payback. The September release will help show whether the dip is noise or the start of a slowdown.
下落の主因は生産・出荷・輸出の4系列
Where the 1.9-Point Drop Came From
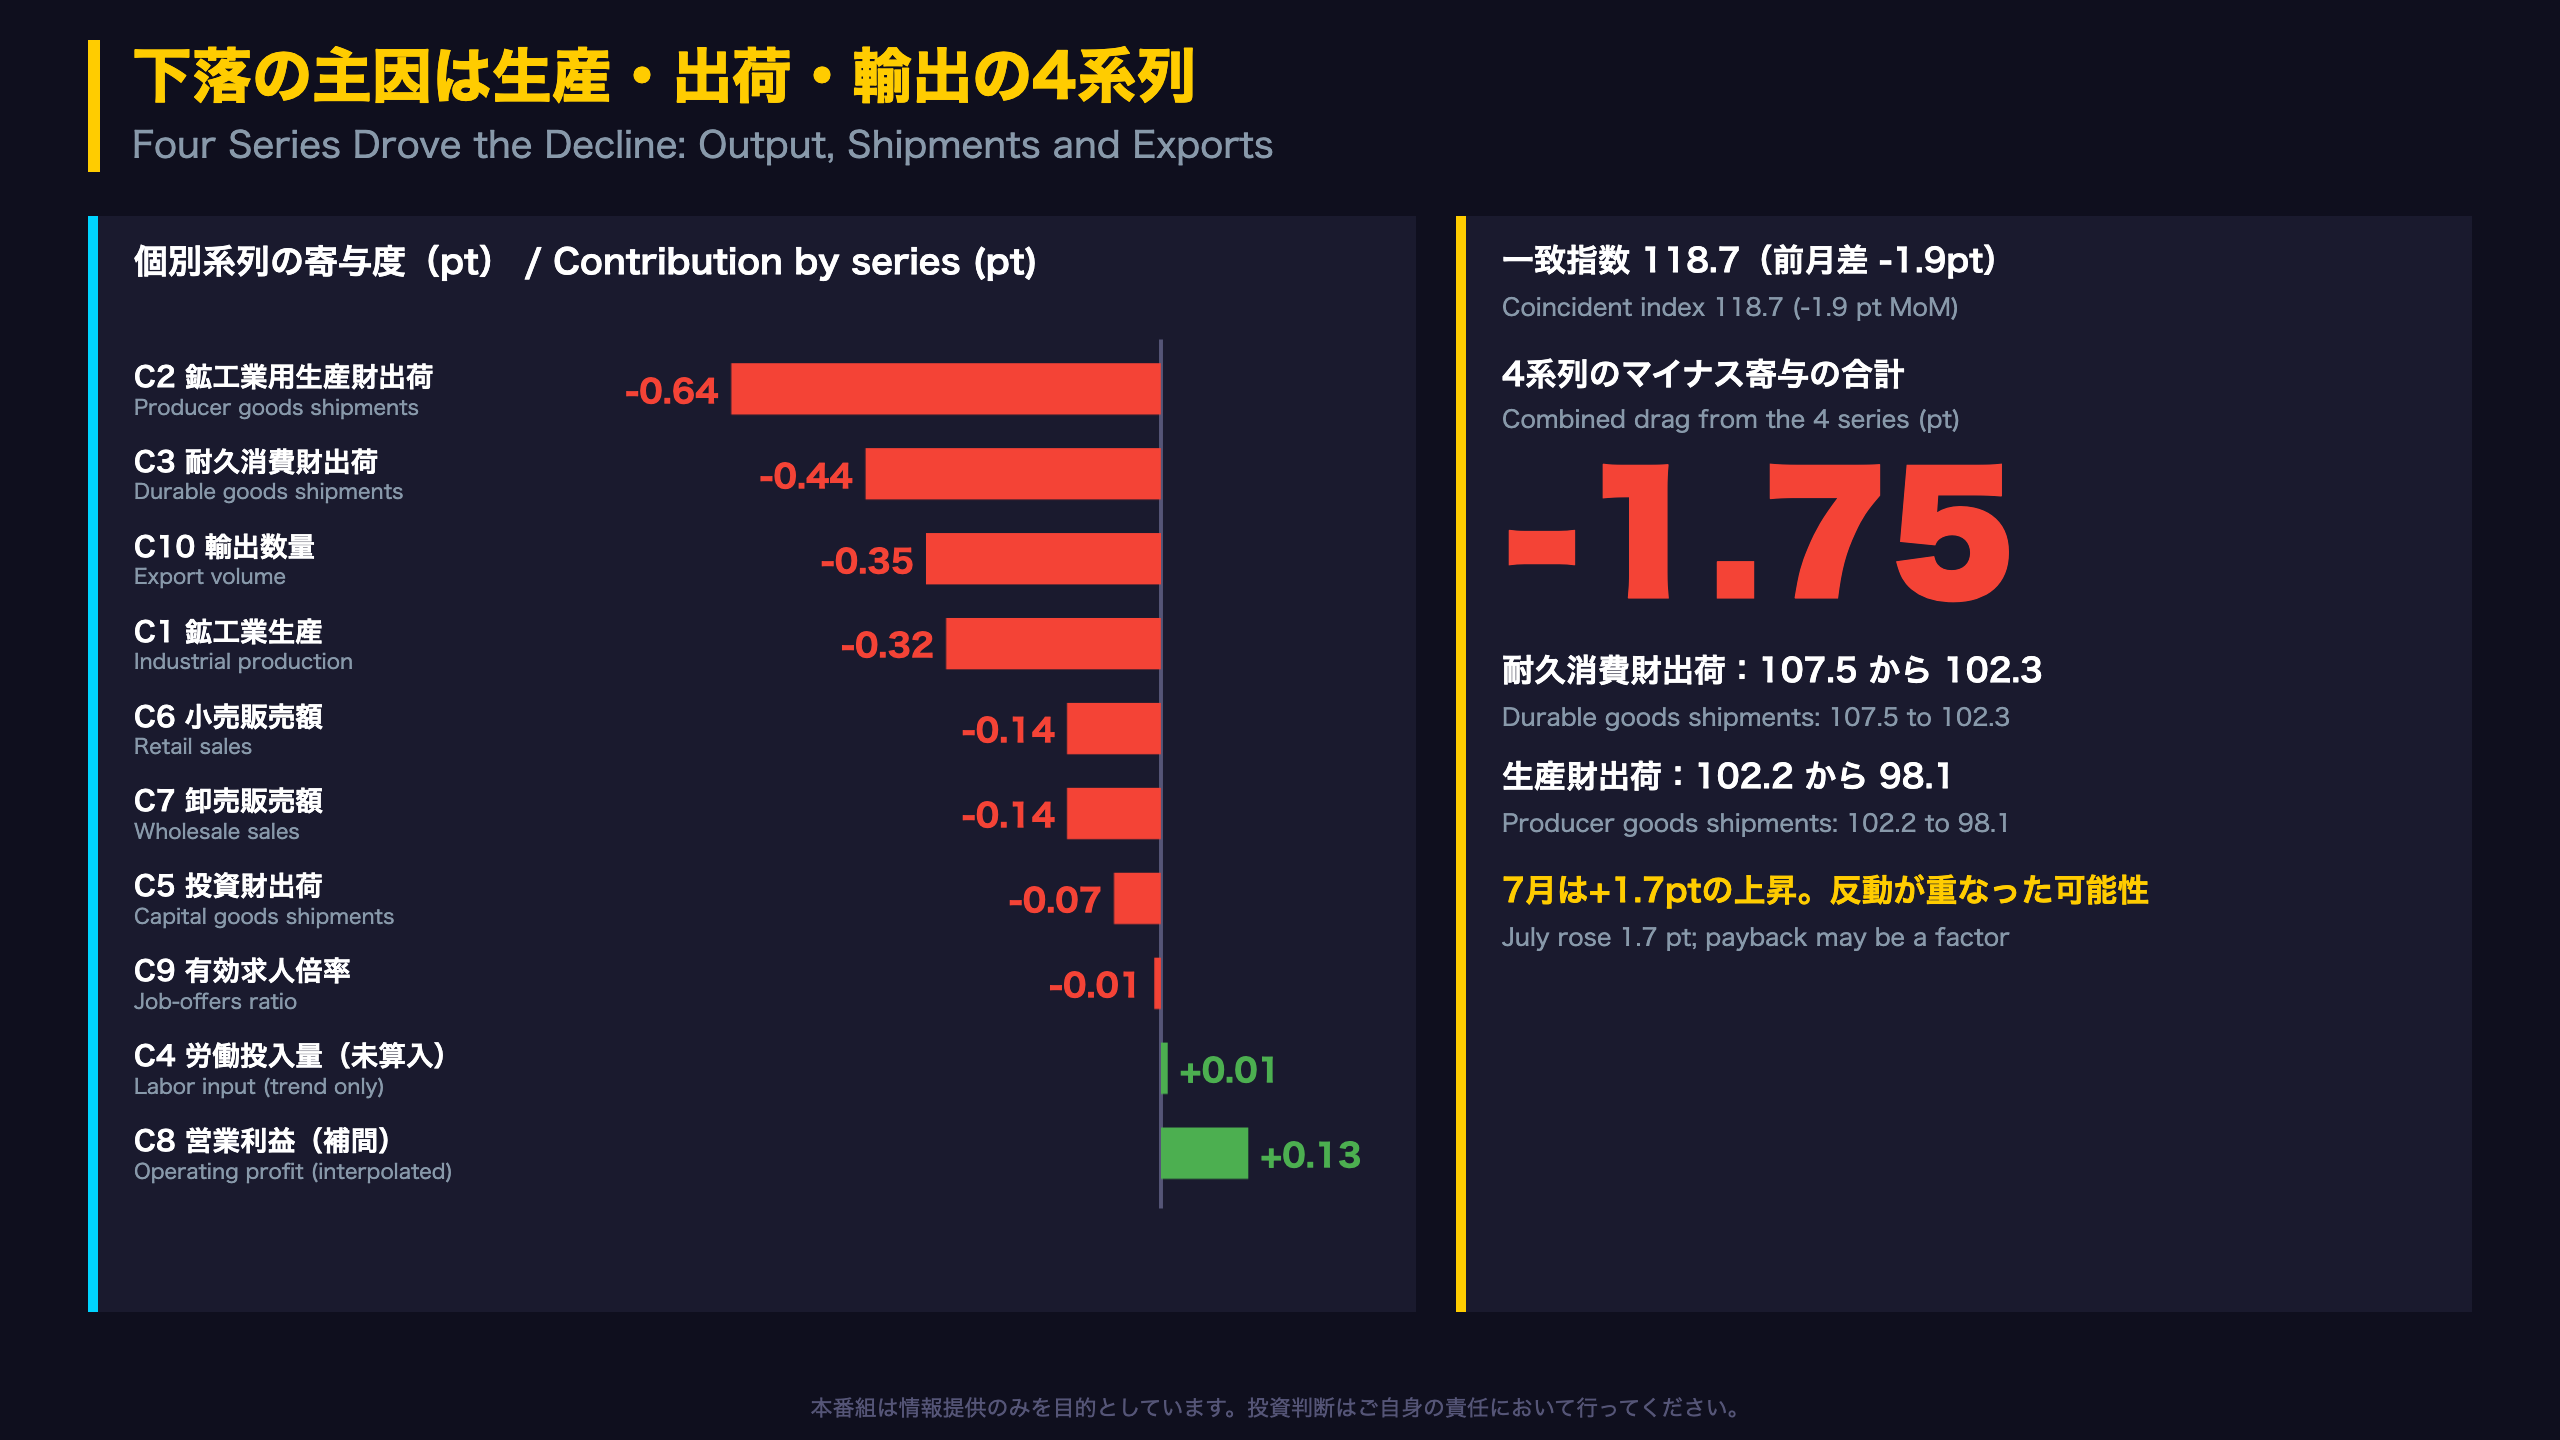
The report publishes each series’ contribution to the monthly change in the coincident index. Four series explain most of the fall:
| Series | Aug contribution (pts) |
|---|---|
| Producer goods shipments | -0.64 |
| Durable consumer goods shipments | -0.44 |
| Export volume | -0.35 |
| Industrial production | -0.32 |
Together that is -1.75 pts. Offsetting items were small: operating profit (+0.13, a quarterly figure interpolated across months) and labor input (+0.01), the latter not yet included in the August calculation.
The July comparison
In July, capital goods shipments (excluding transport equipment) added +0.61 pts and retail sales +0.38. In August these swung to -0.07 and -0.14. Capital goods shipments were 108.3 versus 108.9 in July, so the level held up even as the contribution faded.
Why this matters for interpretation
Shipment and export series are volatile month to month. Because all ten inputs carry equal weight, a simultaneous dip in several manufacturing-related series can dominate the index. That is a feature of the statistic, not necessarily evidence of broad weakness.
Bull vs. bear
- Bull case: wholesale sales still up 7.5% y/y; the job-offers ratio steady at 1.18.
- Bear case: durable goods shipments fell from 107.5 to 102.3, and export volume dropped to 103.5.
The report itself notes that contributions show each series’ impact on the monthly change in the index, which is why the July-to-August swing in those contributions is the cleanest way to see what changed.
基調判断の仕組み:移動平均は上昇も勢いは鈍化
How Japan’s Official Cycle Call Works
The Cabinet Office maps the coincident index to five labels: improving, pausing, turning point, worsening and bottoming out. The call is based mainly on the three-month and seven-month backward moving averages, plus the sign of the latest monthly change.
Thresholds
- Improving: the three-month average has risen for roughly three or more consecutive months, and the latest monthly change is positive.
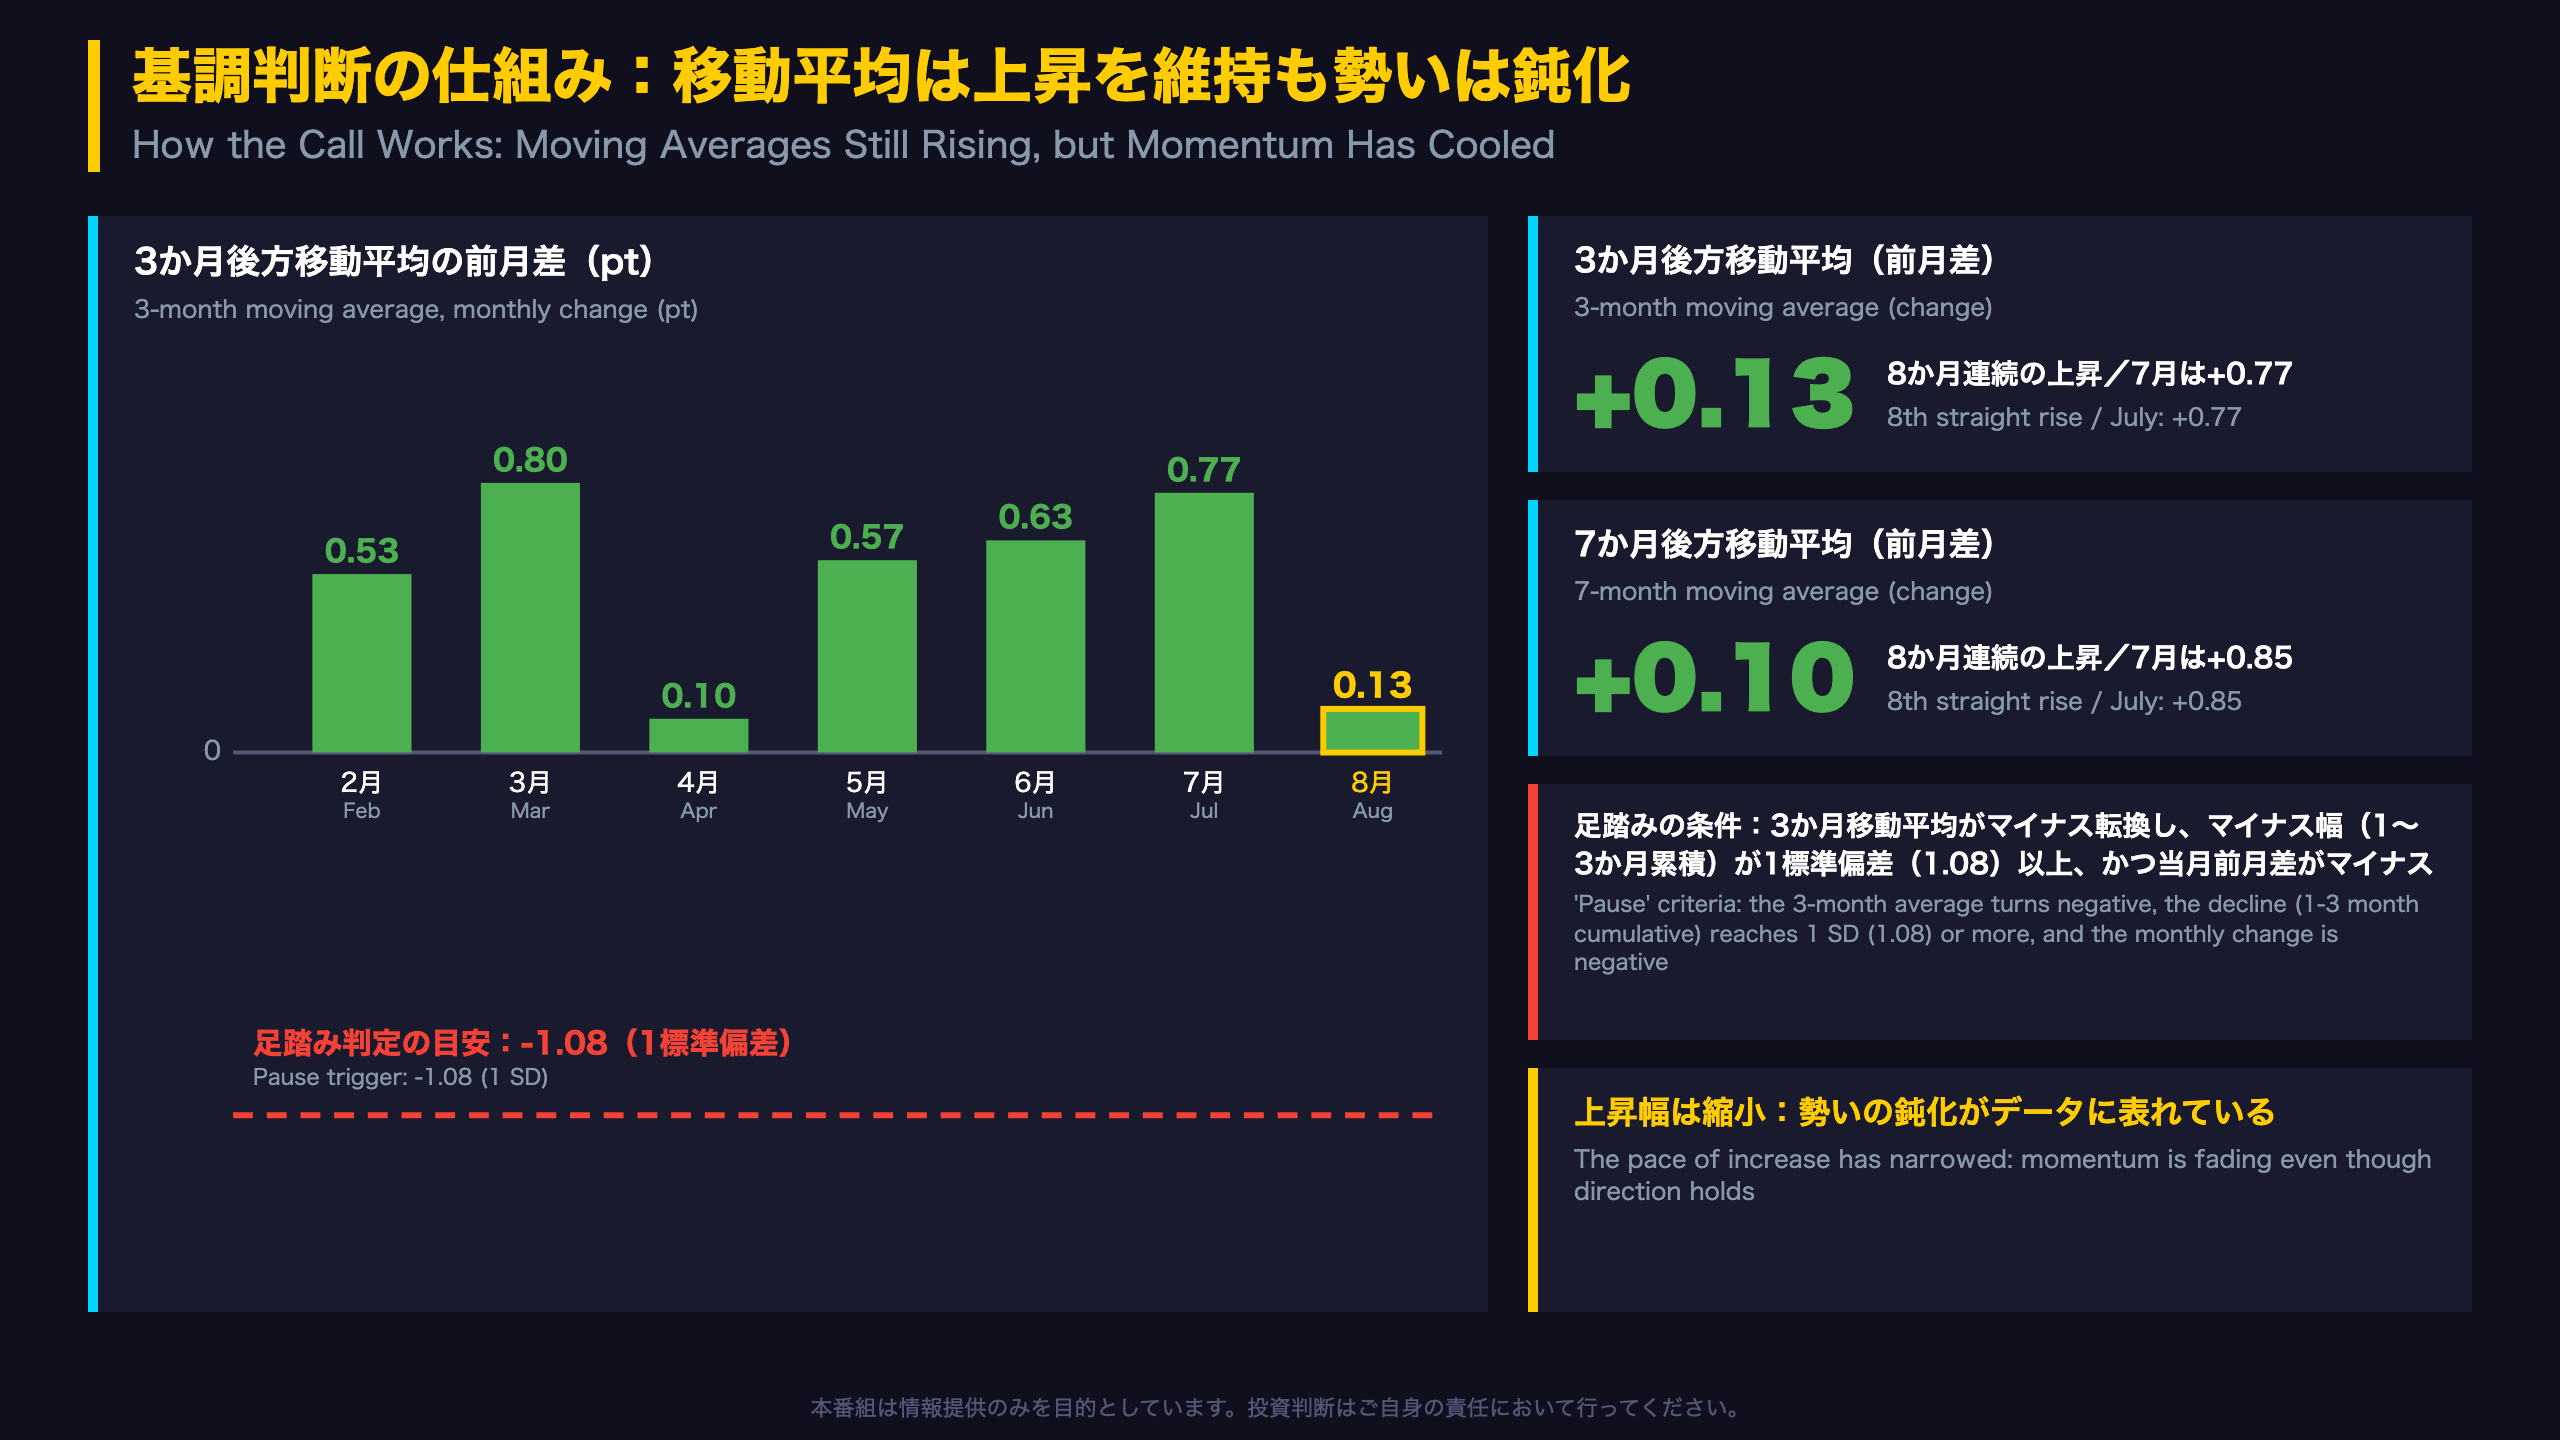
- Pausing: the three-month average’s change turns negative by at least one standard deviation (1.08 pts), and the latest monthly change is negative.
The standard deviations (1.08 for the three-month and 0.83 for the seven-month average) are based on January 1985 to December 2025 data.
Where August stands
| Jun | Jul | Aug | |
|---|---|---|---|
| 3-mo avg change | +0.63 | +0.77 | +0.13 |
| 7-mo avg change | +0.56 | +0.85 | +0.10 |
Both remain positive, far from the -1.08 pausing trigger. The report also states that when none of the five conditions applies, the previous call carries over, which is how an unchanged verdict can coexist with a negative monthly print.
Investor takeaway
This rule-based design limits whipsaws from one-off data. The flip side is that the label can lag: by the time it changes, momentum may already have shifted. Watch the sign of the three-month average in the September release, and note that April’s reading of +0.10 was similar in size to August’s and was followed by a recovery.
底堅さの裏付け:先行指数と需要・雇用
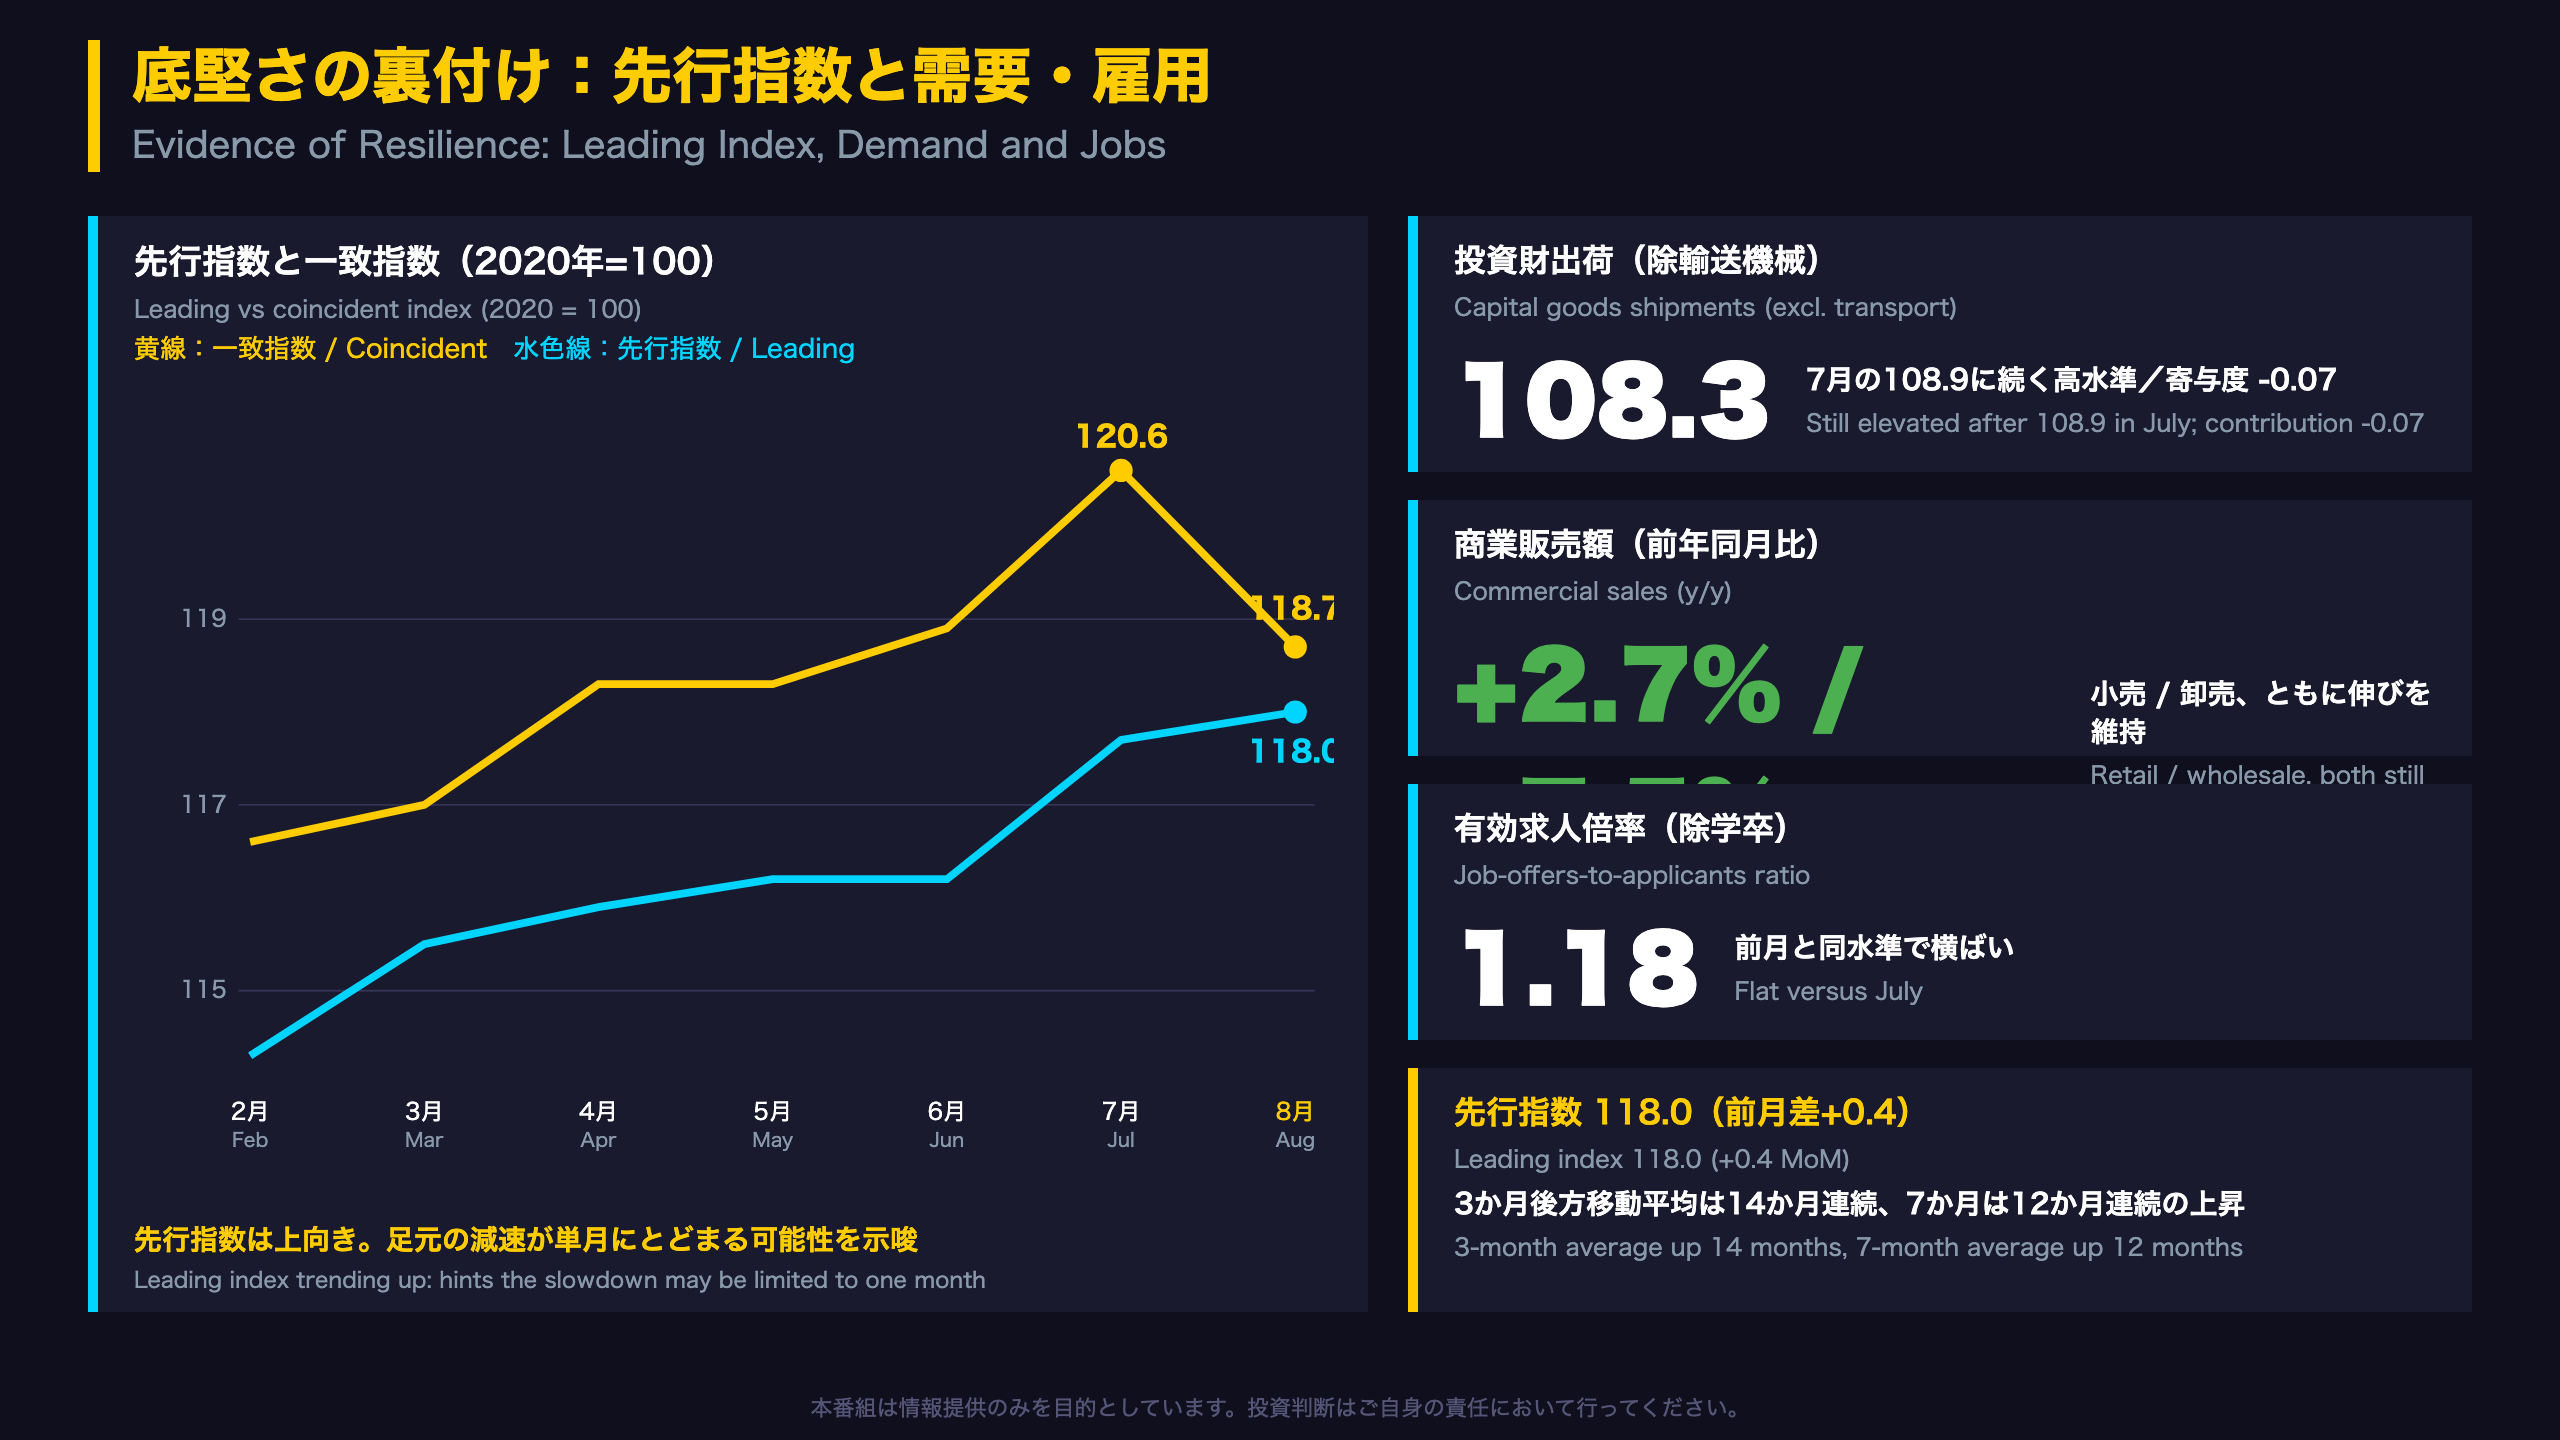
Leading Index and Pockets of Resilience
Leading index
The leading index climbed to 118.0 (+0.4), its second straight rise. Its three-month average has risen 14 months in a row, and the seven-month average 12 months. The August breakdown by component is not given in the report, so the drivers cannot be pinned down. Note also that the leading index was revised because real machinery orders (manufacturing) were re-deflated using a revised capital-goods price index.
Data points on the strong side
- Capital goods shipments (excluding transport): 108.3, near July’s 108.9
- Retail sales: +2.7% y/y; wholesale sales: +7.5% y/y
- Job-offers-to-applicants ratio: 1.18, within a 1.17 to 1.20 range since December
Context for global readers
The job-offers ratio is similar in concept to U.S. job openings per unemployed worker, though definitions and levels are not directly comparable. Japan’s CI is also unlike U.S. CPI or payrolls: it is a composite built from many series rather than a single survey.
Two readings
- Constructive: both the leading and coincident indexes sit well above February levels (114.3 and 116.6), consistent with an expansion that paused in August rather than reversed.
- Cautious: retail sales growth has swung between 0.6% and 5.0% y/y across recent months, so one reading is a thin basis for conclusions.
Market implications
Steady domestic data may keep investor attention on the Bank of Japan’s policy path and on the yen’s sensitivity to growth surprises. A firm September rebound in output would reinforce the constructive case, while a second weak month would raise questions about the leading index’s signal.
遅行指数・統計上の留意点・次回の焦点
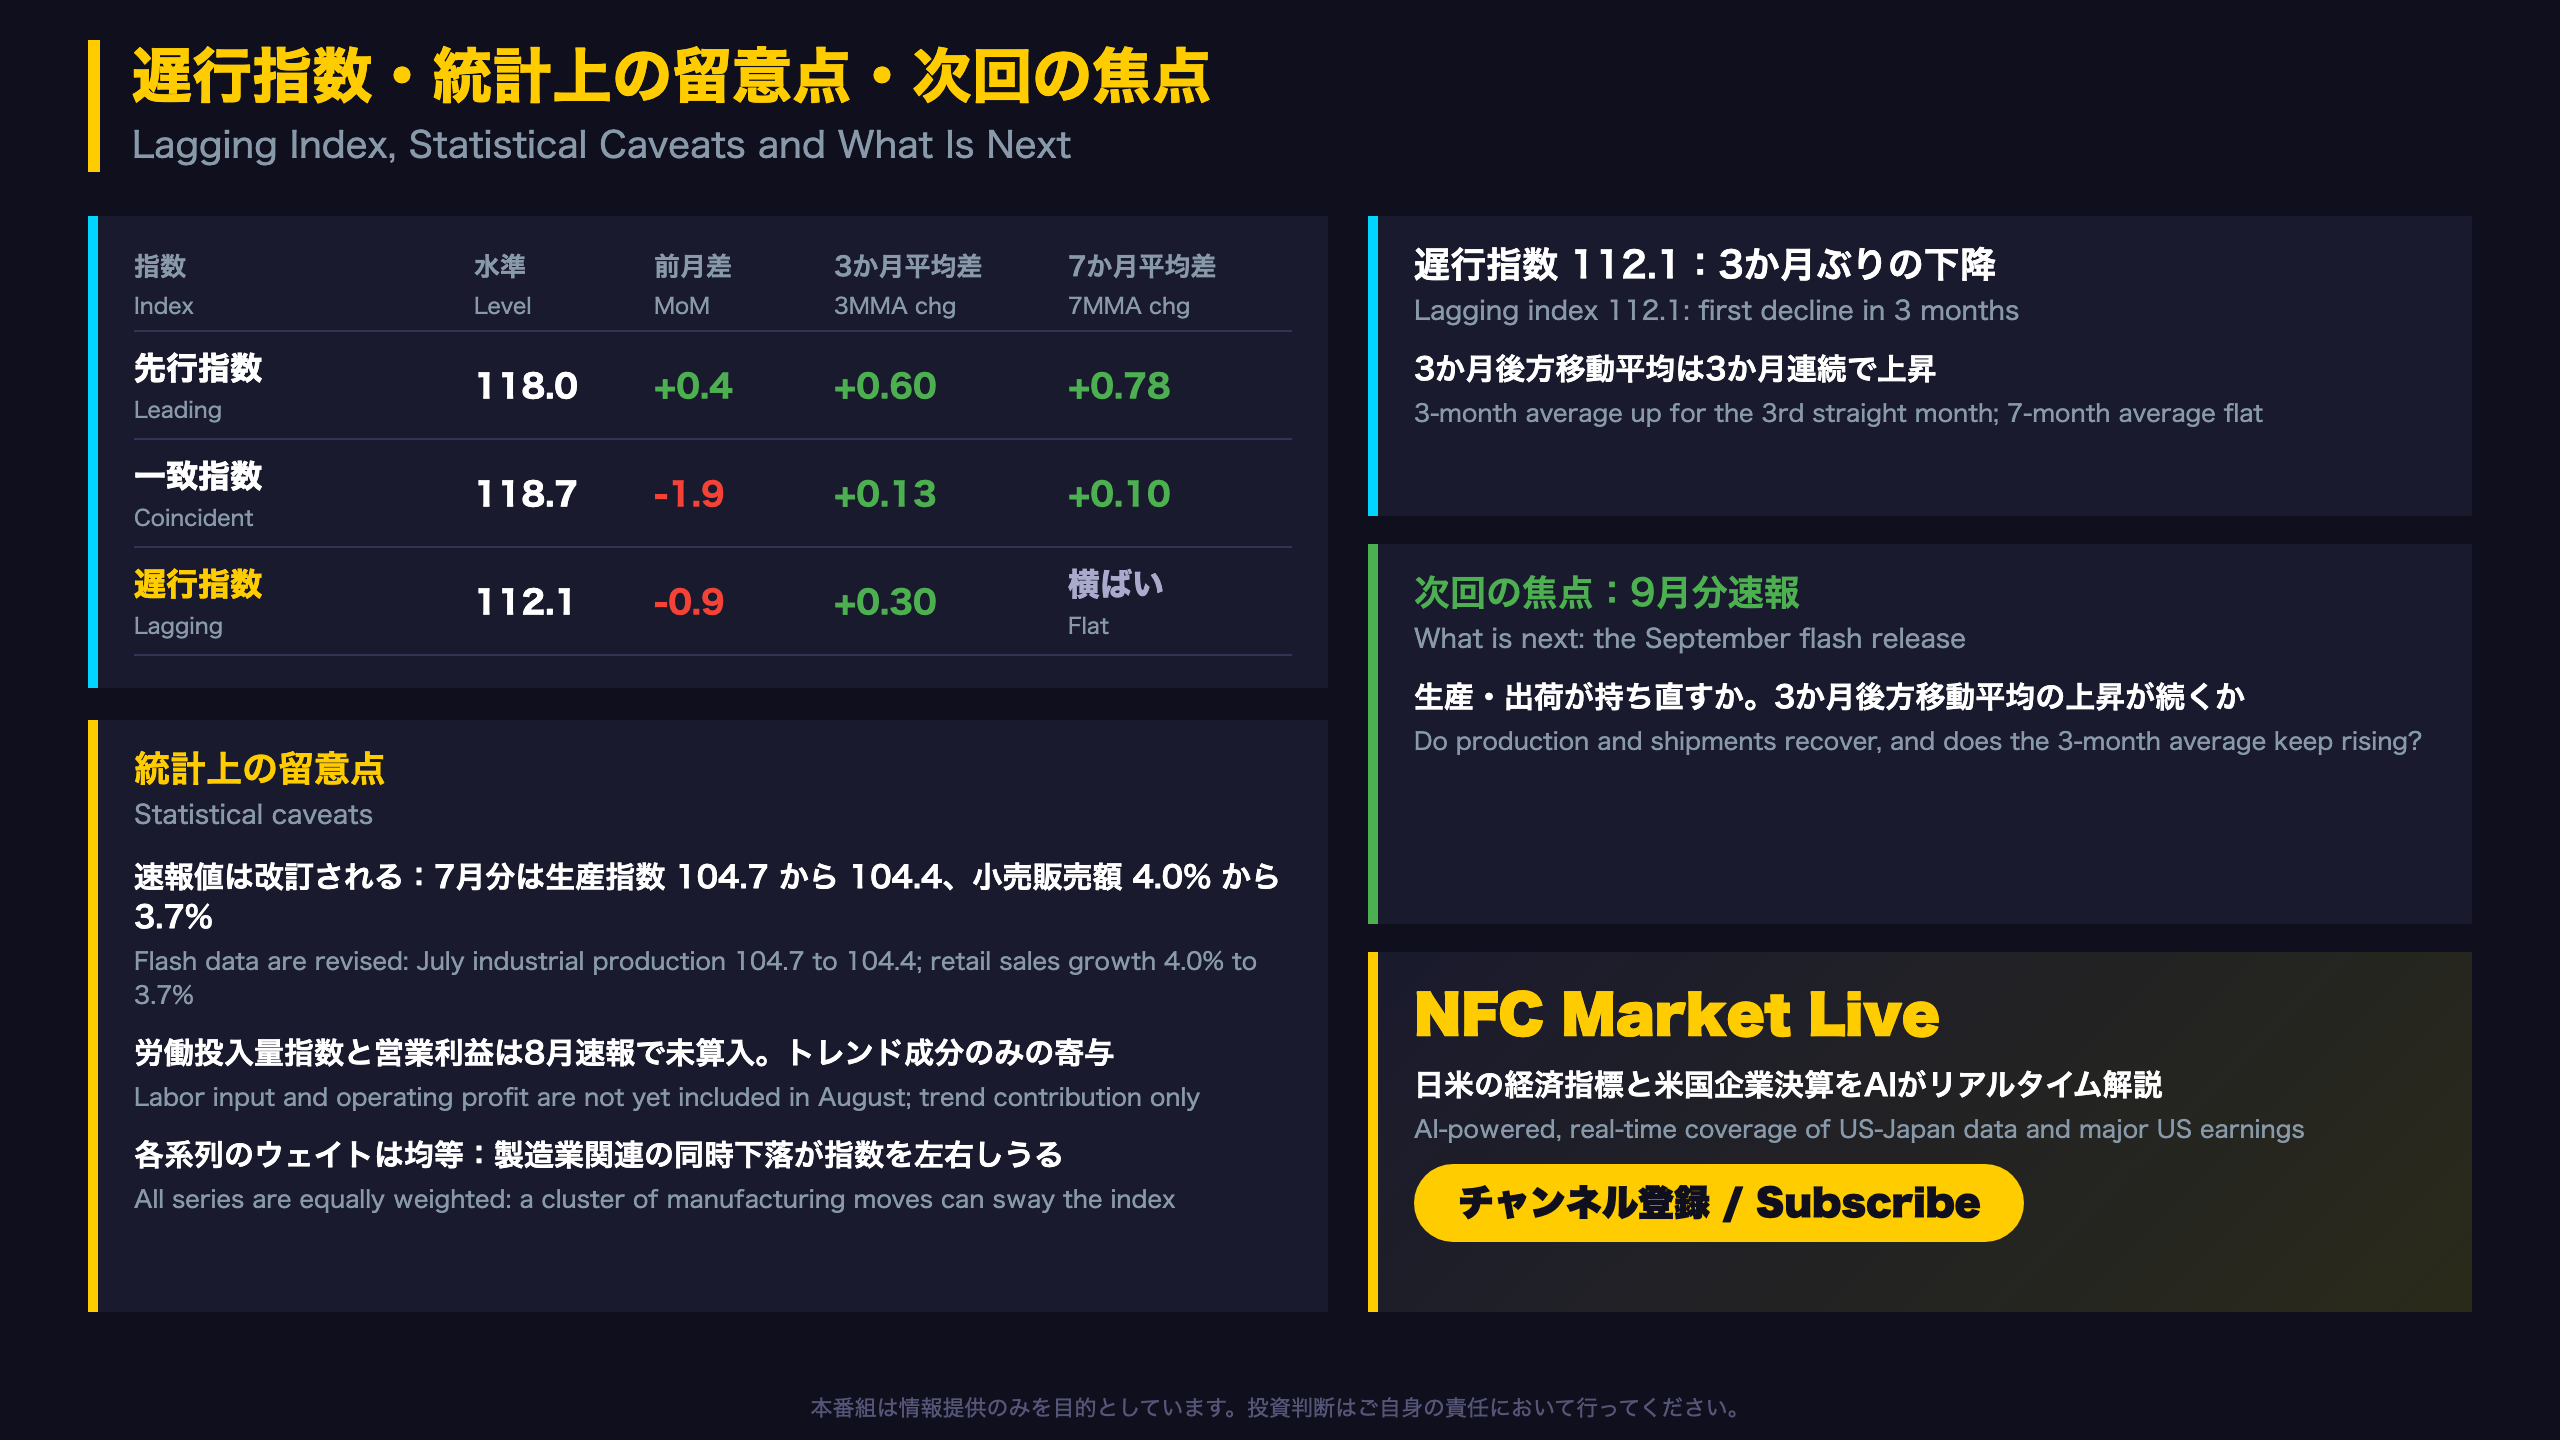
Lagging Index, Revision Risk and What to Watch
Lagging index
The lagging index fell 0.9 pts to 112.1, its first decline in three months. The three-month average still rose 0.30 pts (a third straight gain) while the seven-month average was flat. The index had climbed to 113.0 in July (revised).
Why flash CI figures move
The August figure is a flash estimate. For July, the industrial production input was revised from 104.7 to 104.4 and retail sales growth from 4.0% to 3.7%. The leading and lagging indexes were also trimmed (117.9 to 117.7, and 113.3 to 113.0), while the coincident index itself stayed at 120.6.
What is not in the number yet
Labor input and operating profit are excluded from the August calculation; they enter only through a long-term trend component. Operating profit is a quarterly series interpolated across three months. For the April to June quarter it was 273,465 (100 million yen), about 6.8% above the prior quarter’s 255,990 by our calculation from the report’s figures.
What to watch next
| Item | Why it matters |
|---|---|
| September flash CI | Does the coincident index rebound? |
| Three-month average change | Stays positive after +0.13? |
| Distance to -1.08 | Pausing trigger (1 SD) |
Takeaway
The release is best read as slower momentum inside an ongoing improvement trend rather than a regime change. Equal-weighted inputs, flash revisions and the series still missing from the calculation all argue for waiting on the next print before drawing firmer conclusions.
Disclaimer: This article is for informational purposes only. All investment decisions are made solely at your own risk.







