📺 Watch the Full Video Analysis
This article was automatically generated by the NFC Market Live AI analysis system. (Updated: 2026-07-27 14:31 JST)
📄 Primary Source
内閣府経済社会総合研究所
https://www.esri.cao.go.jp/jp/stat/di/202605psummary.pdf
📊 Japan’s Cabinet Office released the May 2026 Composite Index (CI) of Business Conditions.
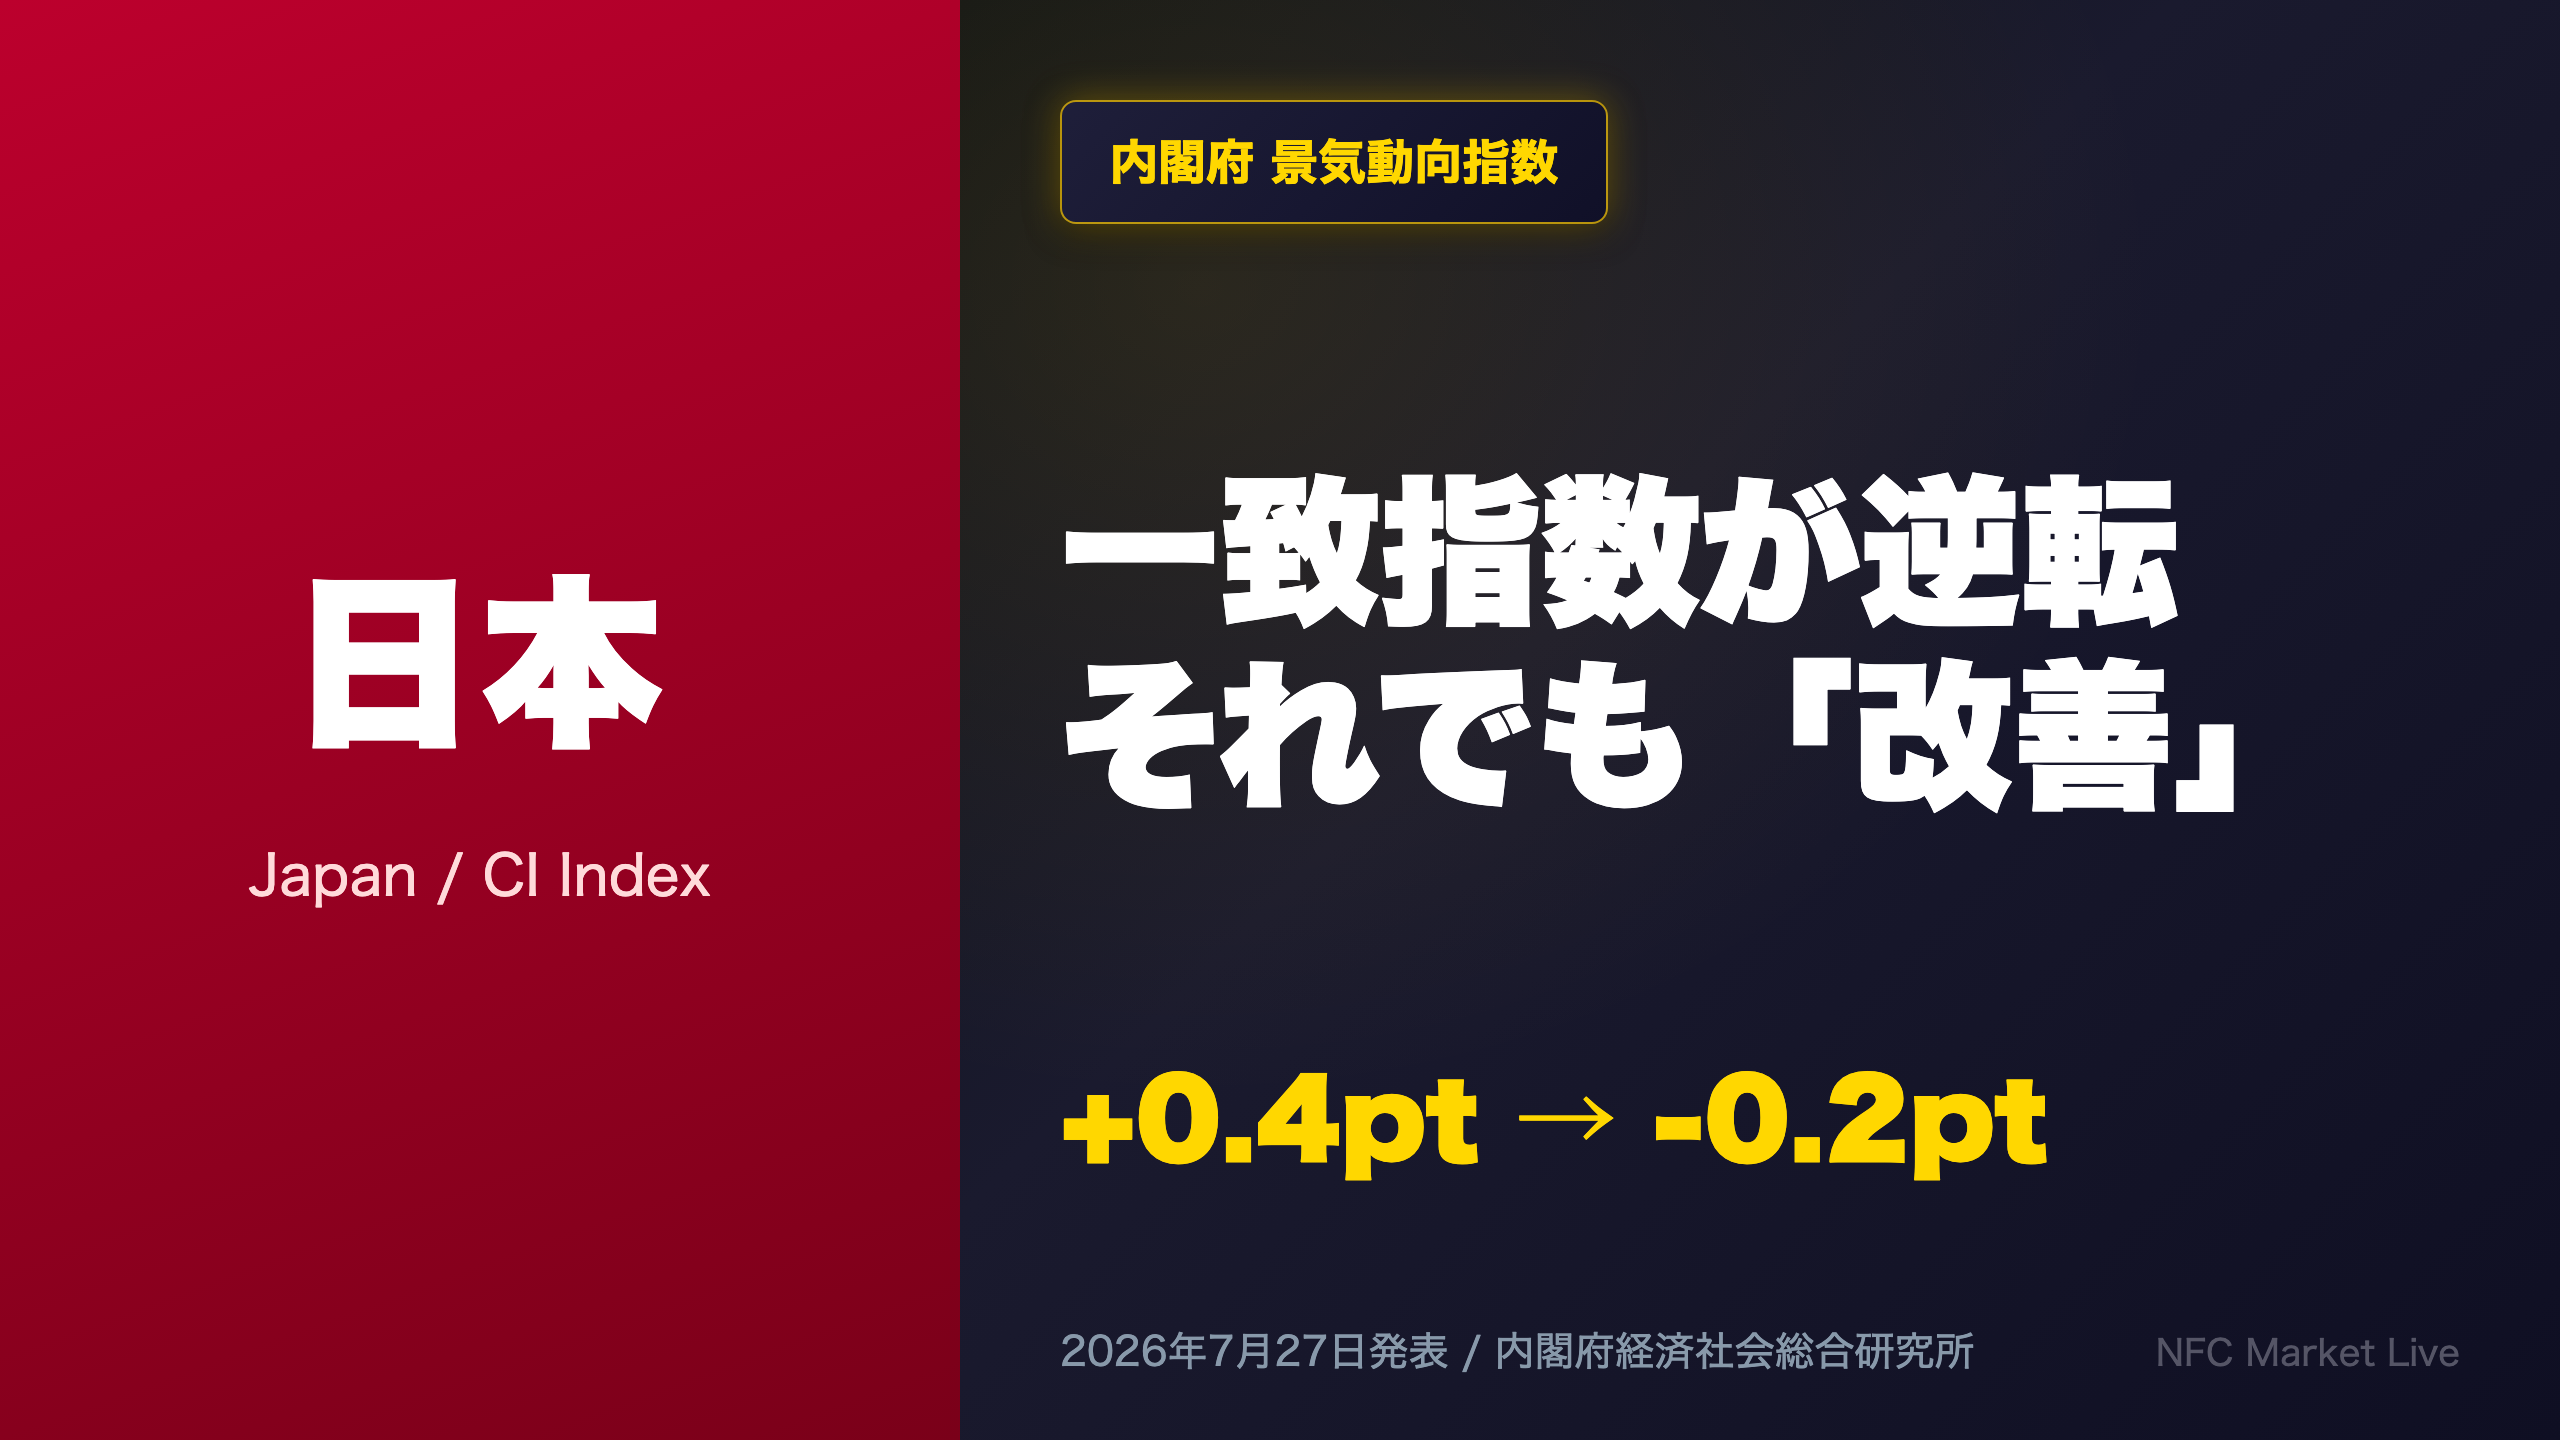
📈 The flash estimate showed the coincident index up +0.4pt, but the July 27 revision flipped it to -0.2pt — yet the ‘improving’ verdict was kept unchanged.
⚠️ Real machinery orders plunged -14.8% MoM, hinting at a temporary capex pullback.
💡 We break down the resilience and the cracks beneath Japan’s headline economic assessment.
総括:一致指数は逆転も基調判断「改善」を維持
A Rare Mid-Stream Reversal
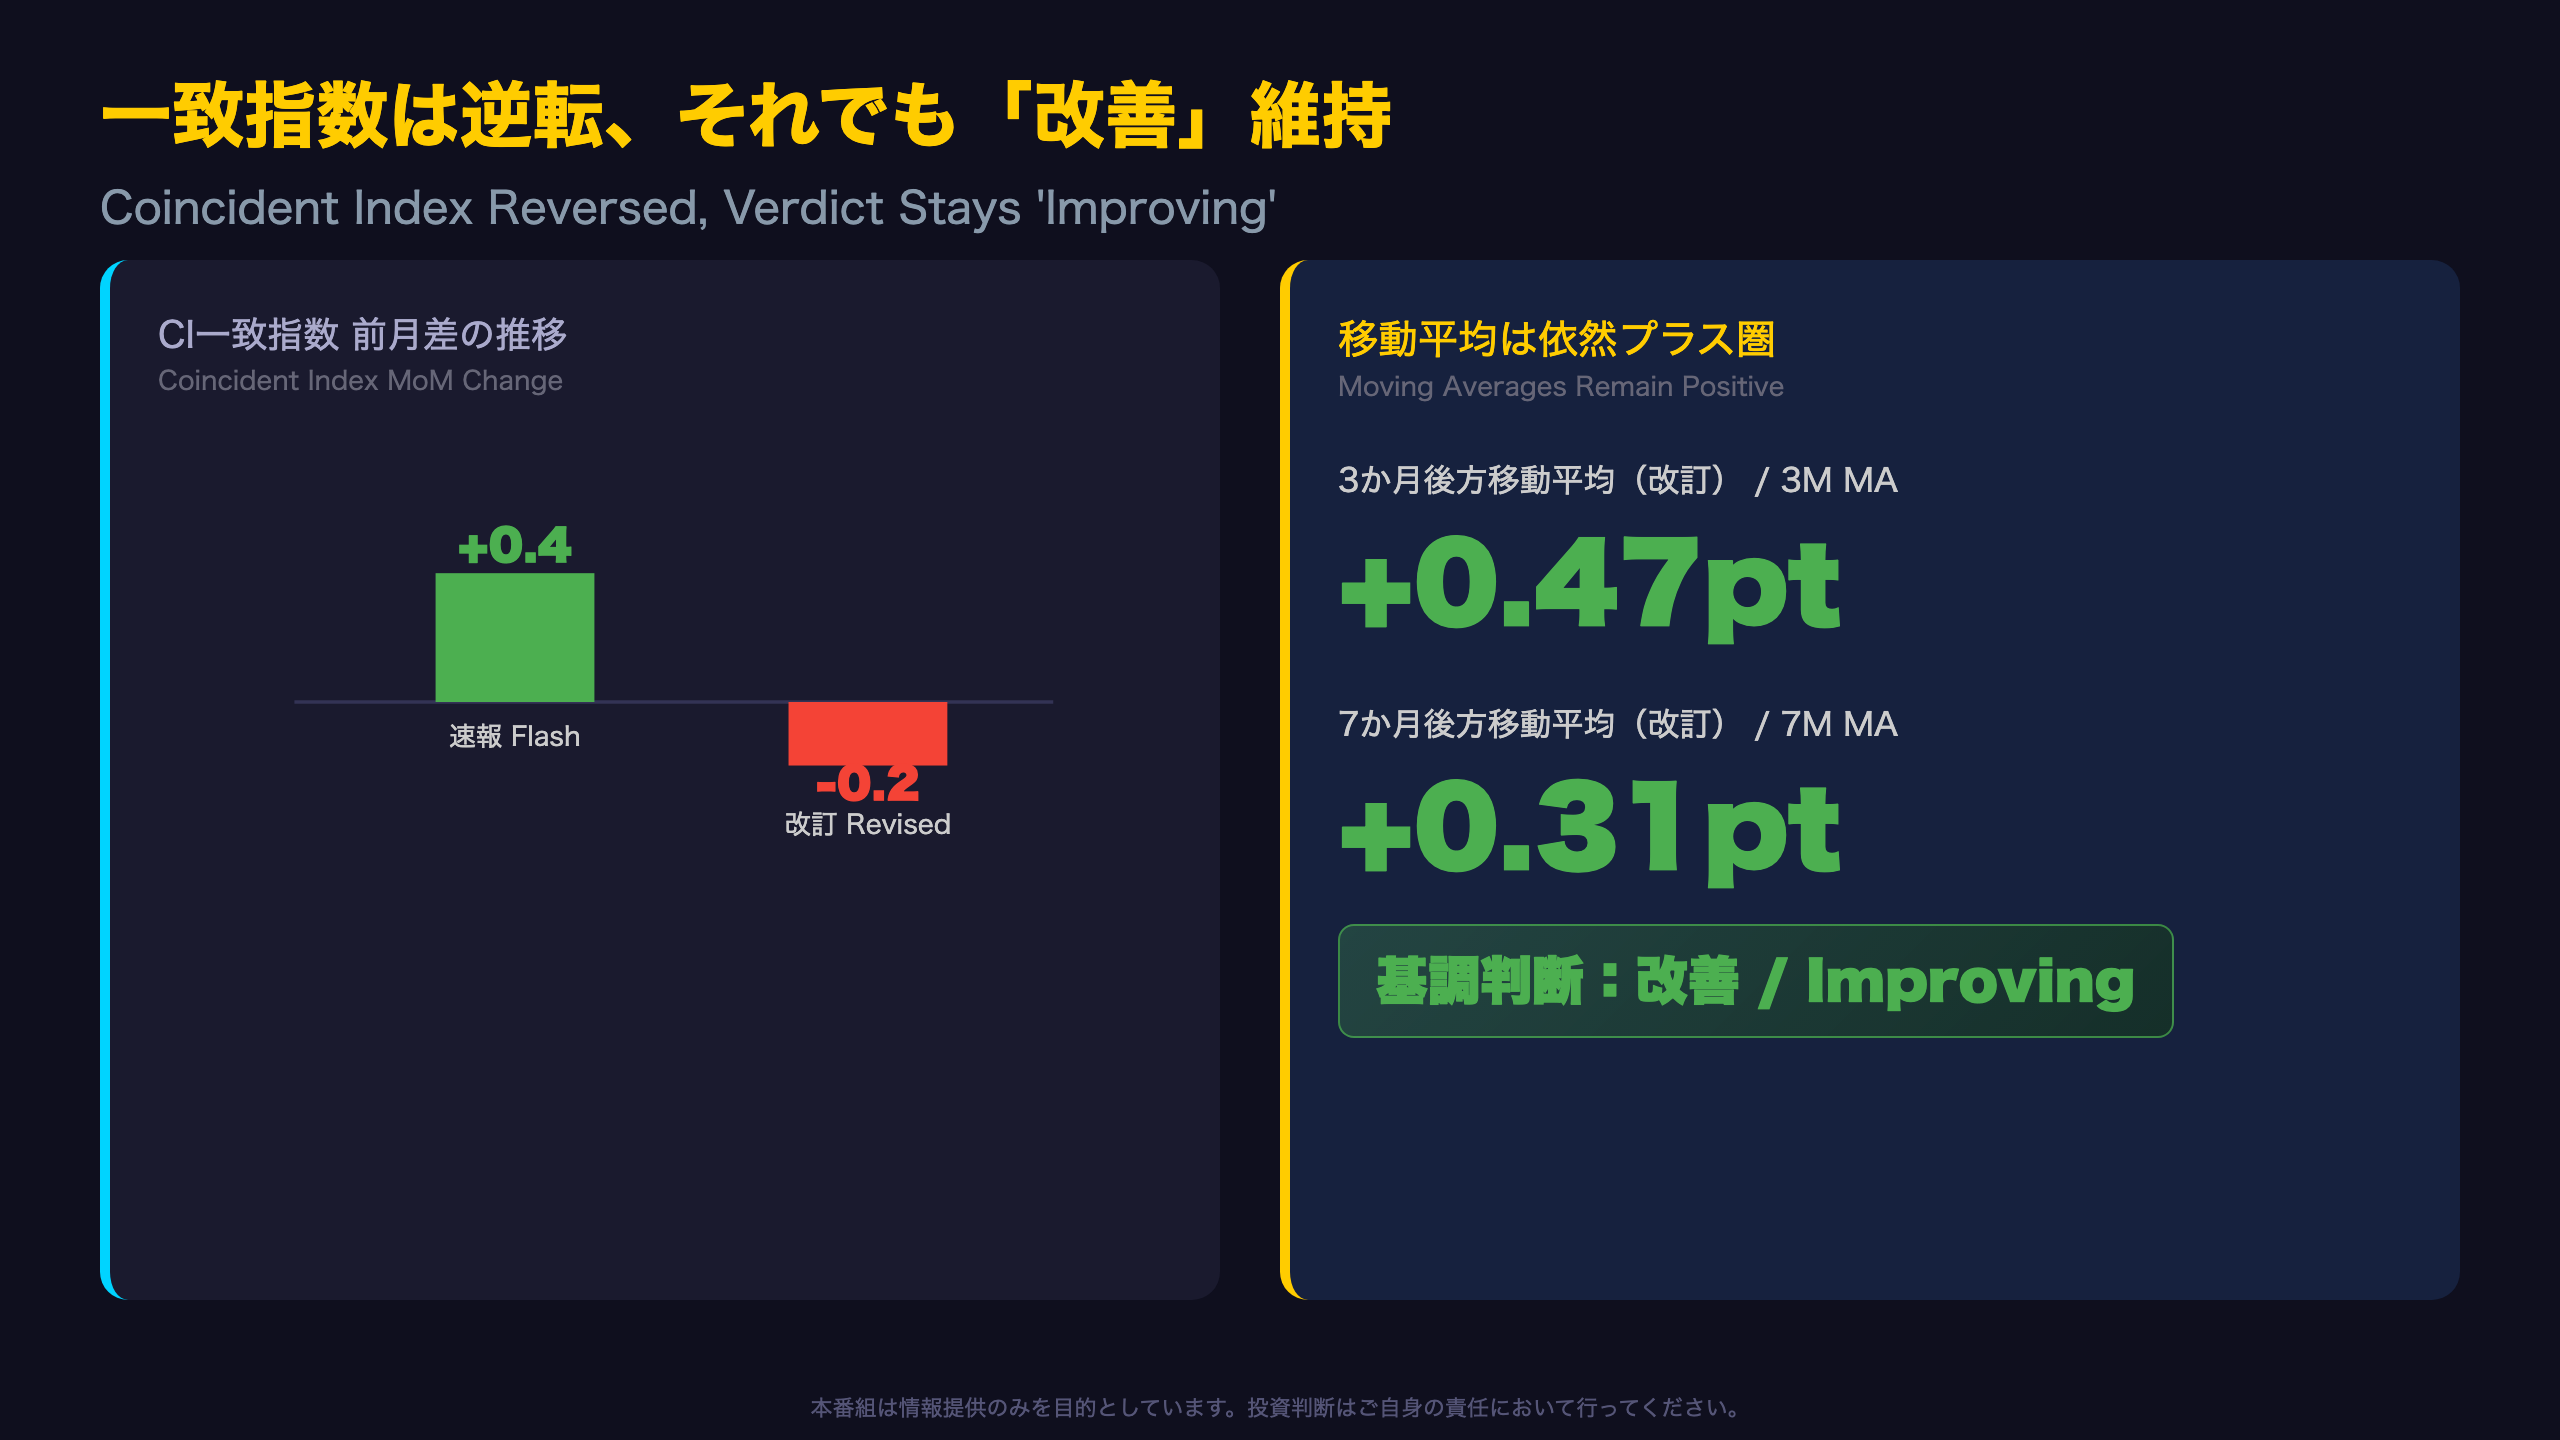
Japan’s Cabinet Office (through its Economic and Social Research Institute, ESRI) publishes the Composite Index (CI) of Business Conditions monthly, first as a flash estimate and then revised roughly three weeks later once more underlying data becomes available. This month’s release is unusual: the flash coincident index for May showed a +0.4 point gain (to 118.5), but the July 27 revision flipped that to a -0.2 point decline (to 117.9). The main culprit was the newly incorporated ‘C4 Labor Input Index,’ excluded from the flash calculation (contributing only +0.01 via trend) but swinging to a -0.36 point drag once actual data (103.0) was incorporated.
Why ‘Improving’ Survived the Downgrade
Under ESRI’s mechanical assessment rules, the ‘improving’ verdict formally requires the three-month moving average to keep rising for three-plus months AND the latest month-on-month change to be positive. The revised data broke the second condition. Yet ESRI did not downgrade the assessment, because the alternative ‘pause’ category requires the 3-month moving average itself to turn negative by more than one standard deviation — which did not happen (revised 3-month MA change: +0.47pt; 7-month MA: +0.31pt). Under ESRI’s own rule, if no downgrade/upgrade criterion is triggered, the prior verdict carries over automatically — conceptually similar to how the Conference Board’s Leading Economic Index communicates trend versus noise, though Japan’s system is more rules-based.
Market Takeaway
For USD/JPY and JGB watchers, the key signal is that Japan’s underlying expansion trend is intact but decelerating at the margin, consistent with a Bank of Japan under no urgency to shift stance abruptly.
一致指数:逆転の内幕を寄与度で解剖
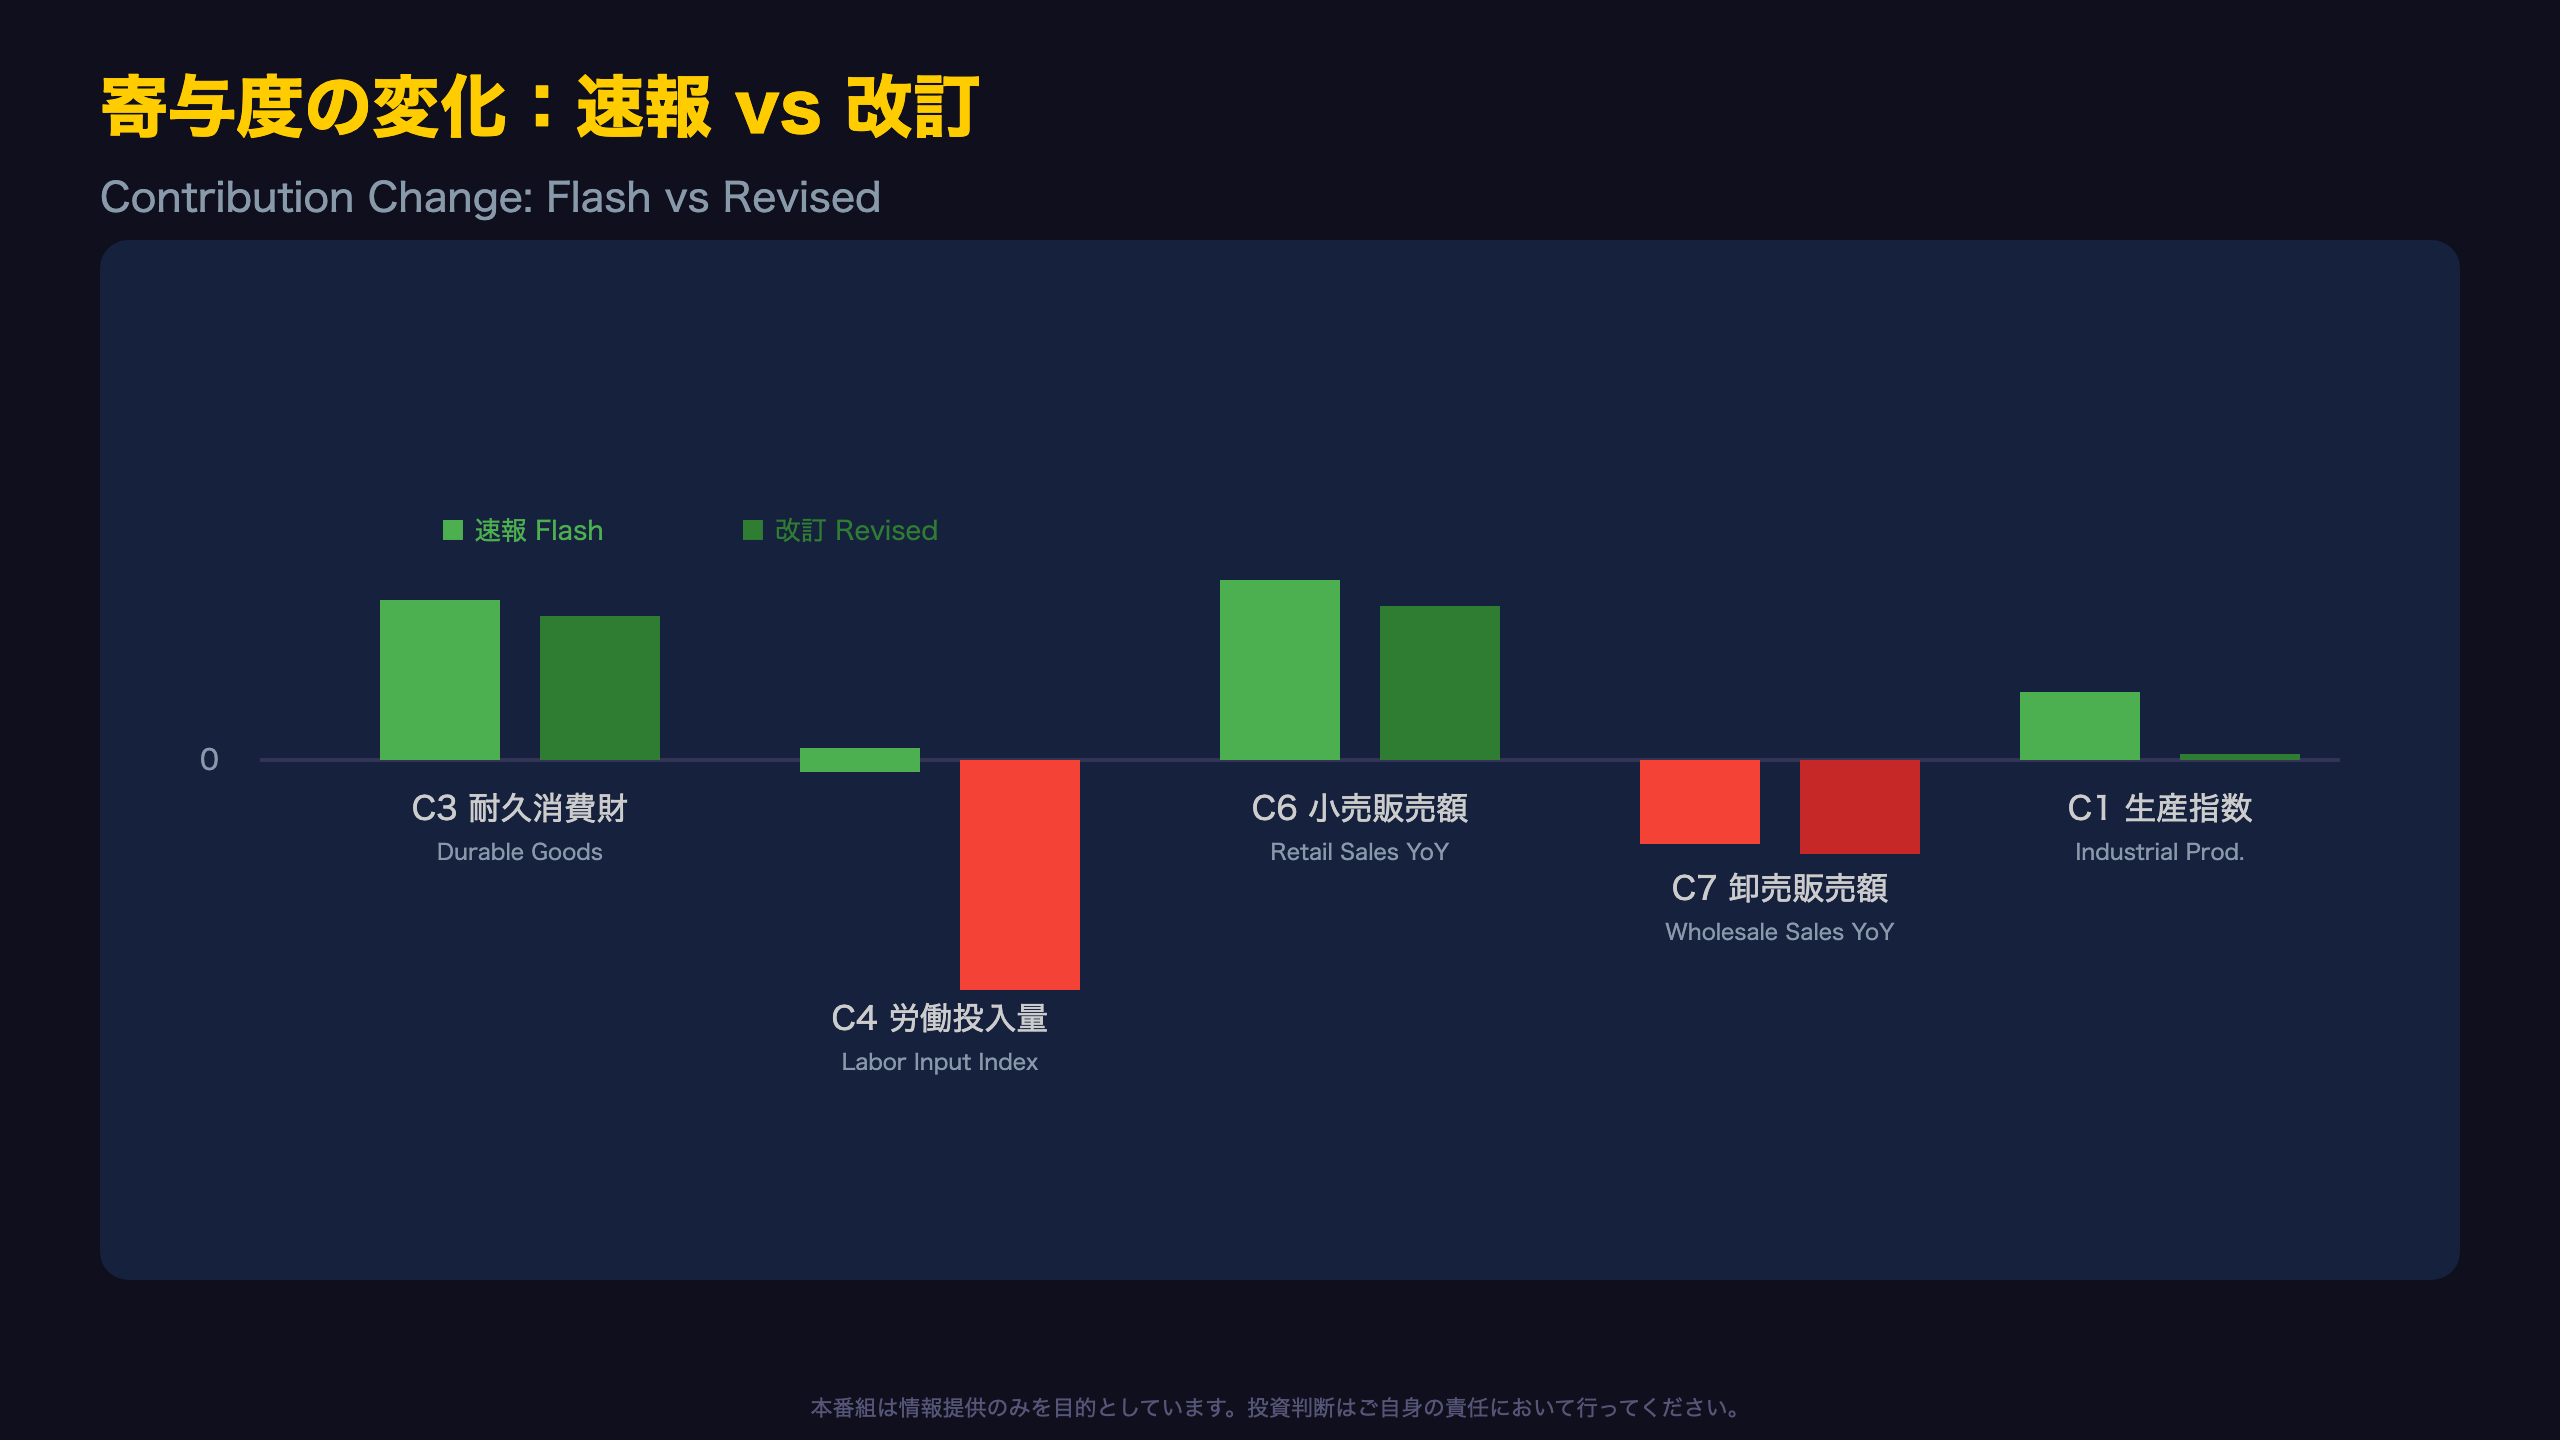
Contribution Breakdown: Flash vs Revised
In the flash estimate, durable goods shipments (C3) were the largest positive contributor at +0.43 points, followed by retail sales year-on-year (C6) at +0.34 points, while ex-transport capital goods shipments (C5) was the biggest drag at -0.46 points.
After revision, contributions shifted meaningfully:
| Series | Flash | Revised |
|---|---|---|
| C1 Industrial Production | +0.08 | +0.01 |
| C3 Durable Goods Shipments | +0.43 | +0.38 |
| C4 Labor Input Index | +0.01 (trend only) | -0.36 |
| C6 Retail Sales YoY | +0.34 | +0.27 |
| C7 Wholesale Sales YoY | -0.16 | -0.18 |
The single biggest swing came from C4, the Labor Input Index. As the report notes, series unavailable at flash time (C4, C8 corporate profits) contribute ‘only through trend components’ — a methodology similar to how the U.S. BEA initially interpolates certain GDP subcomponents before final data arrives. Once actual data (103.0, down from 104.6 in April) was incorporated, the contribution flipped to -0.36 points, single-handedly explaining most of the swing from +0.4pt to -0.2pt.
What This Means for Markets
This is less a story of a single bad data point and more a case of multiple modest downward revisions (production, retail, wholesale sales) compounding — a reminder that Japan’s flash CI carries meaningful revision risk that JGB and equity traders should factor into month-to-month reads.
判断基準のメカニズム:なぜ「改善」は据え置かれたのか
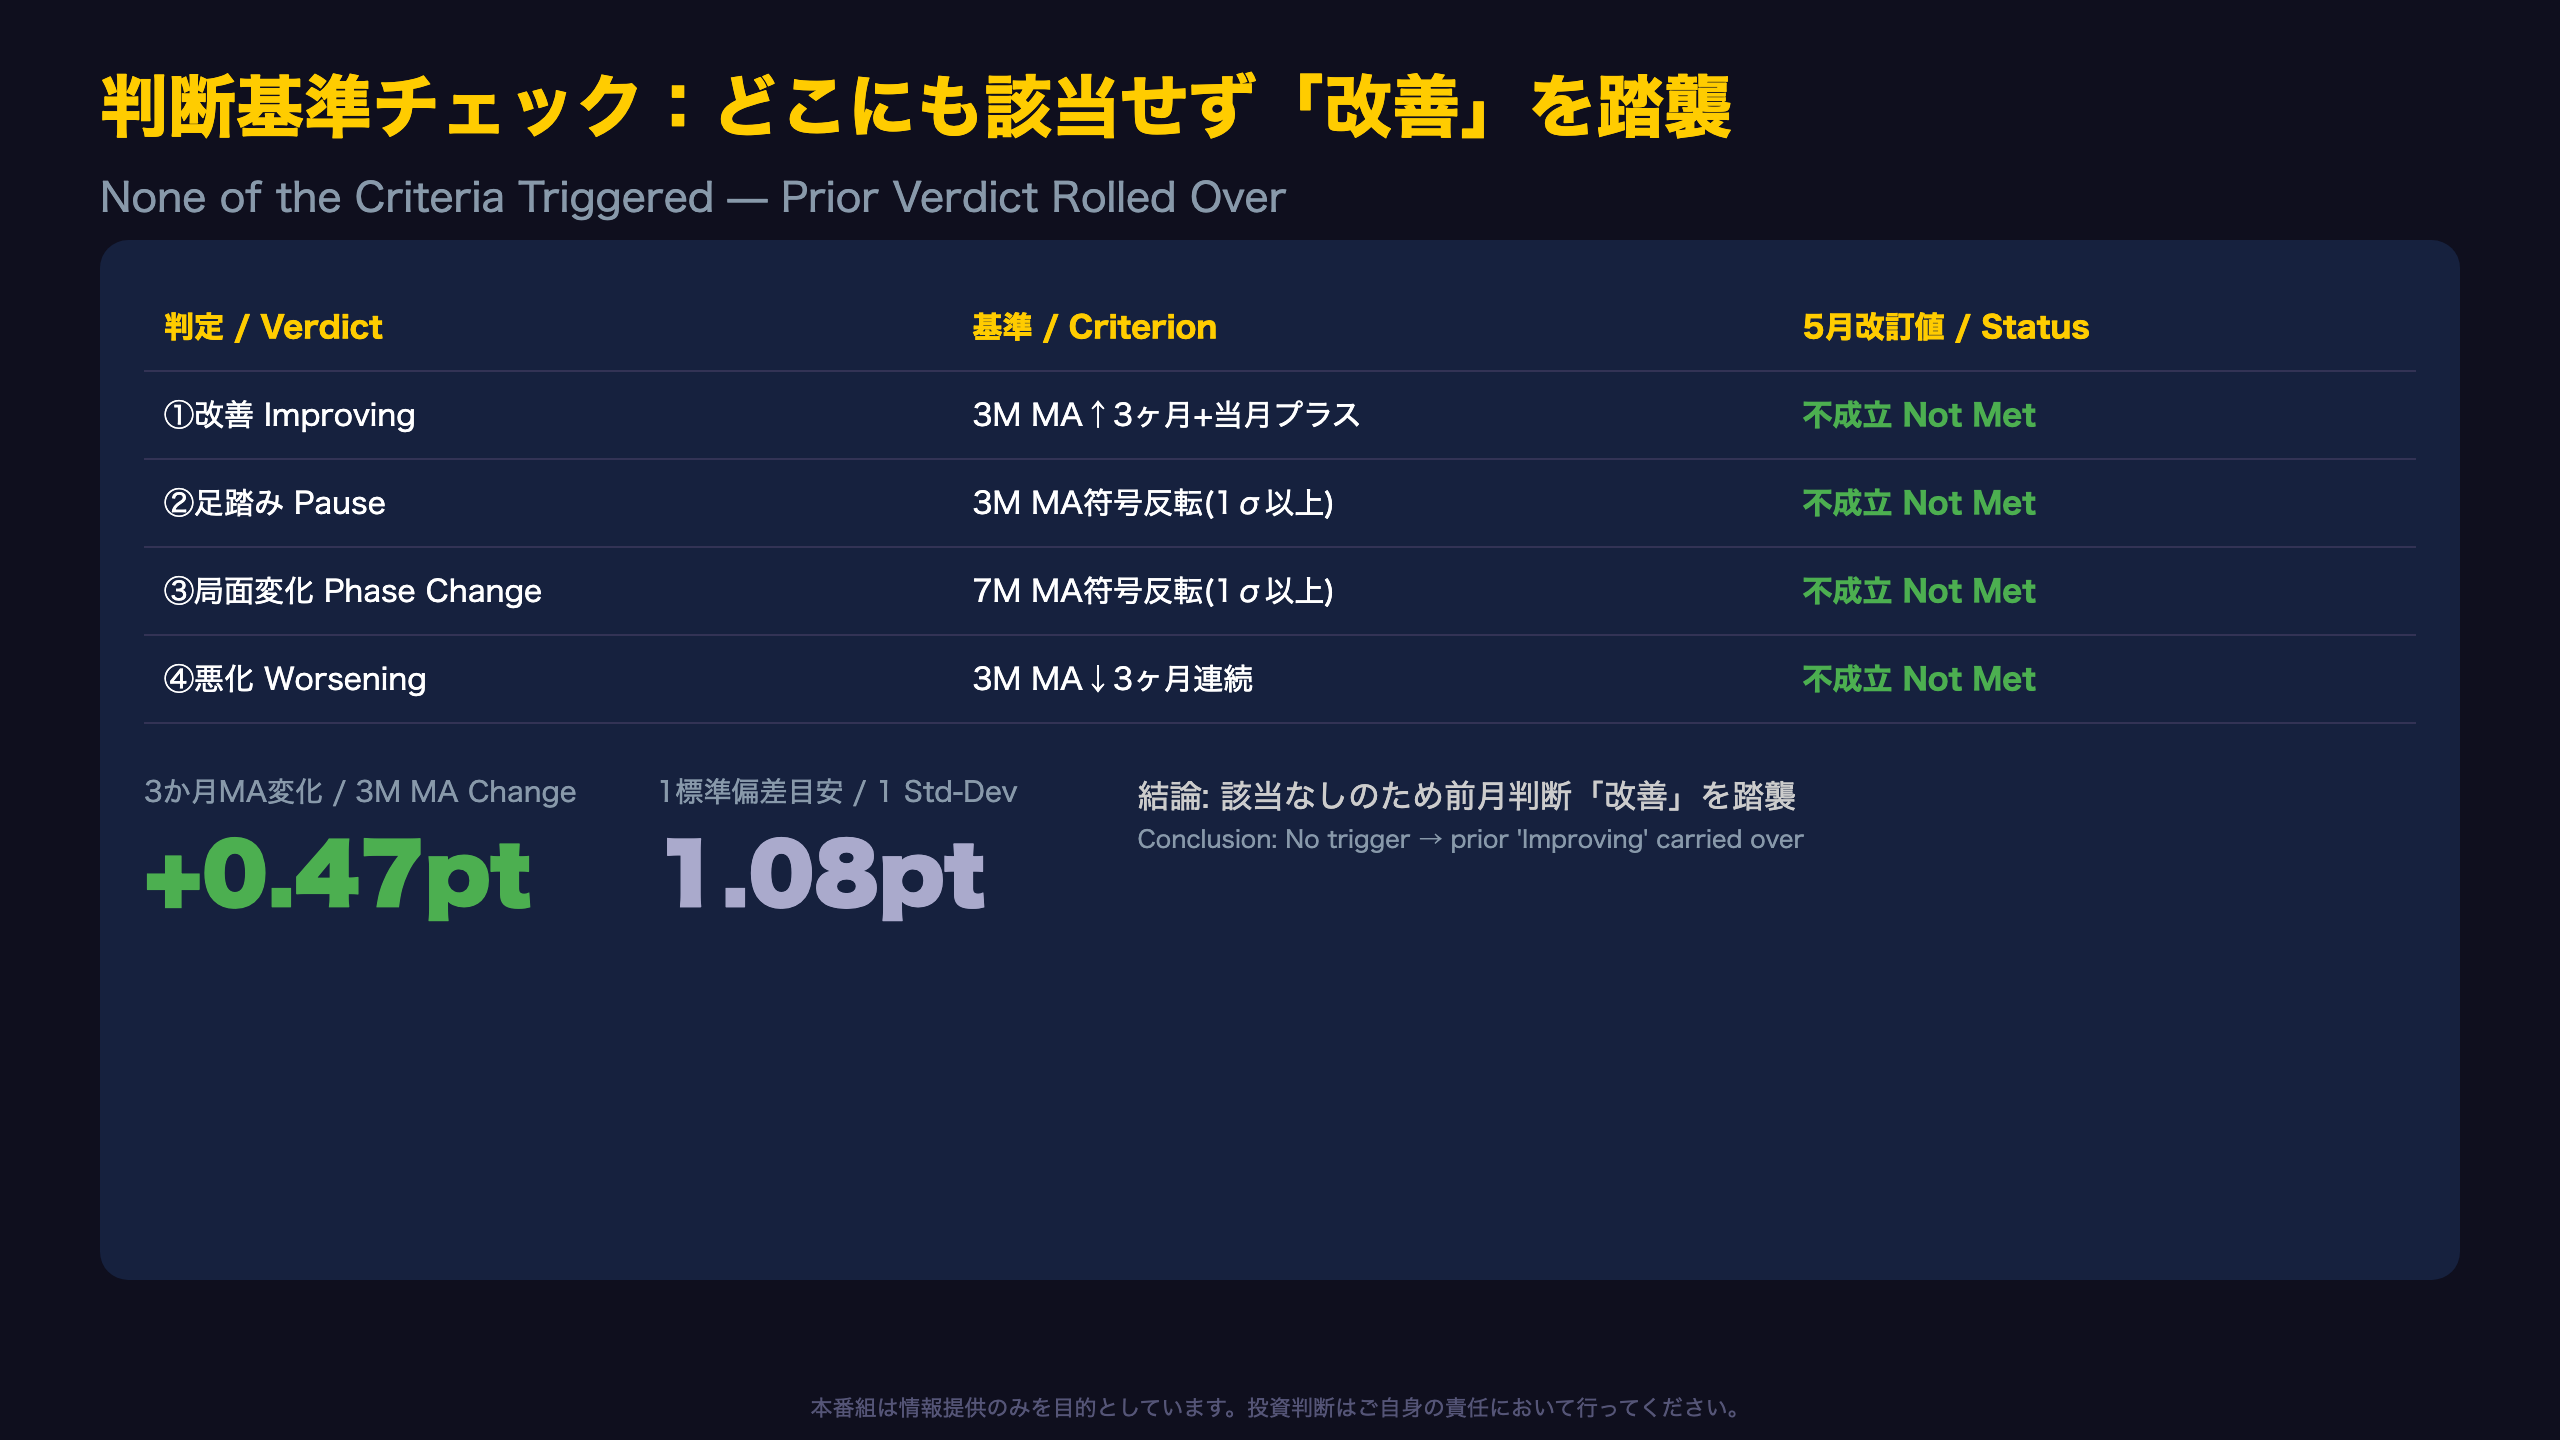
Decoding the Mechanical Rule
Japan’s Cabinet Office assessment framework has five categories (improving, pause, phase change, worsening, bottoming out), with a built-in rule: if none of the criteria are triggered, the prior month’s verdict simply carries over.
Mapping May’s revised data against the criteria:
| Verdict | Criterion | Met in May (revised)? |
|---|---|---|
| Improving | 3M MA rising 3+ months, current MoM positive | No — MoM turned negative |
| Pause | 3M MA turns negative by 1+ standard deviation | No — 3M MA still +0.47pt |
| Phase change | 7M MA sign flips by 1+ standard deviation | No — 7M MA still +0.31pt |
| Worsening | 3M MA declining 3+ consecutive months | No |
Since none applied, the ‘improving’ call from April rolled over automatically. For context, the historical one-standard-deviation benchmark (Jan 1985–Dec 2025) is 1.08pt for the 3-month MA and 0.83pt for the 7-month MA — both far above the current +0.47pt and +0.31pt readings, meaning May’s data sits nowhere near the threshold for a downgrade.
Two Ways to Read It
Bulls can note the mechanical framework has not flagged any deterioration. Bears would counter that a negative current-month print, if repeated in June, would meaningfully raise the odds of a shift to ‘pause’ — a threshold worth watching at the August 7 release.
先行指数:12か月連続上昇の底堅さと機械受注の急減速
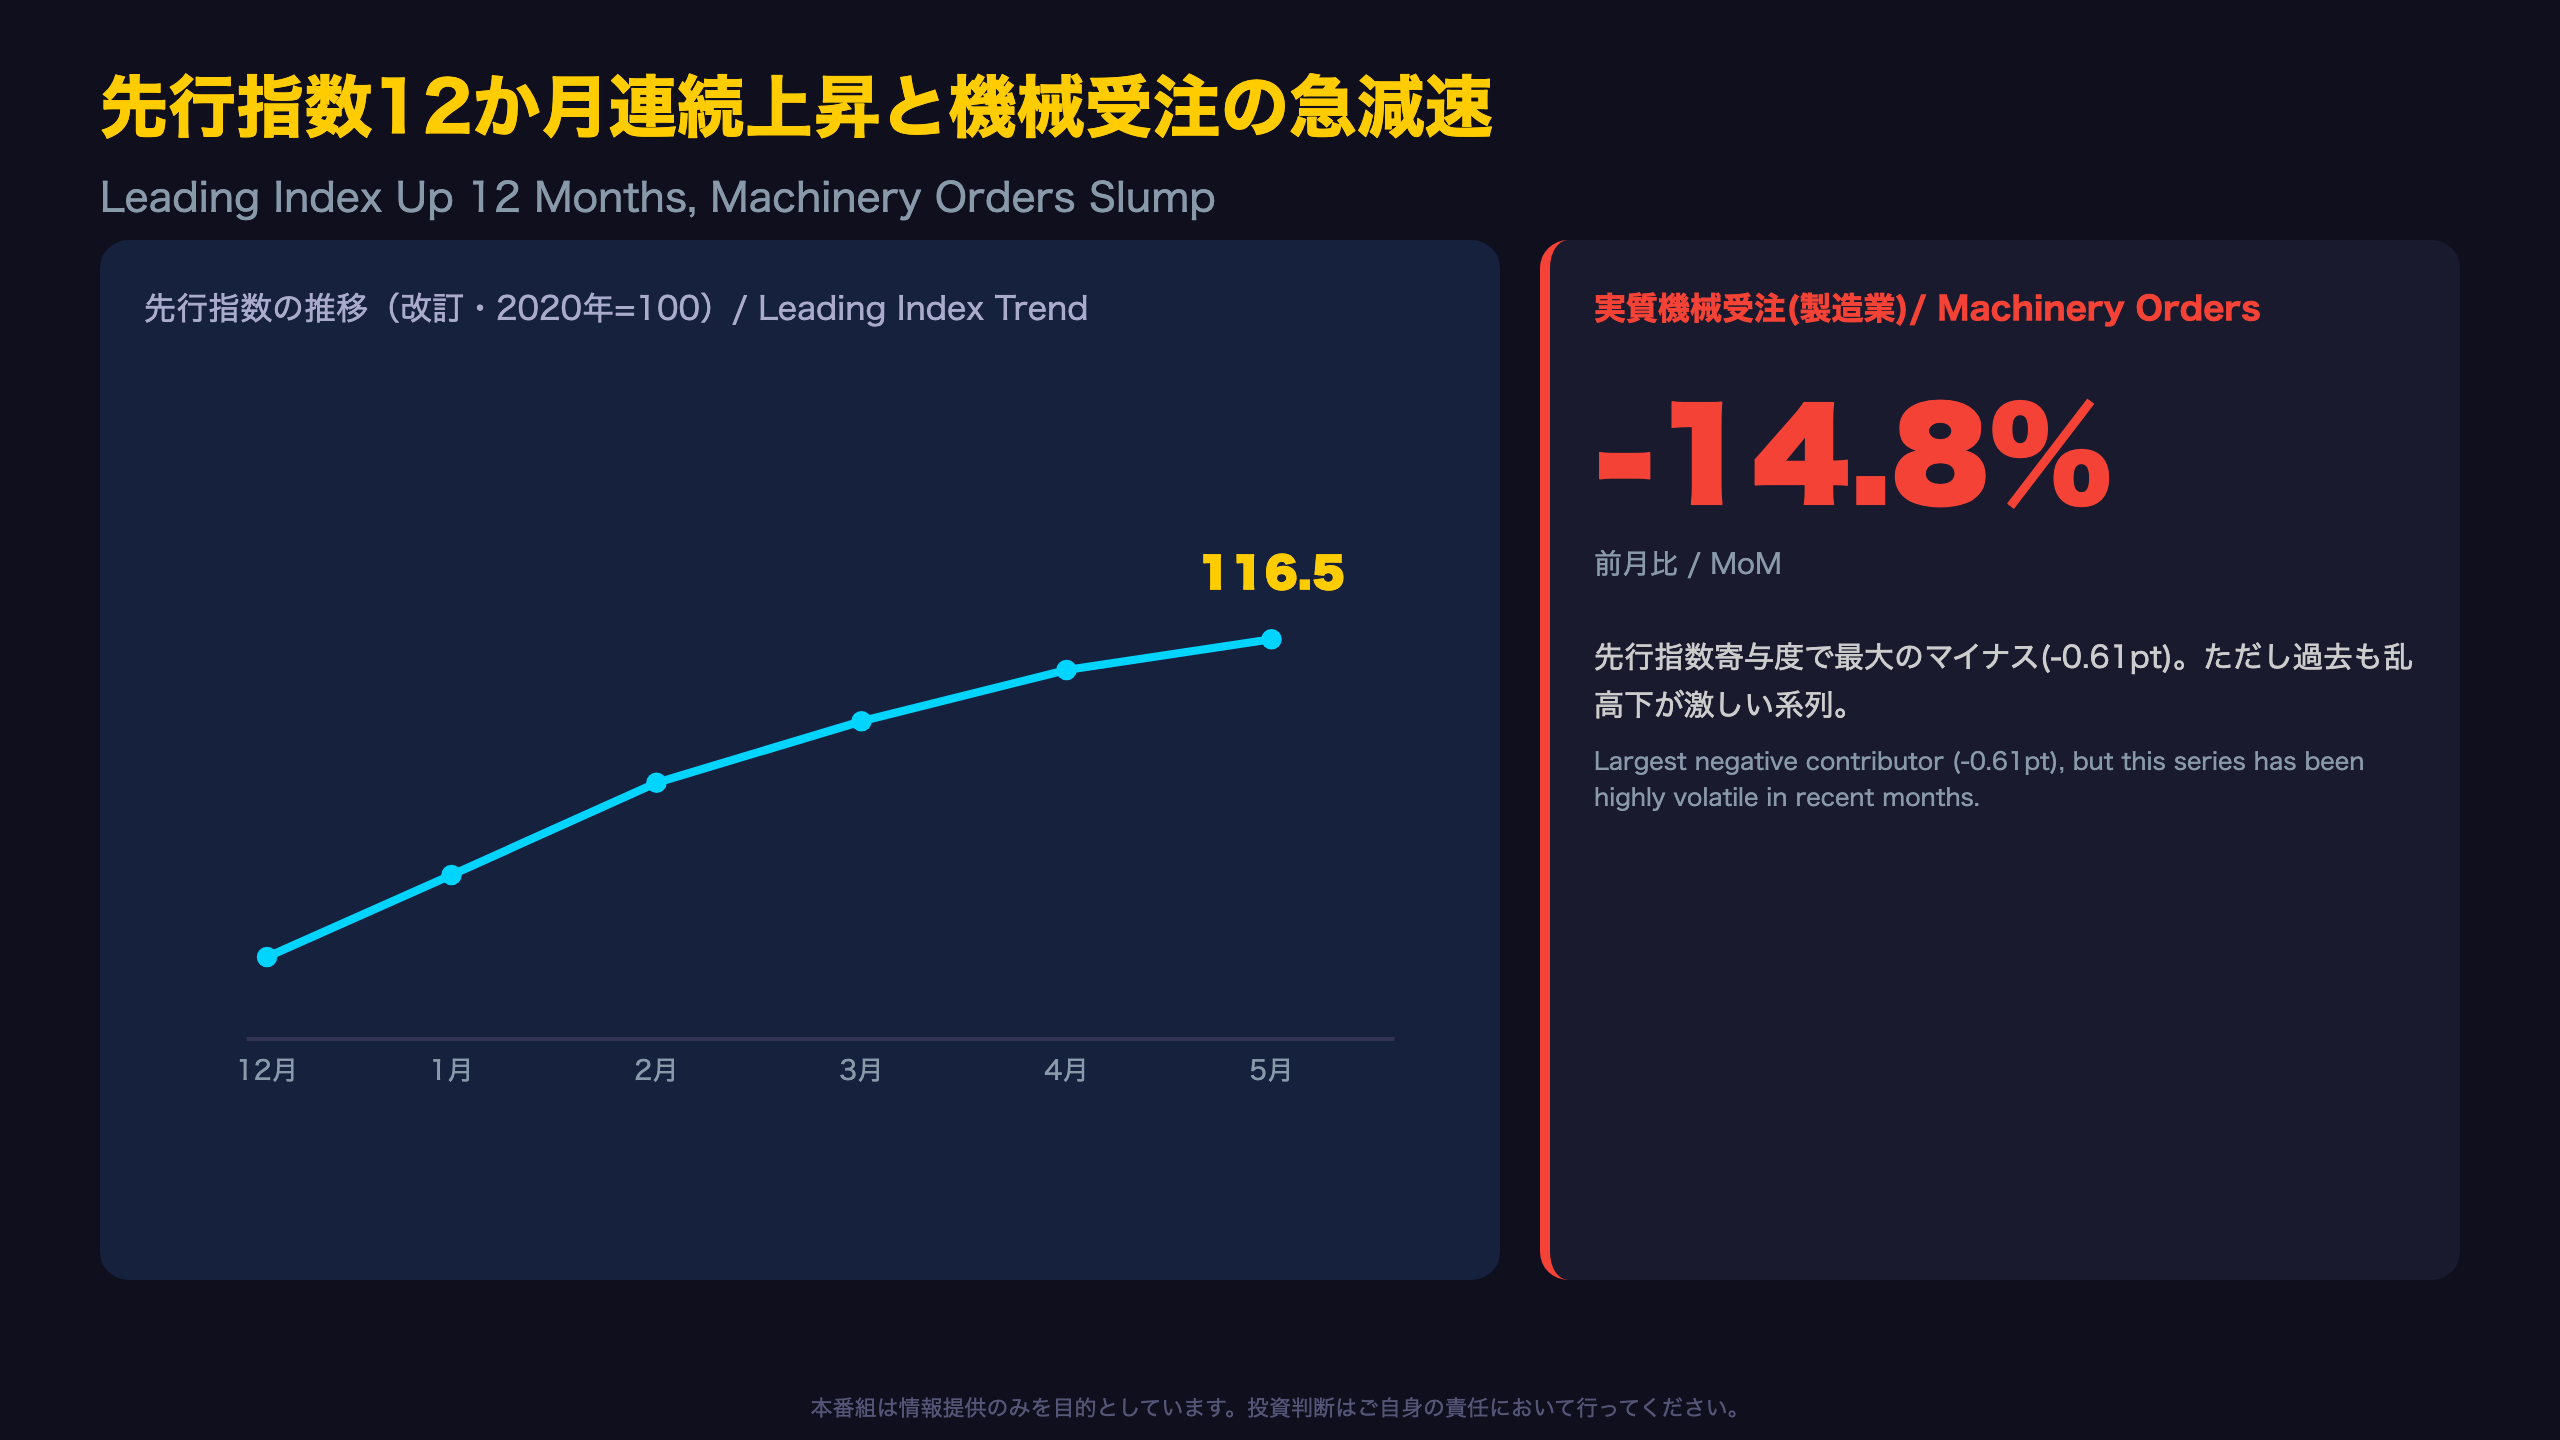
Twelve Months of Consecutive Gains
The flash report explicitly states the leading index rose 0.7 points and extended its rise to twelve consecutive months. Revised monthly changes show a gradually narrowing but uninterrupted positive streak: December +2.0pt, January +1.8pt, February +1.1pt, March +0.7pt, April +0.4pt.
Machinery Orders: A Volatile Series
Real machinery orders (manufacturing) — Japan’s closest analog to the U.S. durable goods ‘core capex’ orders series — fell from JPY 436.3 billion in April to JPY 371.8 billion in May, a -14.8% month-on-month drop and the single largest negative contributor (-0.61pt) among the eleven leading sub-indices. Notably, this series has whipsawed for months: -12.4% in January, +30.3% in February, -14.7% in March, +3.9% in April, -14.8% in May. Given this volatility, a single month’s slump should not be read as a definitive capex downturn — investors should wait for June data (due August 7) to confirm direction.
Elsewhere, Sentiment Held Up
Consumer confidence improved from 32.2 to 33.6 (+0.49pt contribution), the TOPIX-linked index rose 3.8% month-on-month (+0.18pt), and the manufacturing investment environment index added +0.24pt — signs that financial conditions and sentiment remain constructive even as one hard-data series wobbled.
Market Angle
For investors comparing this to the U.S. ISM New Orders or durable goods orders, the lesson is similar: single-month capex-proxy data is noisy. The broader leading index trend — still rising for a year — is the more reliable signal for JPY and Nikkei positioning.
遅行指数:物価鈍化と雇用改善のコントラスト
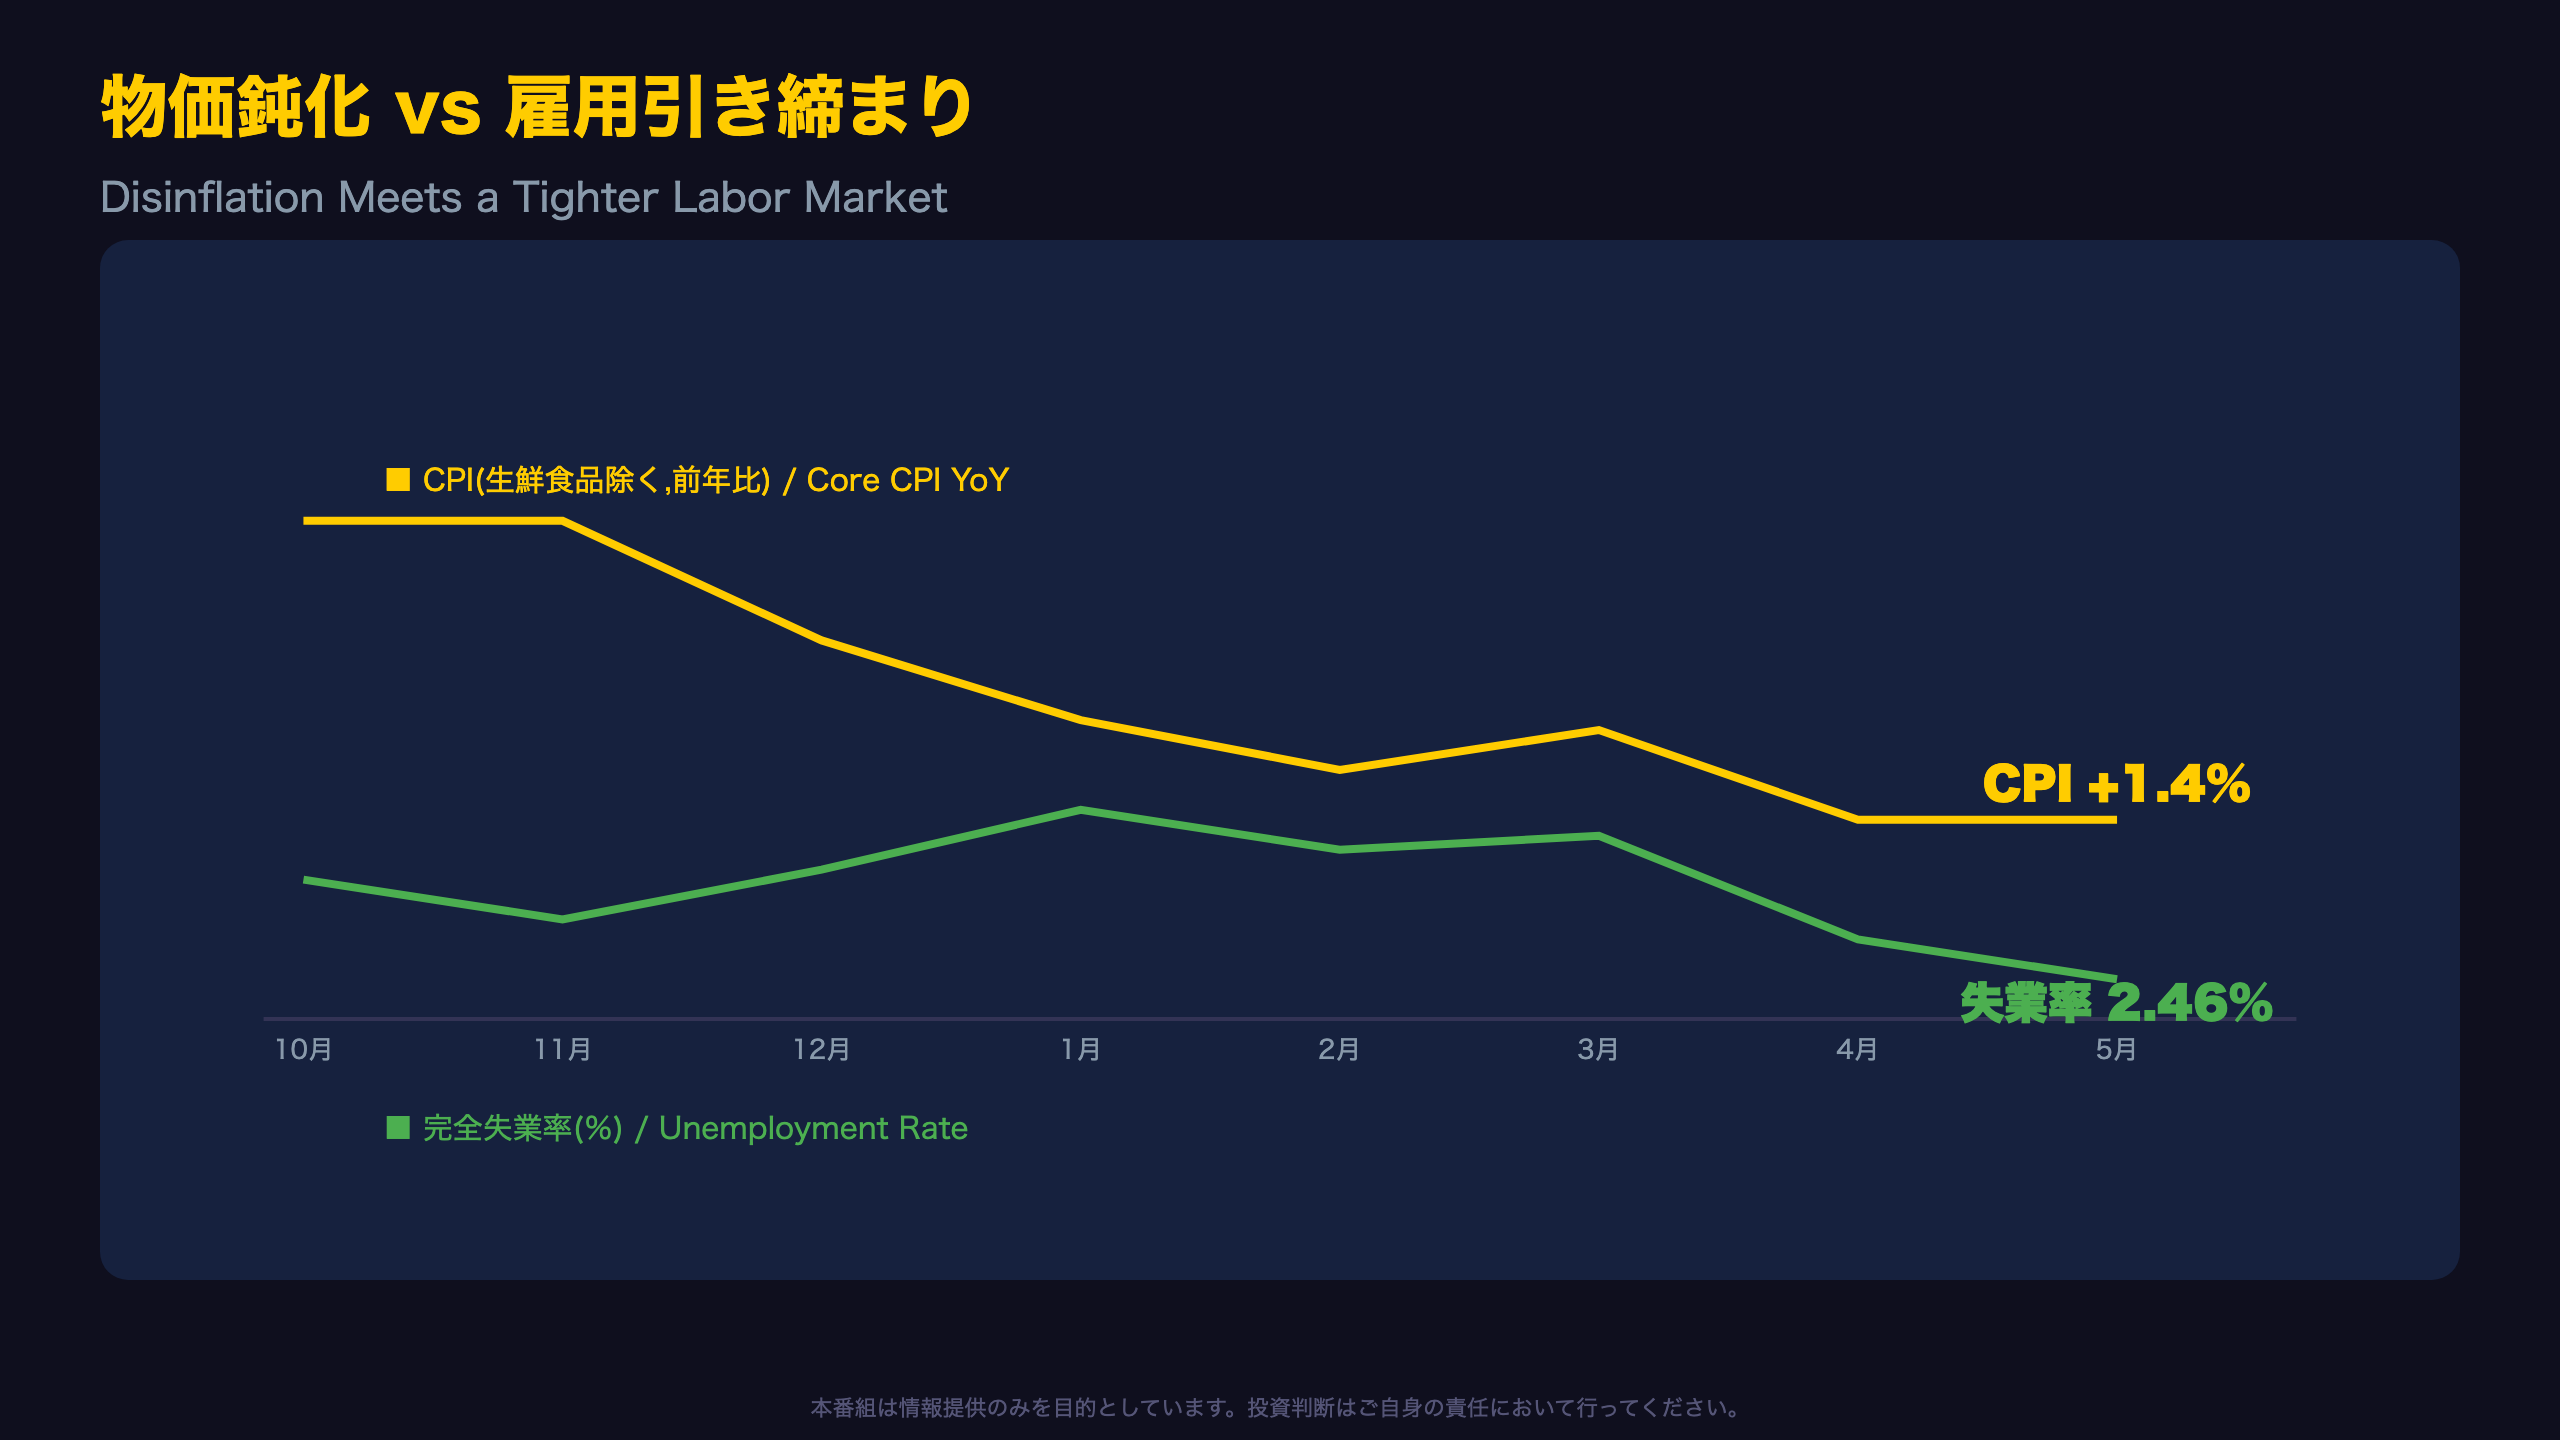
A Gradual Downtrend in the Lagging Index
Japan’s lagging CI index has drifted lower on a revised basis: 111.8 (Dec) → 112.1 (Jan) → 111.9 (Feb) → 111.6 (Mar) → 111.6 (Apr) → 111.4 (May). The seven-month moving average change has now declined for seven consecutive months (-0.20pt), the most consistently weak of the three CI series.
Disinflation in Plain Sight
Core CPI excluding fresh food — Japan’s key inflation gauge, roughly analogous to the U.S. core PCE the Fed watches — has cooled steadily: +3.0% (Oct 2025) → +3.0% (Nov) → +2.4% (Dec) → +2.0% (Jan 2026) → +1.6% (Feb) → +1.8% (Mar) → +1.4% (Apr) → +1.4% (May). For readers used to the Fed’s 2% target framework, Japan’s core inflation is now tracking close to, and arguably below, the Bank of Japan’s 2% target — a meaningfully different inflation trajectory from the U.S., where core PCE has proven stickier.
Yet the Labor Market Is Tightening
The unemployment rate (an inverse-cycle series) fell from 2.53% in April to 2.46% in May, while the job-offers-to-applicants ratio edged down slightly from 1.18 to 1.17 but remains comfortably above 1.0, indicating persistent labor demand.
Capex Softening
Real corporate capital investment has drifted down from JPY 13.11 trillion (Q4 2025) toward JPY 12.75 trillion in the most recent print, consistent with the sharp drop in machinery orders seen in the leading index.
Balanced Read
Cooling inflation supports real purchasing power — a genuine positive for Japanese consumers — while softening capex hints at a pause in the investment cycle. Neither conclusion should be overstated from single-series moves; both warrant confirmation over the coming months.
インプリケーション:拡張基調は継続、モメンタムは要注視
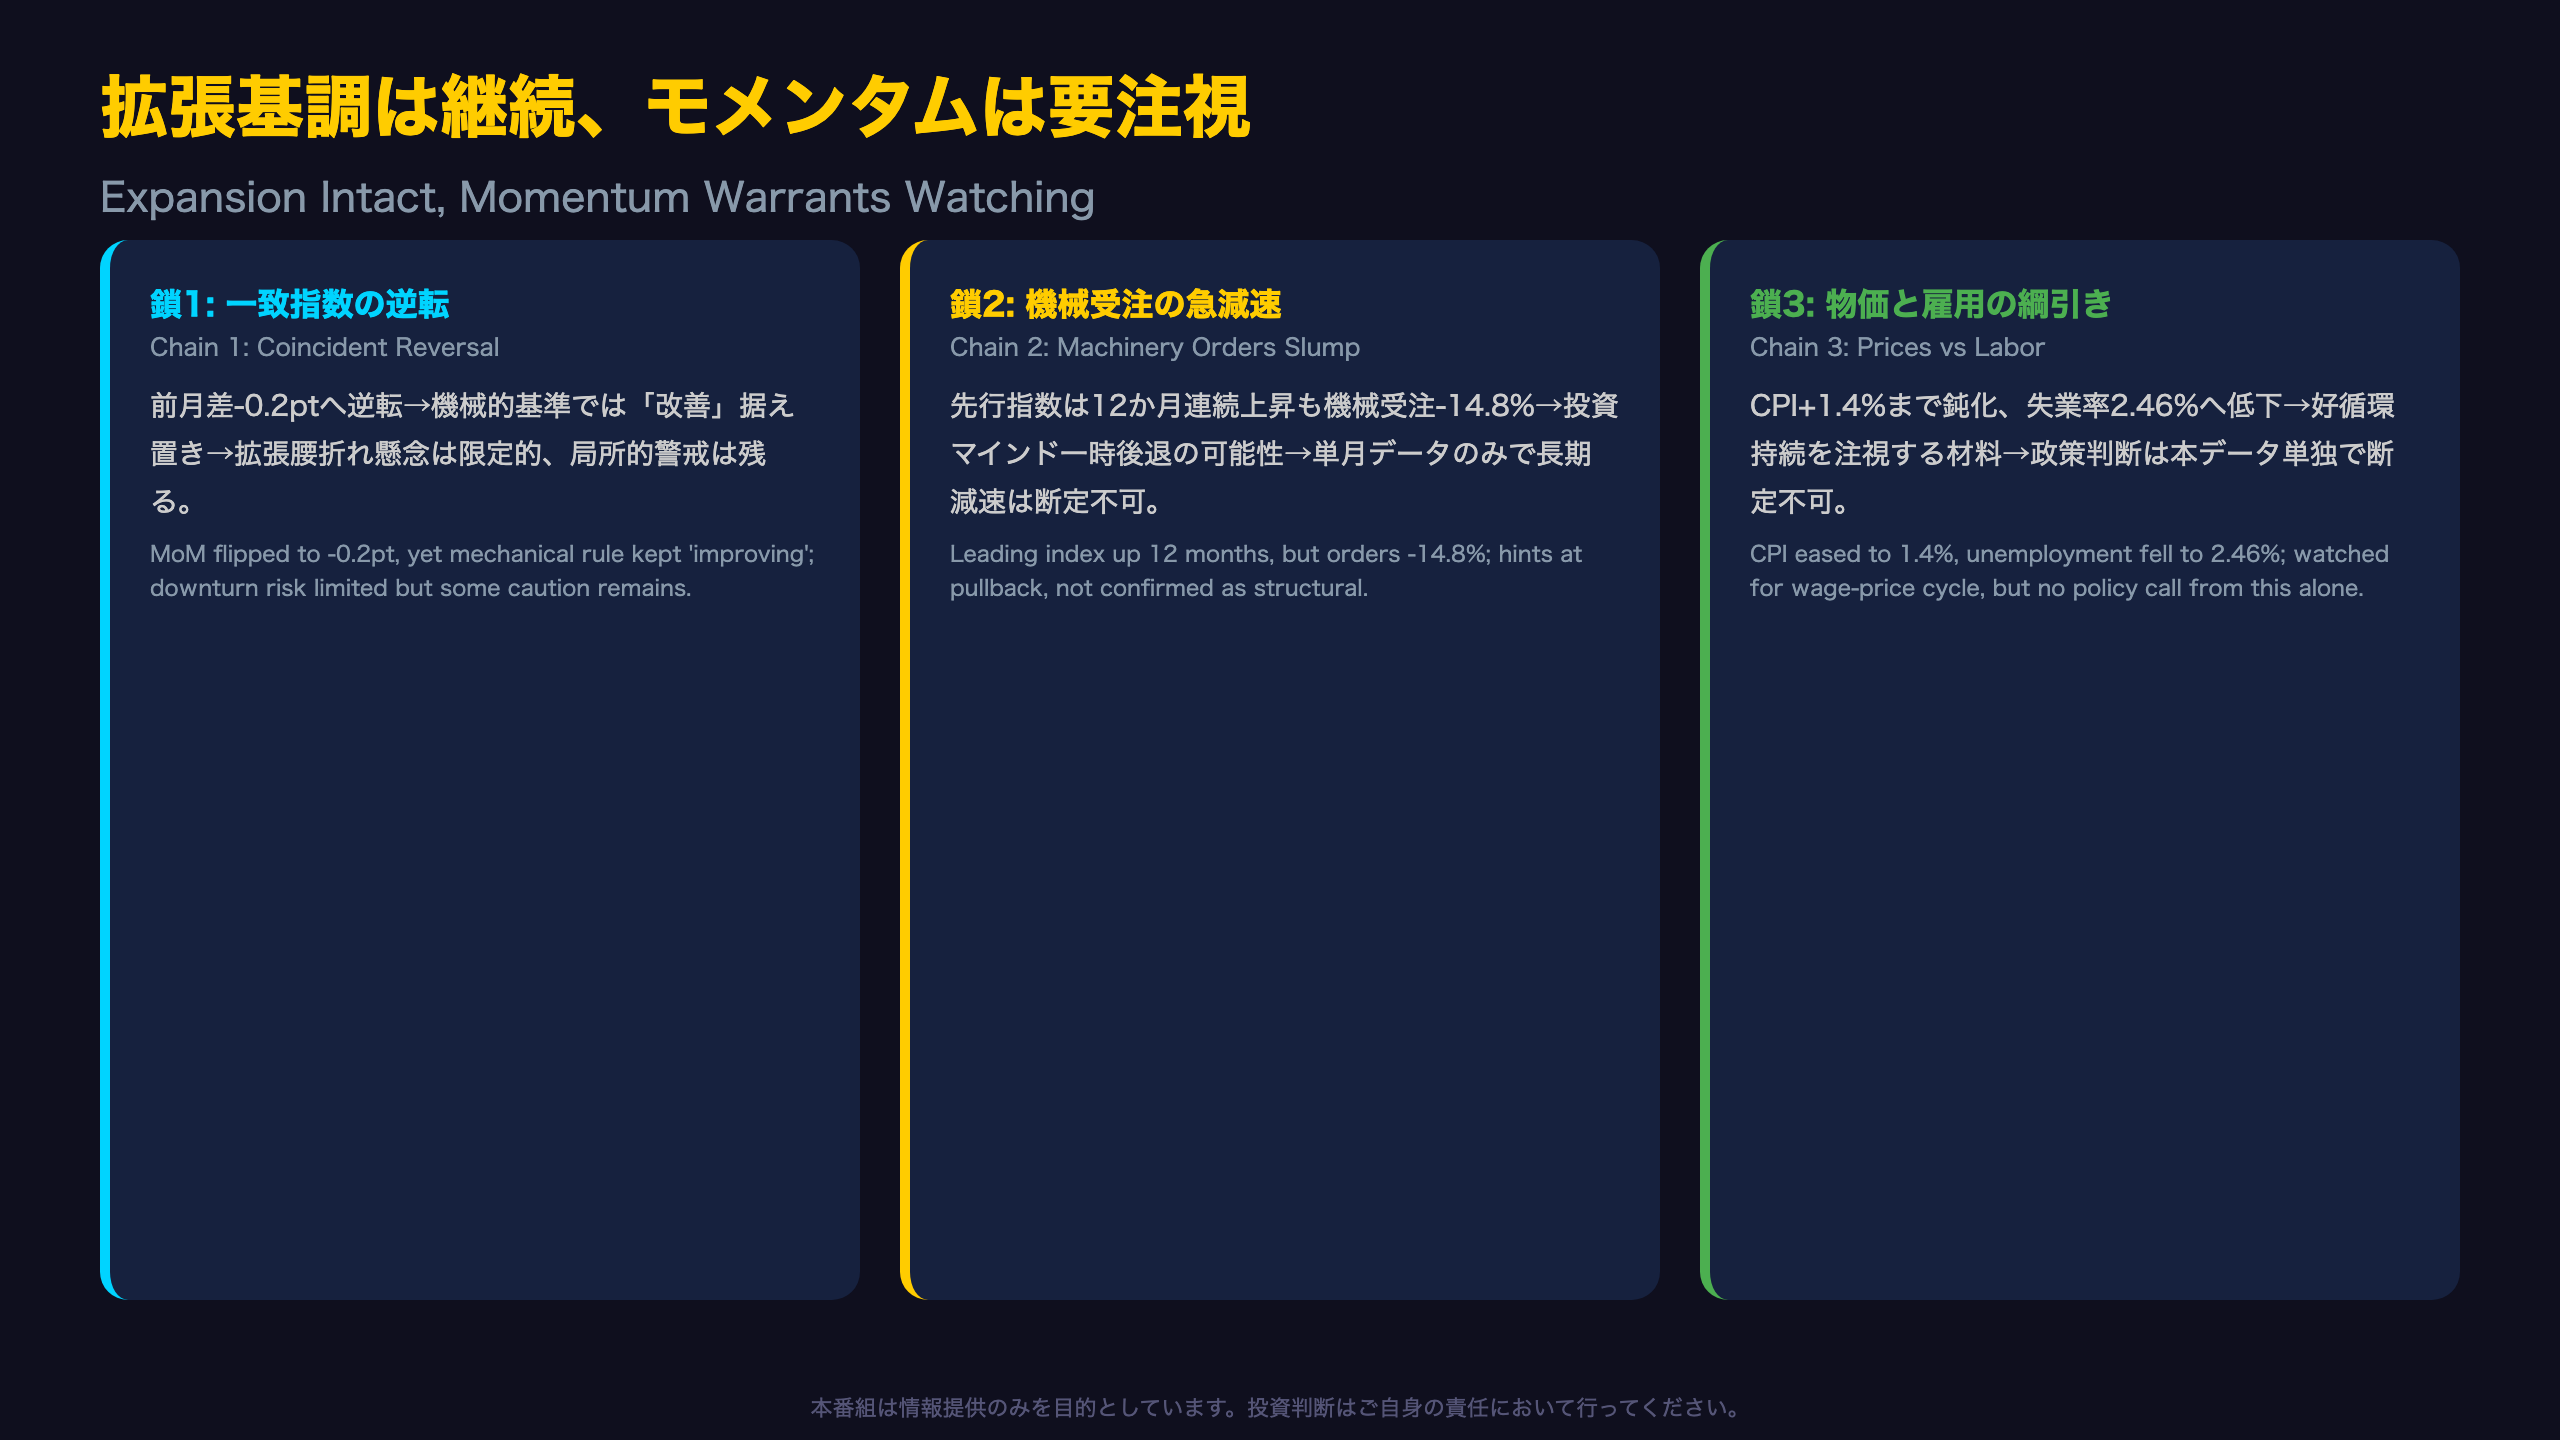
Chains of Reasoning for Market Implications
Chain 1: The coincident index’s month-on-month change turned negative (-0.2pt) upon revision, yet the 3-month and 7-month moving averages stayed positive → Under the Cabinet Office’s mechanical framework, the ‘improving’ verdict was retained → This suggests markets are unlikely to price in a sharp Japan growth downturn, though some localized caution around slowing single-month momentum is plausible.
Chain 2: The leading index still rose 0.4 points after revision, extending a twelve-month streak, even as real machinery orders (manufacturing) plunged 14.8% month-on-month → This hints at a temporary pullback in capex sentiment → Machinery orders are generally viewed as a leading indicator for capital spending, but given this series’ well-documented month-to-month volatility, this single data point cannot confirm a structural investment slowdown.
Chain 3: Core CPI (ex-fresh food) continued easing to +1.4% year-on-year while unemployment fell to 2.46% → This reflects a coexistence of ongoing disinflation and a tightening labor market → The Bank of Japan is generally understood to watch this combination as a gauge of the sustainability of Japan’s wage-price virtuous cycle, but this data release alone cannot determine the BOJ’s next policy step.
Looking Ahead
The June flash CI is due August 7, 2026. Three things to watch: whether the coincident index’s month-on-month change returns to positive, whether machinery orders rebound, and whether the 3-month moving average’s positive margin continues to narrow toward the historical one-standard-deviation threshold of 1.08 points — a level that, if approached, would raise the probability of a downgrade to ‘pause.’
Disclaimer: This article is for informational purposes only. All investment decisions are made solely at your own risk.