
📺 Watch the Full Video Analysis
This article was automatically generated by the NFC Market Live AI analysis system. (Updated: 2026-09-29 18:10 JST)
📄 Primary Source
Bank of England
https://www.bankofengland.co.uk/statistics/money-and-credit/2026/august-2026
📊 A deep dive into the Bank of England’s August 2026 Money and Credit release (published Sept 29).
UK M4ex swung from -£9.8bn in July to +£16.2bn in August — but 68% of that jump came from non-bank financial corporations (NIOFCs), not real households or businesses.
📉 The mortgage market kept cooling: new mortgage rates hit 4.60%, approvals fell for a 4th straight month.
📈 Meanwhile consumer credit accelerated, with credit card debt growing 13.3% YoY.
💡 Large-business and SME loan growth moved in opposite directions, revealing a two-track UK credit market.
Next release: October 29, 2026.
The Ultimate Summary:マネー急増160億ポンドの正体
Decoding the Headline “Money Supply Surge”
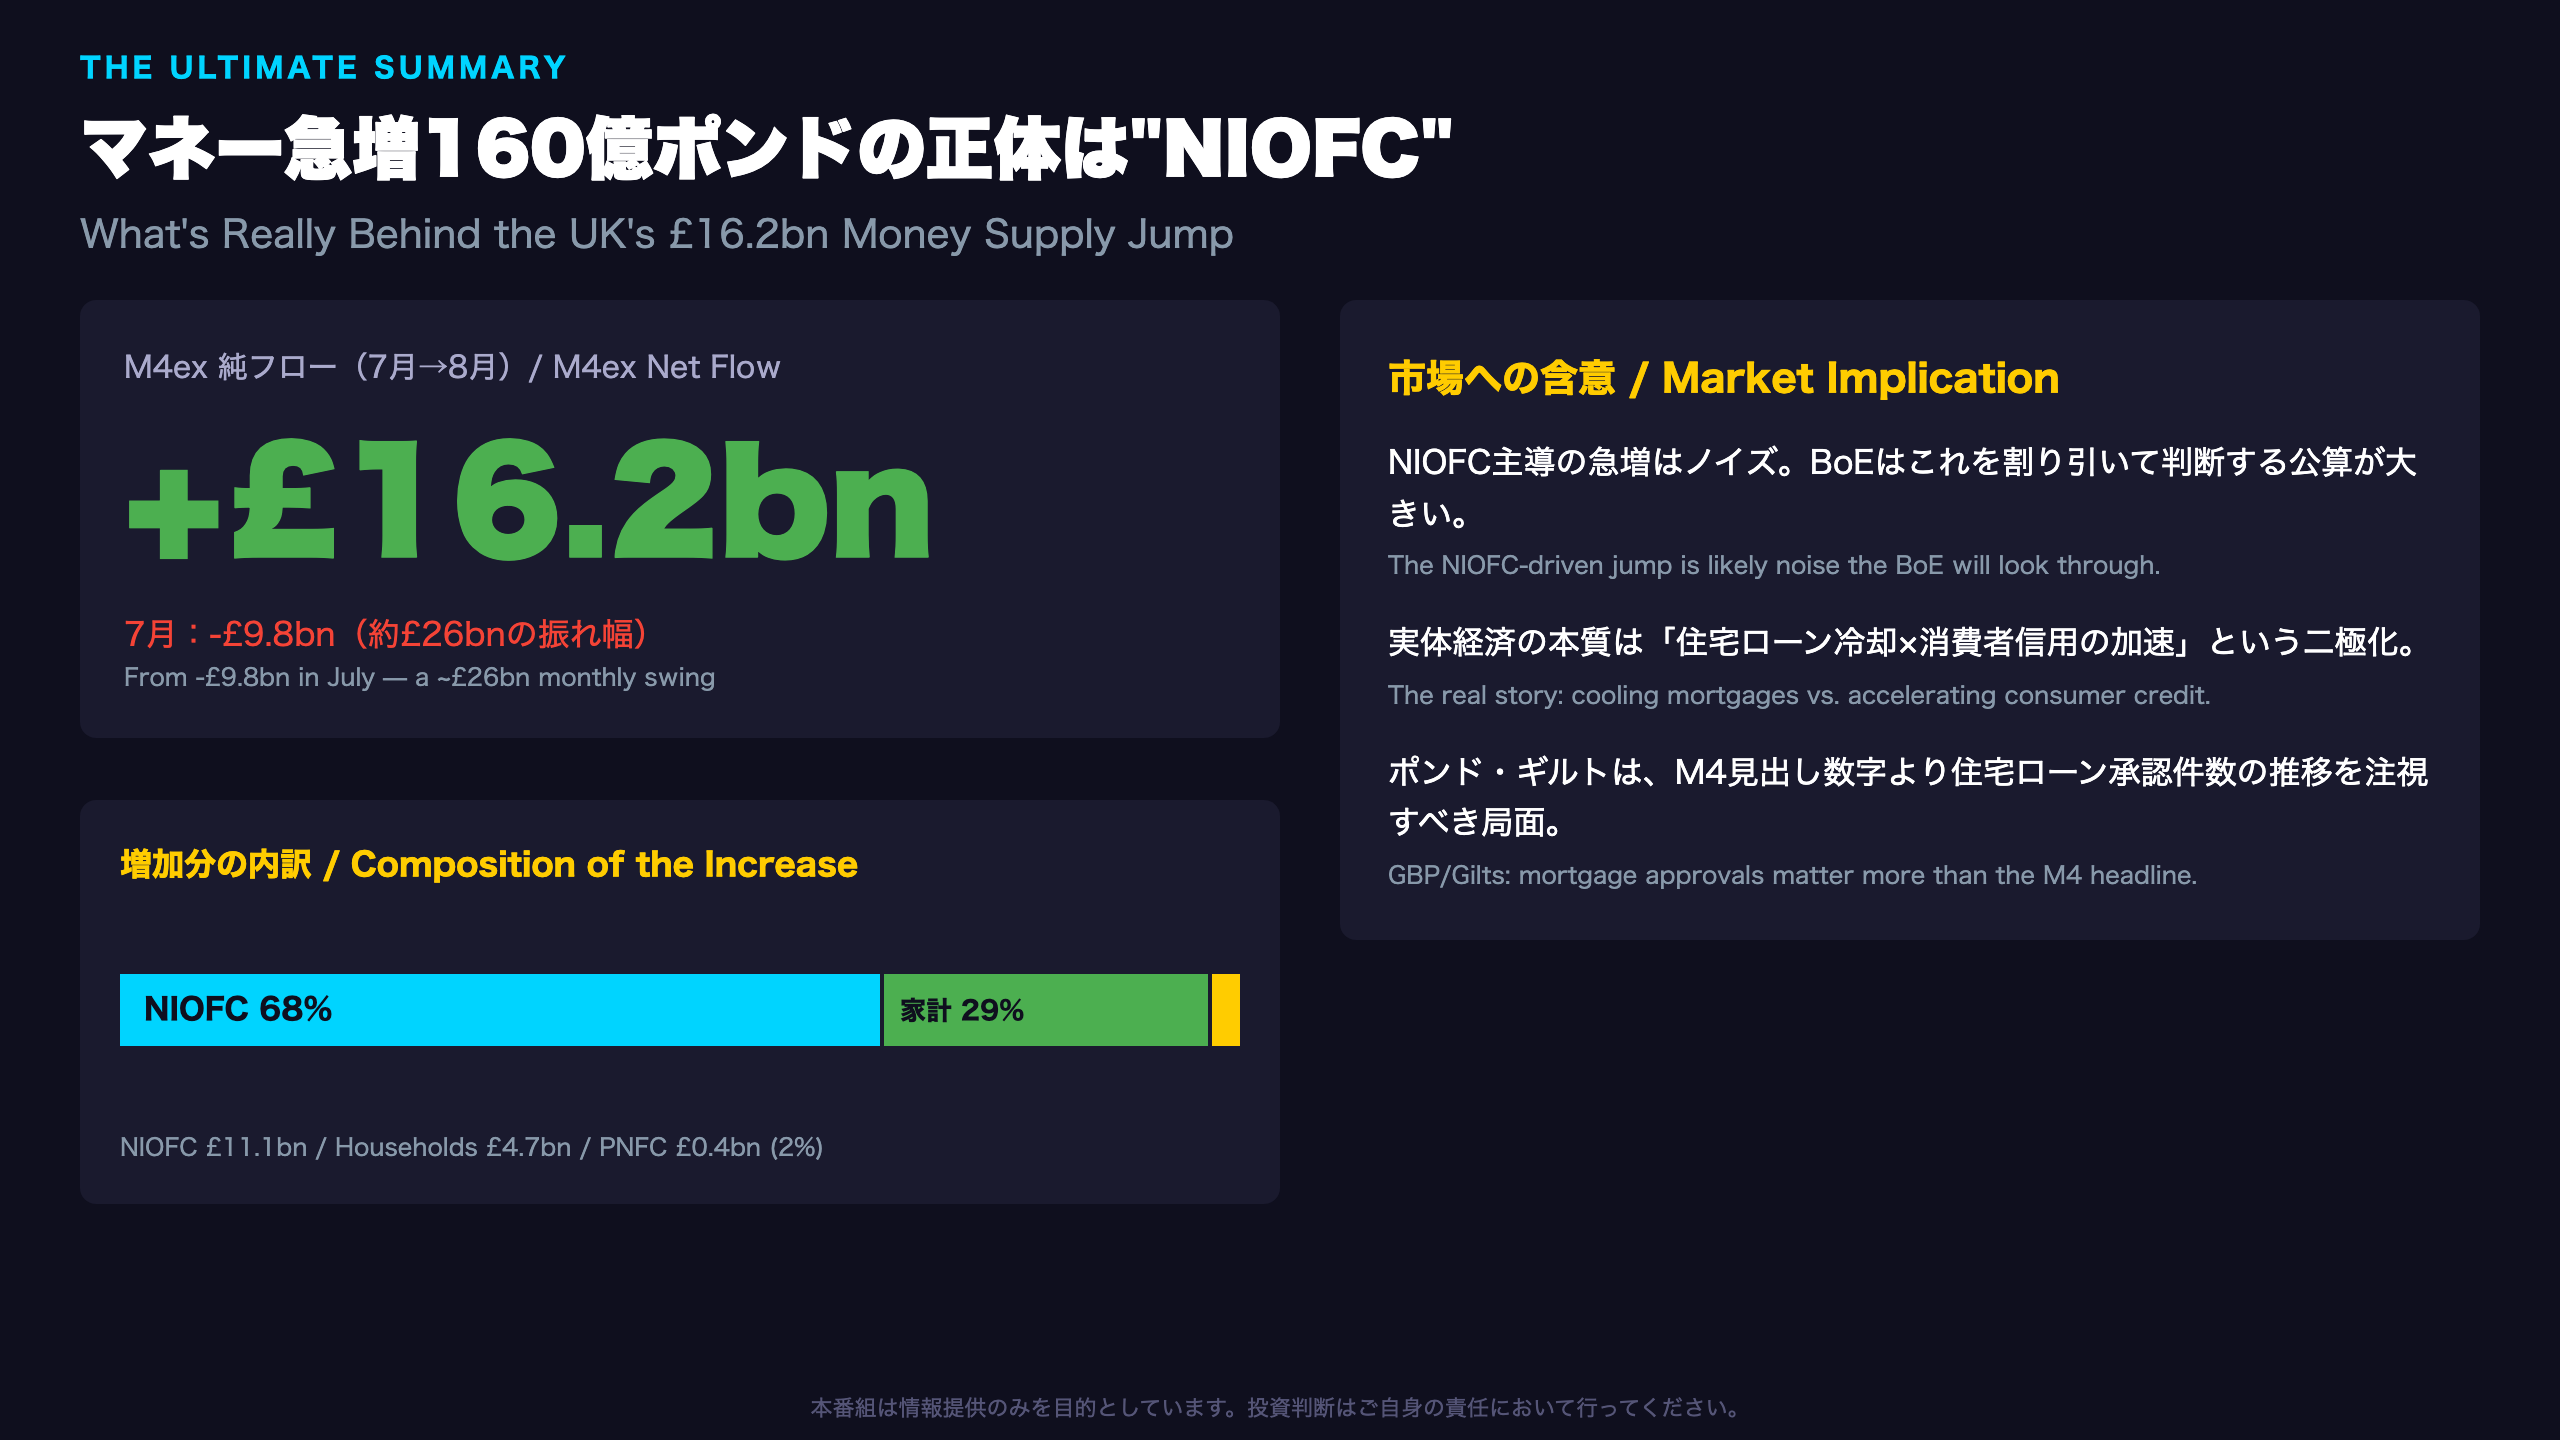
The Bank of England’s Money and Credit release (published 29 September 2026, covering August data) showed M4ex — the BoE’s preferred broad-money gauge excluding intermediate OFCs — swinging from -£9.8bn in July to +£16.2bn in August, a roughly £26bn one-month turnaround.
What is M4ex? Unlike the US Fed’s M2 or the ECB’s M3, the BoE strips out “intermediate” non-bank financial intermediaries from its headline aggregate to reduce noise from repo and securitization activity. However, non-intermediate other financial corporations (NIOFCs) — pension funds, insurers, and similar entities — remain inside M4ex, and per the release, NIOFCs alone contributed £11.1bn, or 68%, of August’s increase.
“This was driven by non-intermediate other financial corporations (NIOFCs), households and PNFCs increasing their holdings of money by £11.1 billion, £4.7 billion and £0.4 billion respectively.”
Bull case: M4ex’s annual growth rate ticked up to 4.4% in August from 4.3% in July — steady, non-alarming broad money expansion, nowhere near pandemic-era QE rates.
Bear case (caution): NIOFC flows are historically erratic — the M4Lex NIOFC component swung from +£2.1bn (April) to -£6.9bn (May), a nearly £9bn reversal within a single month. This month’s positive NIOFC contribution could just as easily reverse in September.
For US/EU investors, this is analogous to a one-off swing in non-bank financial sector deposits skewing M2/M3 headlines — a reminder to check sectoral composition before reading a “surge” as real credit-cycle news. Next release: 29 October 2026.
NIOFCという”ノイズ”の正体
Why NIOFC Flows Are the “Noise” in UK Money Supply Data
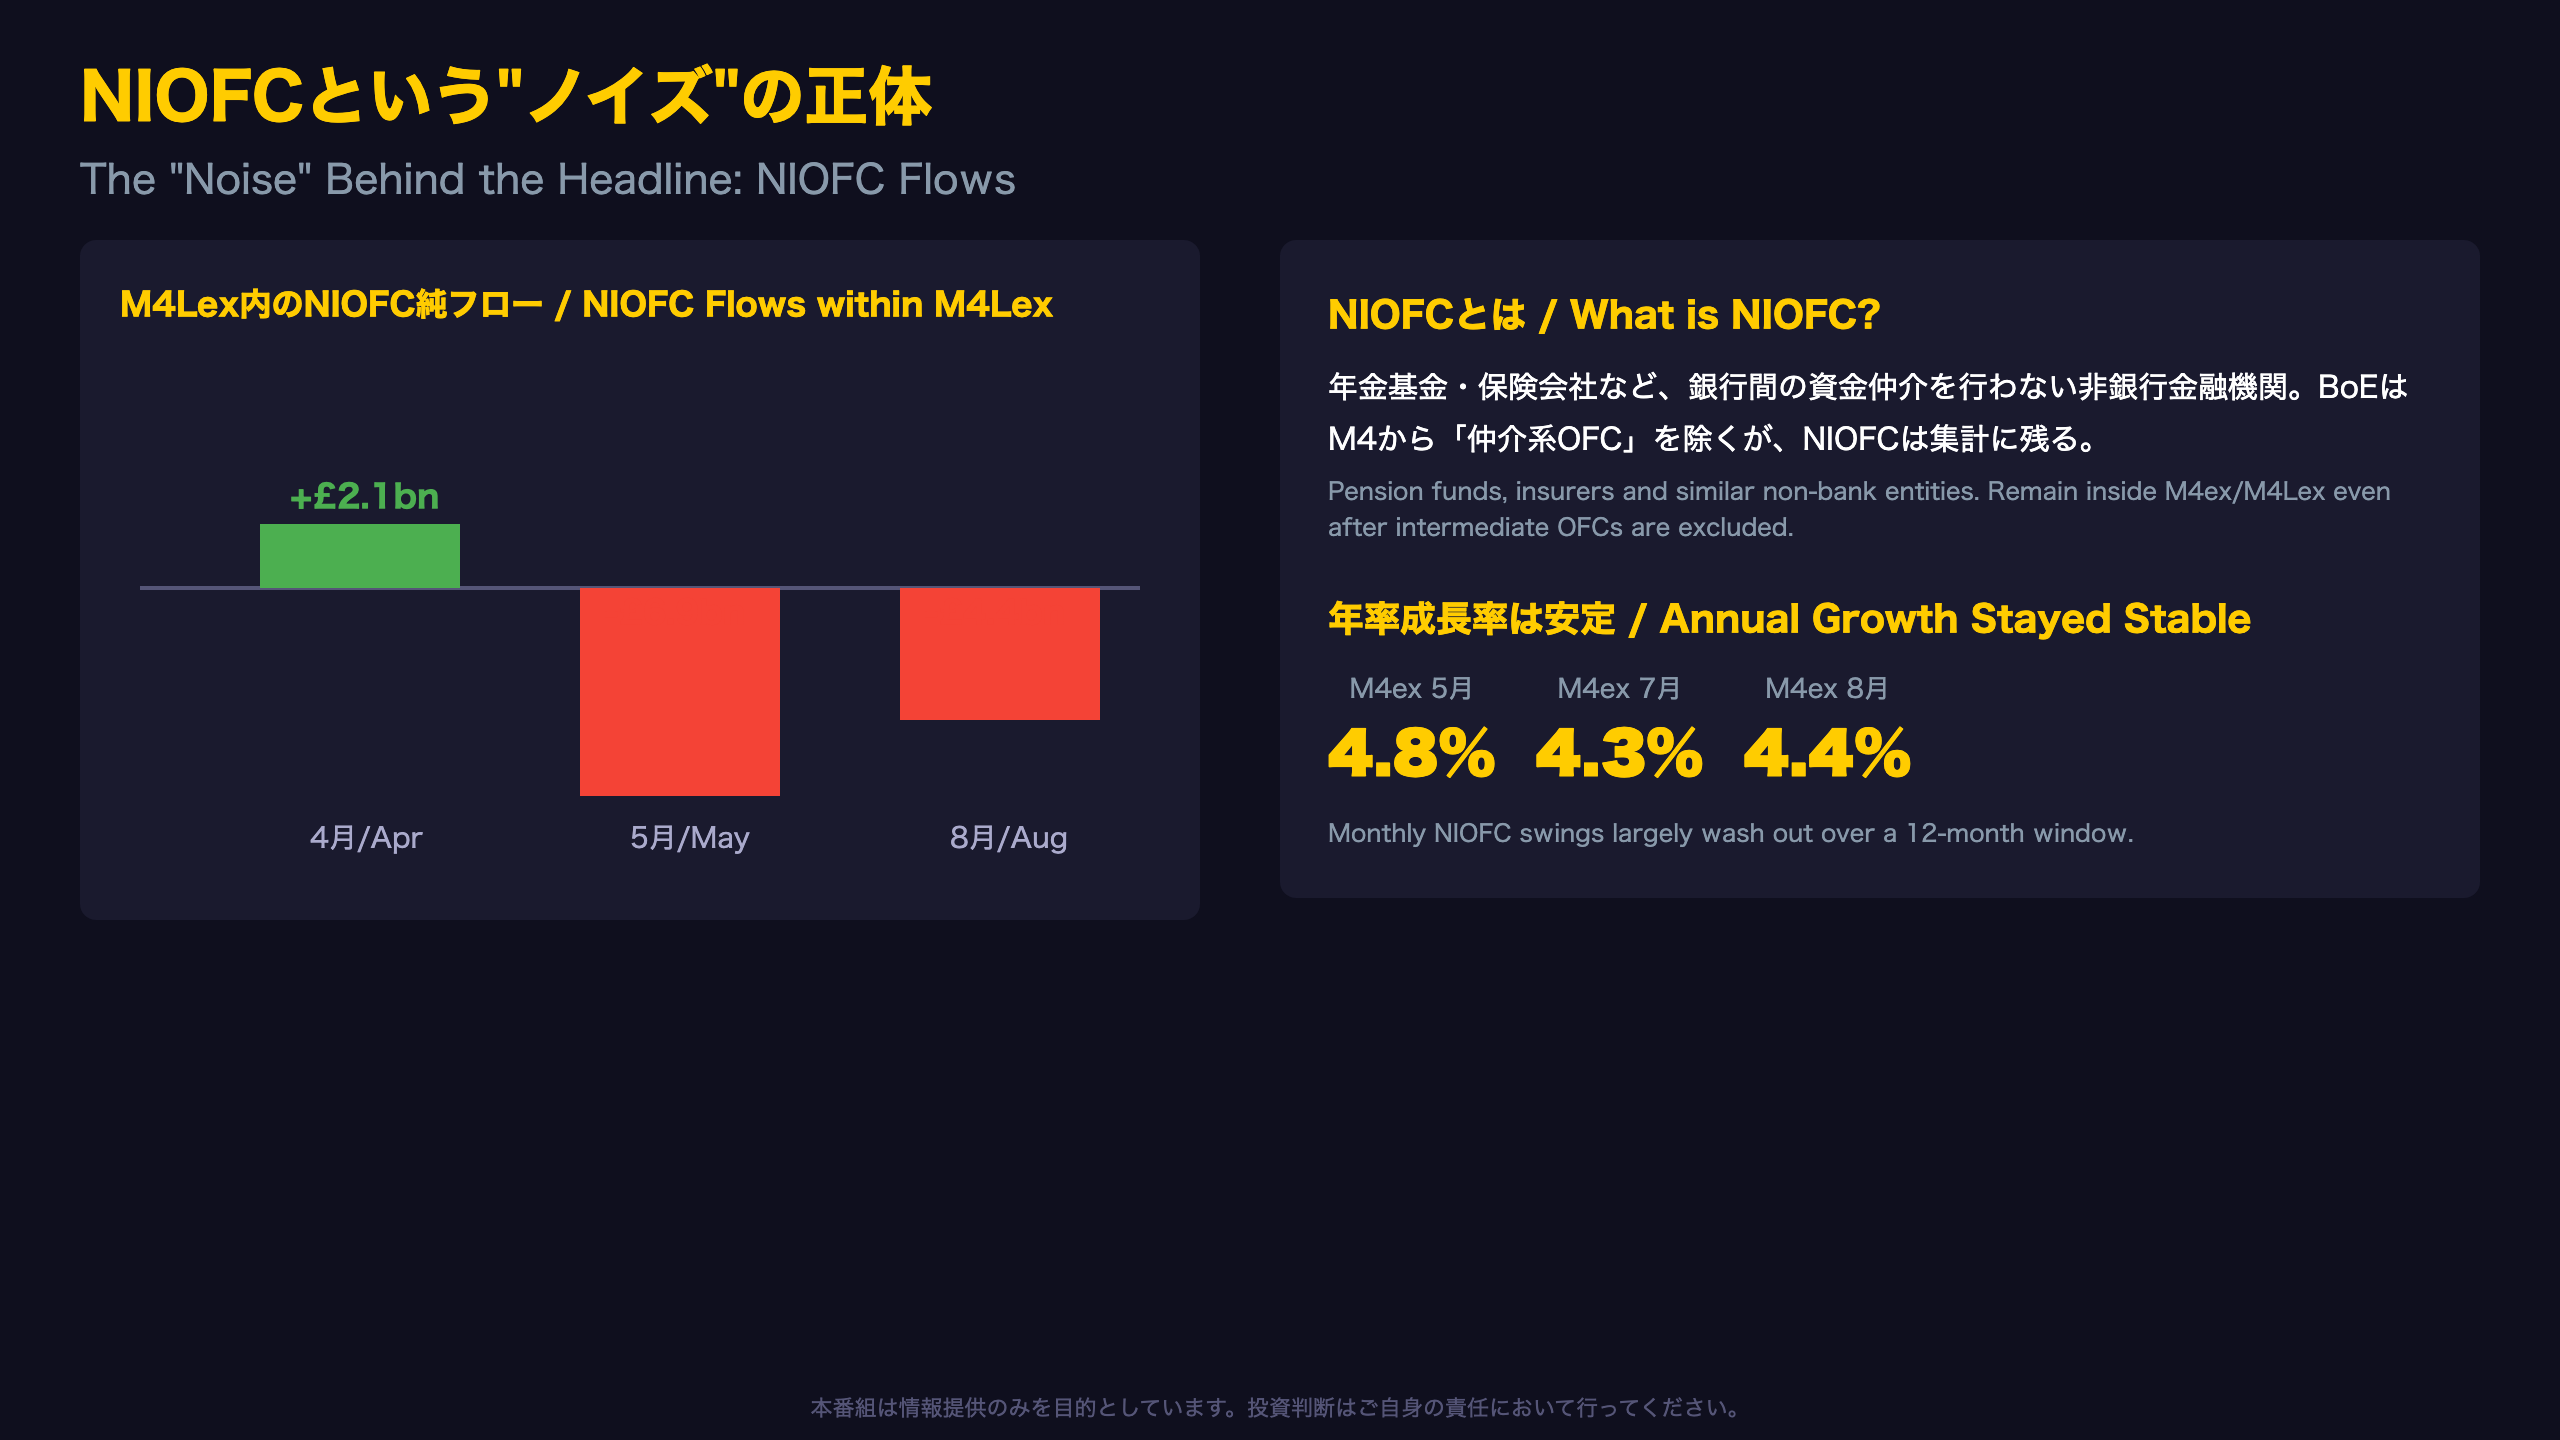
Non-Intermediate Other Financial Corporations (NIOFCs) — pension funds, insurers, and similar non-bank entities that don’t act as credit intermediaries — sit inside the BoE’s M4ex/M4Lex aggregates even though the BoE already strips out “intermediate” OFCs to reduce noise.
NIOFC flows within M4Lex, past four months
- April: +£2.1bn (net borrowing)
- May: -£6.9bn (net repayment)
- August: -£4.4bn (net repayment)
A roughly £9bn swing within a single month (April to May) illustrates how erratic this component is — often reflecting portfolio rebalancing or collateral management by pension/insurance funds rather than real economic credit demand.
But annual growth rates stayed remarkably stable
Despite these wild monthly swings, M4ex annual growth only moved within a narrow band: 4.8% (May) → 4.3% (July) → 4.4% (August). M4Lex annual growth was similarly stable, hovering near 6%: 5.9% (May) → 6.4% (July) → 6.1% (August).
Comparison for international readers: This is conceptually similar to how US M2 can be distorted by money market fund flows, or how ECB M3 can be skewed by non-monetary financial institution deposits. Investors tracking headline money supply prints should always check sectoral composition before extrapolating a trend.
Next data release: 29 October 2026 — watch whether NIOFC flips negative again.
住宅ローン市場、静かな引き締まり
UK Mortgage Approvals: Four Straight Months of Decline
Per the BoE’s release:
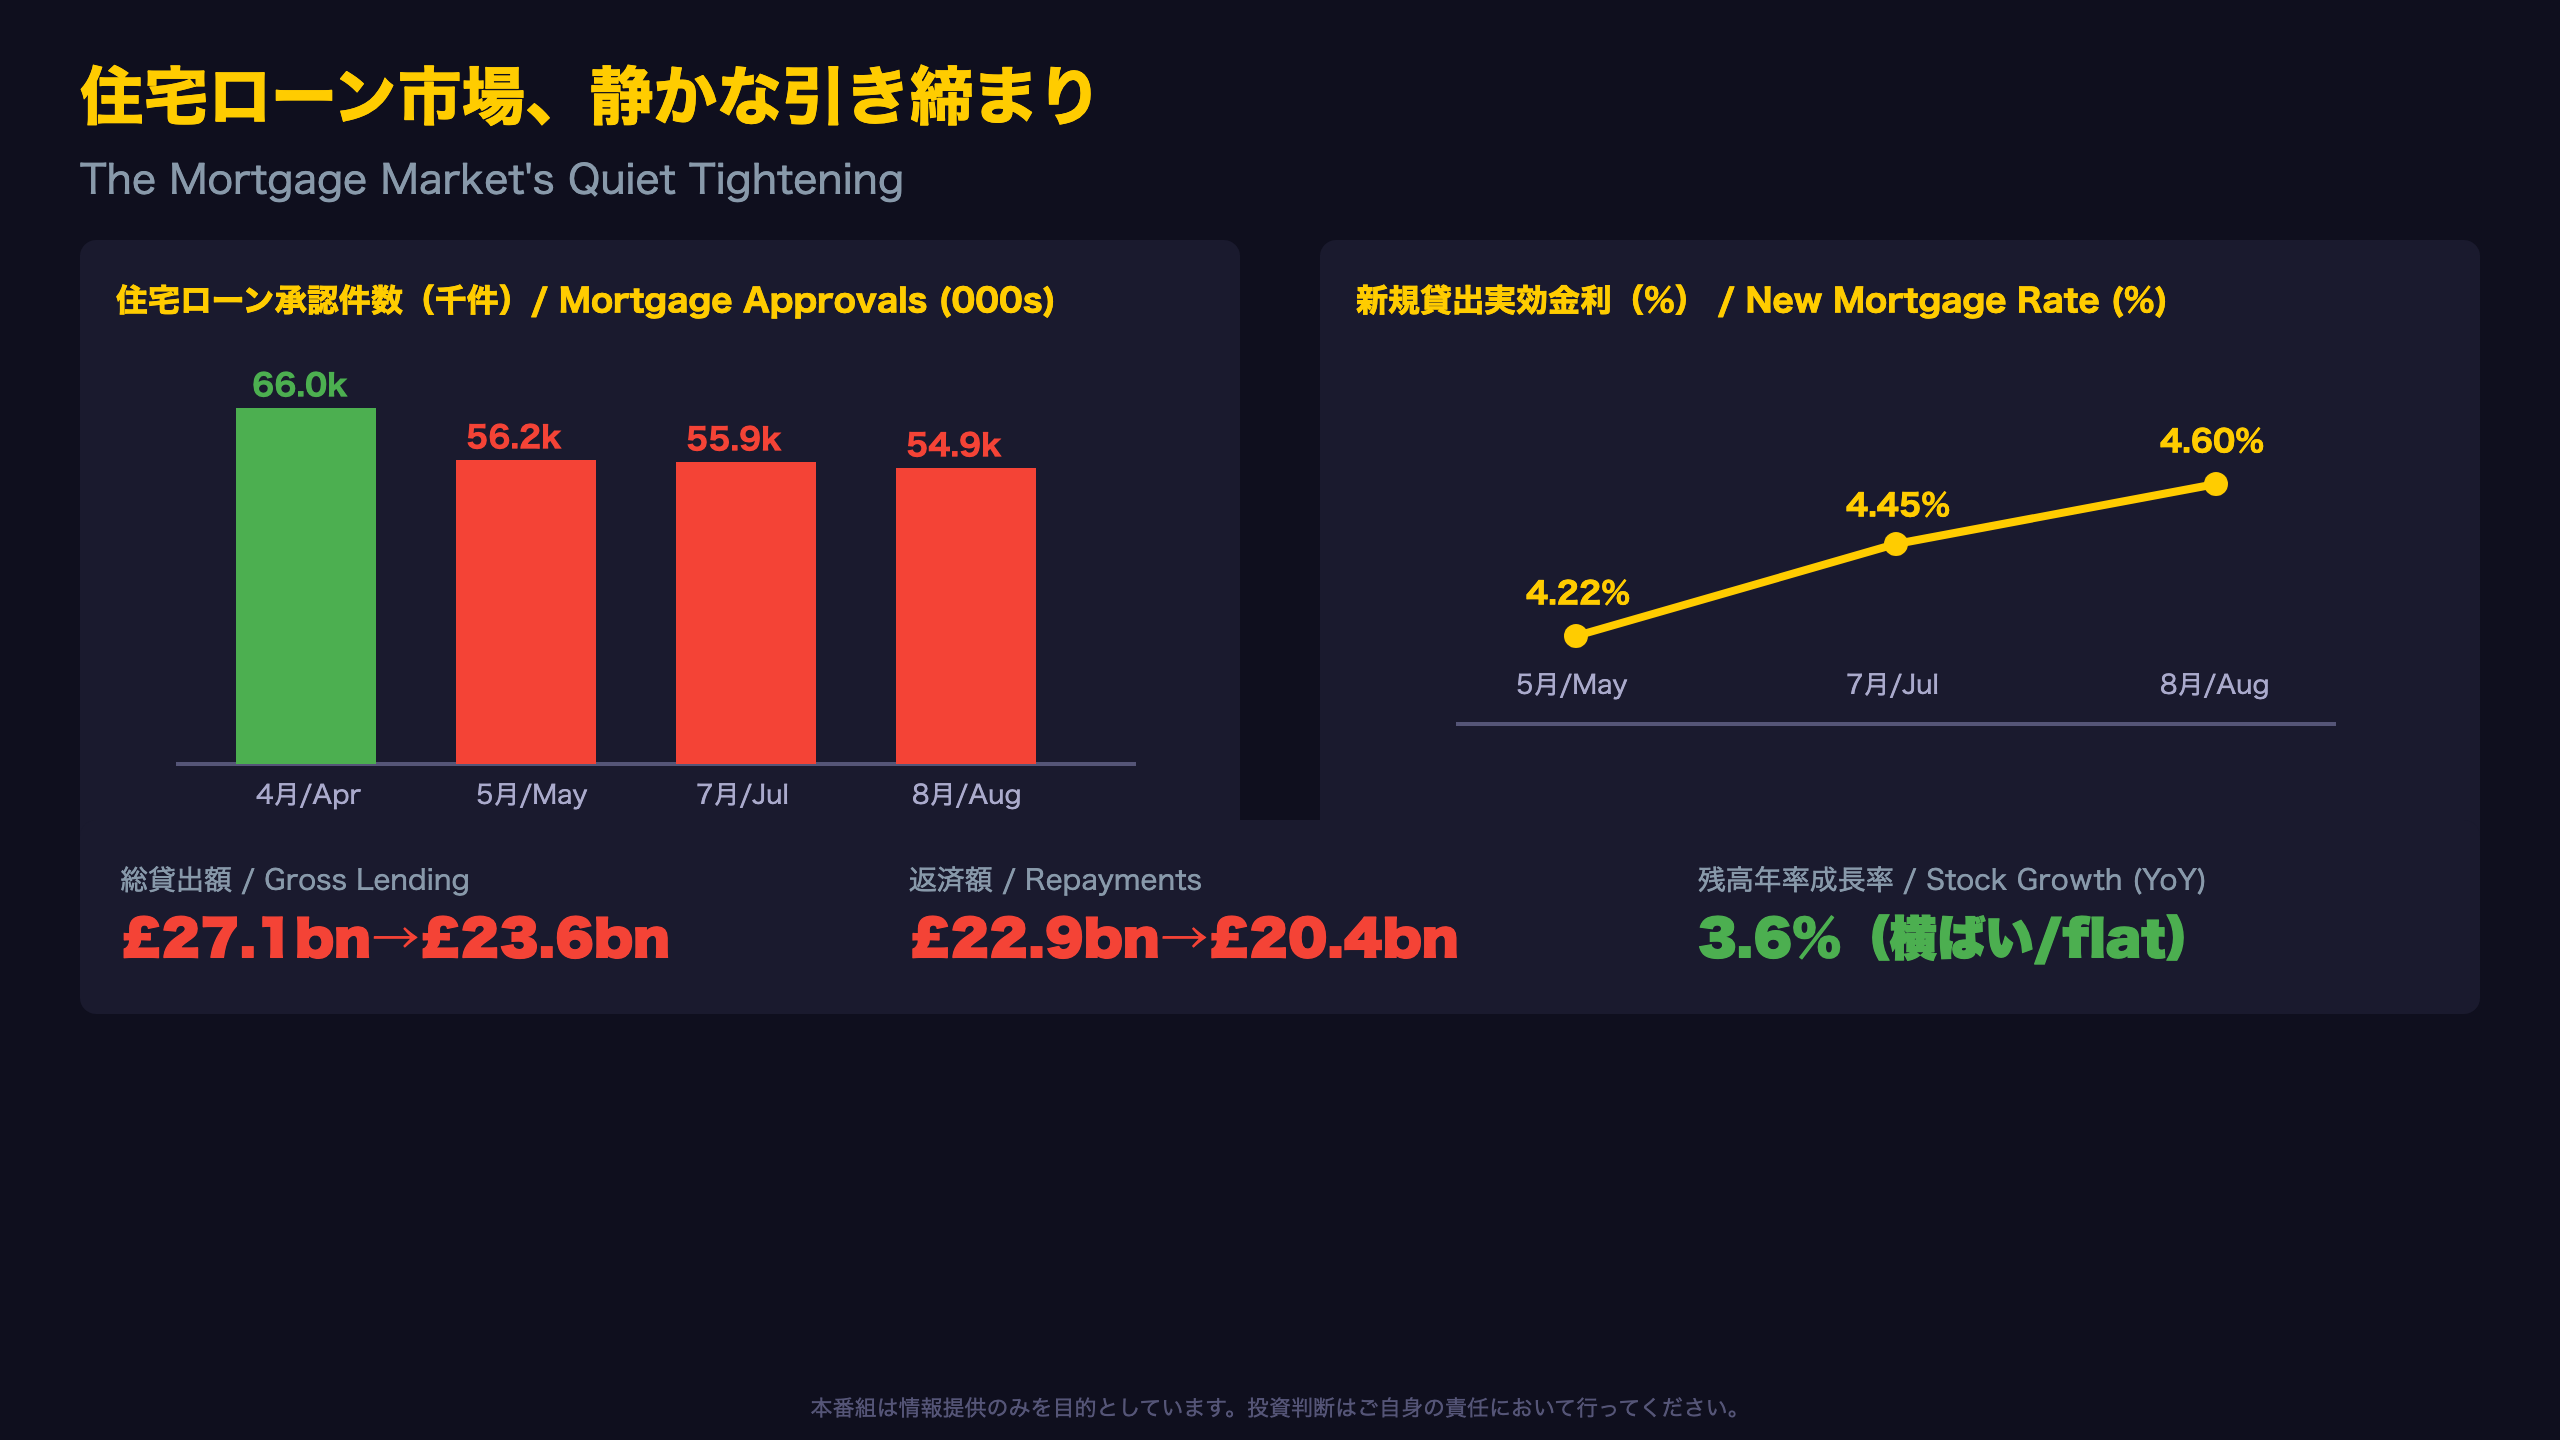
“Net mortgage approvals for house purchases decreased to 54,900 in August, below an average of around 60,100 over the previous six months.”
Context for international readers: Mortgage approvals are the UK’s closest equivalent to the US MBA Purchase Index — a forward-looking gauge of housing credit demand that typically leads actual drawdowns by 1-3 months. The current reading (54,900) continues a declining sequence: 66,000 (April) → 56,200 (May) → 55,900 (July) → 54,900 (August).
Rate pass-through is accelerating, not slowing
The effective rate on newly-drawn mortgages rose from 4.22% (May) to 4.60% (August), a 38 basis-point increase in three months — likely reflecting gilt yield moves and lenders repricing fixed-rate offers.
Stock vs. flow divergence
Despite the flow-side slowdown, the annual growth rate of the outstanding mortgage stock held at 3.6%, unchanged from July. This is a classic lagged-transmission pattern: it typically takes multiple quarters for weaker originations to visibly drag down total loan-book growth, since existing loans continue amortizing/refinancing in the interim.
What to watch: The 29 October release (September data) will show whether approvals stabilize in the low 50,000s or keep falling — a genuine signal for UK housing transaction volumes into Q4 2026.
消費者信用は加速、大企業とSMEは真逆に
Credit Card Debt Acceleration: A Double-Edged Signal
Per the release:
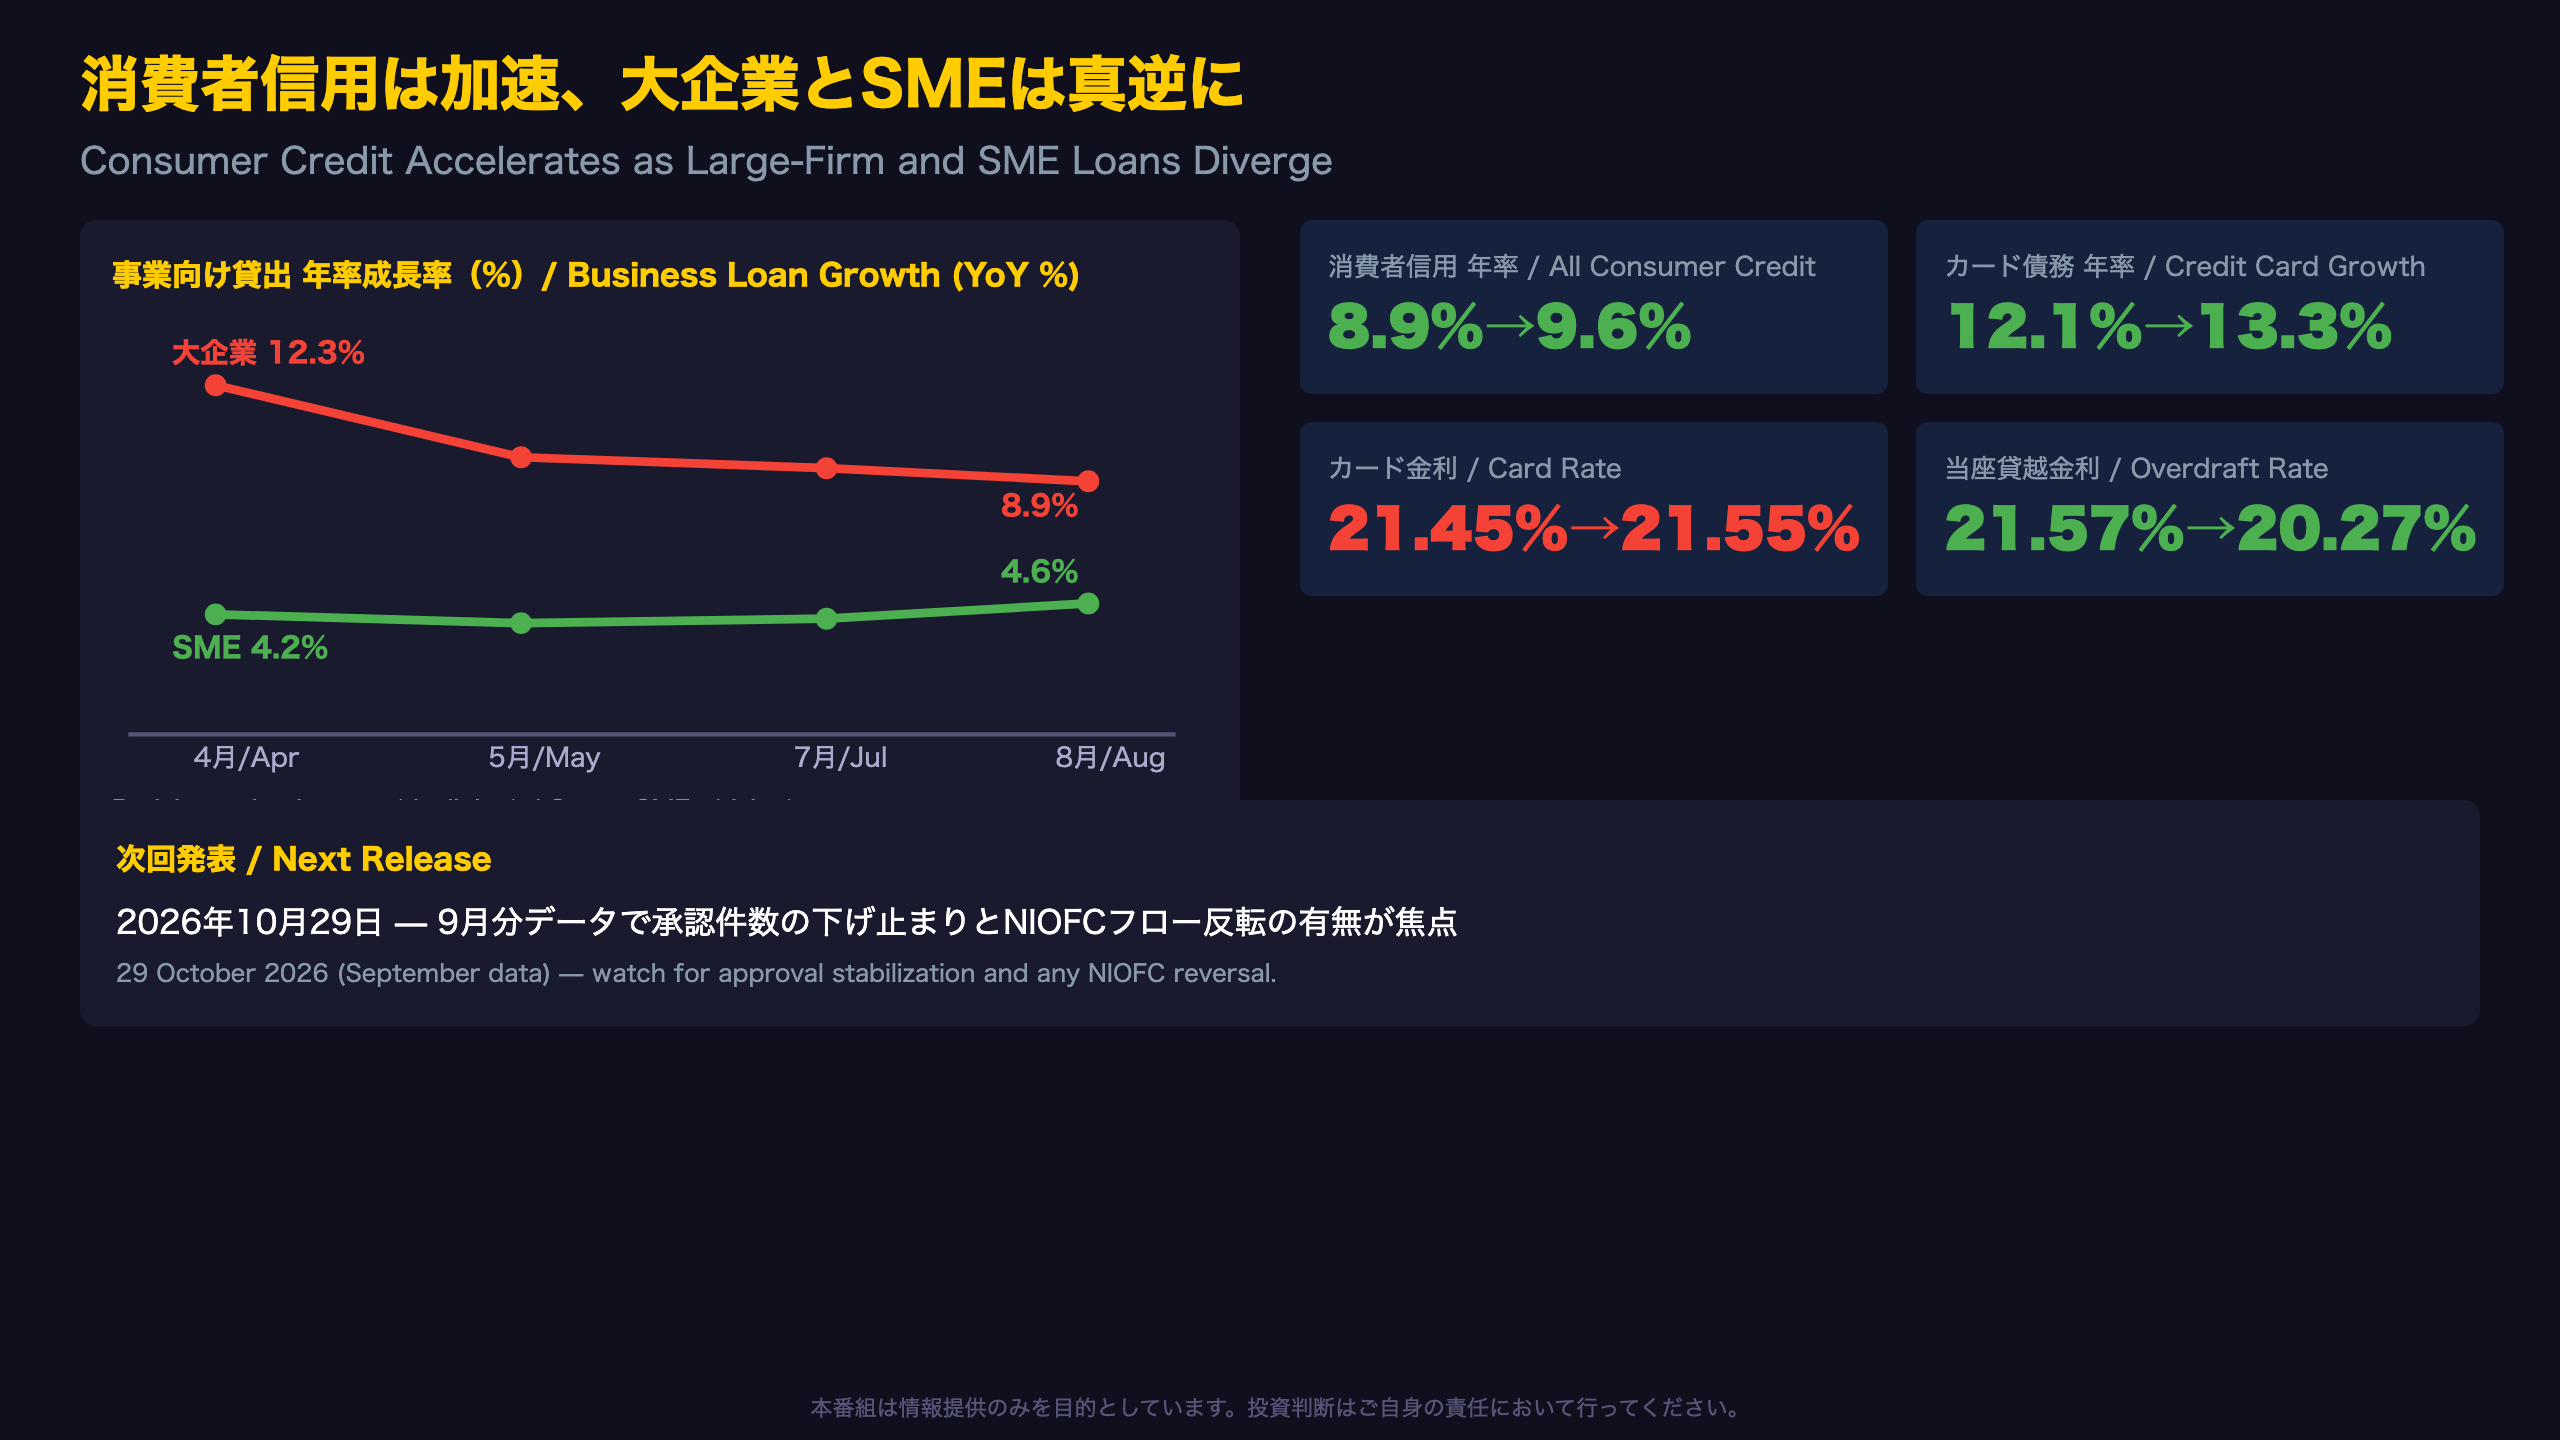
“The annual growth rate for credit card borrowing increased to 13.3% from 12.6% in July.”
This isn’t a one-month blip — card debt growth has climbed consistently over the past four months (12.1% in May to 13.3% in August). Notably, this acceleration is happening alongside rising credit card rates (21.45% to 21.55%), meaning UK consumers are taking on more debt even as it gets more expensive. This is genuinely ambiguous: it could reflect resilient consumer confidence, or growing reliance on expensive credit to cover living costs. The data alone cannot resolve which reading is correct.
Large corporates vs. SMEs: a clean divergence
| Segment | Earlier reading | August |
|---|---|---|
| Large business loan growth (YoY) | 12.3% (April) | 8.9% |
| SME loan growth (YoY) | 3.9% (May) | 4.6% |
Large-company borrowing growth decelerated by 3.4 percentage points over four months, while SME growth accelerated by 0.7 points in the opposite direction — consistent with large corporates pulling back on debt-funded capex/M&A while smaller firms’ financing needs stay comparatively resilient, though with limited data points this should be read as an emerging pattern.
For US/EU investors: This echoes large-vs-small business credit gaps seen in US Fed SLOOS data during tightening periods, where large firms with capital-markets access reduce bank borrowing first.
Next release: 29 October 2026 (September data).
Disclaimer: This article is for informational purposes only. All investment decisions are made solely at your own risk.