📺 Watch the Full Video Analysis
This article was automatically generated by the NFC Market Live AI analysis system. (Updated: 2026-07-05 18:12 JST)
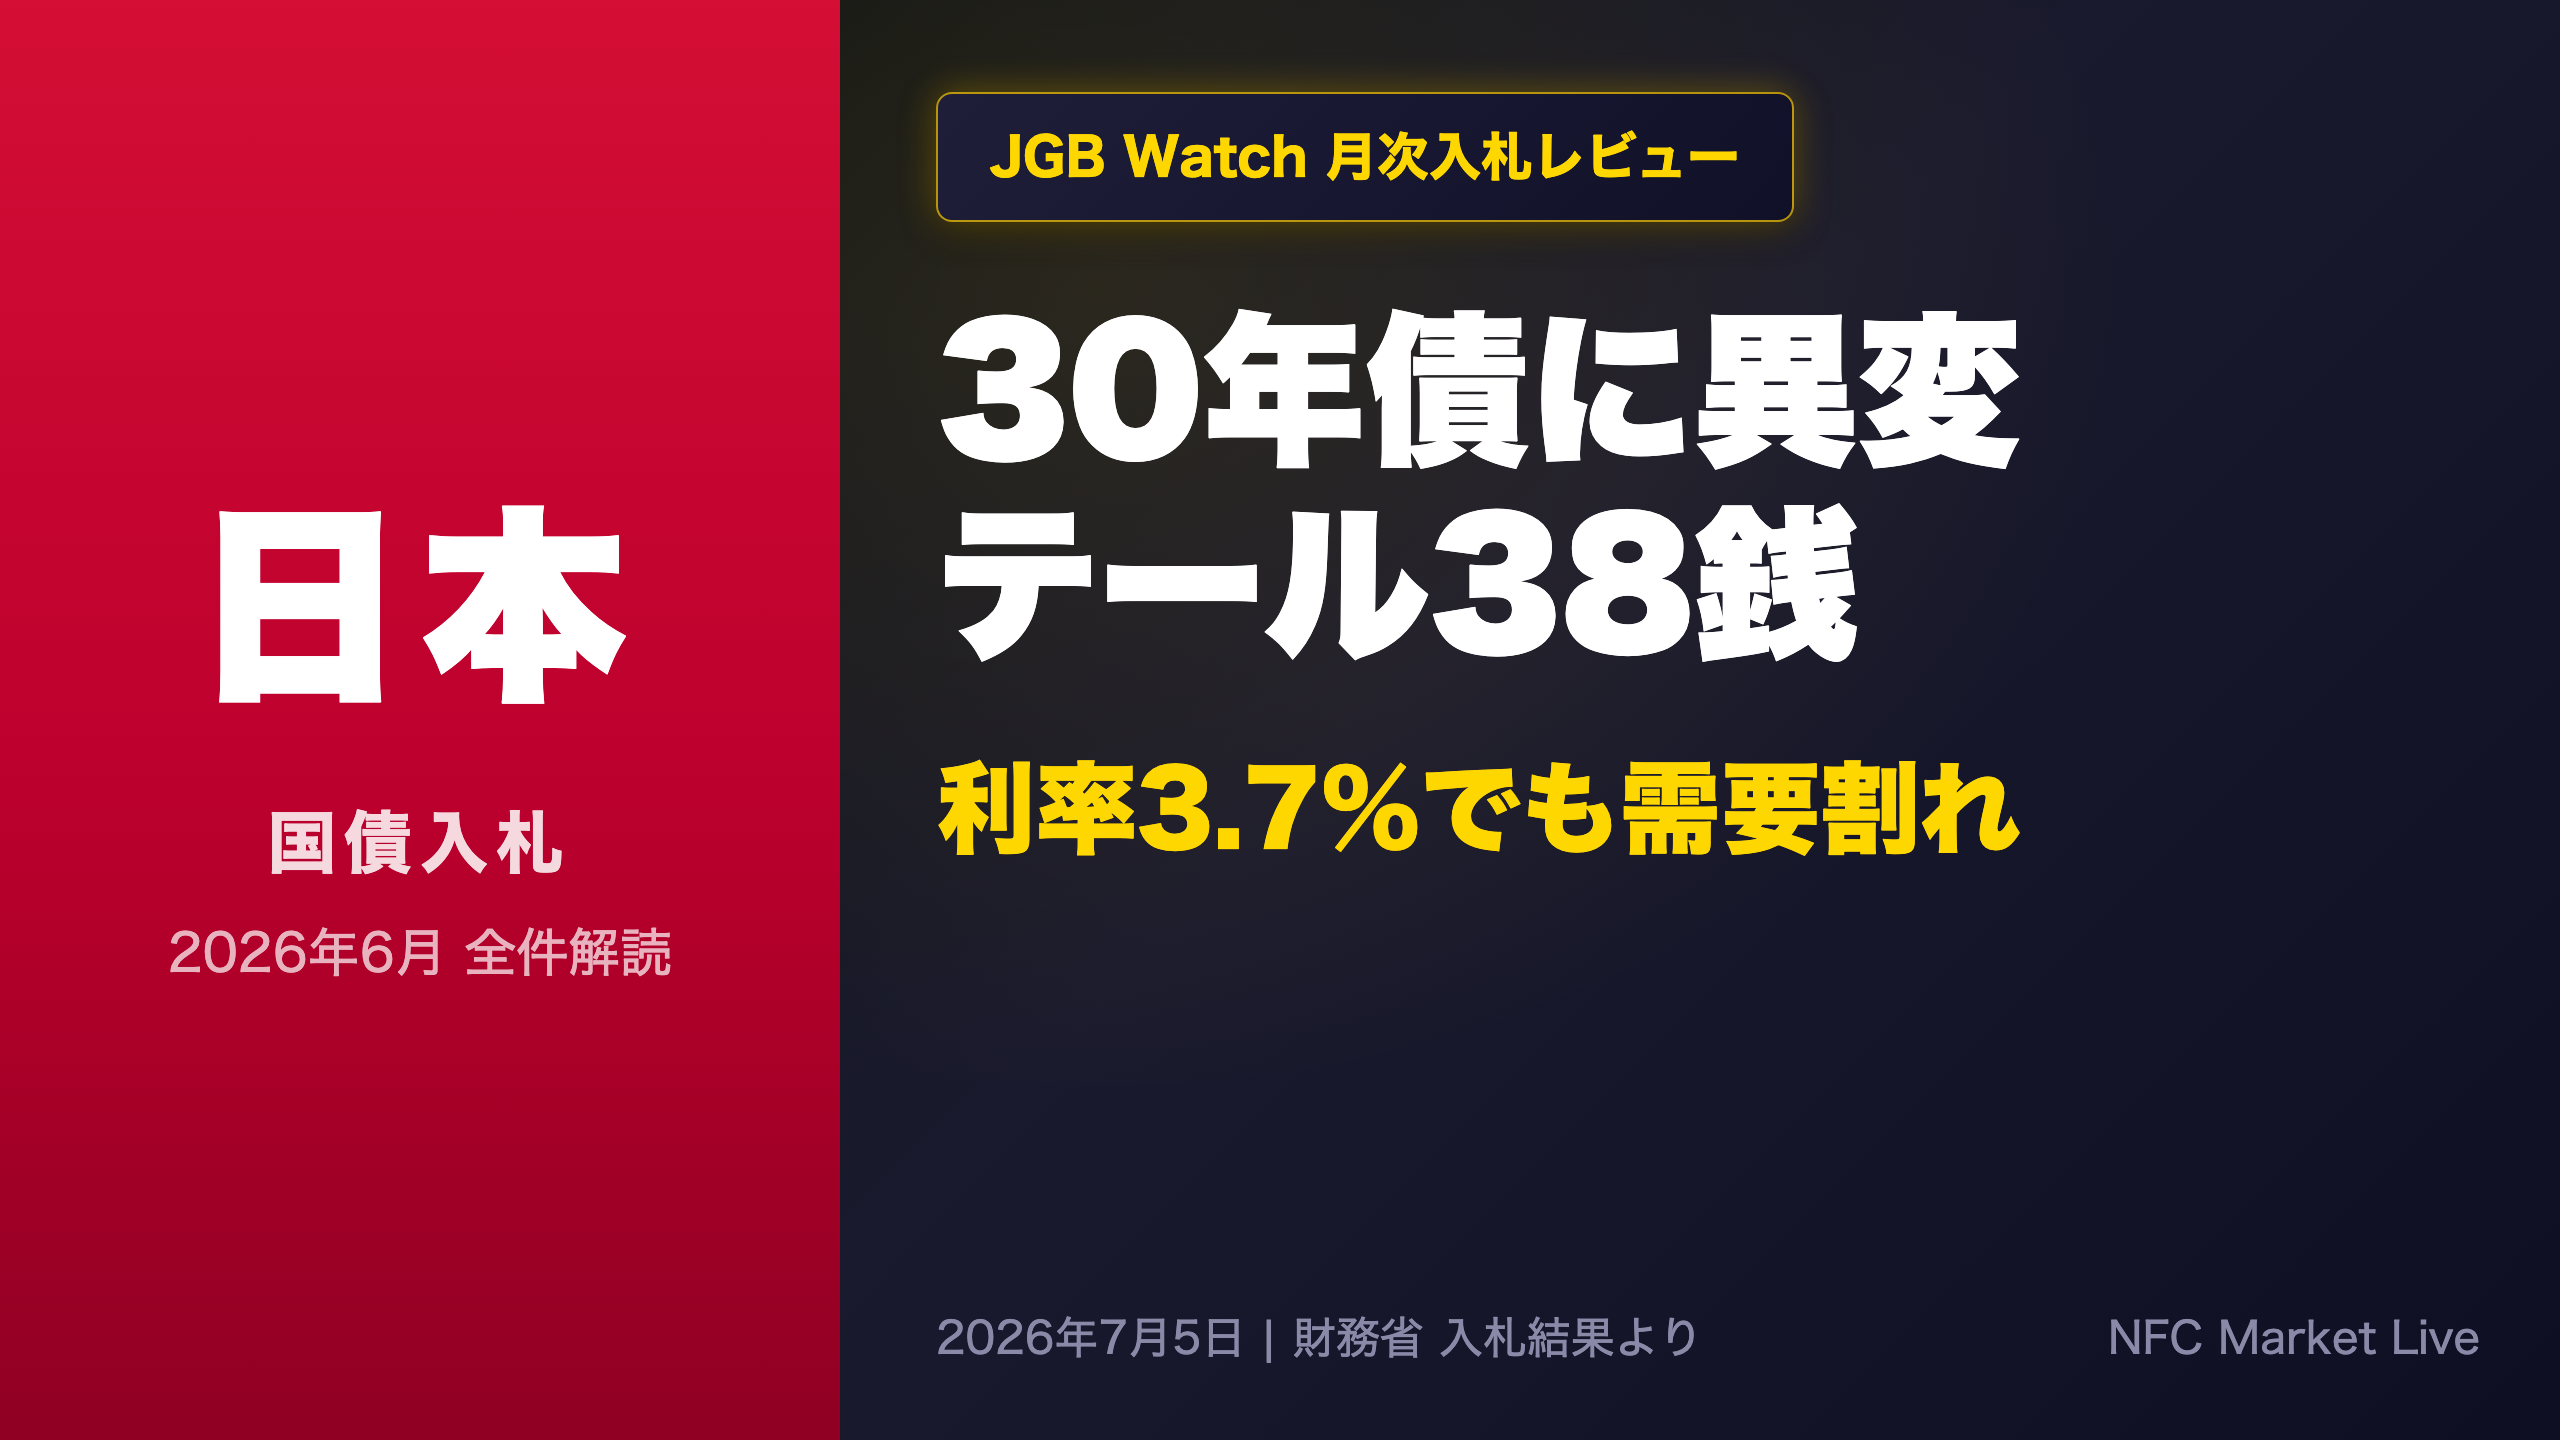
Full review of Japan’s June 2026 JGB auctions. The 10yr yield reached 2.69%, a level unseen since the late 1990s. The key story: the June 10 30yr auction carried a record 3.7% coupon yet tailed 38 sen with a 2.94x cover, versus 4.82x for 2yr notes. We decode what this bifurcation, plus yen weakness to 162, means for bond investors.
2026年6月 入札総括:静かな水面下の二極化
The June auction scoreboard
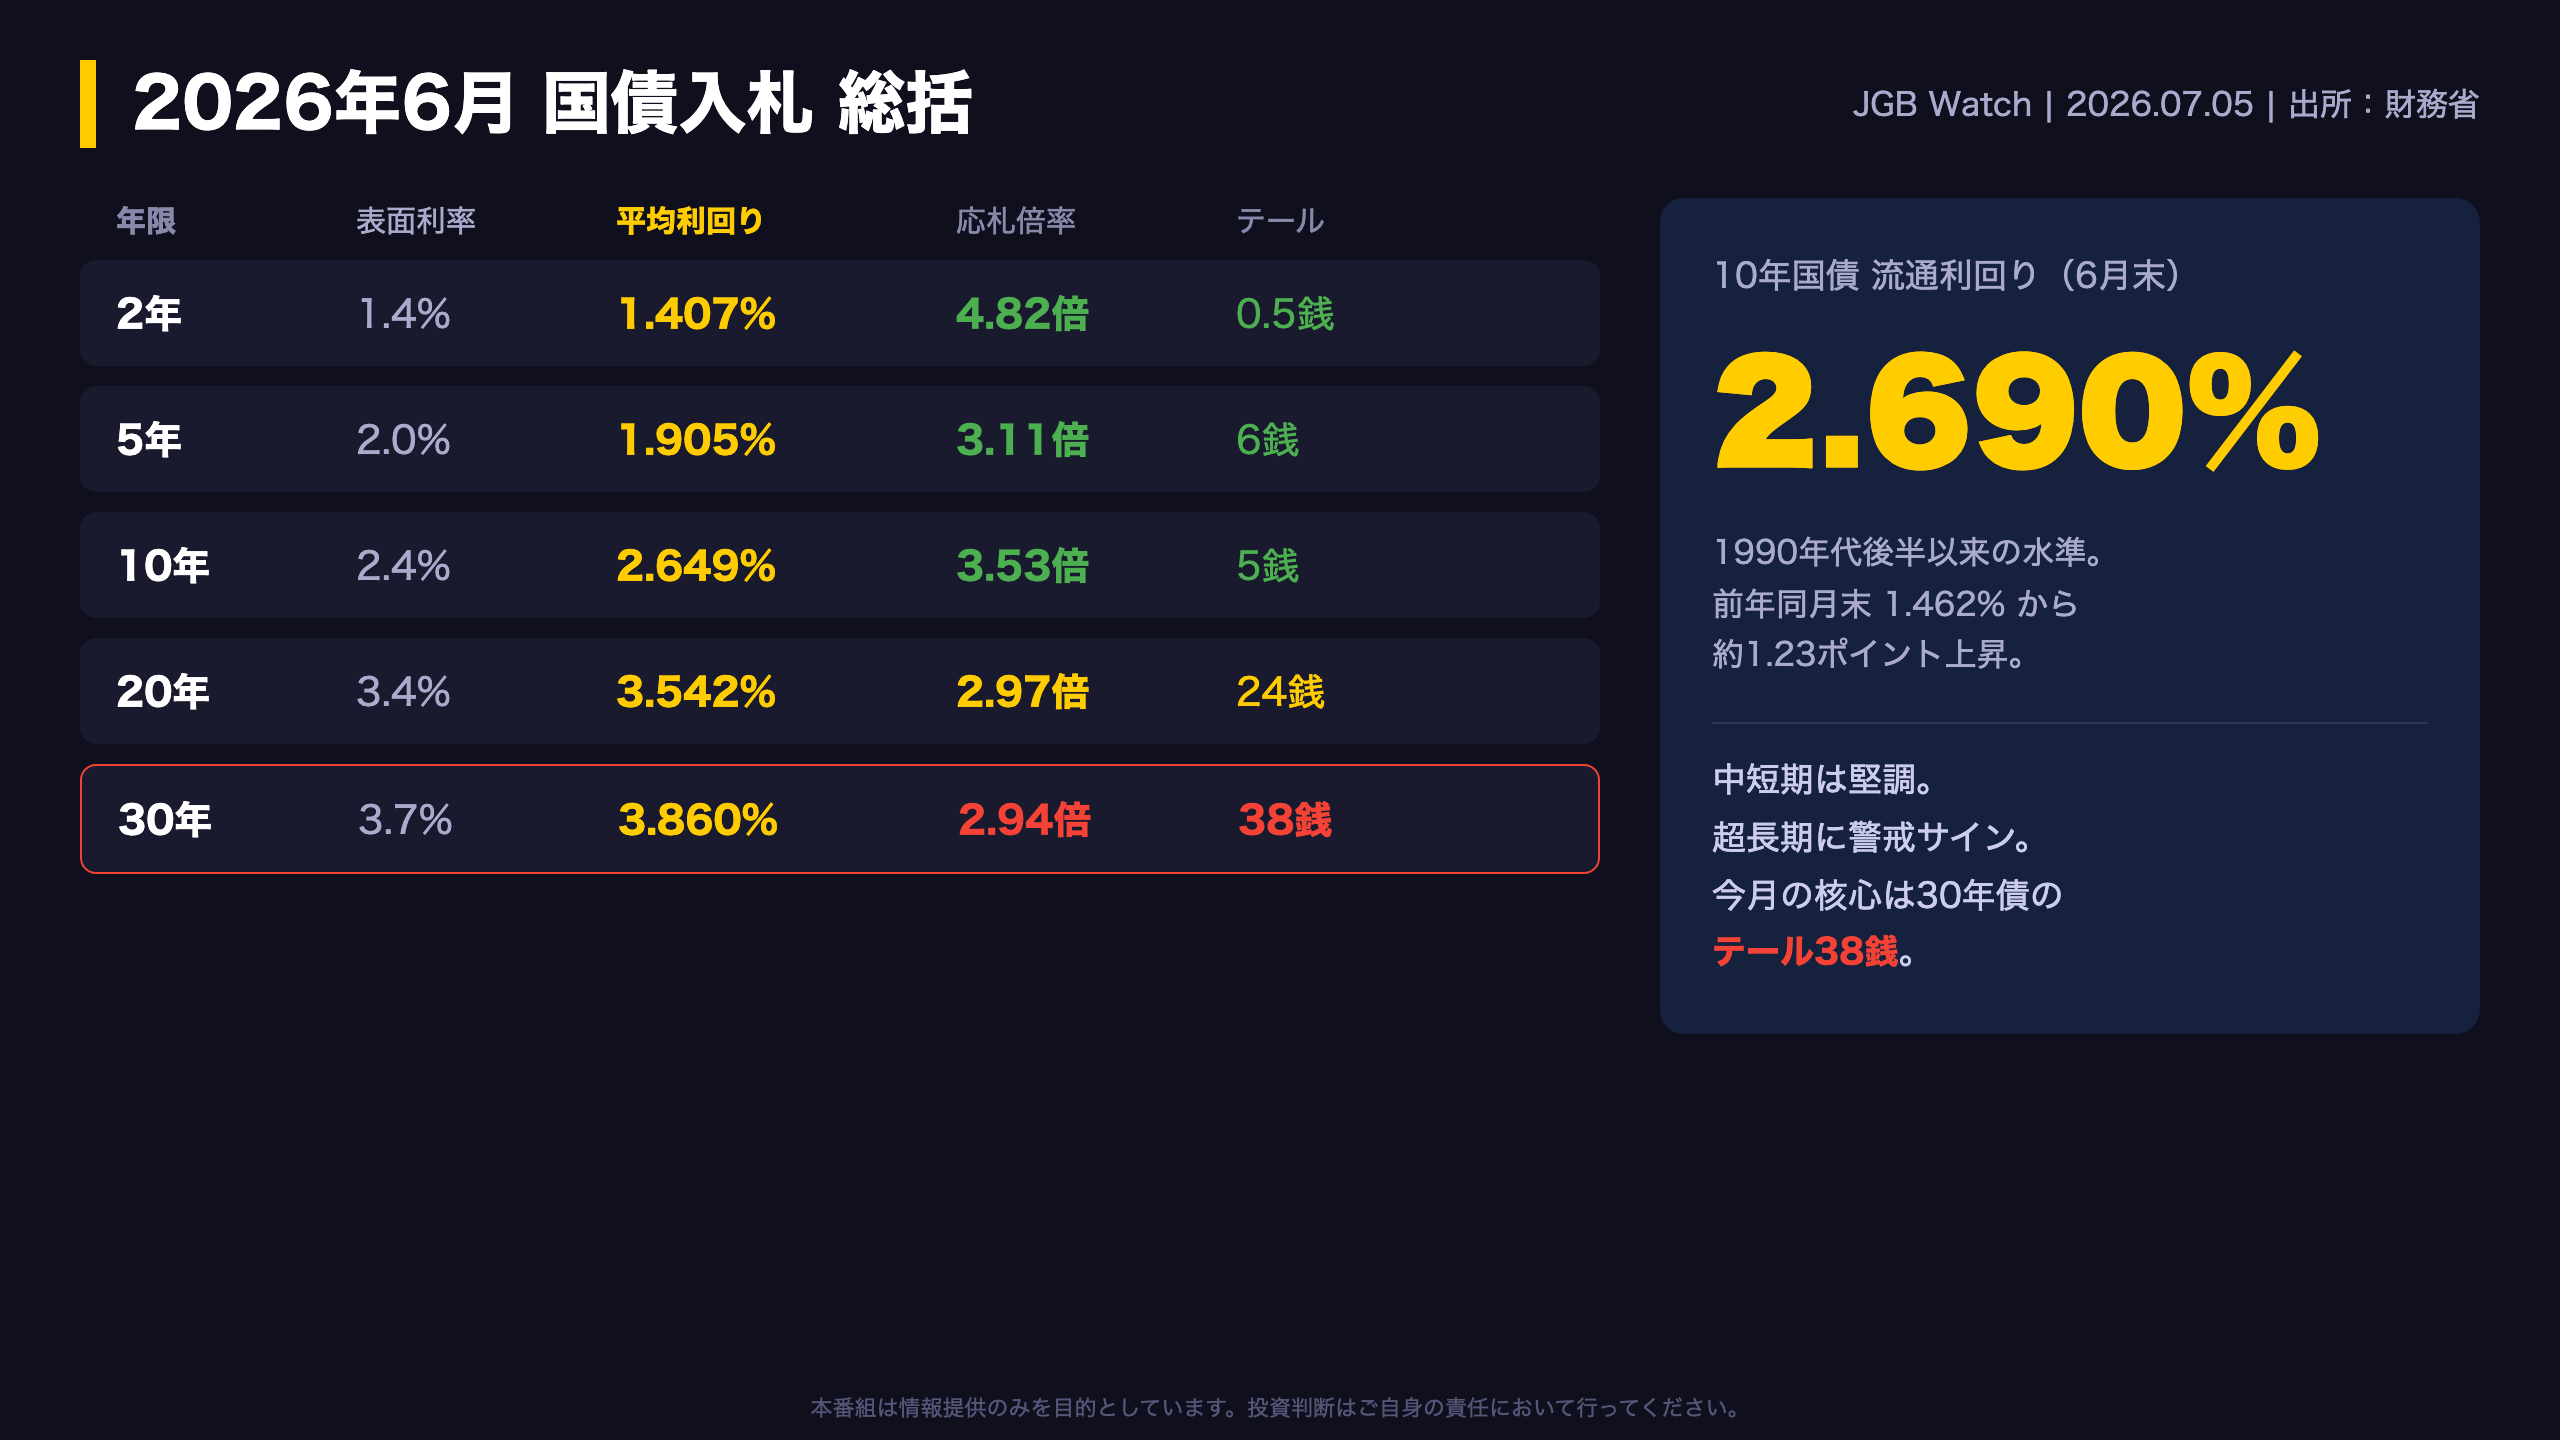
Japan’s MOF ran five coupon auctions in June 2026, and lining up bid-to-cover ratios and tails reveals a sharp split by maturity. The 2-year (1.4% coupon) drew a 4.82x cover with a razor-thin 0.5-sen tail. The 5-year and 10-year covered 3.11x and 3.53x with tails of 6 and 5 sen respectively, both healthy. The long end told a different story: the 20-year covered just 2.97x with a 24-sen tail, and the 30-year, despite a record 3.7% coupon, covered 2.94x with a 38-sen tail, the widest of the month by far.
For context, JGB auctions are dominated by Primary Dealers (Special Participants), and a wide tail signals that dealers could not converge on fair value, usually because end-investor demand from life insurers and pension funds is uncertain. Meanwhile T-bill auctions priced 3-month paper around 0.92% and 1-year at 1.16%, implying markets expect further BOJ policy-rate normalization. The headline yields looked calm in June; the internals showed a market fracturing along the curve.
イールドカーブ:上昇の重心は長期側へ、最先端は逆転
Reading the curve’s new shape
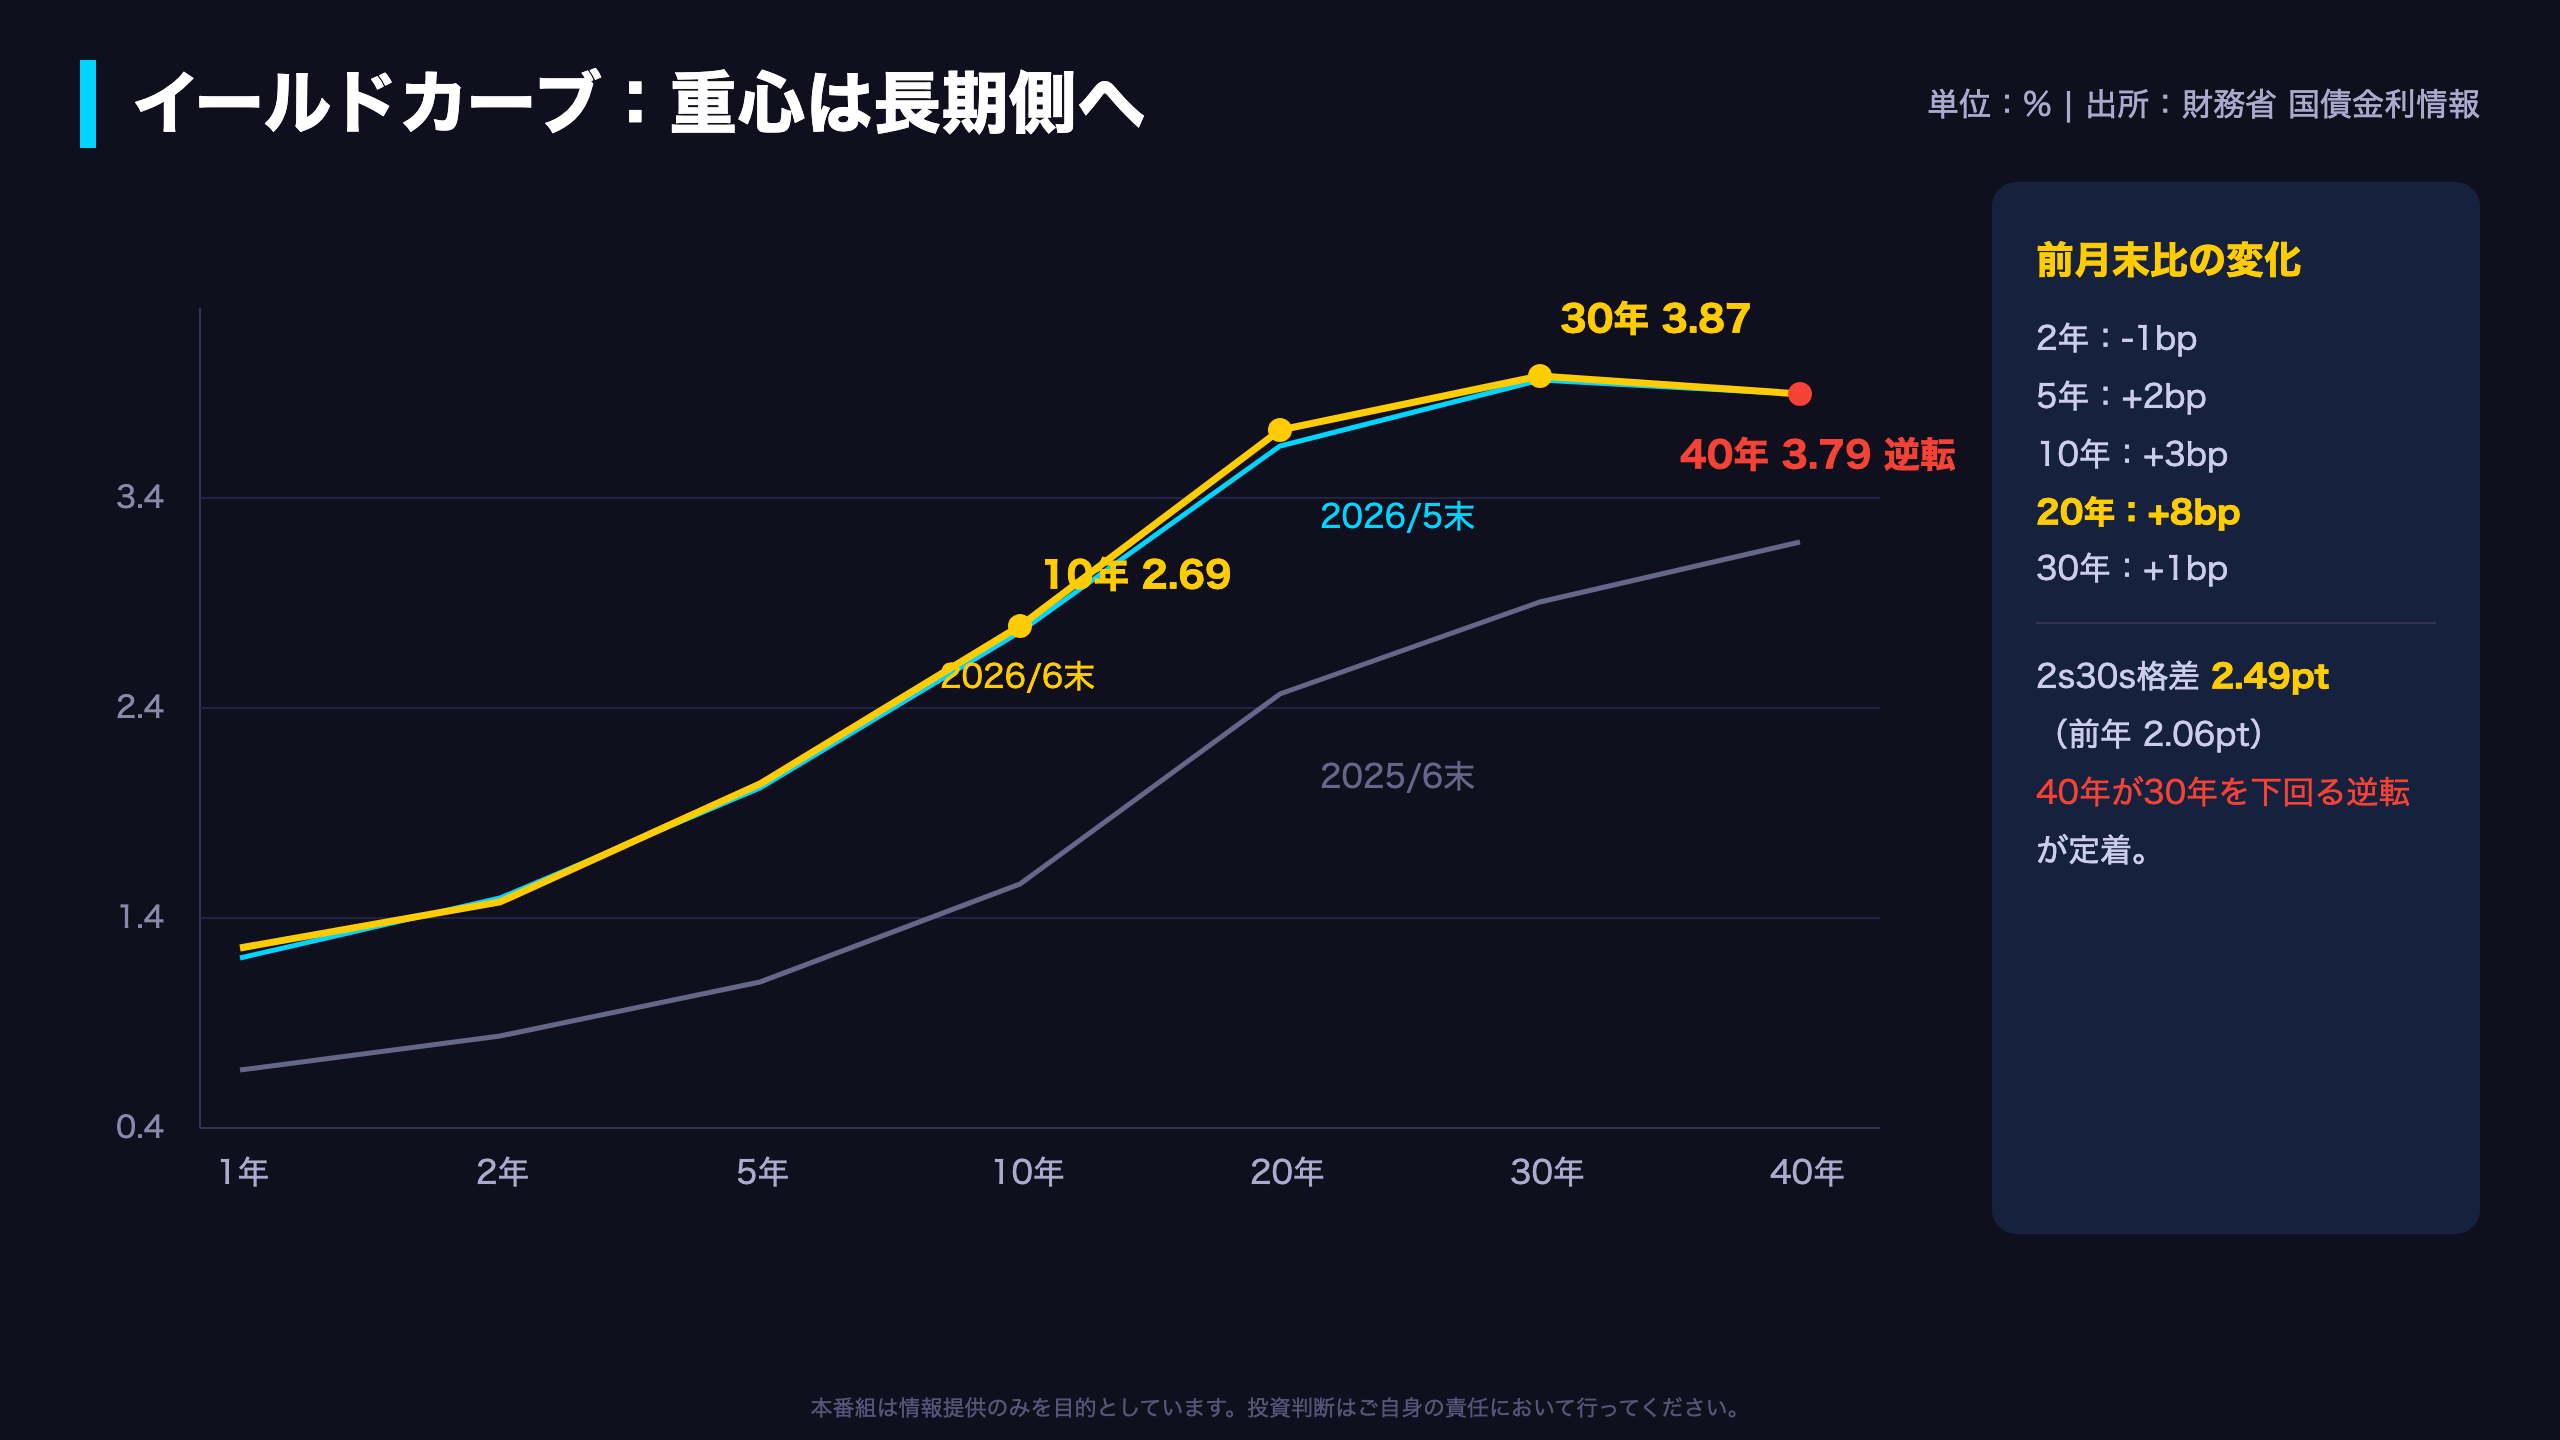
Month-over-month changes by tenor: 2yr minus 1bp, 5yr plus 2bp, 10yr plus 3bp, 20yr plus 8bp, 30yr plus 1bp. June’s move was led by the 20-year sector. The 2s30s spread now stands at 249 basis points, up from 206 a year earlier, extending a persistent steepening trend that began with the BOJ’s exit from yield curve control.
The most striking structural feature sits at the very long end: the curve peaks at the 25-year (3.883%), then inverts through the 30-year (3.873%) and 40-year (3.792%). A 40-year yield below the 30-year is unusual and likely reflects three forces: speculation that the MOF will trim super-long issuance, the narrower investor base for 40-year paper where life-insurer ALM demand is thinner, and poor liquidity at the tip.
For historical perspective, a 2.69% 10-year yield is the highest in our entire daily dataset, which extends back to 2019, and by broader market history is a level last seen in the late 1990s. In 2021 the same yield sat near 0.03%. Japan has traversed roughly 270 basis points in five years, a regime change by any definition.
10年債入札:健全な需給と、個人マネーへの波及
The 10-year: benchmark stability holds
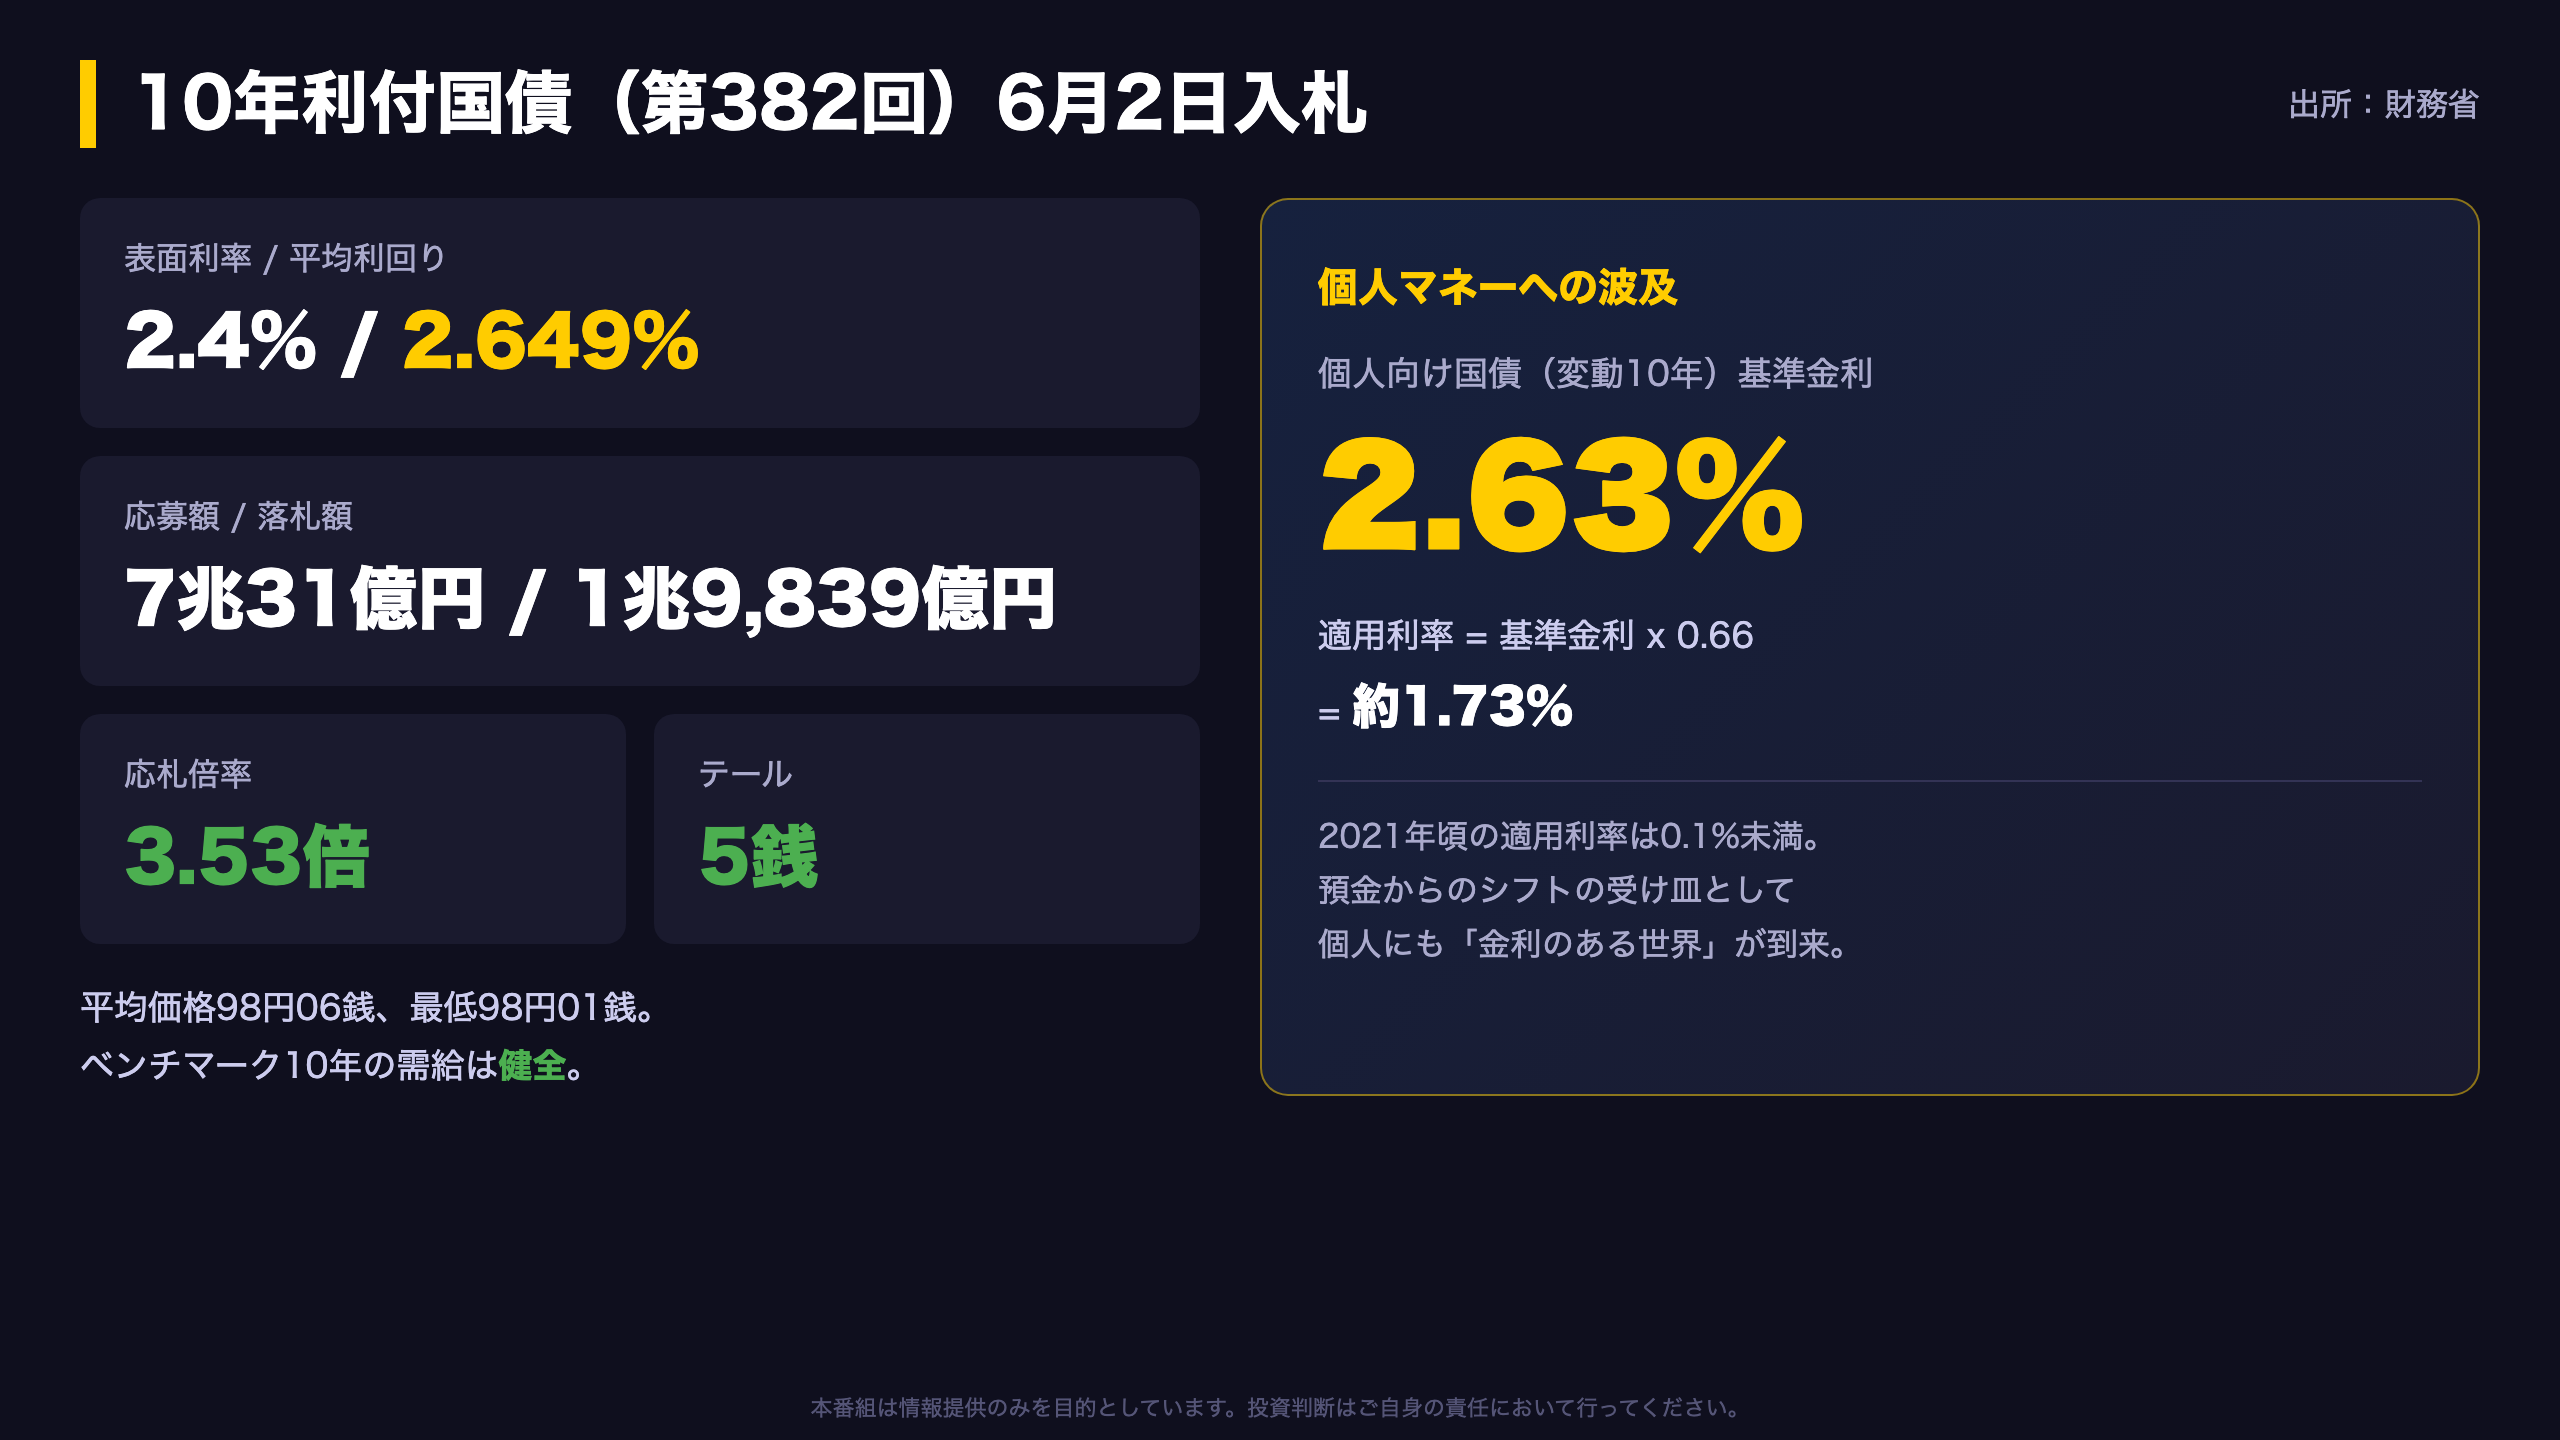
Issue 382 of the 10-year JGB stopped at an average yield of 2.649% with a high yield of 2.656%. A 5-sen tail and a 3.53x cover represent a smooth takedown given how far yields have repriced. The Primary Dealer non-competitive tranche absorbed an additional 615 billion yen, confirming the dealer underwriting framework is functioning normally at the benchmark tenor.
The household angle deserves attention from overseas observers. Japan’s retail floating-rate 10-year JGB, sold through banks and brokers to individuals, resets its coupon off this auction: the reference compound yield came in at 2.63%, implying an applied rate near 1.73% after the statutory 0.66 multiplier. As recently as 2021 that applied rate was below 0.1%. This is a structural pull factor drawing Japanese deposits, still over 1,000 trillion yen, toward government bonds, and it partially offsets waning demand elsewhere on the curve.
The flip side: issuance at a price of 98 yen against par underscores that legacy low-coupon bond portfolios remain underwater. Rising rates favor new buyers over existing holders, and that asymmetry is now fully visible at the 10-year point.
核心:30年債テール38銭が示す財政プレミアム
How to read a 38-sen tail
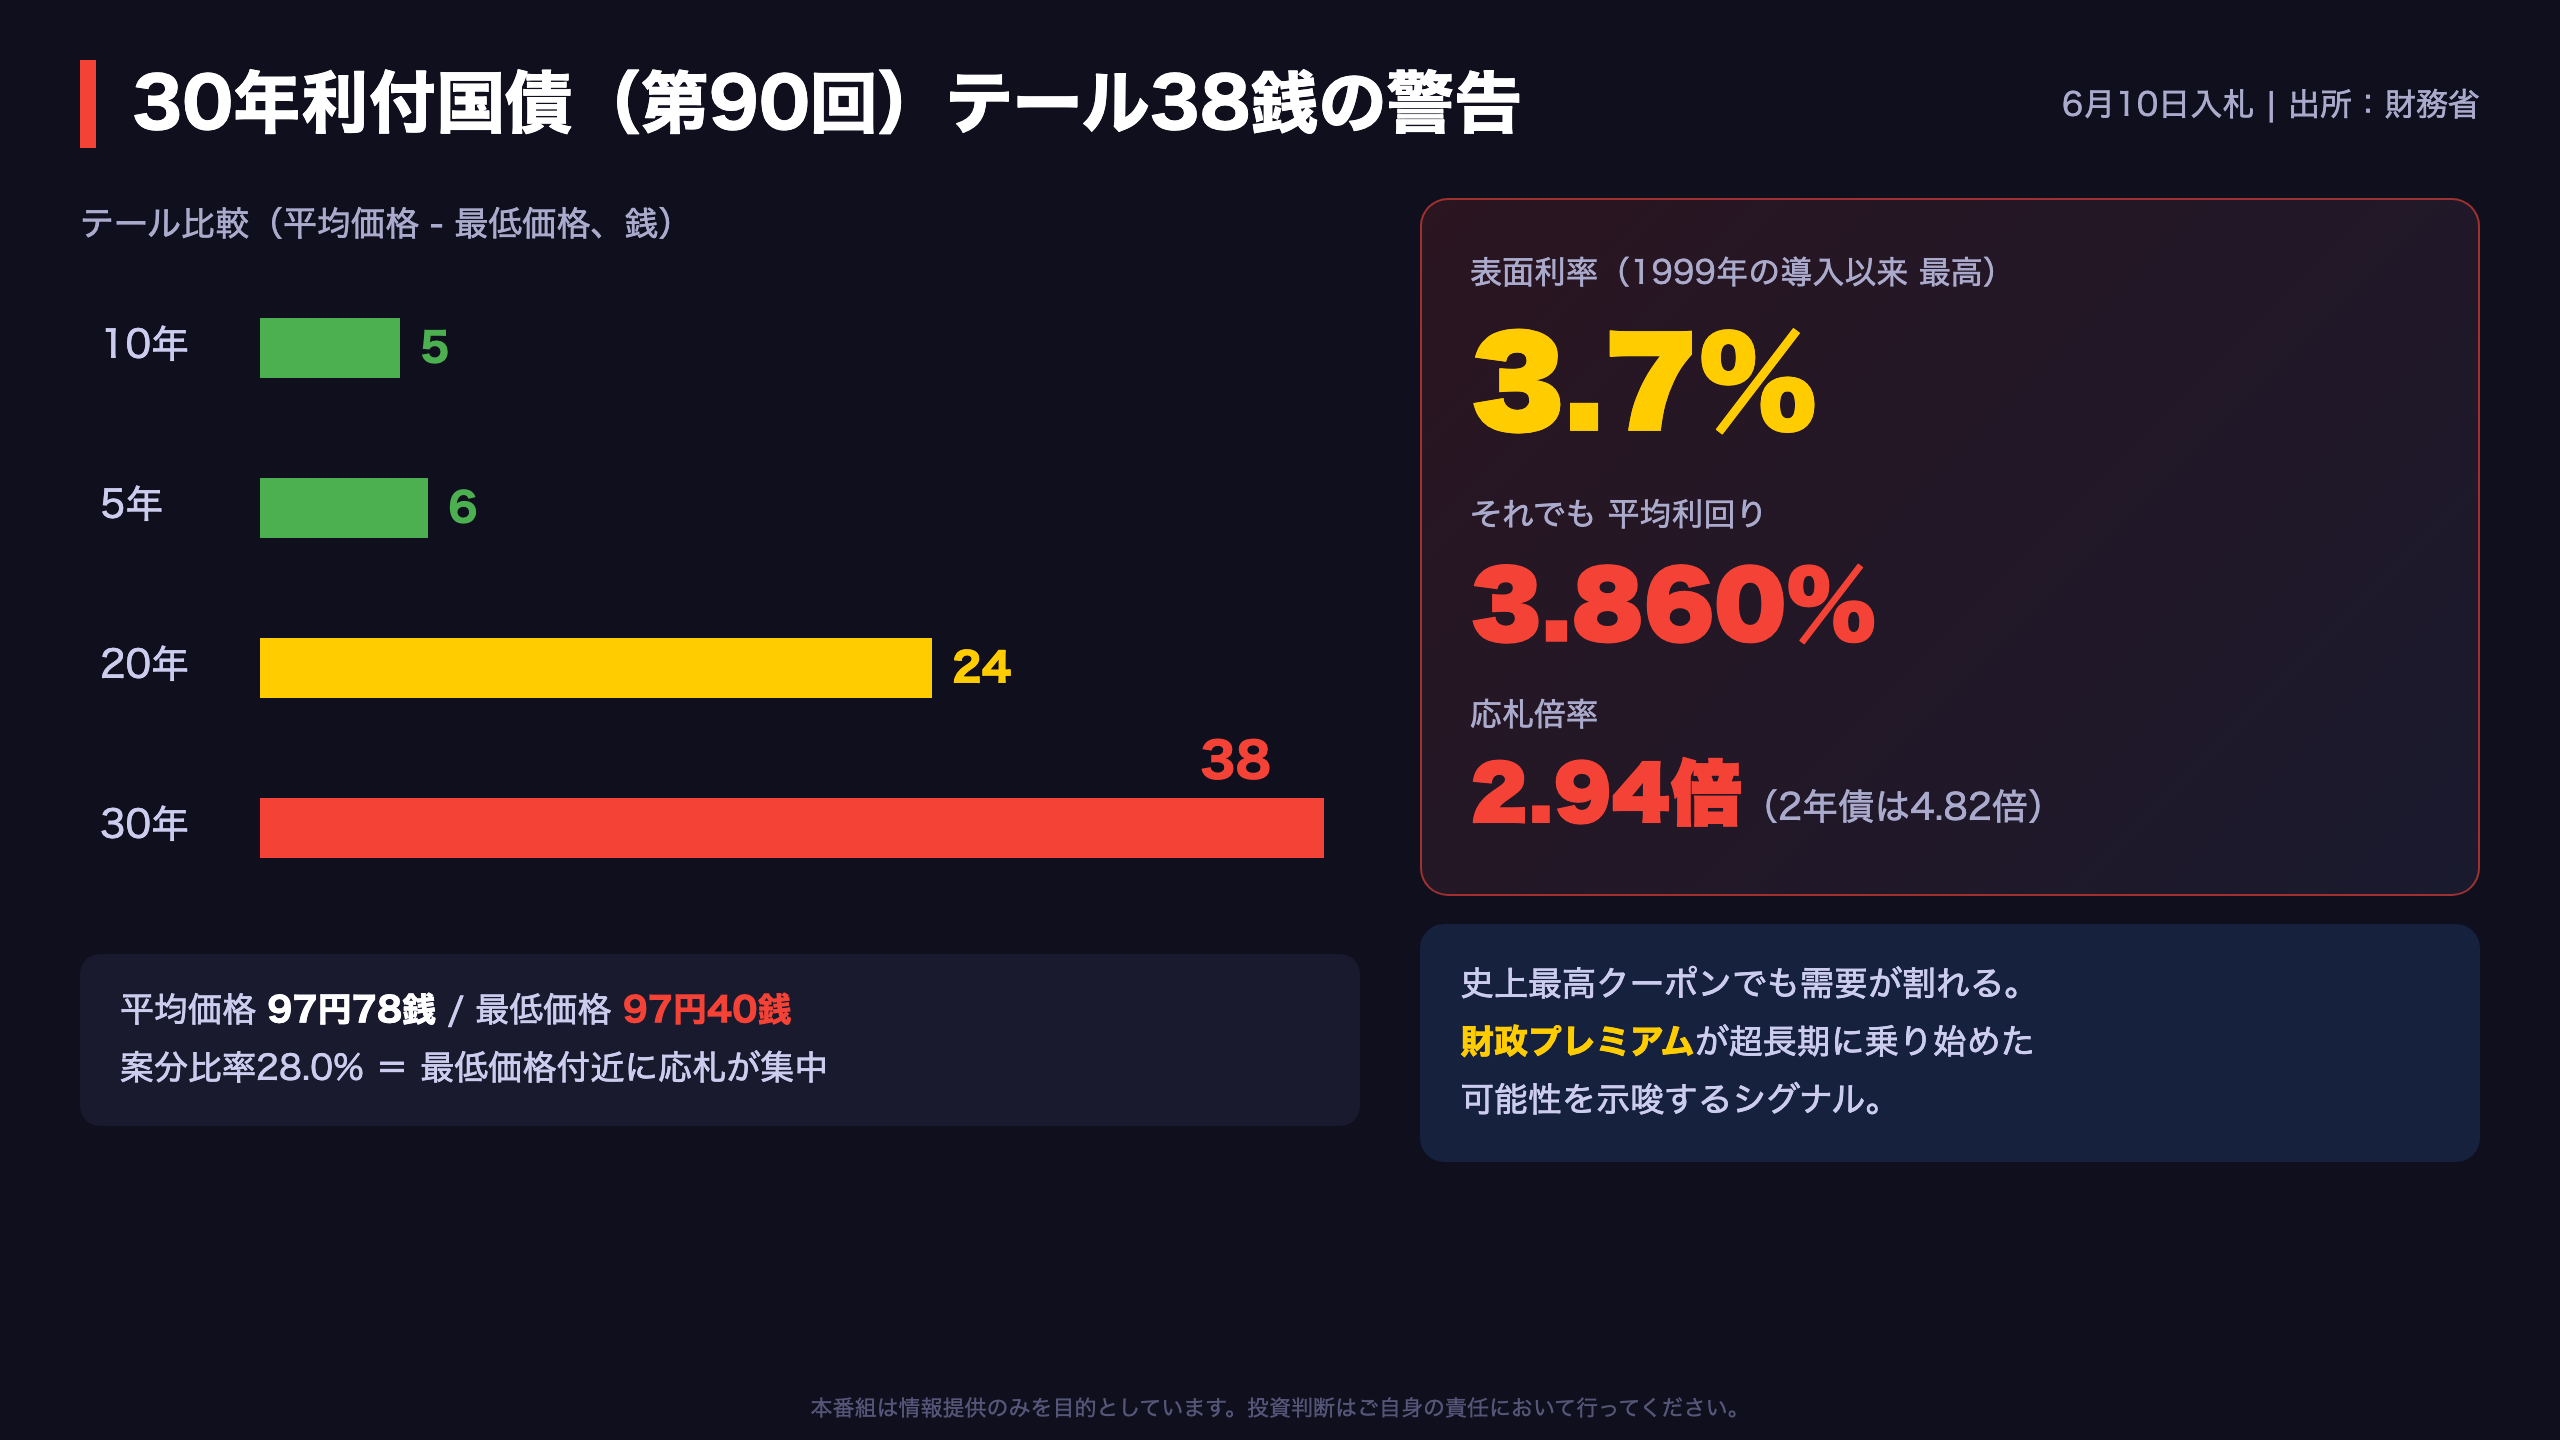
The tail, the gap between the average and lowest accepted prices, measures how dispersed dealers’ price views were. A wide tail means Primary Dealers hedged their bids lower because they lacked confidence in end-investor takeout. Issue 90’s 38-sen tail was roughly eight times the 10-year’s 5 sen the same month, and the low allotment ratio of 28.0% at the stop shows bids piled up at defensive levels. The auction stopped at an average of 3.860% with a high of 3.888%, putting 4% within sight.
The crucial fact is that this happened despite a 3.7% coupon, the highest since 30-year JGBs debuted in 1999. Structurally, Japanese life insurers largely completed their regulatory duration-matching purchases years ago, and the BOJ continues to taper its JGB buying. When record coupons cannot close the demand gap, the residual has to be priced, and that residual looks like a fiscal premium: extra yield demanded for absorbing the long-dated debt of a government running persistent deficits. We avoid definitive claims on one data point; the July 7 thirty-year auction is the natural test of whether this premium is transitory or structural. Watch the tail first, the cover second.
需給の二極化:資金はカーブの手前側に集まる
The dividing line in bid-to-cover ratios
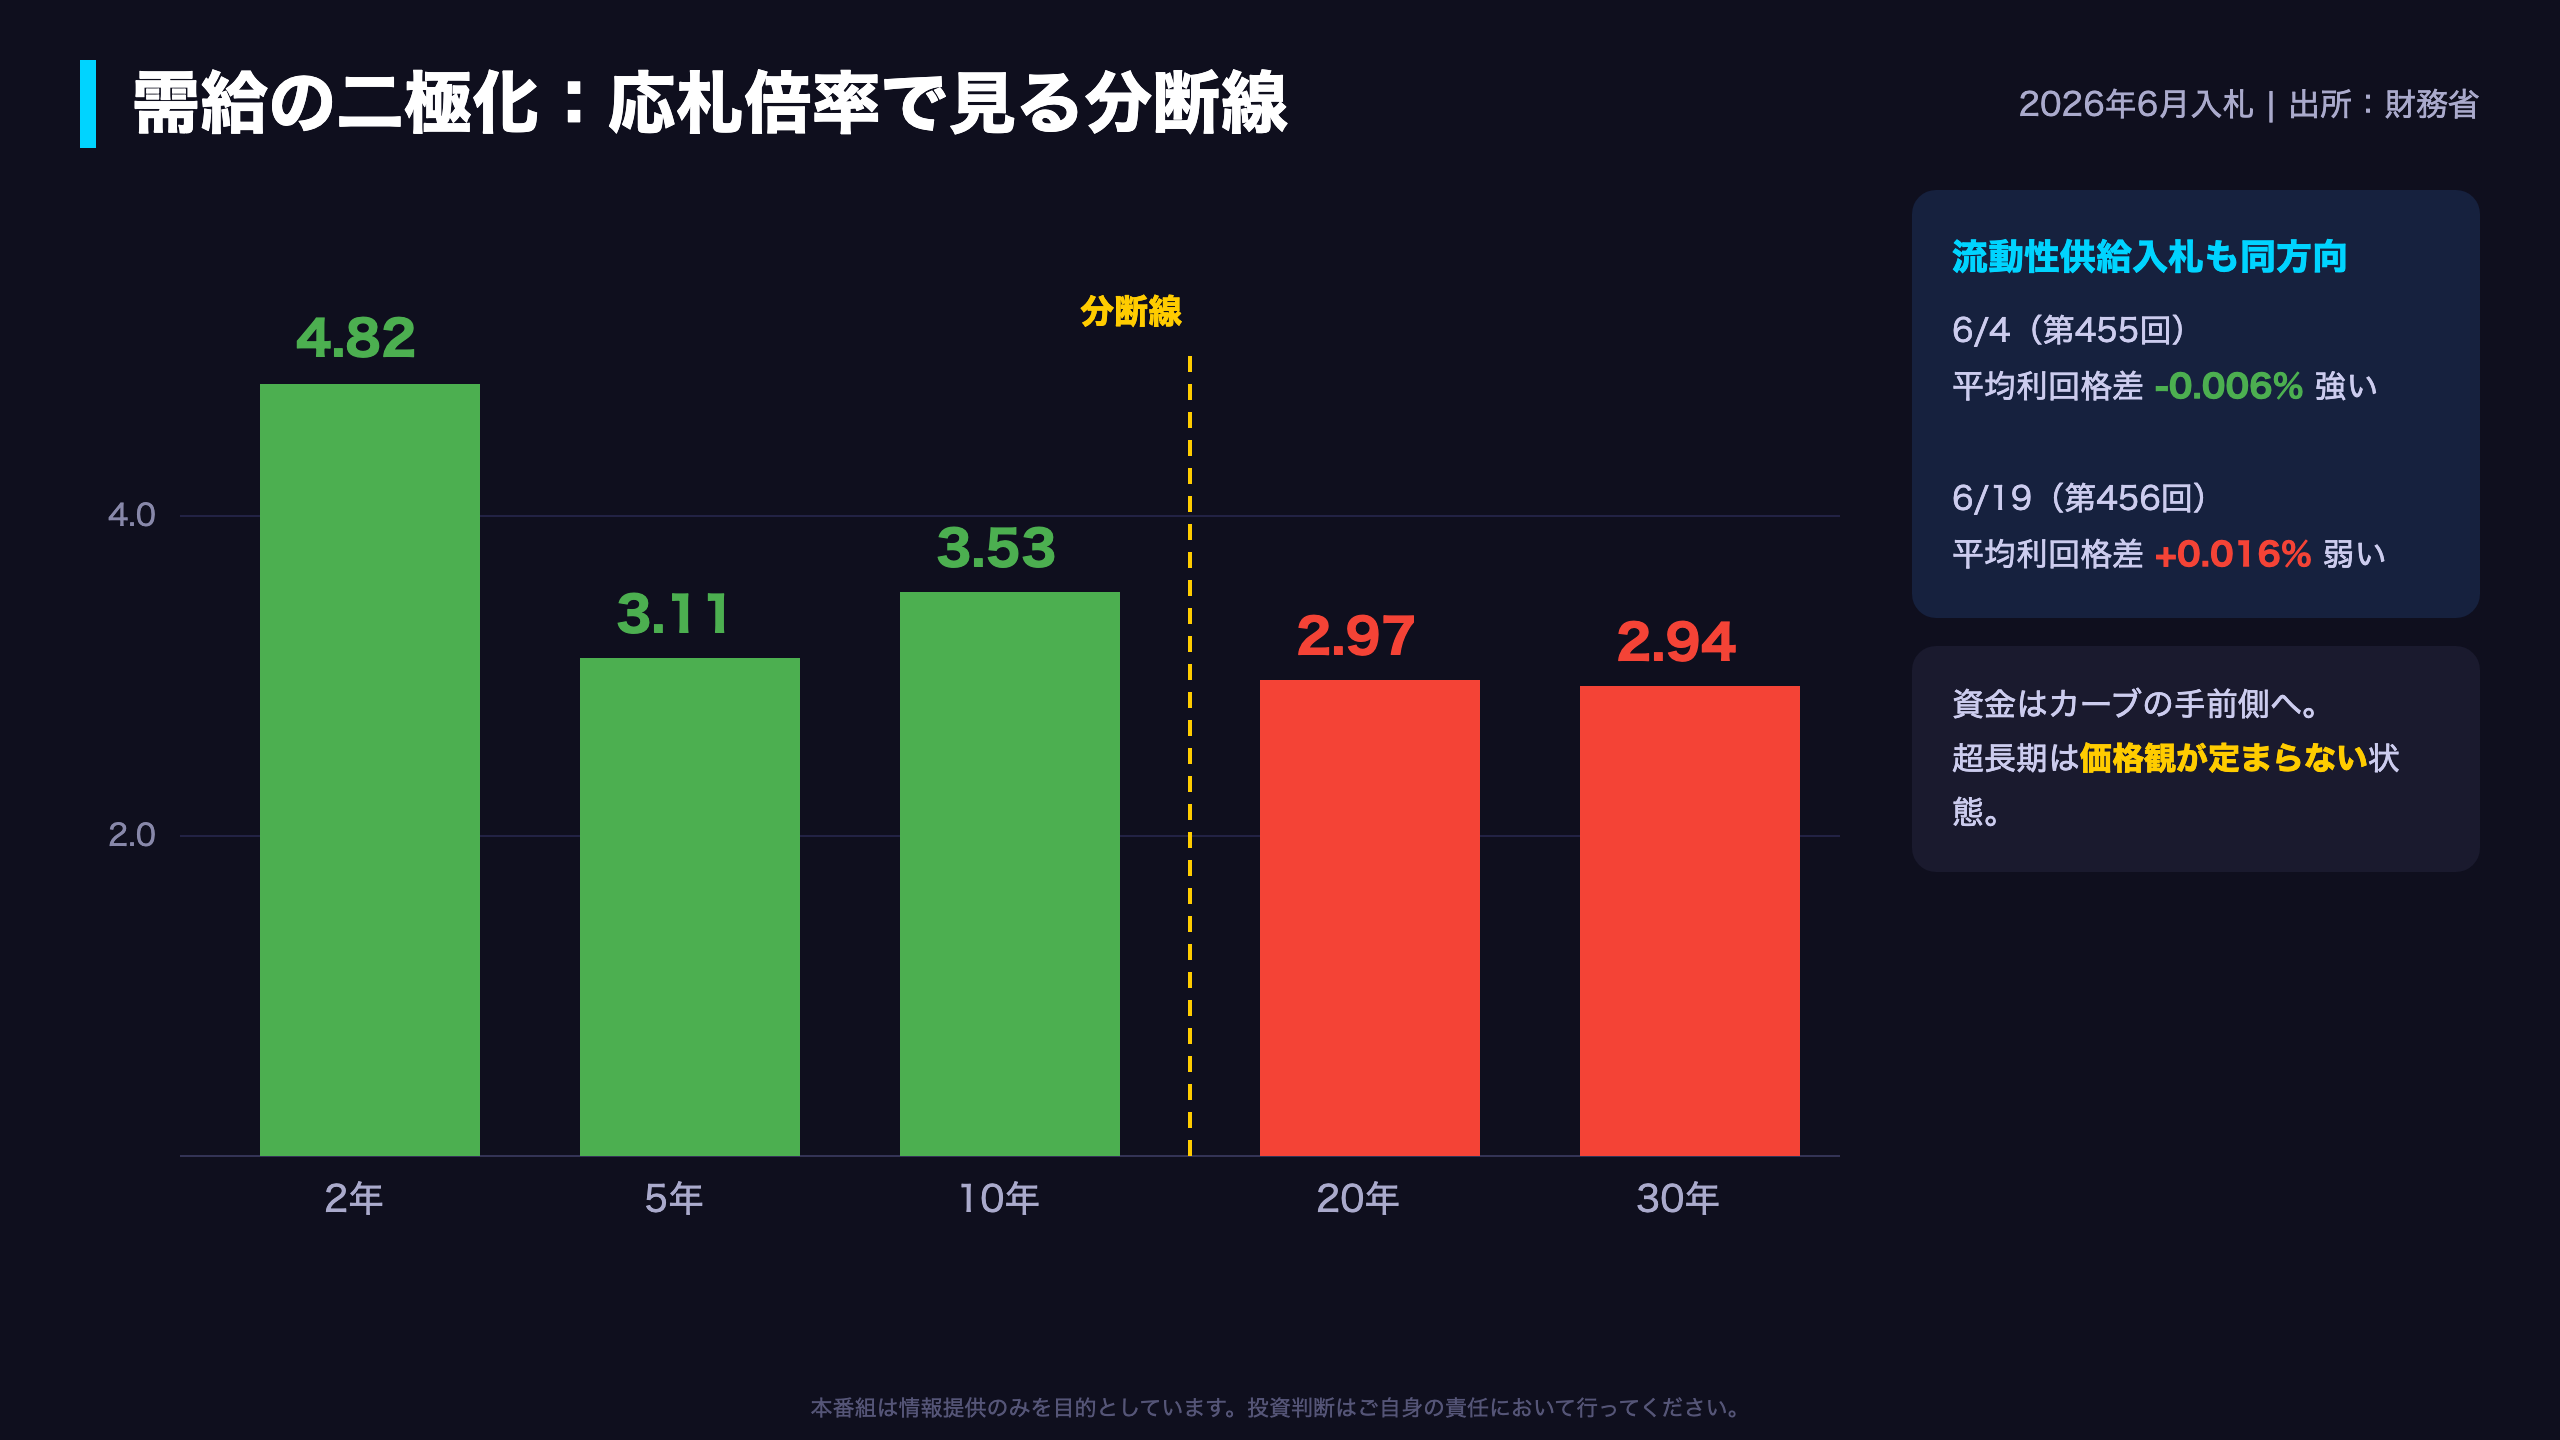
Bid-to-cover is the simplest gauge of auction demand: how many yen of bids arrived per yen of issuance. June’s line-up draws a clear fault line between the 10-year and 20-year sectors. Front end: 2yr 4.82x, 5yr 3.11x, 10yr 3.53x. Super-long: 20yr 2.97x, 30yr 2.94x.
The 2-year’s razor-thin 0.5-sen tail is equally telling. Short-tenor pricing reduces to a view on the BOJ’s policy path, so bidders can commit with confidence; T-bill yields near 0.92% for three months and 1.16% for one year show that path is well mapped. The super-long sector, by contrast, is exposed to fiscal policy, issuance-plan revisions, and the BOJ’s ongoing balance-sheet runoff, so fair value itself is contested.
Liquidity-enhancement auctions, MOF reopenings of off-the-run issues, confirm the split. The June 4 operation (issue 455) priced 0.6bp through market levels on average, while the June 19 operation (issue 456) tailed to +1.6bp average and +2.0bp at the stop with a 98.7% allotment. Same auction format, opposite outcomes, purely a function of which curve segment was on offer. The demand fracture is consistent across every instrument the MOF sold in June.
金利上昇でも円安162円:同じ一枚の絵として読む
A litmus test for the quality of rising yields
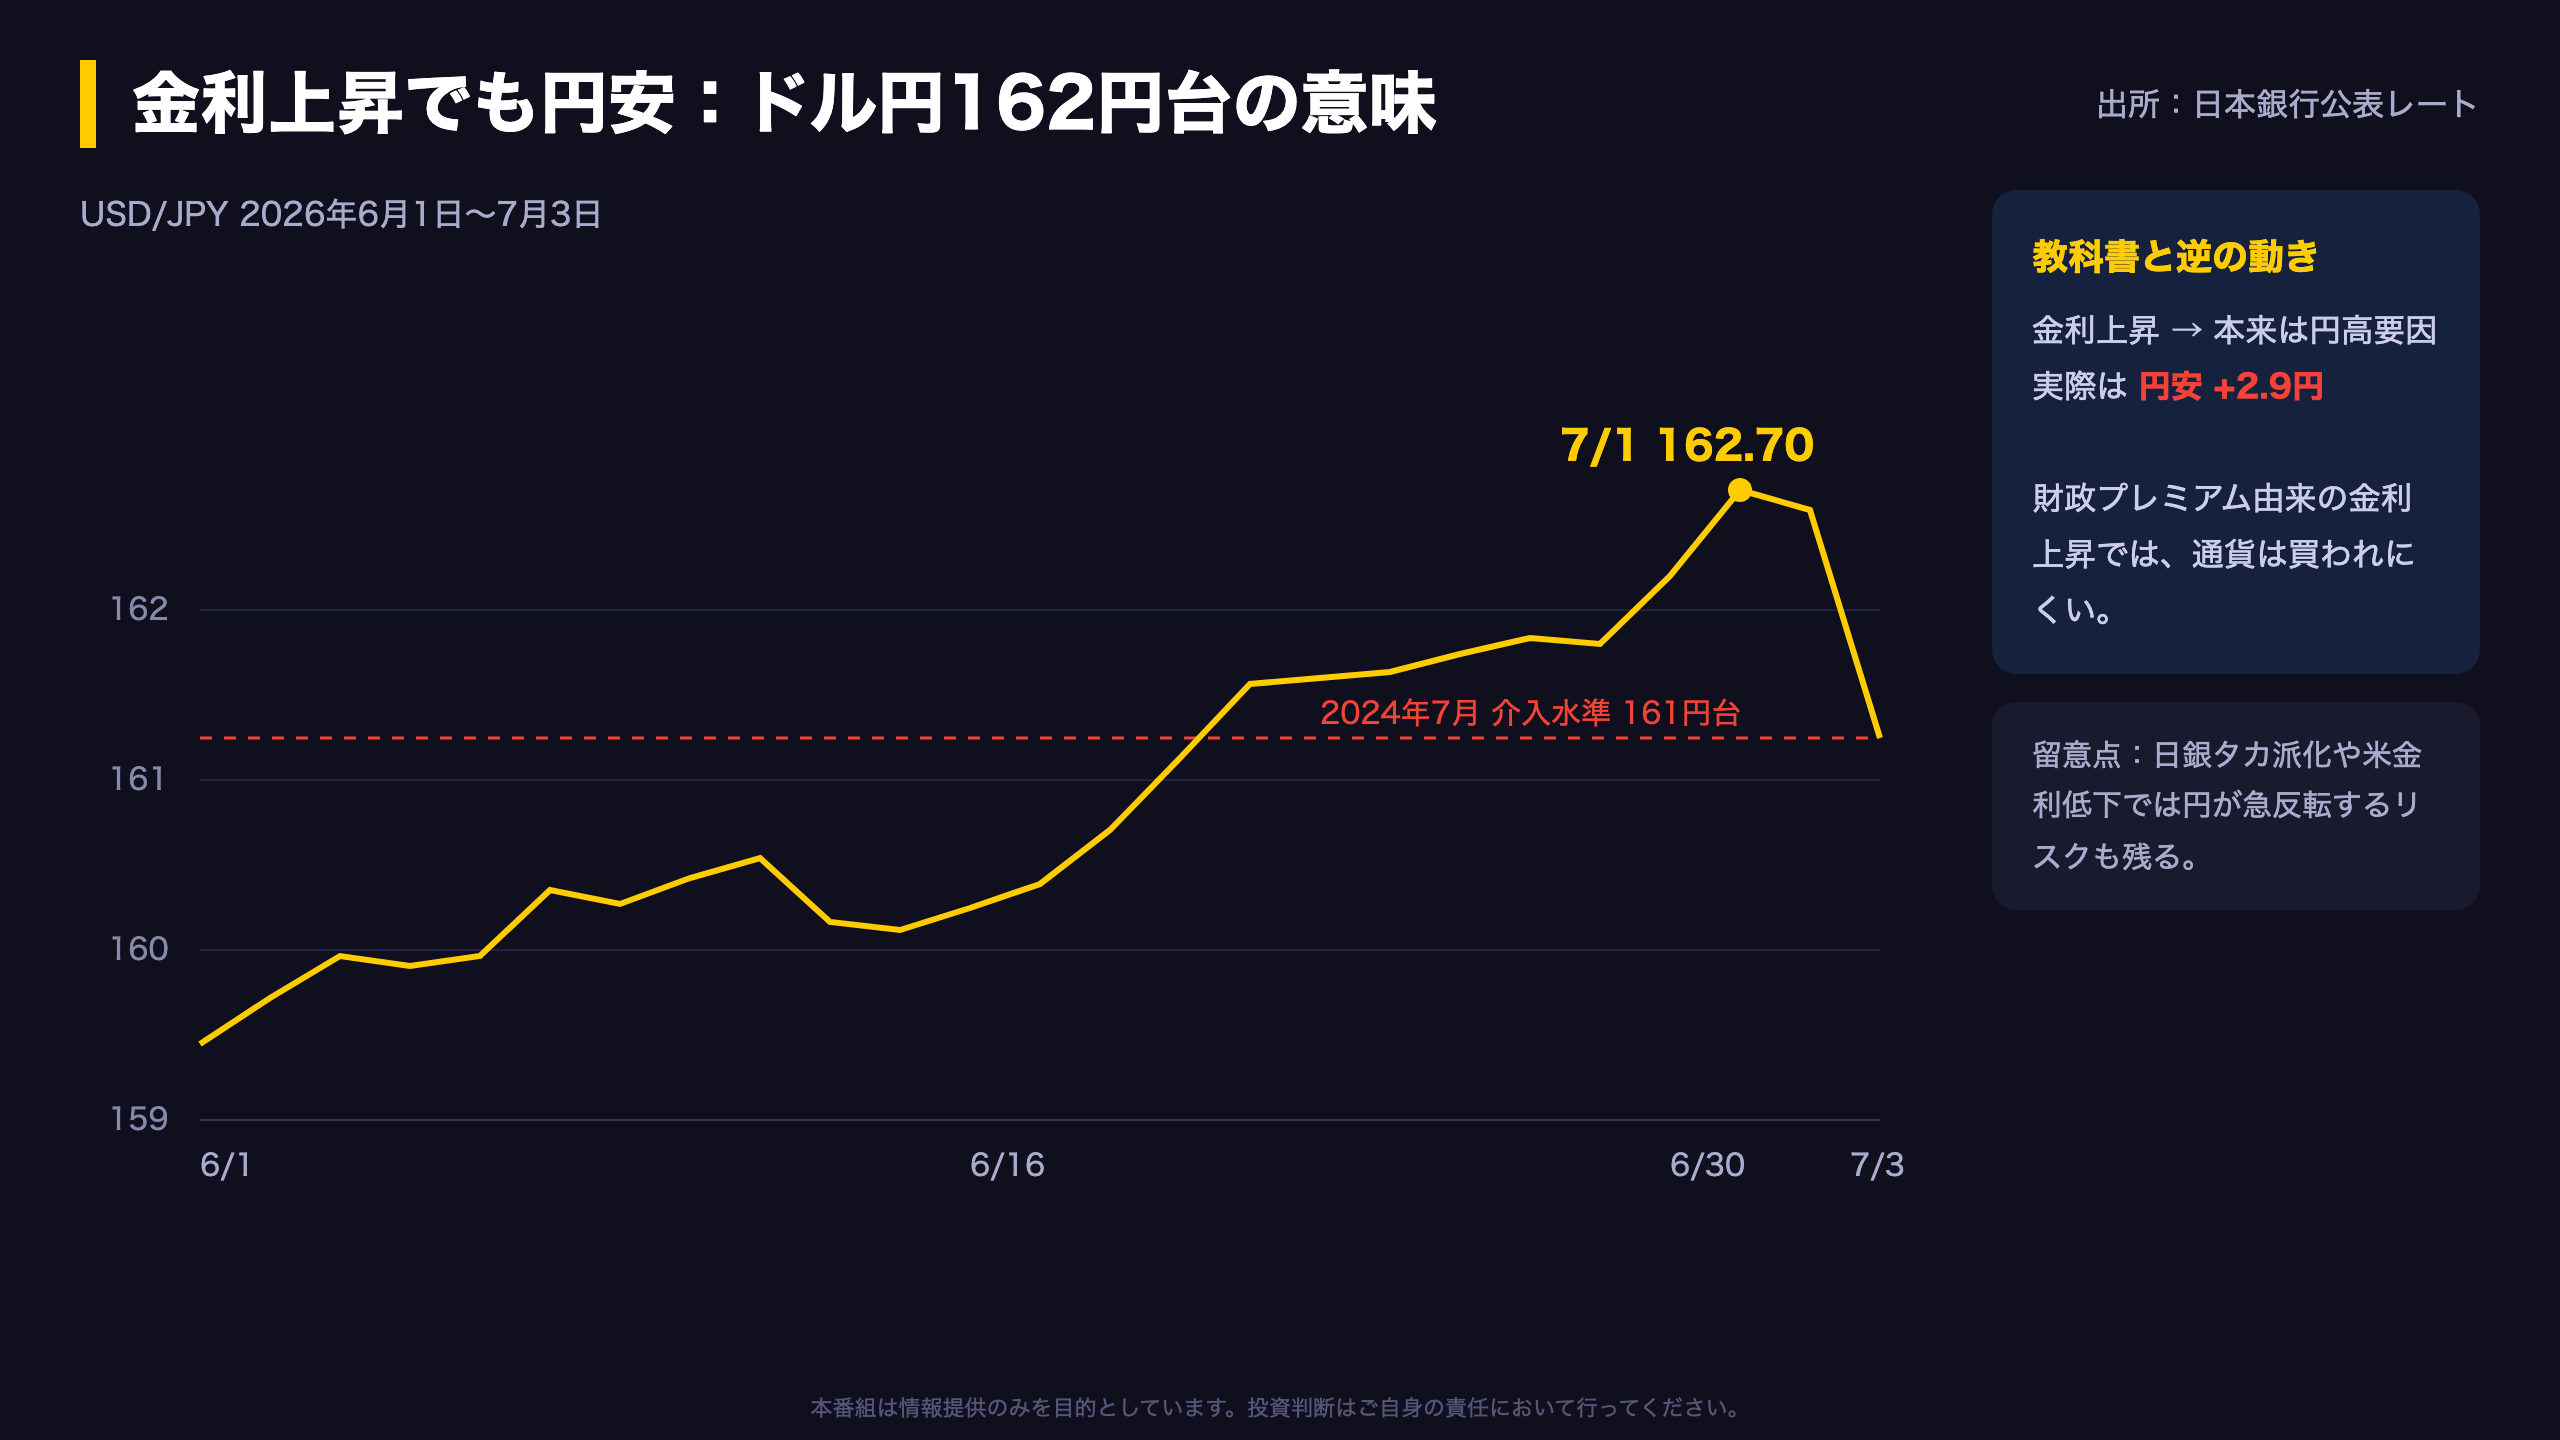
The currency response is the cleanest way to judge why yields are rising. Growth- or policy-driven yield increases tend to attract currency inflows; fiscally-driven increases repel them. June’s Japan traded like the latter. On June 1, dollar-yen stood at 159.45 with the 10-year at 2.682%; by June 30 the pair had climbed to 162.20 with the 10-year at 2.690%, and it touched 162.70 on July 1, the highest in our dataset and above the 161 zone where the MOF conducted FX intervention in July 2024. Euro-yen held around 185, so yen weakness was broad-based, not a dollar story.
A 1.7% yen decline in a month of stable-to-higher JGB yields is the signature of a fiscal premium: investors demand more yield and a cheaper currency simultaneously to hold yen-denominated government risk. That said, symmetry deserves emphasis. If US yields fall or the BOJ turns more hawkish, the textbook rate-differential channel can reassert itself quickly, and the yen has a history of violent reversals from crowded short positioning. Investors whose dollar-asset gains have been flattered by the weak yen should treat 162 as a level to manage risk around, not to extrapolate from.
あなたの資産への含意:4つのポジションを点検する
A position-by-position checklist
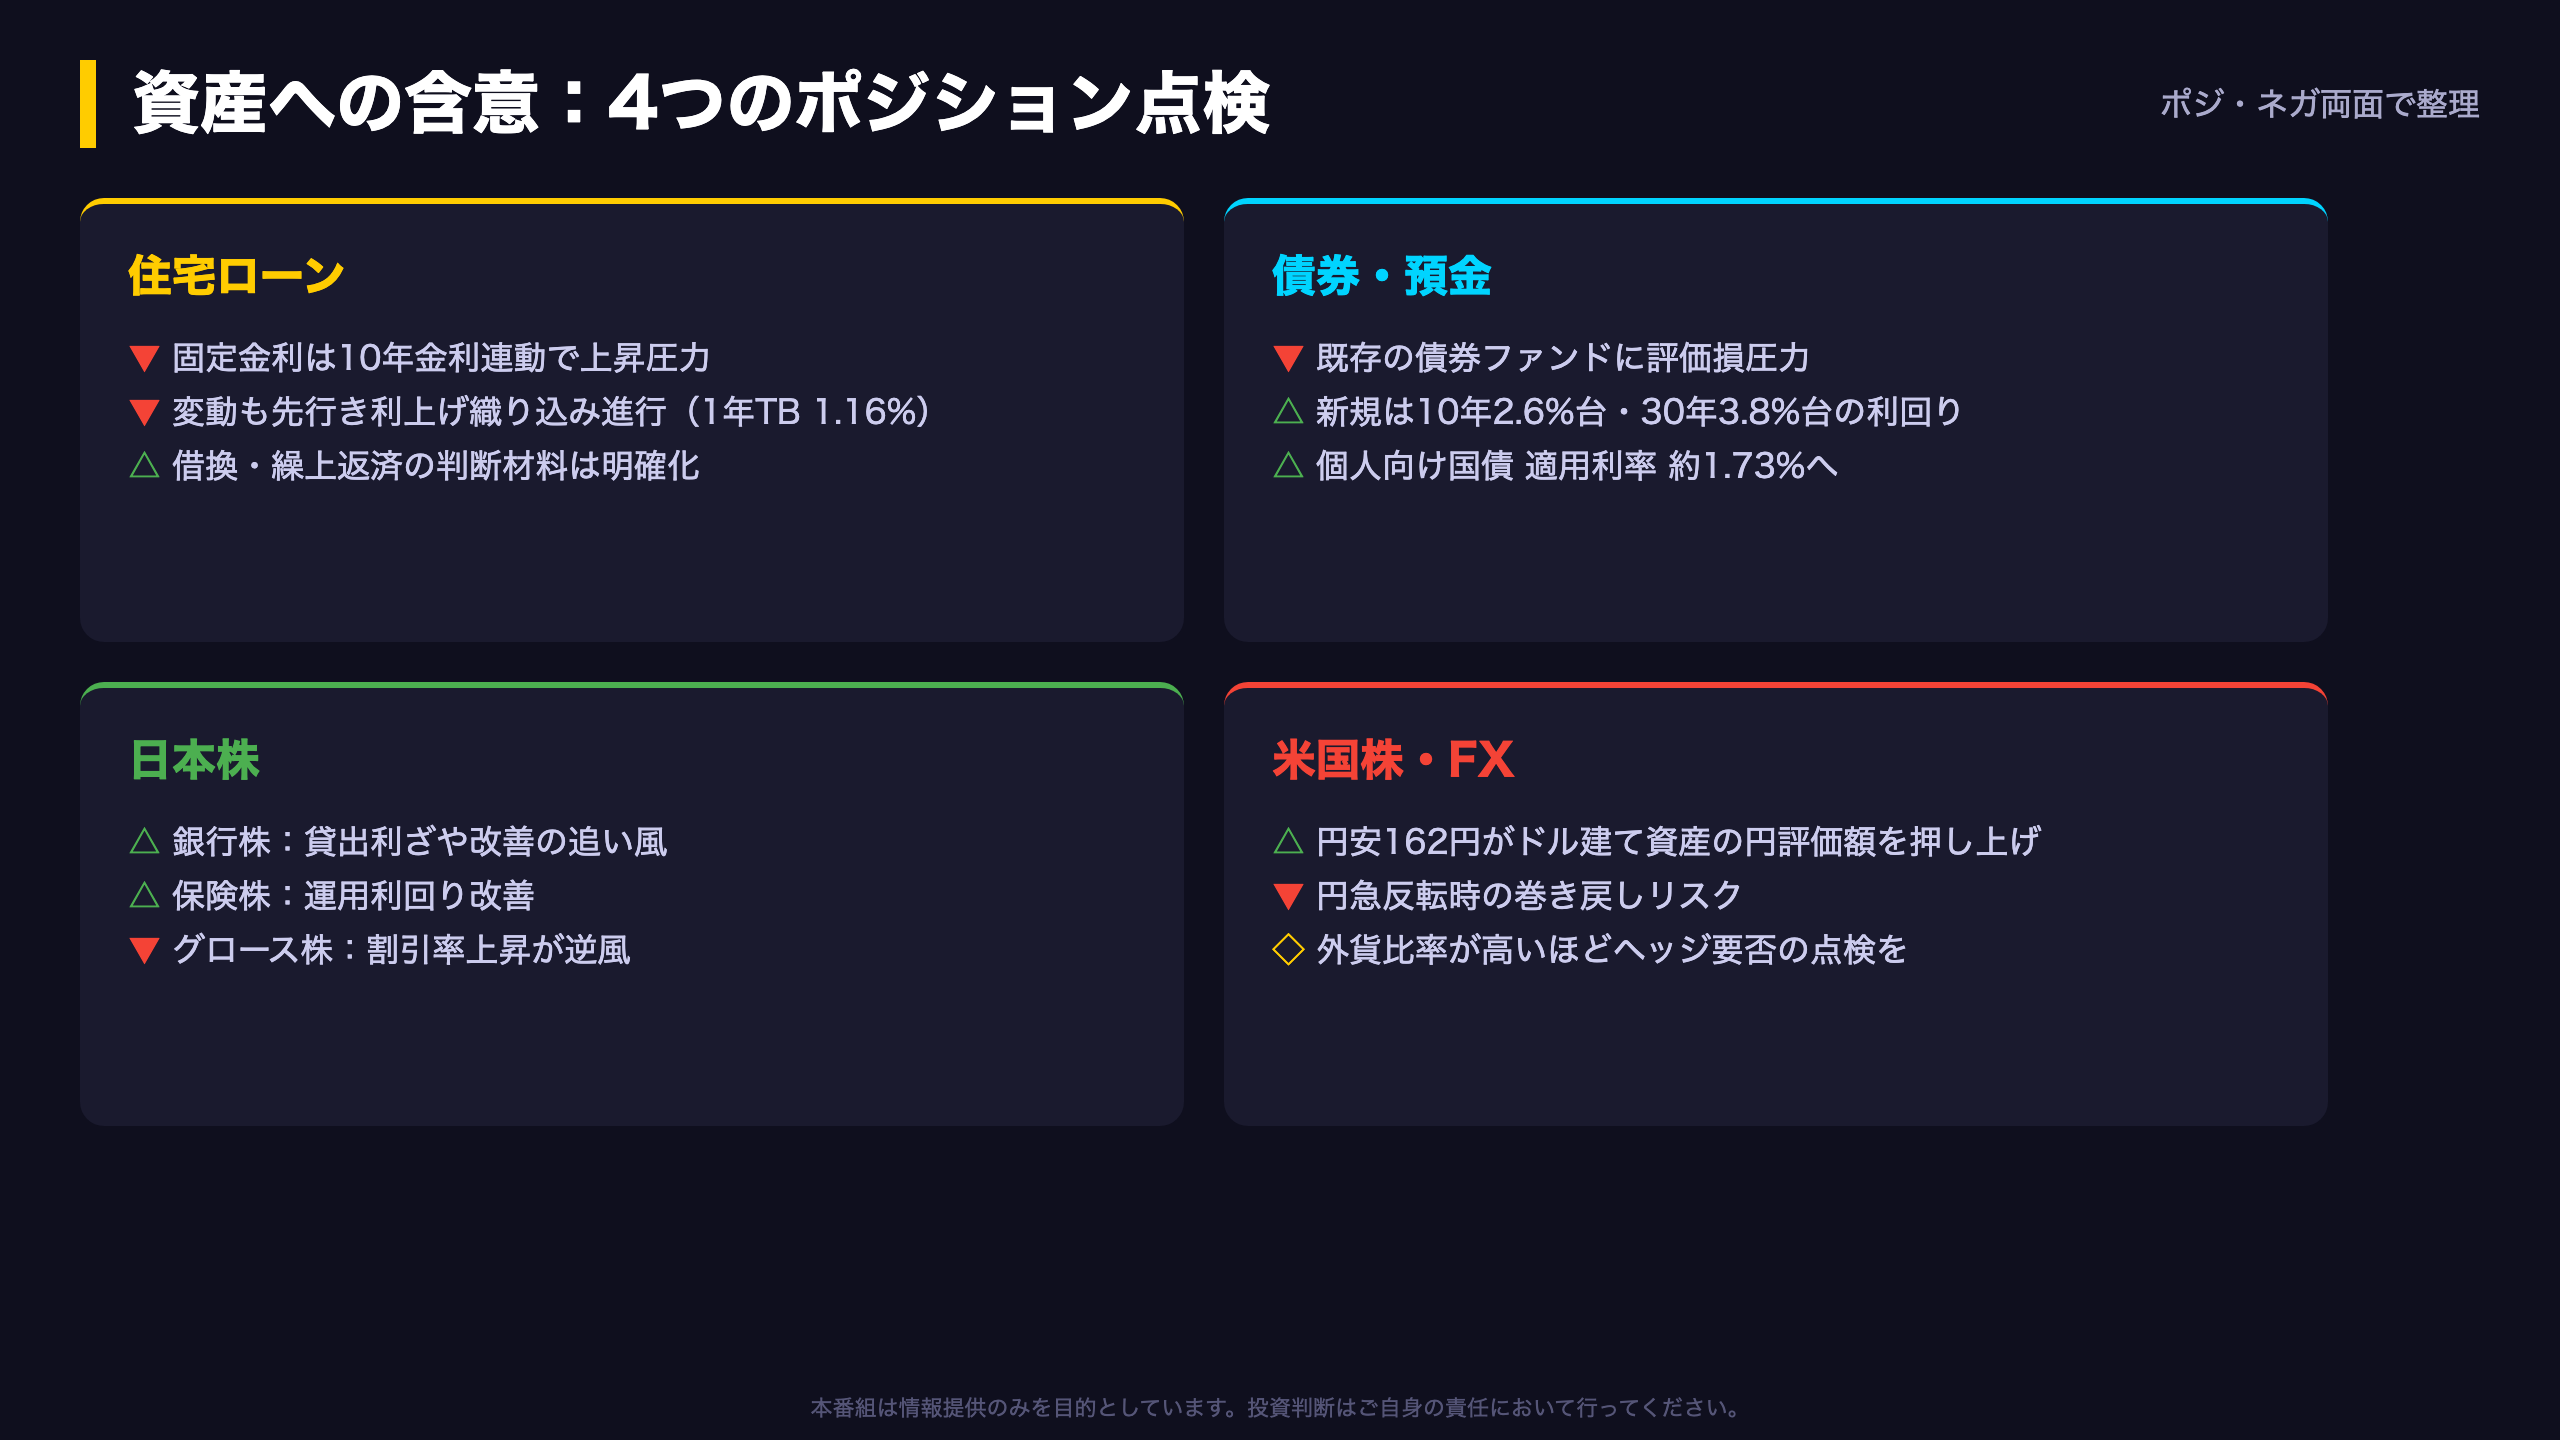
Mortgages: Japanese fixed mortgage rates key off the 10-year and beyond, so upward pressure persists. Floating rates follow the BOJ policy rate; with 1-year bills at 1.16% and 2-year JGBs at 1.4%, markets clearly price further normalization. Floating-rate borrowers with large balances should verify how their bank applies the 5-year and 125% payment-adjustment rules that delay, but do not eliminate, higher payments.
Bonds and deposits: Domestic bond funds stuffed with legacy low-coupon paper face continued NAV pressure. Conversely, new buyers get the best yen income in 25 years: 10-year near 2.65%, 30-year near 3.86%, retail floating JGBs at roughly 1.73% applied, and rising term-deposit rates.
Japanese equities: Wider lending margins favor banks; higher reinvestment yields favor insurers. High-multiple growth names face discount-rate headwinds.
US equities and FX: The yen at 162 flatters the yen value of dollar portfolios. But fiscal-premium-driven yen weakness can reverse violently if the BOJ turns hawkish or US yields fall. The higher your unhedged foreign-currency exposure, the more this is a level to review hedging, not to add risk mechanically.
7月の注目点:7日の30年債入札が最初の試金石
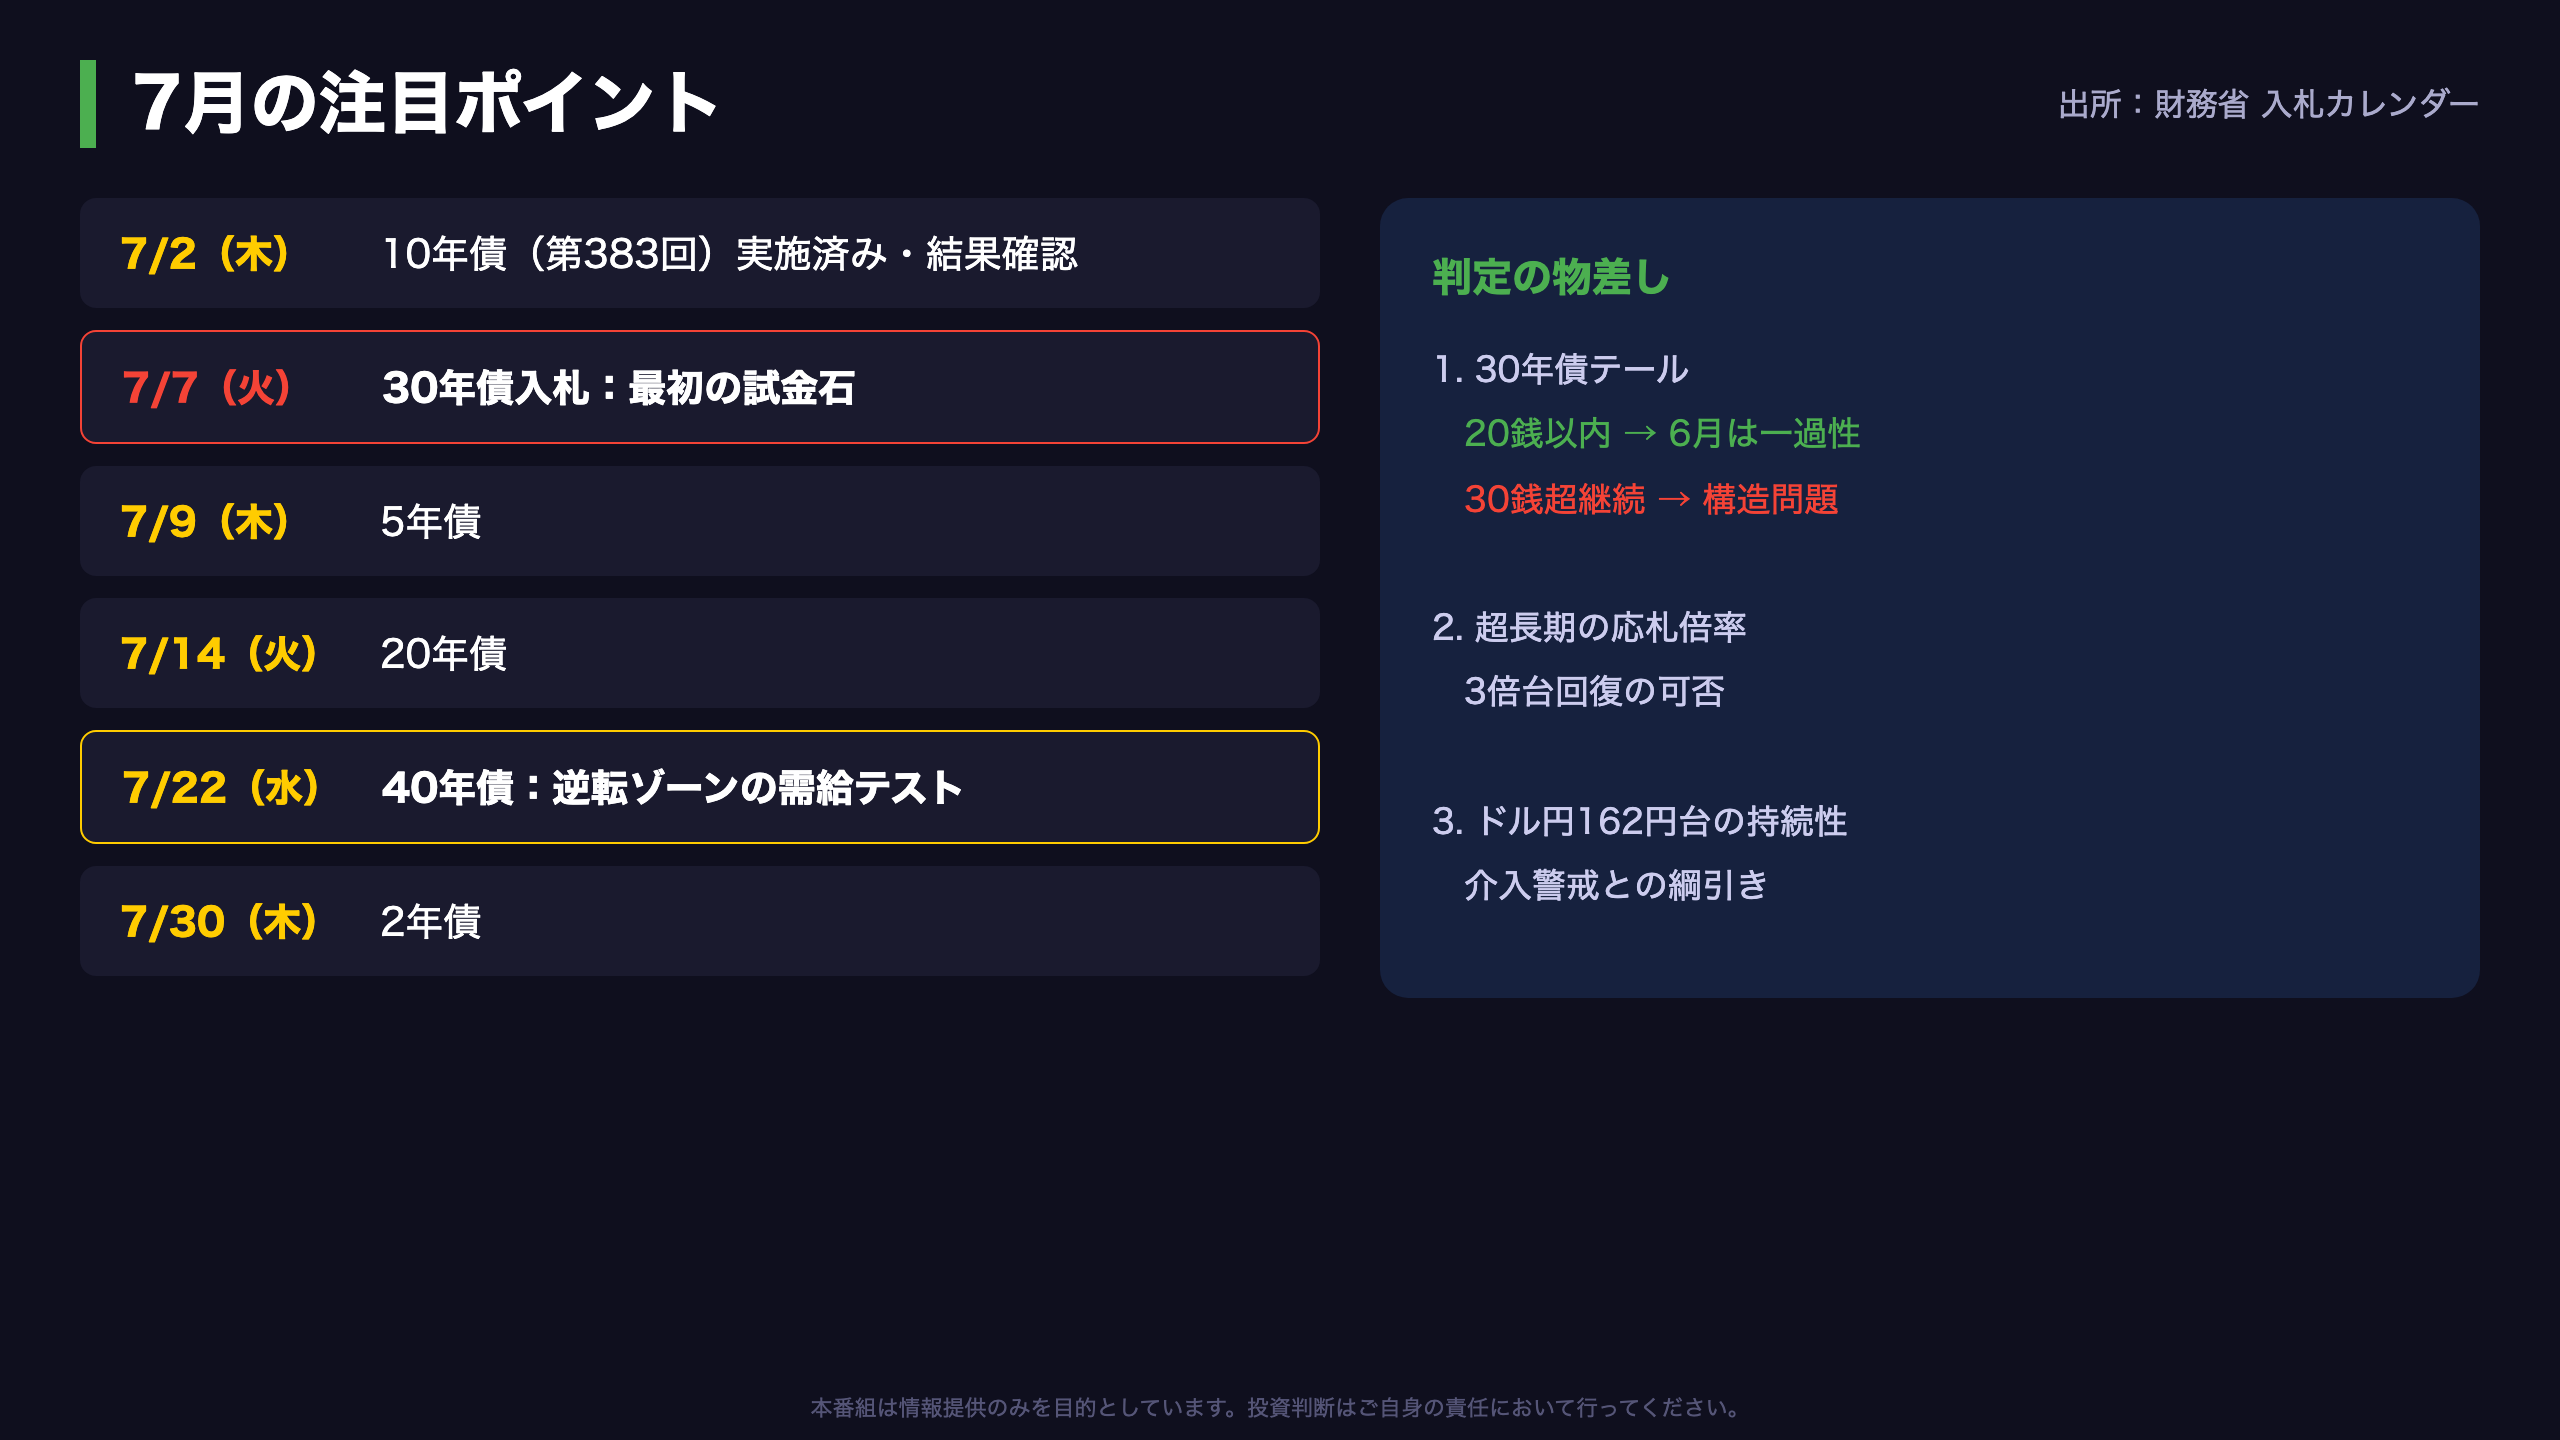
July calendar and the decision framework
From the MOF’s July schedule, the events that matter for super-long demand: a 10-year auction (issue 383) already held July 2 whose results warrant review; the pivotal 30-year auction on July 7; a 5-year on July 9; a 20-year on July 14; a 40-year on July 22, landing exactly where the curve is inverted; and a 2-year on July 30. August adds a 10-year inflation-linked auction (Aug 12) and a 10-year Climate Transition bond (Aug 24), useful reads on demand from different investor bases.
Our framework has three tests. First, the 30-year tail: back inside 20 sen means June was noise; another print above 30 sen suggests a structural demand problem. Second, whether super-long covers recover to the 3x area. Third, the currency: does dollar-yen consolidate above 162, inviting intervention risk, or retreat as rate-differential logic reasserts itself? Yields, auction internals, and FX together will tell us whether Japan’s fiscal premium is building or fading. Same time next month, same fixed-point observation.
Disclaimer: This article is for informational purposes only. All investment decisions are made solely at your own risk.







