📺 Watch the Full Video Analysis
This article was automatically generated by the NFC Market Live AI analysis system. (Updated: 2026-07-22 09:58 JST)
📄 Primary Source
財務省
https://www.customs.go.jp/toukei/shinbun/trade-st/gaiyo2026_06.pdf
📊 Deep dive into Japan’s June 2026 trade statistics released by the Ministry of Finance.
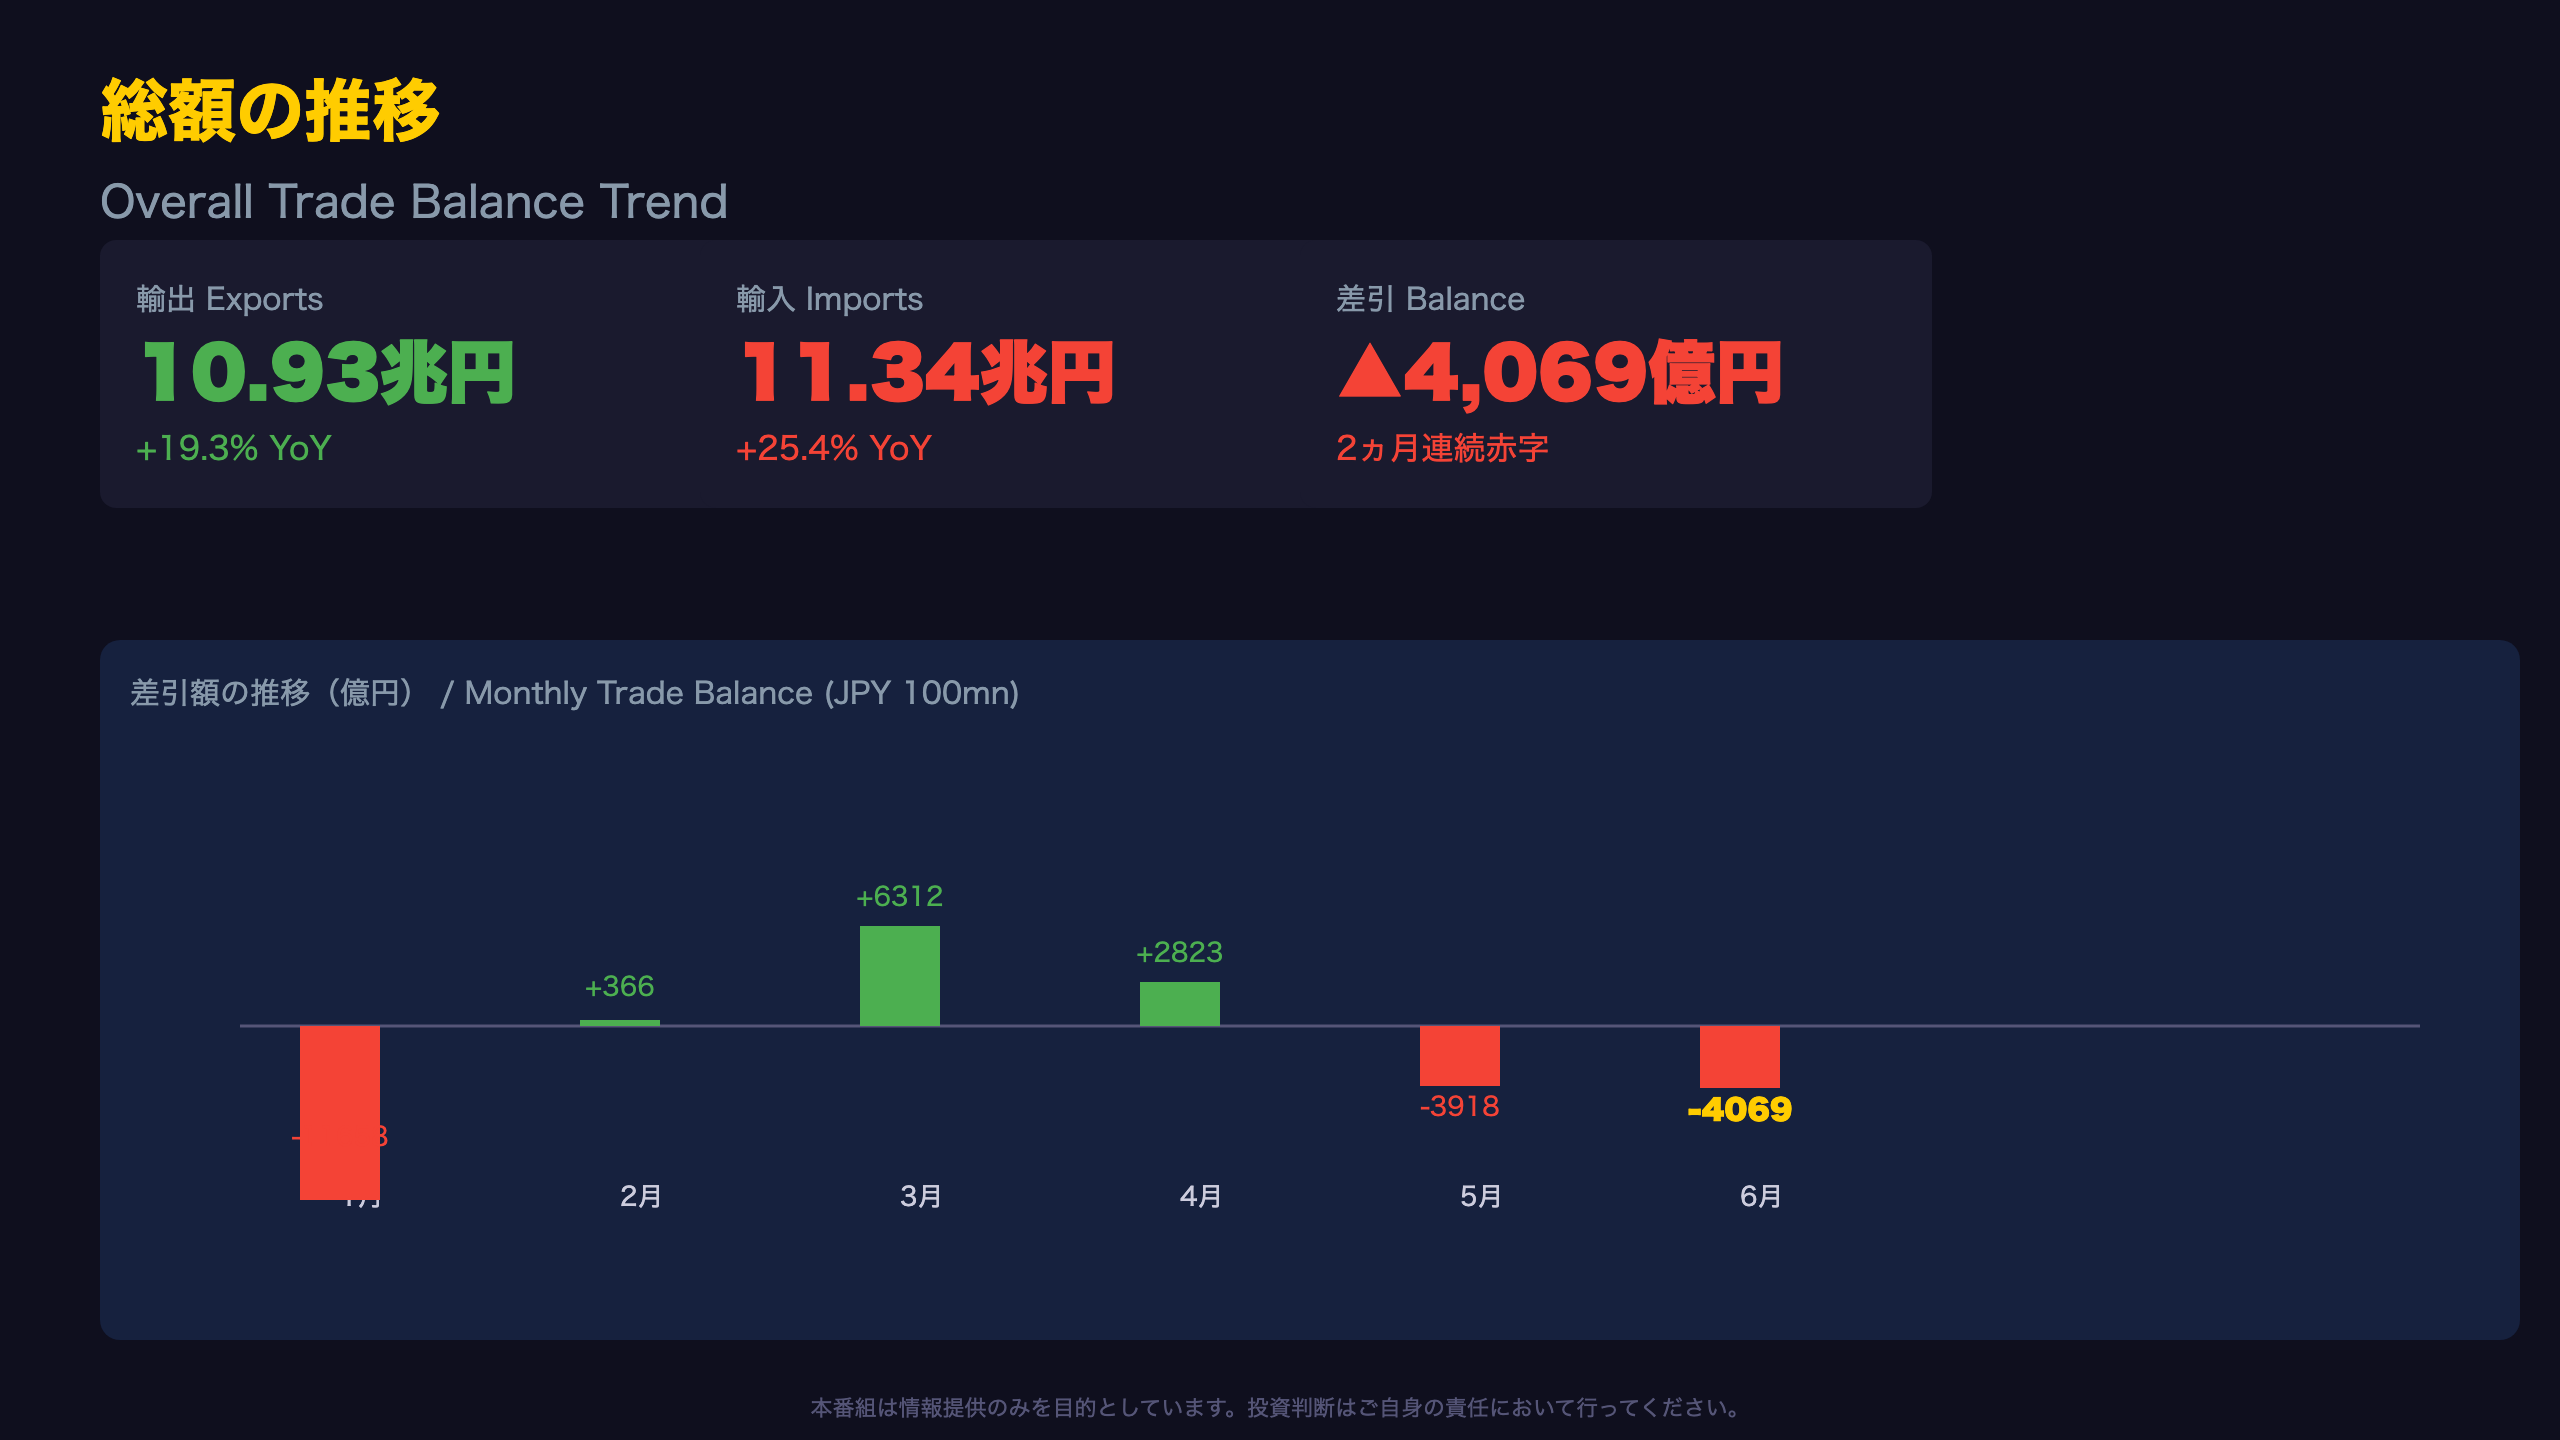
Exports rose 19.3% YoY to ¥10.929tn, imports surged 25.4% to ¥11.336tn, yet the trade balance posted a ¥406.9bn deficit for a second straight month.
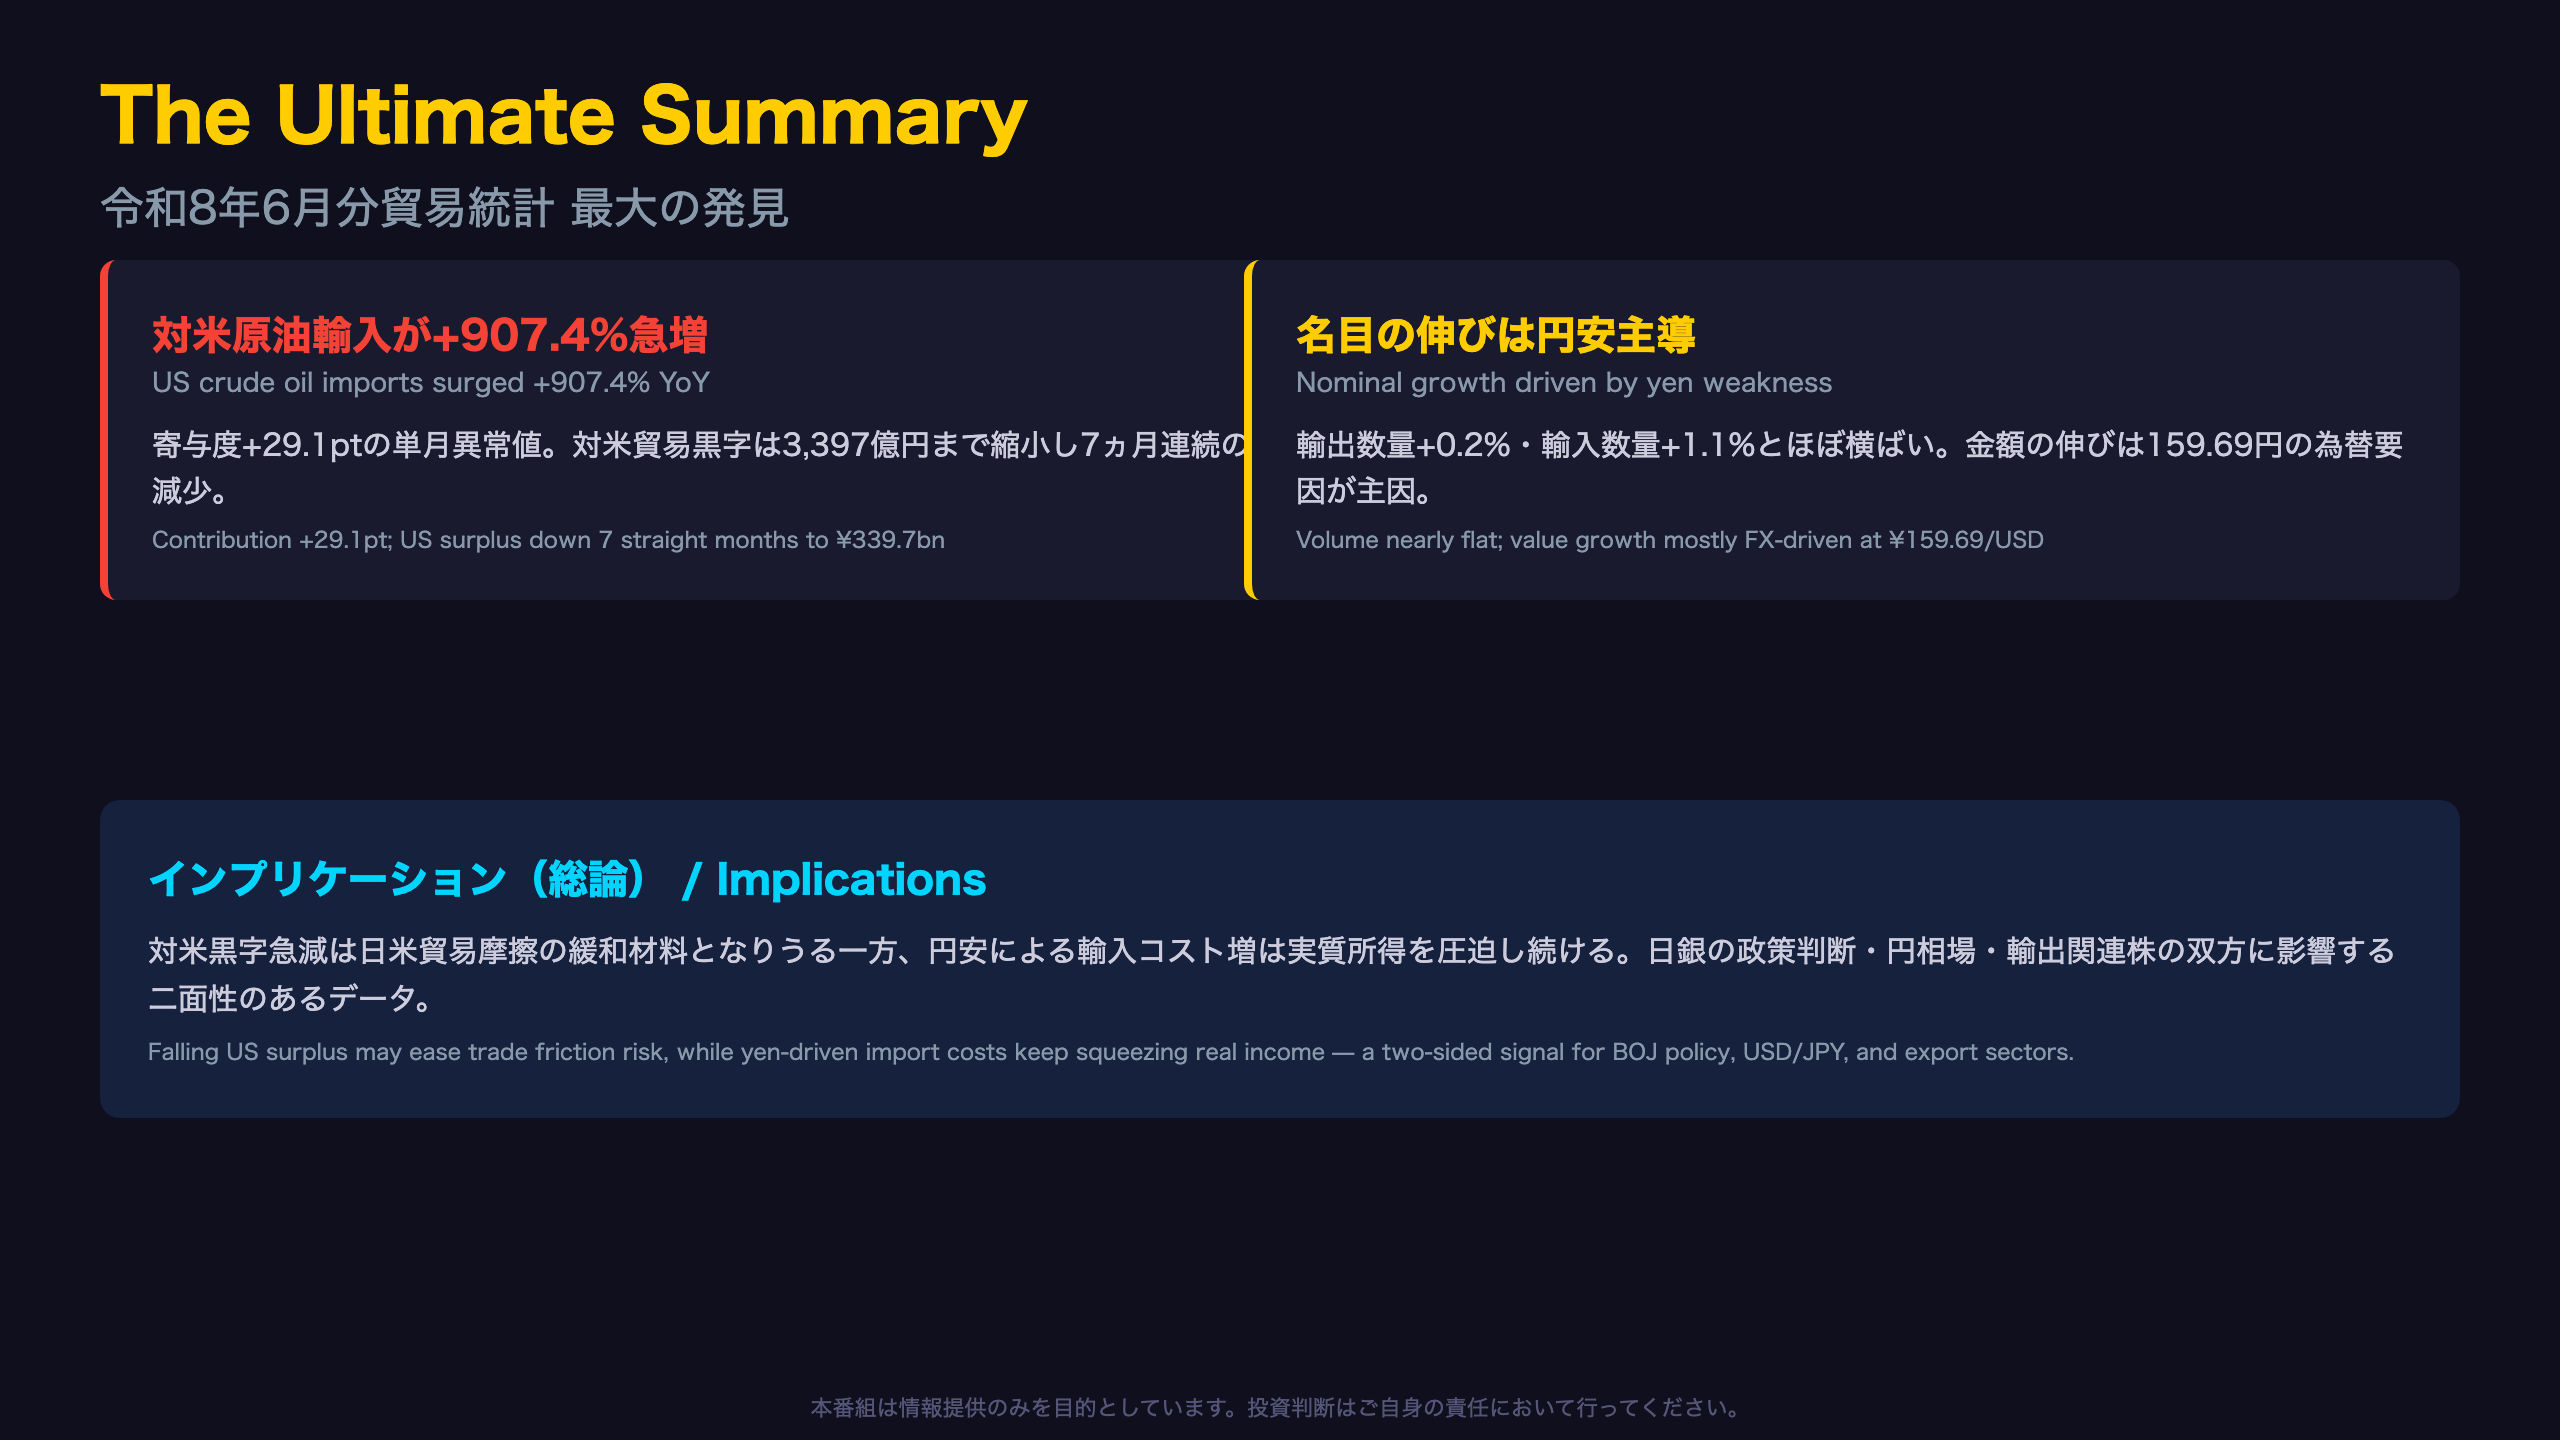
💡 The standout finding: US crude oil imports jumped 907.4% YoY, contributing +29.1pp to import growth — shrinking Japan’s US trade surplus for a 7th consecutive month.
⚠️ However, export volume index rose just +0.2% YoY, suggesting most of the nominal growth reflects yen depreciation (¥159.69/USD) rather than real trade expansion.
We break down the implications for BOJ policy, USD/JPY, and equity sectors.
The Ultimate Summary:対米原油907%増と円安の名目押し上げ
Reading Beneath the Headline
Japan’s Ministry of Finance (MOF) reported June trade data showing double-digit growth in both exports (+19.3% YoY) and imports (+25.4% YoY), yet the headline trade balance still posted a 406.9 billion yen deficit — the second consecutive monthly shortfall. A surface read suggests broad-based strength, but the internals tell a more nuanced story.
Two Independent Signals Worth Separating
- Shrinking US surplus: US-bound crude oil imports surged 907.4% YoY, contributing +29.1 percentage points to overall import growth — a scale rarely seen in monthly trade data. This pushed Japan’s surplus with the US down to ¥339.7bn, marking a seventh consecutive month of contraction.
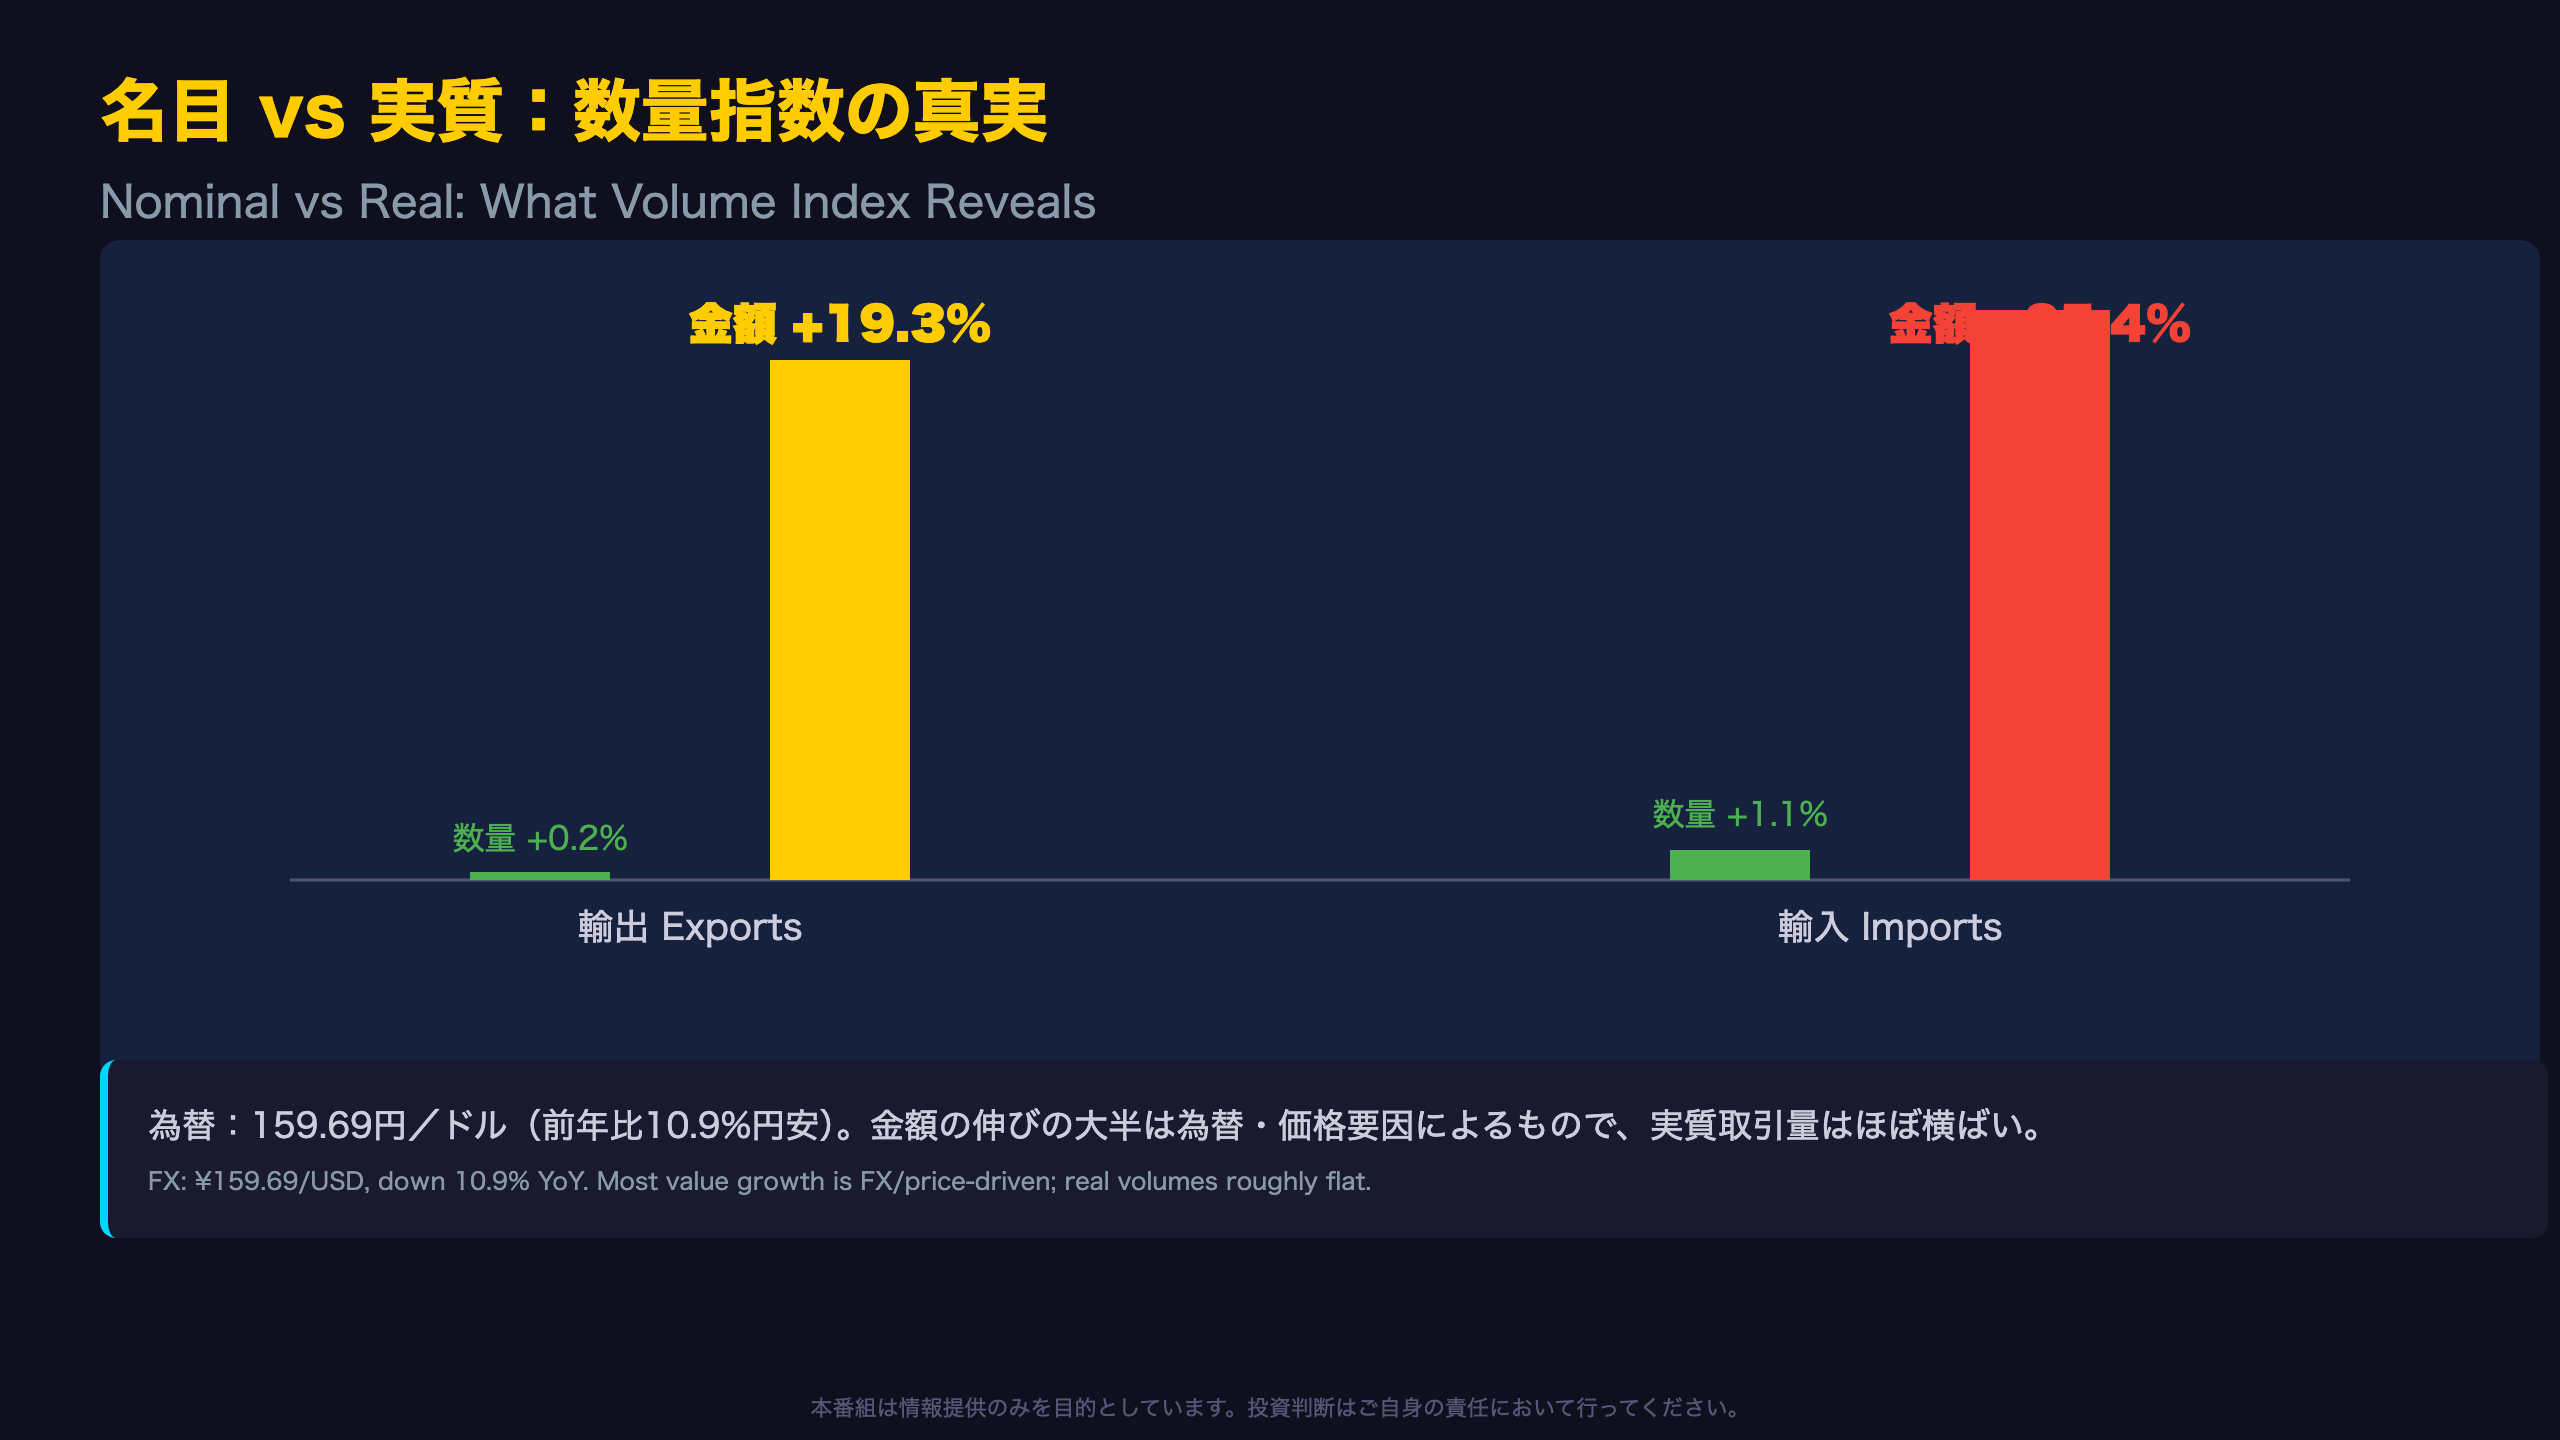
- Nominal-real divergence: Export and import volume indices rose just 0.2% and 1.1% YoY respectively — essentially flat — while nominal value growth ran at 19.3% and 25.4%. The gap is largely explained by the yen trading near ¥159.69/USD, down 10.9% YoY.
Why This Combination Matters for Global Investors
For US-based readers unfamiliar with Japan’s MOF trade release: this monthly report is Japan’s equivalent of the US Census Bureau’s international trade data, but with far more granular item-level and country-level breakdowns, including “contribution points” (寄与度) showing exactly which products drove the headline growth rate — a level of detail the US release doesn’t provide.
The crude oil surge may plausibly reflect Japan’s broader energy-purchase diplomacy amid ongoing US-Japan trade balance discussions (a Level-C inference, not confirmed causally by this data alone). Meanwhile, the yen-driven nominal inflation of trade values — rather than genuine volume growth — echoes the same currency-translation effect that inflates dollar-denominated import bills in other yen-linked economies. Watch the July release (due late August) to see whether the oil-import spike persists or normalizes.
総額の推移:貿易赤字は2ヵ月連続で拡大
Tracing the Trade Balance Over Time
Japan’s monthly trade balance (vs. world) has swung significantly through 2026: a deficit of ¥1.166tn in January, a surplus of ¥36.6bn in February, ¥631.2bn in March, ¥282.3bn in April (revised), a deficit of ¥391.8bn in May (revised), and now ¥406.9bn in June.
What the Seasonally Adjusted Series Tells Us
Raw monthly trade figures in Japan are notoriously volatile due to seasonal patterns (fiscal year-end effects, holiday timing, etc.). The seasonally adjusted balance came in at negative ¥882.0bn, widening sharply from the prior month (+298.9% MoM in deficit terms) — a steeper deterioration than the unadjusted “two consecutive months of deficit” headline suggests.
Broad-Based Growth, Not a Single-Item Story
On the export side, growth was driven by autos (contribution +3.7pt), semiconductor components (+2.8pt), and non-ferrous metals (+1.2pt) — a diversified mix rather than reliance on one sector. Imports similarly drew from crude oil (+4.3pt), semiconductor components (+2.0pt), and non-ferrous metals (+1.8pt).
For context, Japan’s MOF releases this “contribution point” (寄与度) breakdown monthly — a level of granularity that lets analysts isolate exactly which products are driving the headline growth rate, unlike the more aggregated releases from the US Census Bureau. However, breadth alone doesn’t confirm real economic expansion; the volume index data (next section) is essential to separate price effects from genuine trade growth.
数量指数と金額の乖離:名目押し上げの正体
Separating Nominal from Real: A Core Discipline in Trade Data
When analyzing trade statistics, focusing only on yen-denominated value figures risks missing the currency effect entirely. Japan’s MOF also publishes a “volume index” (数量指数) alongside value data — a metric US trade releases (Census Bureau, BEA) typically don’t provide in the same granular monthly cadence, making this a distinctive feature of Japan’s release worth understanding for international readers.
The Size of the Gap This Month
| Metric | Volume Index (Real) | Value (Nominal) |
|---|---|---|
| Exports | +0.2% | +19.3% |
| Imports | +1.1% | +25.4% |
This gap is notably wider than in prior months — in May, the export volume index rose 0.5% against a 17.0% value increase. The divergence has widened further in June.
Attributing the Gap to Currency
The average customs-reported exchange rate was ¥159.69/USD, down 10.9% YoY. A simplified read suggests roughly 10 percentage points of the nominal growth rate may be attributable to currency translation alone (a Level-B inference, since multiple indicators point the same direction), with the remainder likely reflecting rising commodity prices, particularly crude oil.
The Balanced View
A flat volume index doesn’t necessarily mean the real economy is stagnating — Japan’s export volume index has now risen for four consecutive months, a modest but steady positive trend. The headline nominal surge is largely yen-driven, but underlying real activity is also showing resilience. Both sides of this picture matter for a fair assessment.
対米貿易の異変:原粗油907%増の衝撃
Breaking Down US Trade Flows
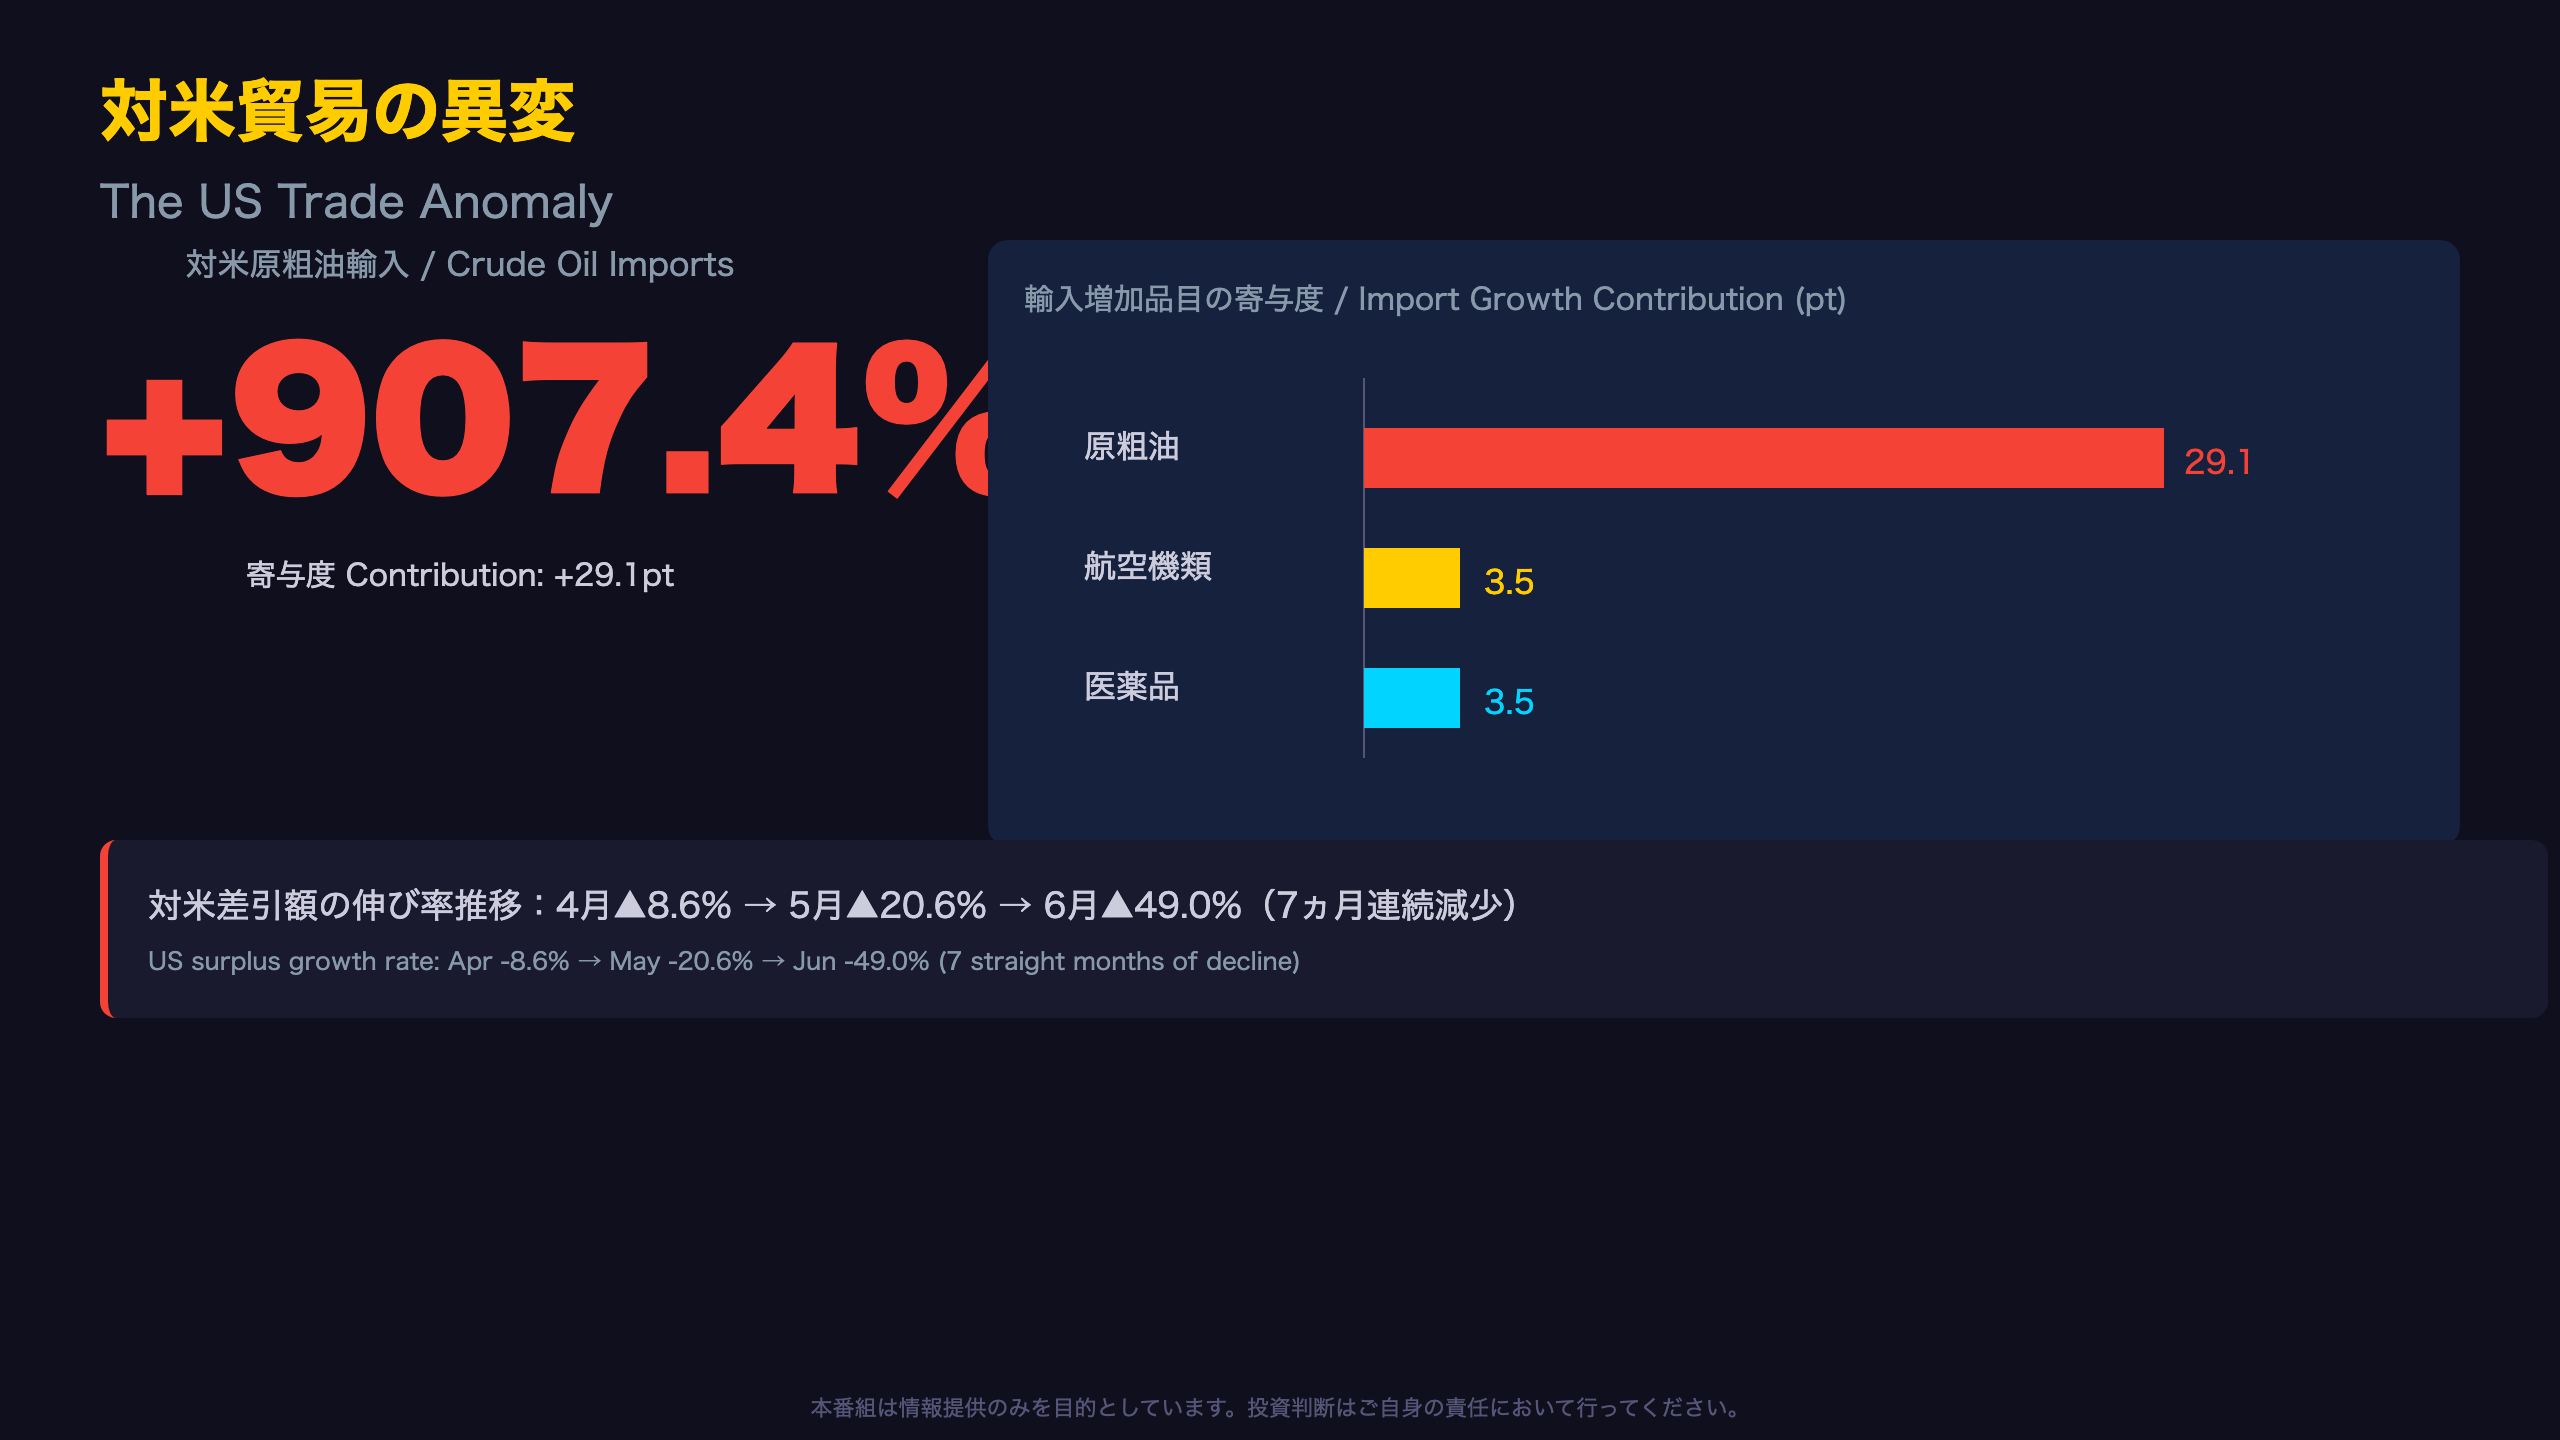
The US trade section is the most analytically significant part of this release. Of the 52.7% import growth rate, more than half is explained by a single line item: crude oil.
Contribution Breakdown (Import Growth Items)
| Item | Growth Rate | Contribution |
|---|---|---|
| Crude Oil | +907.4% | +29.1pt |
| Aircraft | +228.5% | +3.5pt |
| Pharmaceuticals | +46.5% | +3.5pt |
These three items alone account for 36.1 contribution points — roughly 70% of the total 52.7% import growth rate.
The Decaying US Surplus Trend
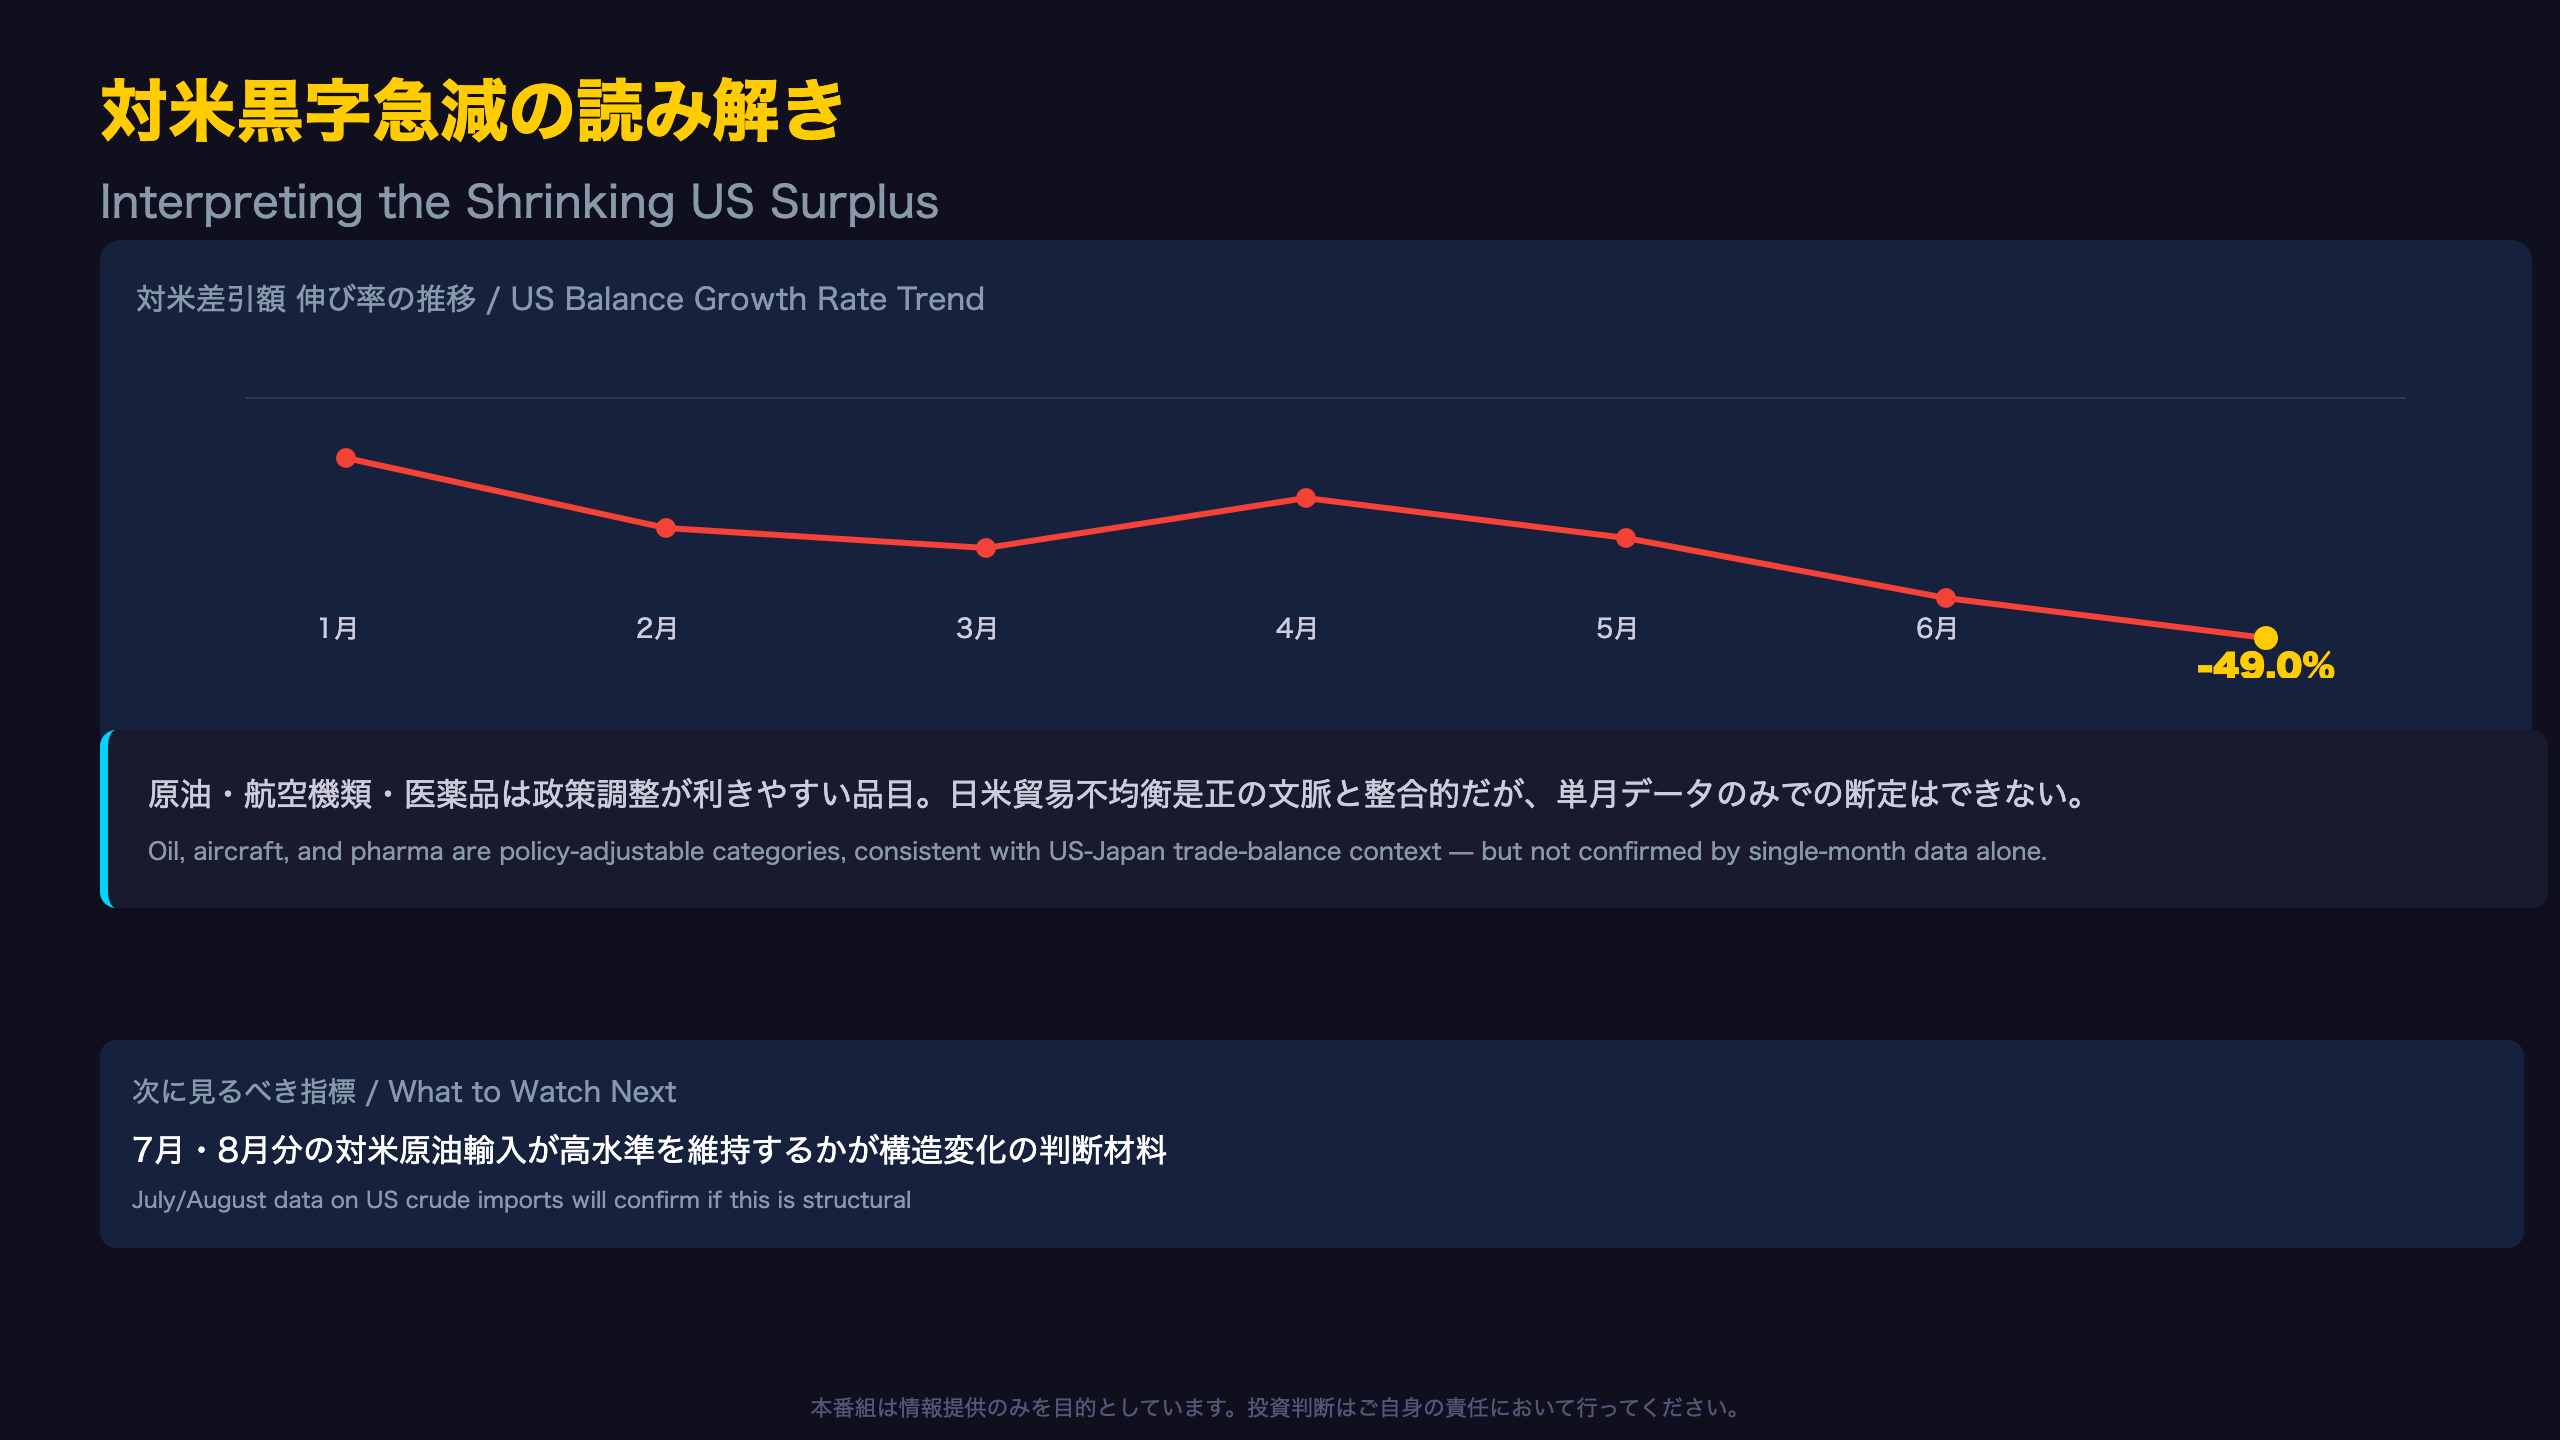
Tracking the year-over-year growth rate of the US trade balance: -8.6% in April, -20.6% in May, and now -49.0% in June — a rapidly accelerating decline. The absolute surplus remains positive at ¥339.7bn, but at this pace, further compression looks plausible.
Multiple Plausible Interpretations
A 907% surge in a single category is difficult to explain through price effects alone; it likely reflects a genuine volume increase in purchases (Level-B inference, supported by the magnitude relative to typical commodity price swings). One plausible contributing factor (Level-C, not confirmed) is that Japan may be shifting energy procurement toward the US amid ongoing bilateral trade-balance discussions — a dynamic that would be familiar to readers tracking US-Japan trade negotiations under recent administrations. That said, this is single-month data; the July and August releases will be the key test of whether this is a structural shift or a one-off spike.
対米黒字急減の政治経済的読み解き
Interpreting Single-Month Data with Appropriate Caution
Building on the prior slide’s finding, let’s examine the broader context behind the US import surge. Crude oil, aircraft, and pharmaceuticals are all categories where procurement volumes can be influenced by large contracts or government-level negotiations — a nuance international readers should understand about Japan’s import composition with the US.
Comparing to Historical Patterns
The US trade surplus growth rate had generally run negative from late 2025 through early 2026 (-51.9% in August, -38.8% in September, -33.9% in October, etc.). However, the current -49.0% reading ranks among the steepest declines of the past year, suggesting this month’s move is unusually pronounced even relative to an already-negative trend.
Keeping Interpretation at the Appropriate Confidence Level
- The crude oil surge plausibly suggests a shift in energy sourcing toward the US (Level-B: multiple related items point the same direction)
- However, single-month data alone cannot confirm that this reflects the execution of a specific bilateral political agreement (a Level-D causal claim is explicitly avoided here)
- The aircraft import surge (+228.5%) could relate to defense procurement cycles, but the source document provides no further breakdown — this must be noted as “not specified in the original text”
What to Watch Next
The July and August US trade releases will be the first real test: does crude oil import growth persist at elevated levels, or does it revert? A sustained trend would strengthen the case for a structural shift in Japan’s energy sourcing strategy, with implications for both energy security policy and ongoing US-Japan trade balance negotiations.
対中・対EU:赤字構造の広がり
Simultaneous Shifts Across Major Trading Regions
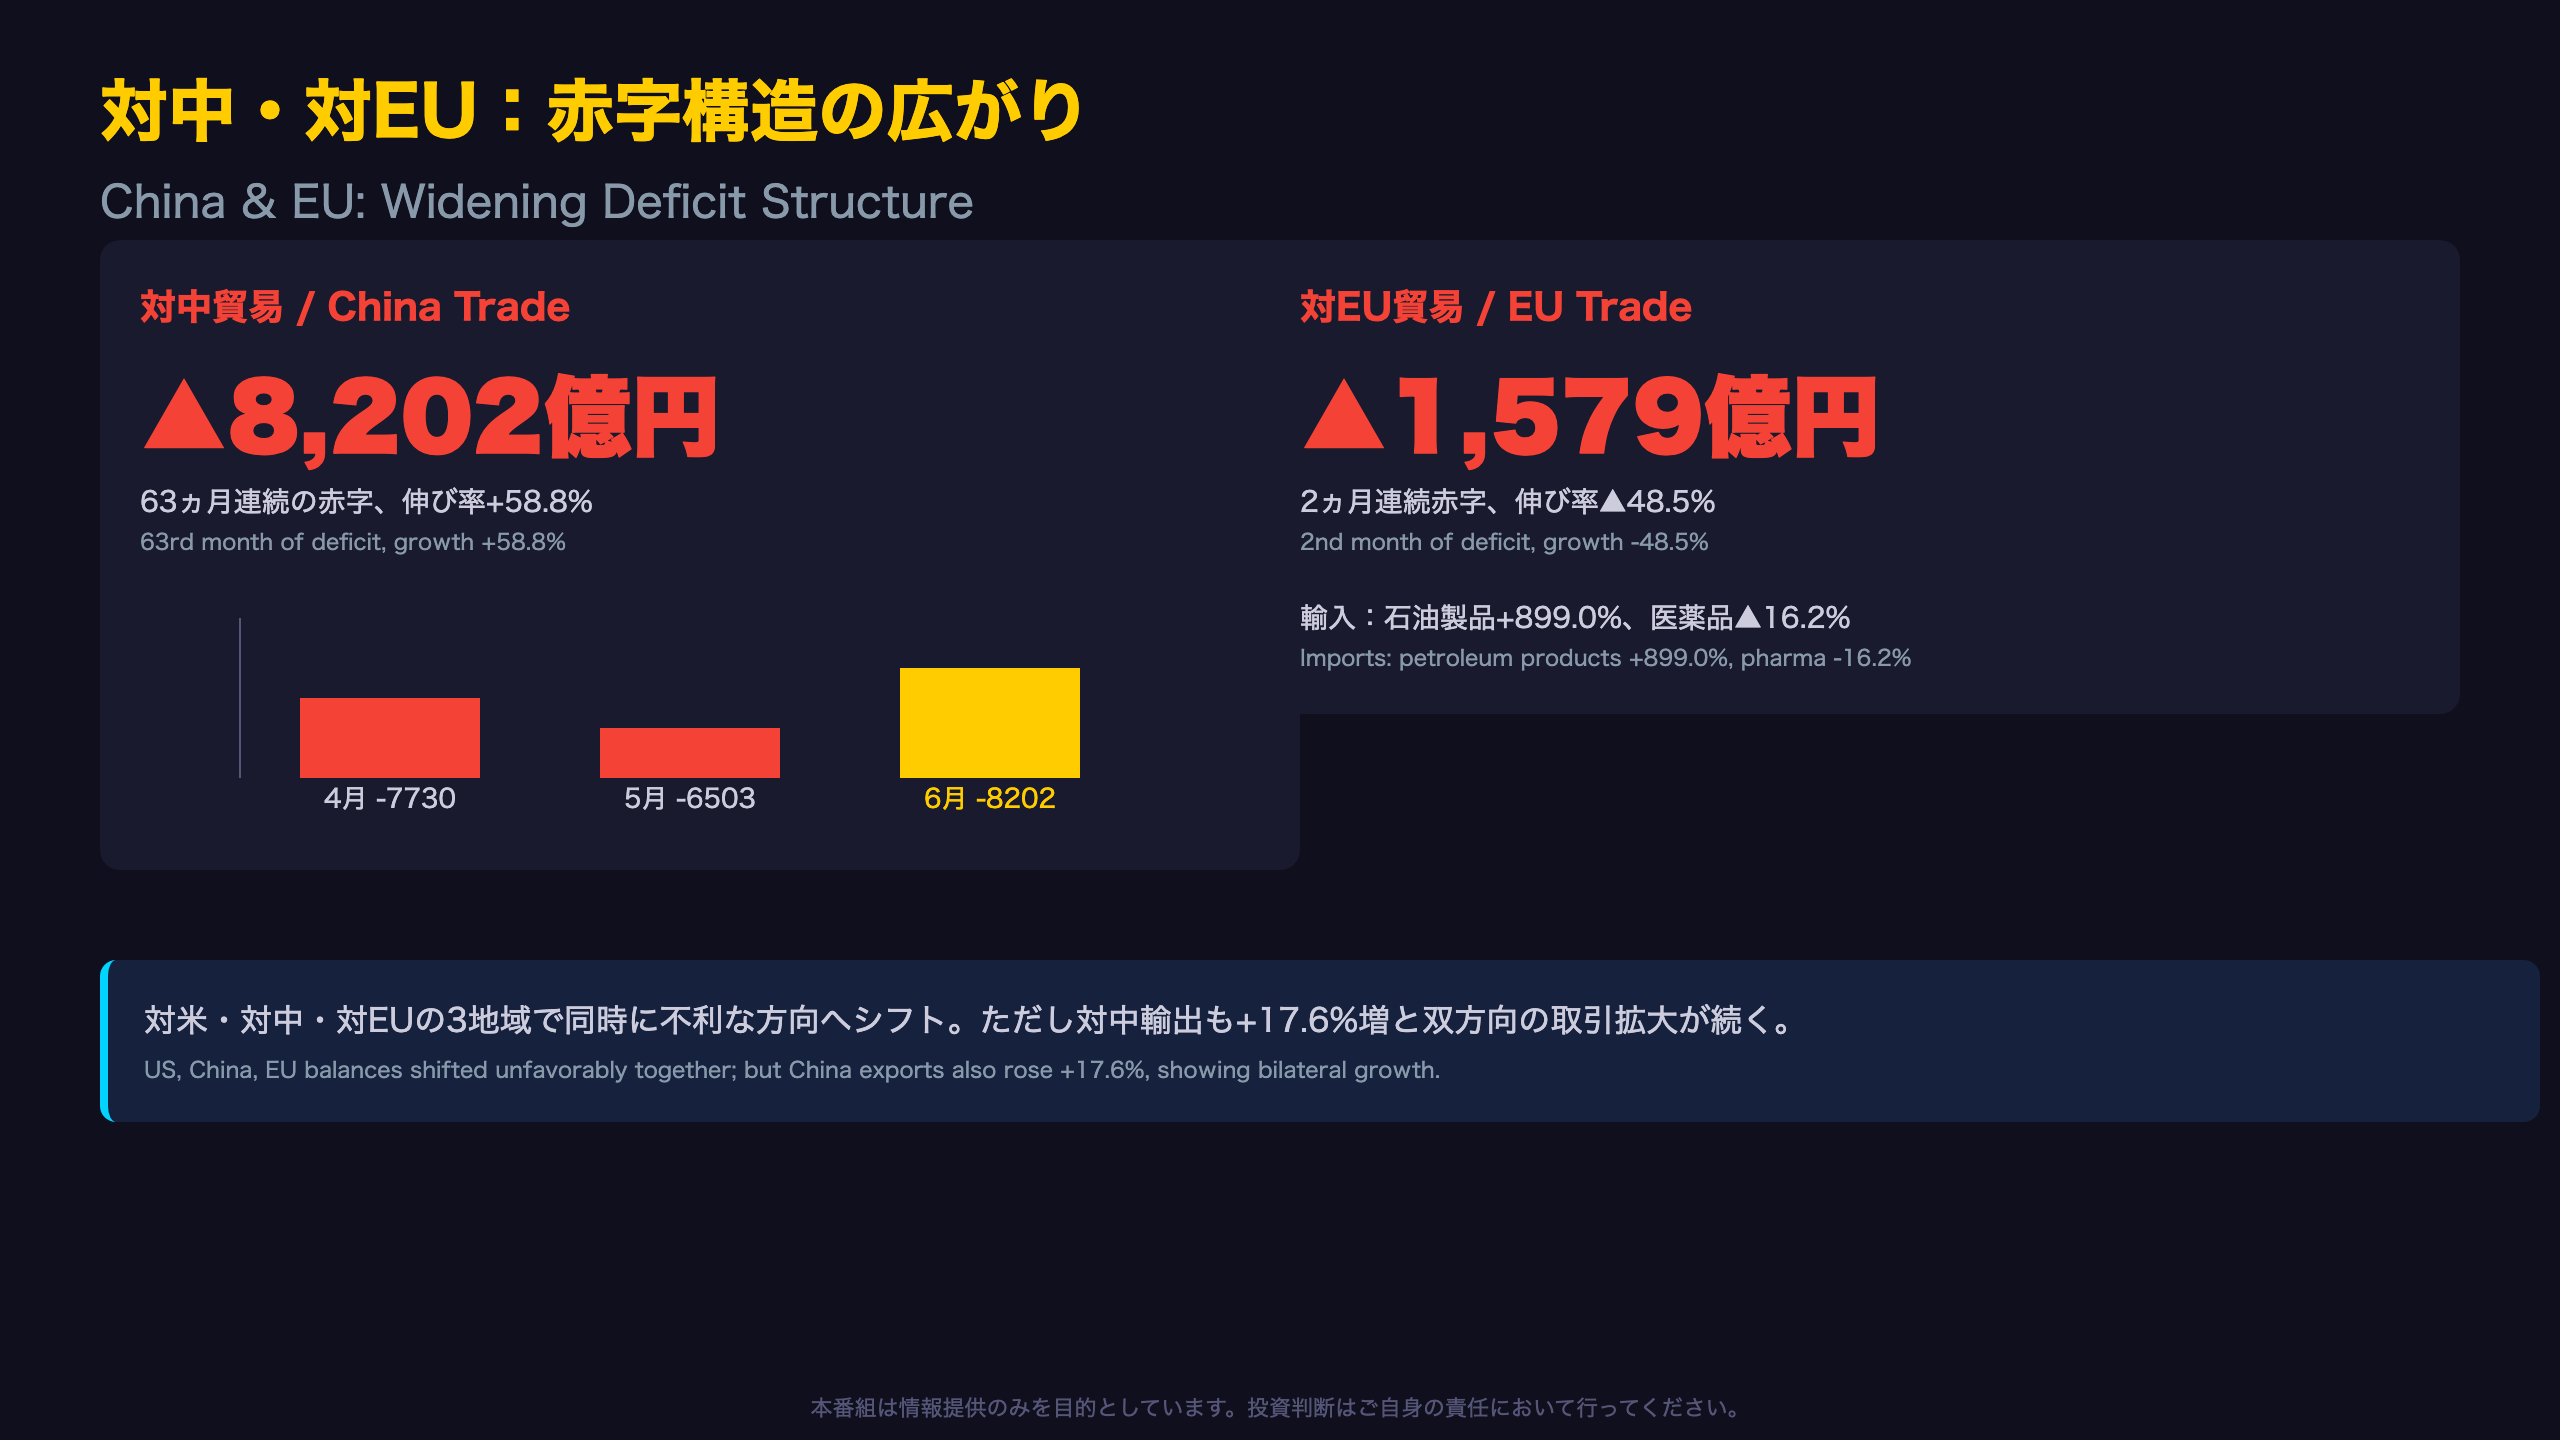
A notable feature of this release is that Japan’s balance with all three of its major partners — the US, China, and the EU — moved in an unfavorable direction (shrinking surplus or widening deficit) at the same time.
China Deficit: 63 Months Running, Accelerating
Japan’s deficit with China has now persisted for 63 consecutive months, and June’s deficit growth rate accelerated sharply to +58.8%, up from +4.0% in May. Import-side drivers included semiconductor components (+71.9%) and non-ferrous metals (+96.1%).
| Month | China Balance (¥100mn) | Growth Rate |
|---|---|---|
| April | -7,730 | +13.7% |
| May | -6,503 | +4.0% |
| June | -8,202 | +58.8% |
EU: Deficit Appears to Be Becoming Entrenched
The EU balance briefly turned positive in April (+¥23.8bn) but has now posted deficits for two straight months. On the import side, pharmaceuticals fell 16.2%, while organic compounds (+46.7%) and petroleum products (+899.0%) pushed the total higher.
For context, Japan’s trade relationship with the EU (grouped as a single bloc in MOF data, unlike the more granular country-level breakdowns for the US and China) tends to be more balanced historically than its structurally persistent deficit with China.
Room for Alternative Interpretation
The widening China deficit may reflect strong Chinese domestic demand for semiconductor-related goods, or Japan’s role as a supplier of intermediate goods into Chinese supply chains (Level-C inference). While this is often framed as a “supply chain dependency risk,” Japan’s exports to China also rose 17.6% this month — suggesting bilateral trade is expanding in both directions, a more balanced characterization than a one-sided dependency narrative.
半導体等電子部品:全地域を牽引する構造的な強さ
A Structural Bright Spot: Semiconductor Components
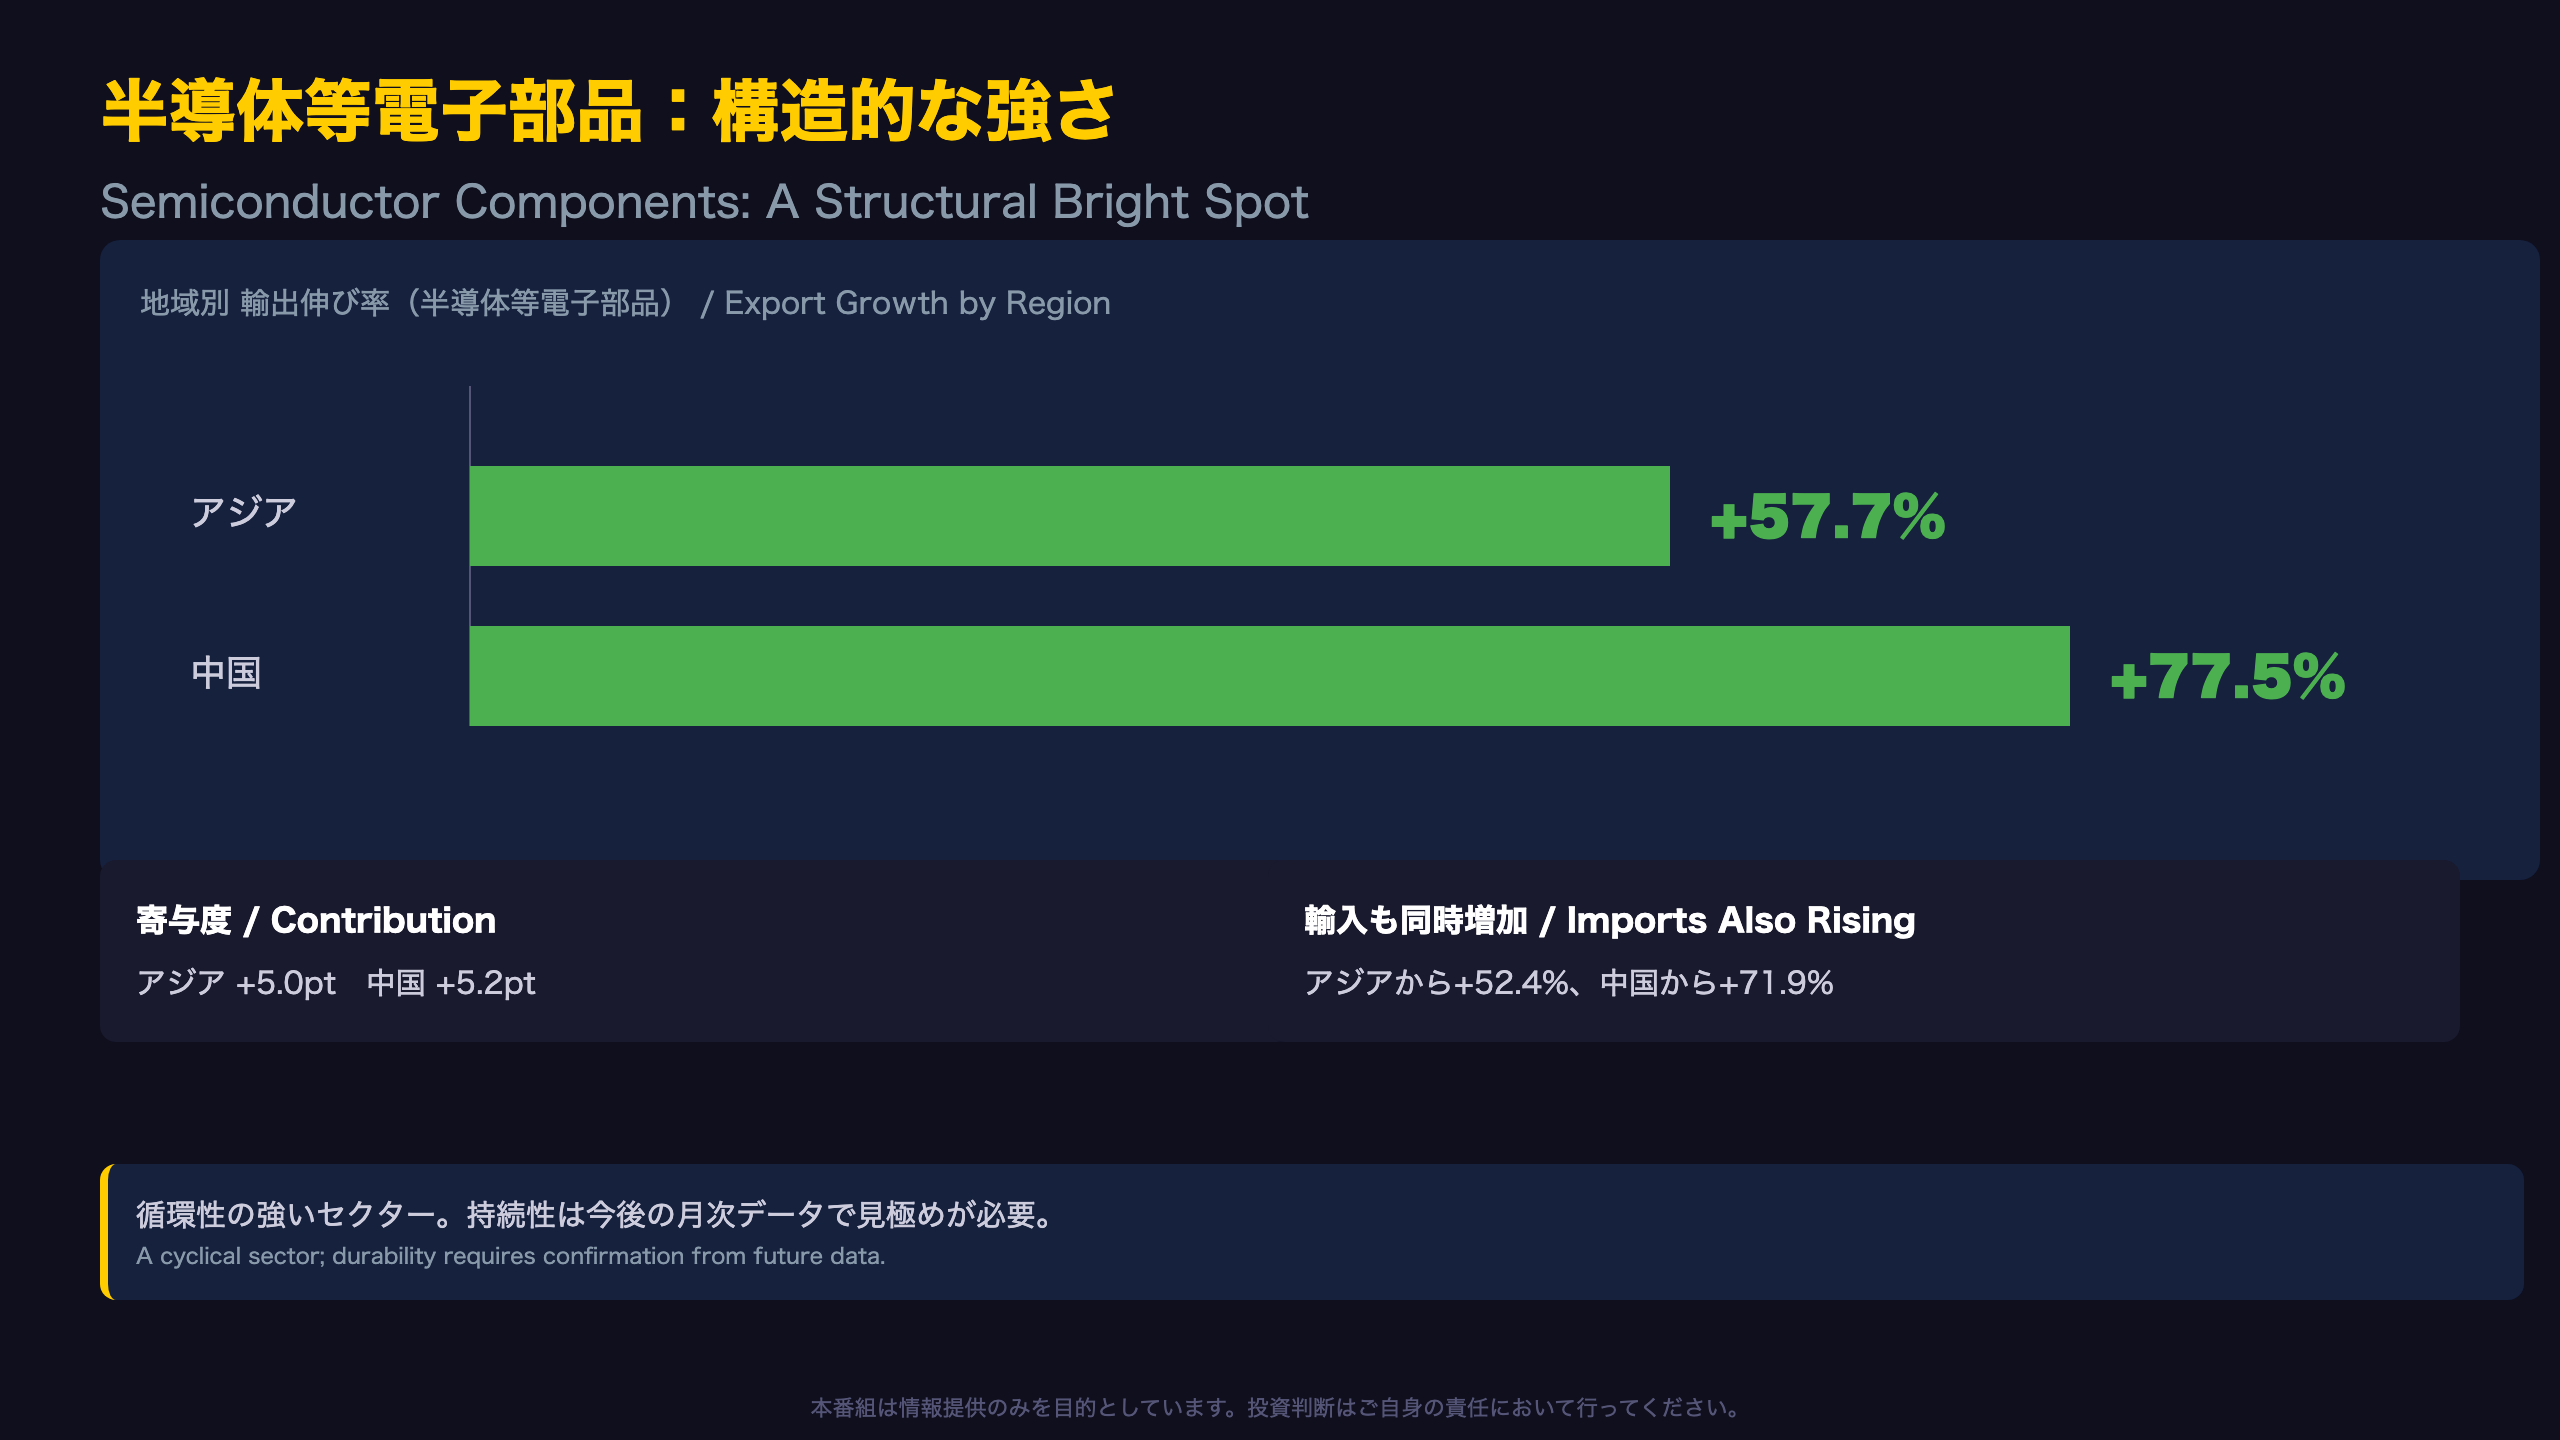
While the headline trade figures are dominated by yen-driven nominal inflation, one sector stands out as a consistent driver of real export strength across all regions: semiconductor-related electronic components.
Regional Export Growth for Semiconductor Components
| Destination | Growth Rate | Contribution |
|---|---|---|
| Asia | +57.7% | +5.0pt |
| China | +77.5% | +5.2pt |
These contribution figures are disproportionately large relative to each region’s overall export growth (Asia +22.7%, China +17.6%) — this single category alone explains roughly a quarter of each region’s total export growth.
Active Two-Way Trade Flows
Notably, semiconductor component imports also rose sharply — up 52.4% from Asia and 71.9% from China. This suggests Japan functions not merely as a finished-goods exporter but as a central node in a bidirectional intermediate-goods supply network (Level-B inference), a structural characteristic that international investors comparing Japan to, say, South Korea’s semiconductor trade profile, should note.
A Caveat Worth Flagging
However, whether this strength reflects genuine capacity expansion or simply an upswing in the global semiconductor demand cycle cannot be determined from this single month of data. The semiconductor market is widely understood to be cyclical, with demand reversals a recognized general risk (a general market characteristic, not something this data alone can confirm or predict). Subsequent months’ data will be needed to distinguish a durable trend from a cyclical peak.
インプリケーション:日銀政策・円相場・株式セクターへの示唆
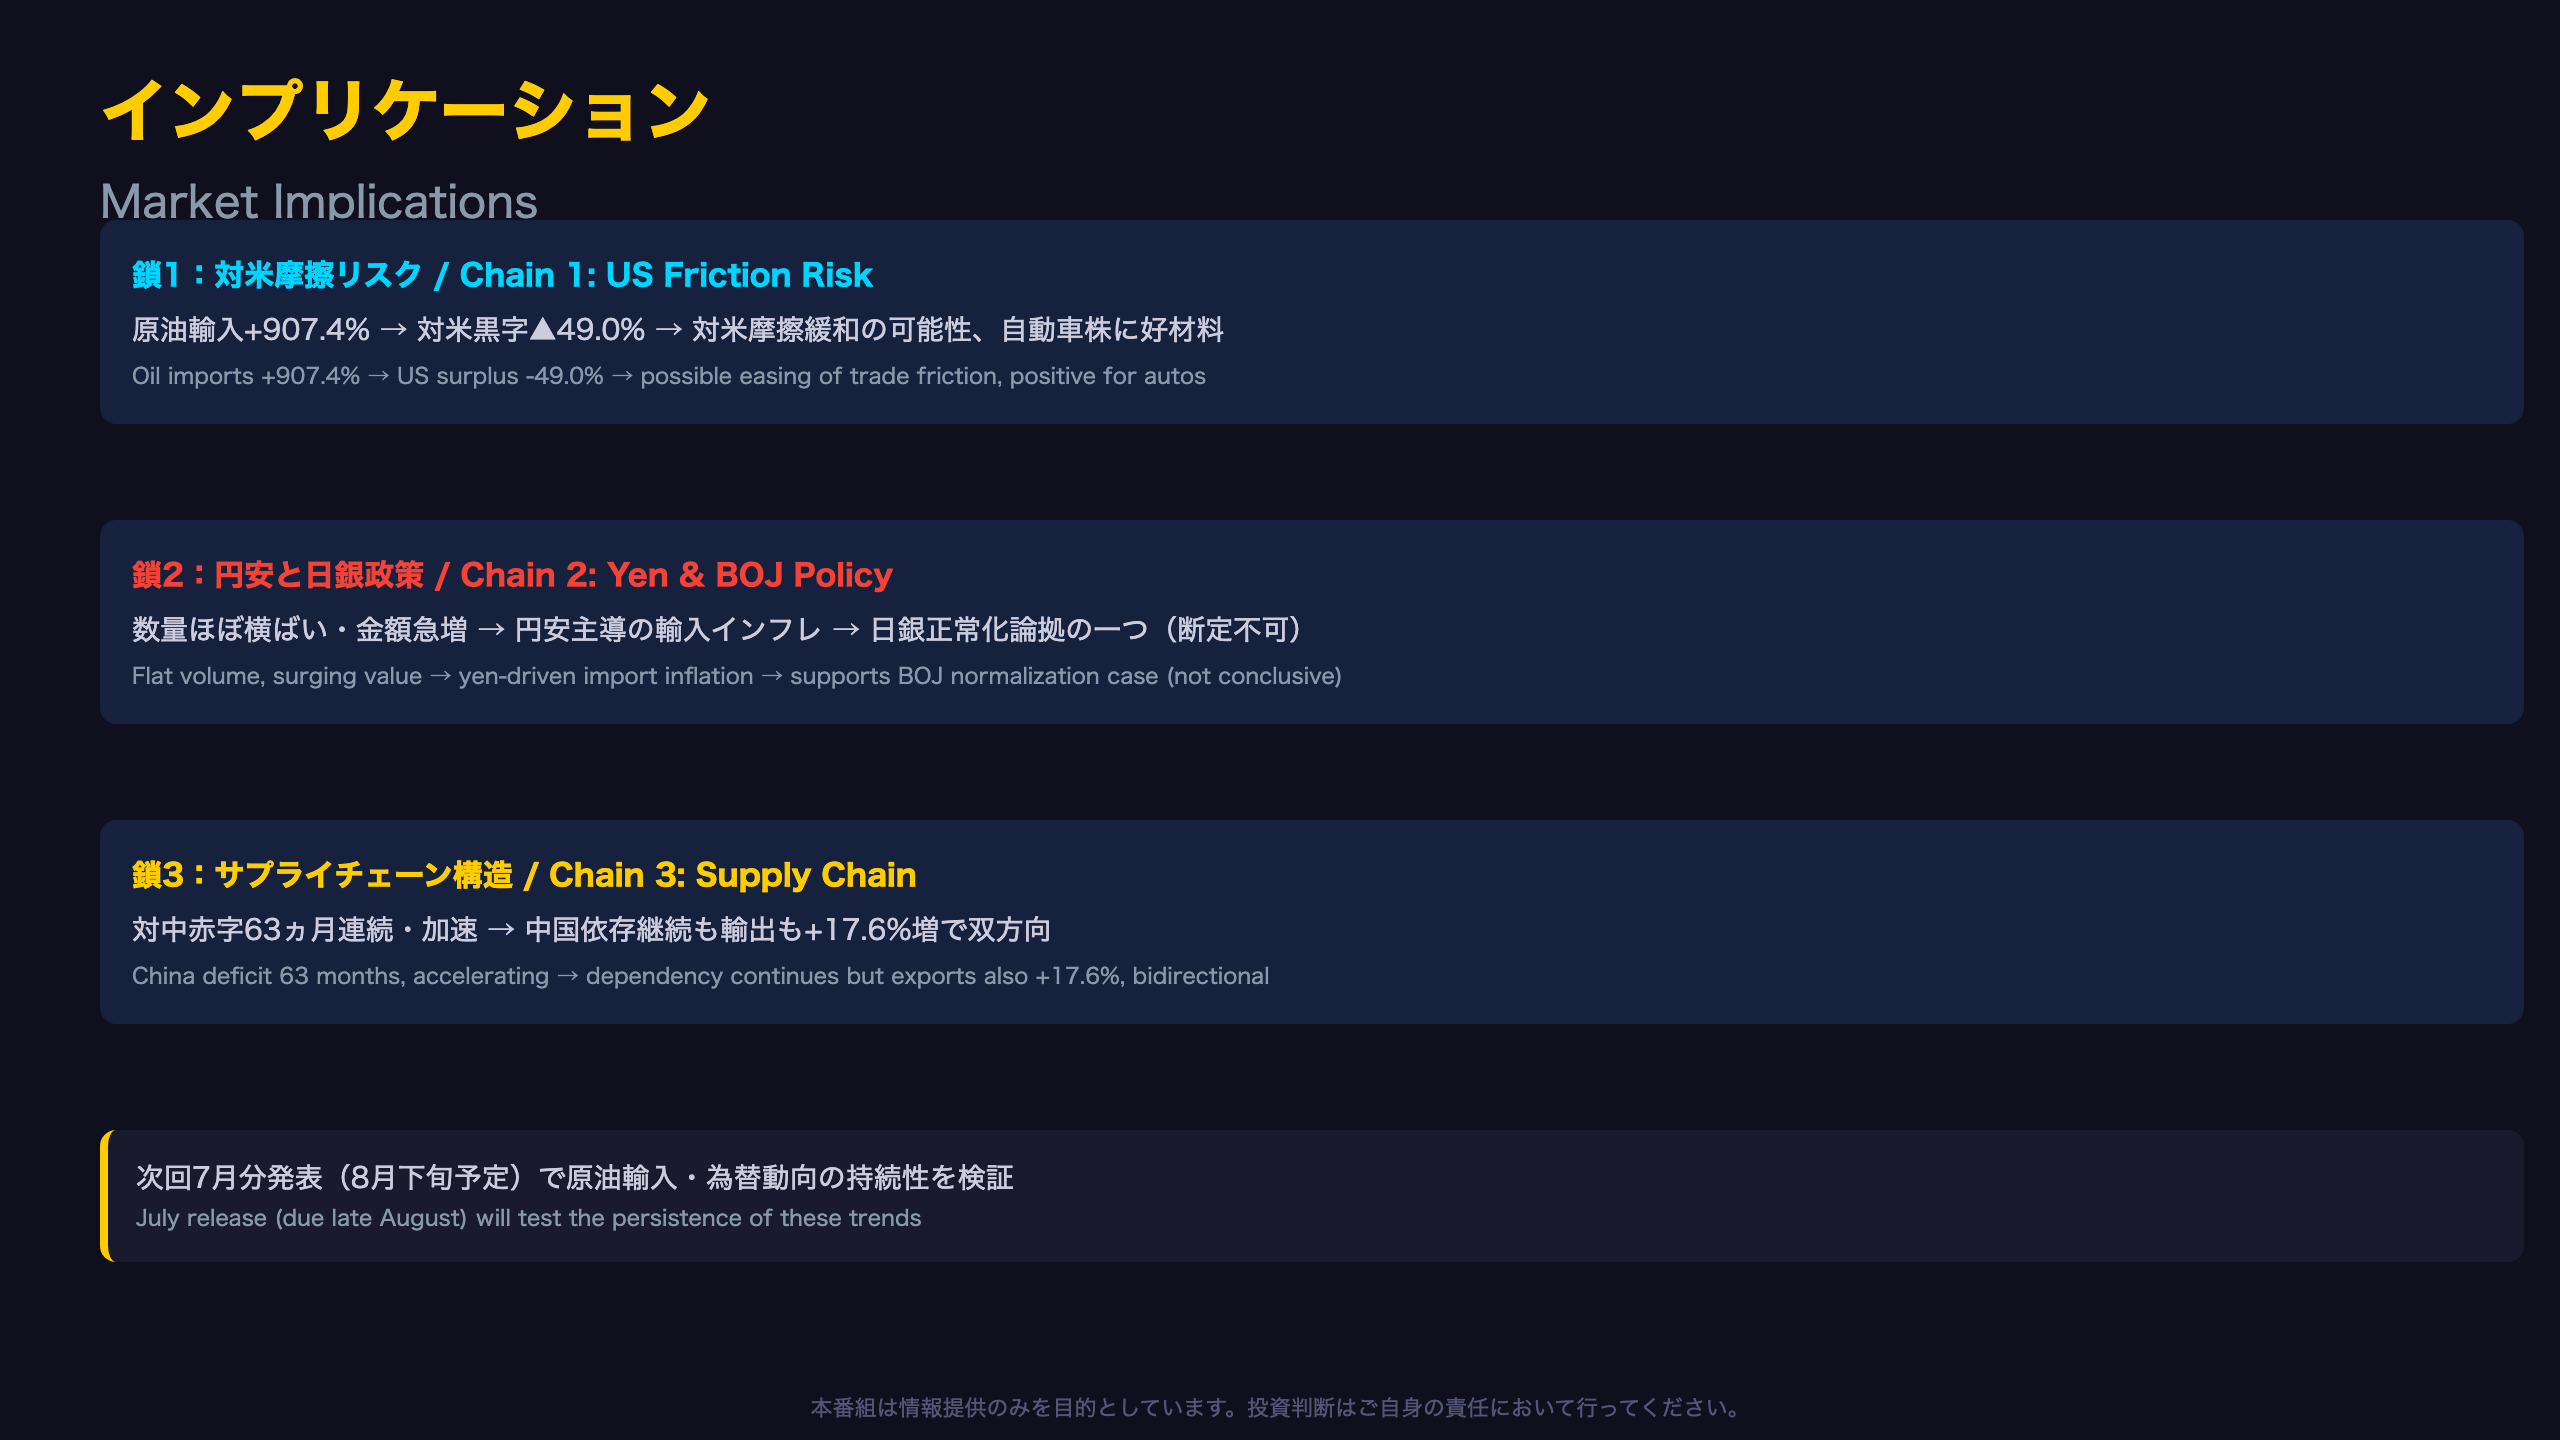
Market Implications via the “Chain of Evidence”
Let’s connect this month’s data to market implications using a clear fact → mechanism → market-implication chain, avoiding unsupported leaps.
Chain 1: US Trade Friction Risk
“US crude oil imports +907.4% YoY, contributing +29.1pt” → “US trade surplus shrank to ¥339.7bn, growth -49.0%, a 7th straight month of decline” → “This suggests some easing of pressure around US-Japan trade imbalance negotiations, which could be read as reducing tail risk for US-export-linked sectors like autos.” However, single-month data cannot confirm the execution of any specific policy agreement.
Chain 2: Yen Weakness and BOJ Policy
“Export volume index +0.2%, import volume index +1.1%, versus export value +19.3%, import value +25.4%” → “Most nominal trade value growth reflects the yen near ¥159.69/USD rather than real volume expansion” → “Yen-driven import cost inflation continues to squeeze real income — a dynamic generally considered supportive of the case for BOJ policy normalization, though this single dataset alone cannot determine the BOJ’s specific policy decision.”
Chain 3: Supply Chain Structure
“China deficit now 63 consecutive months, growth accelerating to +58.8%” → “Reliance on China for semiconductor-related imports continues” → “This could be viewed as a supply-chain vulnerability if geopolitical risk materializes, though China-bound exports also rose +17.6%, indicating the relationship is not a one-sided dependency.”
Bottom Line for International Investors
This release contains two directionally distinct signals: an easing US-trade-friction signal, and a yen-driven real-income-squeeze signal. For USD/JPY watchers and BOJ-policy analysts, the July release — due late August — will be the key test of whether the crude-oil import surge persists and how the exchange rate evolves, both of which will validate or challenge these interpretations.
Disclaimer: This article is for informational purposes only. All investment decisions are made solely at your own risk.