📺 Watch the Full Video Analysis
This article was automatically generated by the NFC Market Live AI analysis system. (Updated: 2026-08-06 18:24 JST)
Deep dive into Japan’s Ministry of Finance weekly securities flow report (Jul 26 – Aug 1).
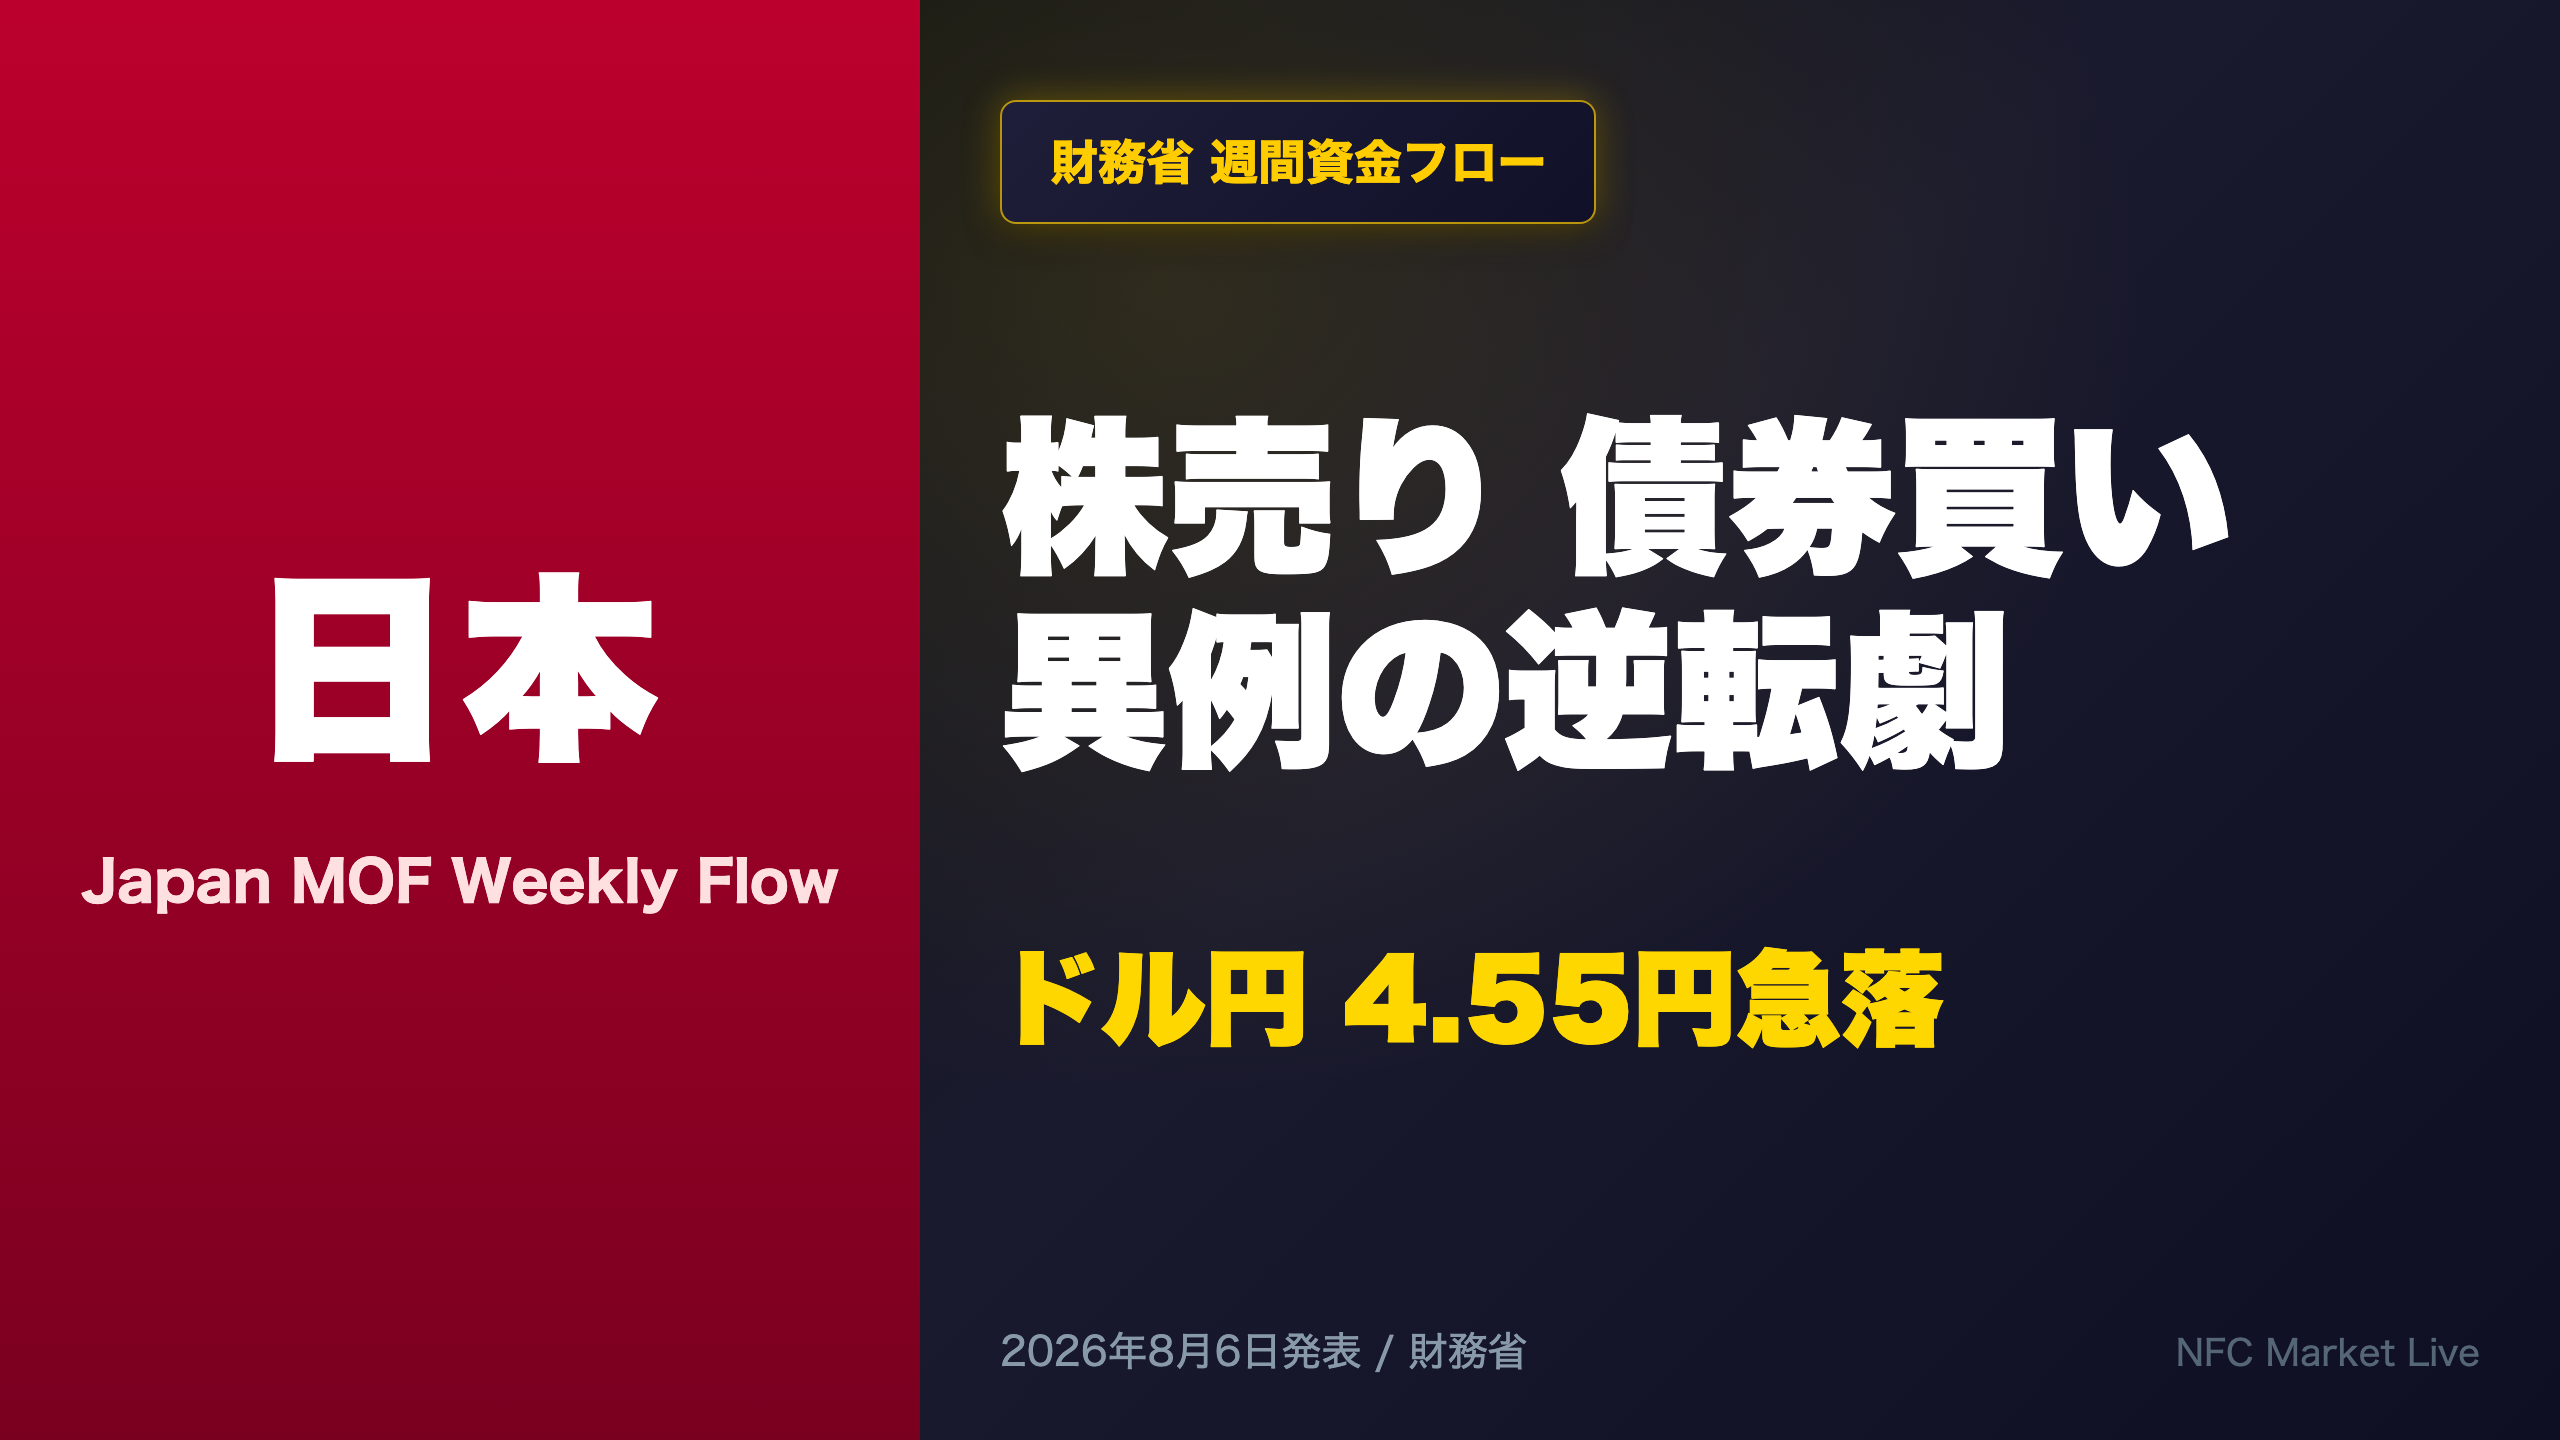
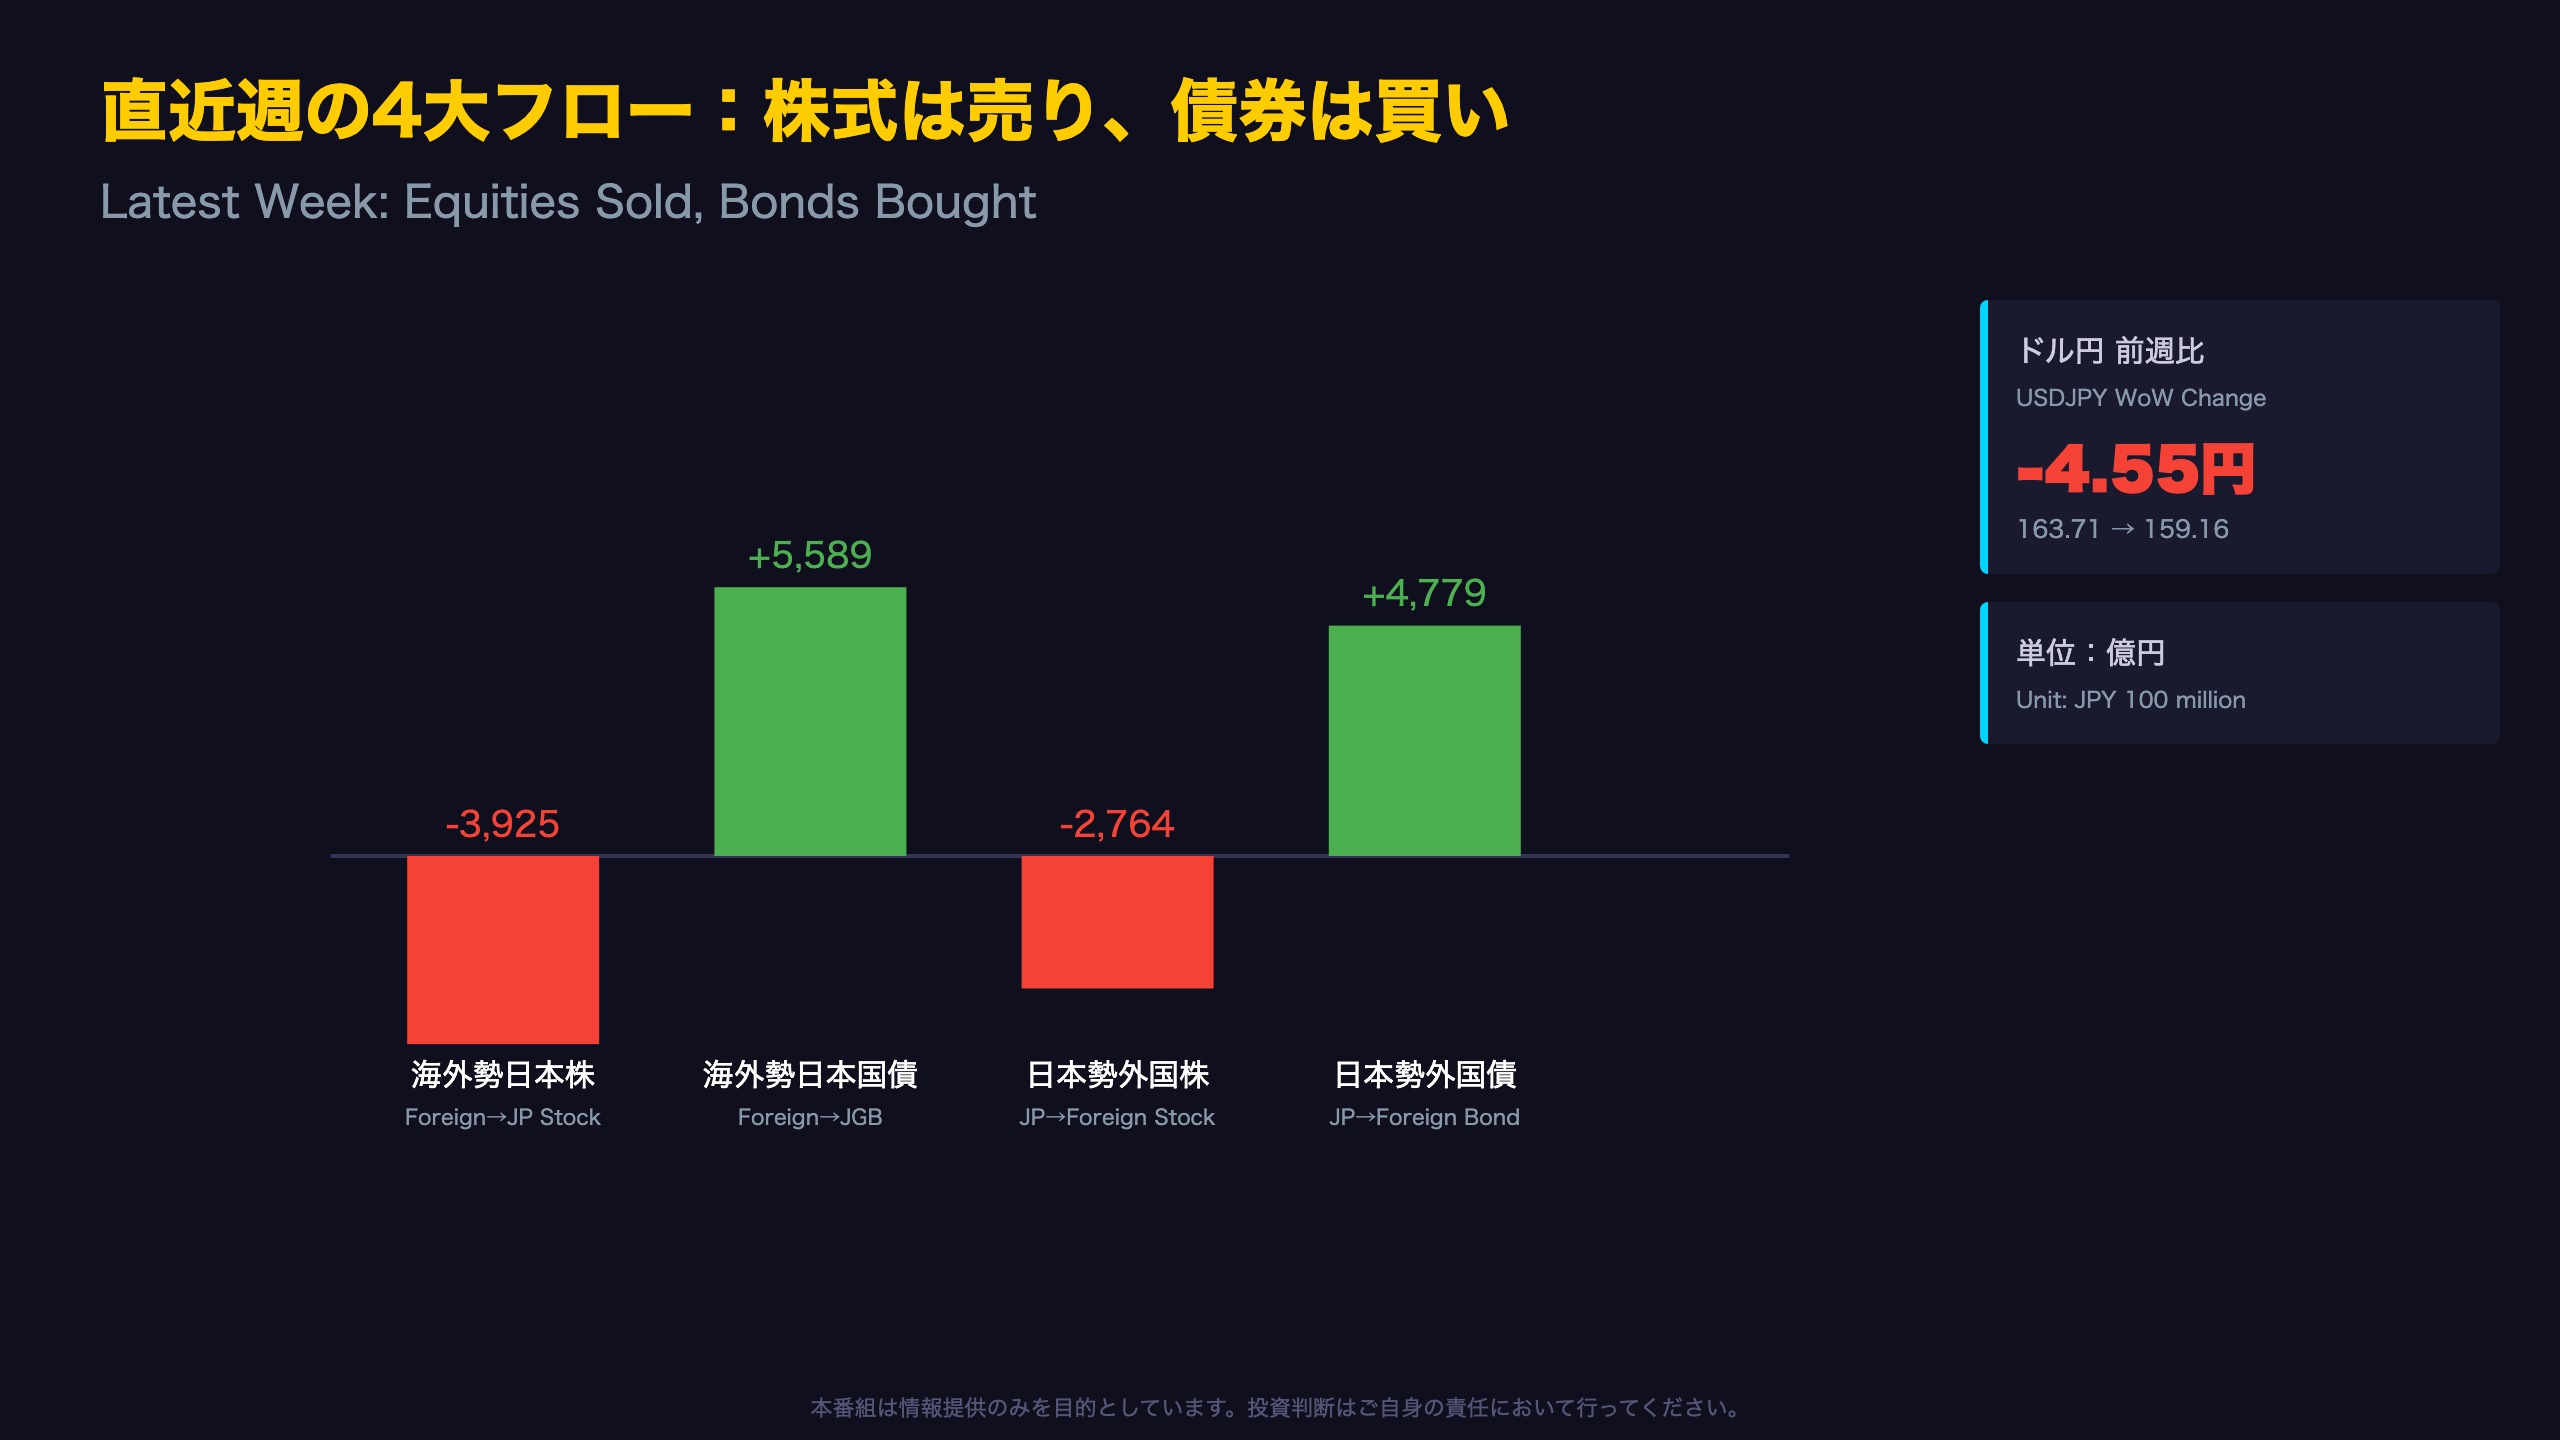
📊 Foreign investors sold ¥392.5bn of Japanese stocks
📊 Japanese investors sold ¥276.4bn of foreign stocks
📈 Foreign JGB flow reversed to +¥558.9bn (from -¥1.514tn)
📈 Japanese foreign bond flow reversed to +¥477.9bn
💱 USDJPY plunged 4.55 yen in one week: 163.71 → 159.16
A rare week where equities were sold on both sides while bonds were bought on both sides. Our 11-week cumulative analysis reveals a persistent equity outflow trend that a single week’s reversal can’t erase.
⚠️ We break down why a sharp FX move can’t be explained by flow data alone—balanced analysis of strength and weakness inside.
株式は双方売り、債券は双方買い ― 直近週の資金フロー総括
Understanding Japan’s Weekly Securities Flow Data
The Ministry of Finance’s (MOF) “International Transactions in Securities” report is one of the few high-frequency gauges of cross-border capital flows, published weekly—well ahead of Japan’s monthly Balance of Payments statistics that international investors are more familiar with.
This Week’s Figures
| Category | This Week | Prior Week |
|---|---|---|
| Foreign buying of Japanese stocks | -¥392.5bn | +¥912.4bn |
| Foreign buying of JGBs (long-term) | +¥558.9bn | -¥1,514.1bn |
| Japanese buying of foreign stocks | -¥276.4bn | +¥289.1bn |
| Japanese buying of foreign bonds | +¥477.9bn | -¥810.1bn |
Notably, all four flow categories flipped sign week-over-week—a relatively rare occurrence even across a full year of data.
One caveat for international readers: MOF data is reported on a trade/contract date basis, not settlement date, so timing can diverge from actual cash movements.
For comparison, U.S. TIC (Treasury International Capital) data is published monthly with roughly a six-week lag, making Japan’s weekly release comparatively fast. Whether this week’s reversal marks the start of a trend or a one-off rebalancing remains unclear from a single data point—next Tuesday’s release will be the first real test.
債券フローの急反転 ― 海外勢の日本国債買いは1週間で2兆円改善
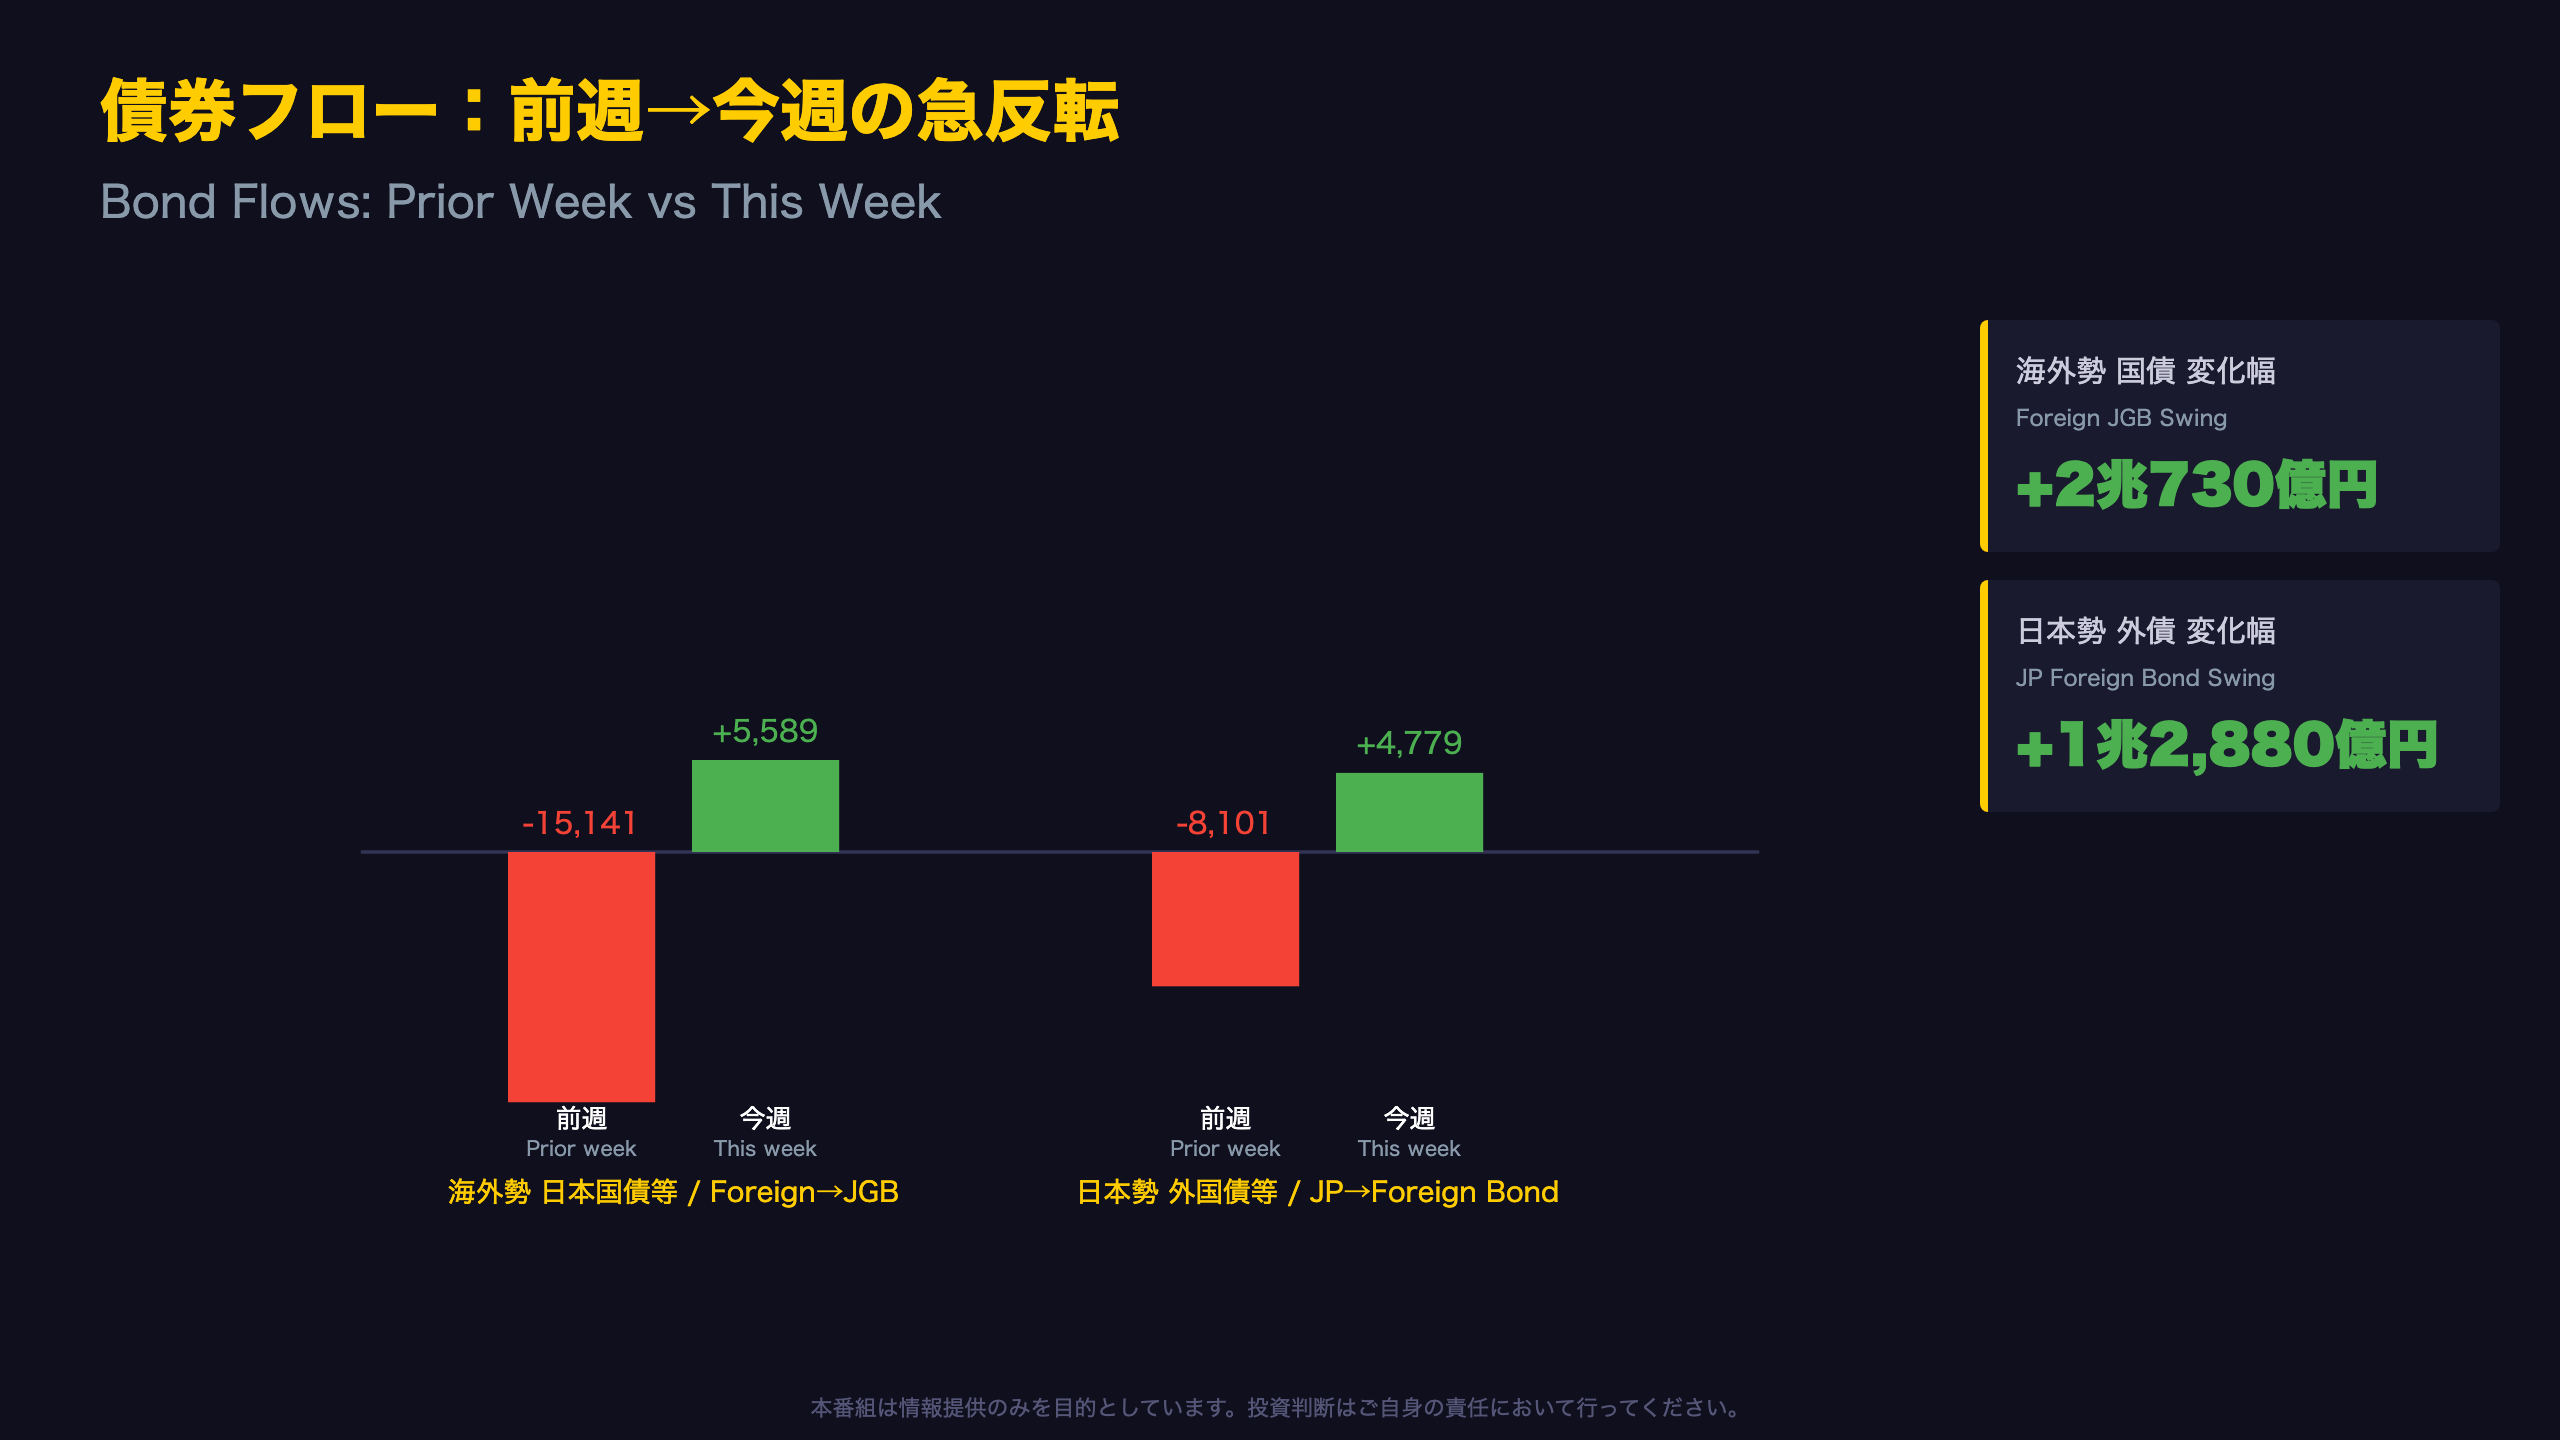
Breaking Down the Bond Flow Reversal
In absolute terms, the swing in foreign JGB flows was approximately ¥2.07 trillion (from a ¥1,514.1bn sell-off to a ¥558.9bn purchase), while the swing in Japanese investors’ foreign bond flows was about ¥1.29 trillion.
Short-Term Bills Moved the Opposite Way
While headlines focus on long-term bonds, foreign investors’ flows into short-term Japanese bills remained negative at -¥292.9bn, moving opposite to the long-term reversal.
When long-term and short-term bond flows diverge, it can suggest a shift in duration preference—investors potentially taking on more interest-rate risk. This is a moderate-confidence (Level B) inference, not a confirmed structural signal.
This pattern differs from how U.S. Treasury flows are typically analyzed, where short-end moves are often driven by money-market and repo dynamics rather than duration positioning. Confirming persistence will require watching the next several weekly releases, particularly around the Bank of Japan’s policy meeting calendar.
11週間で見える構造 ― 海外勢・日本勢ともに株式売り越し
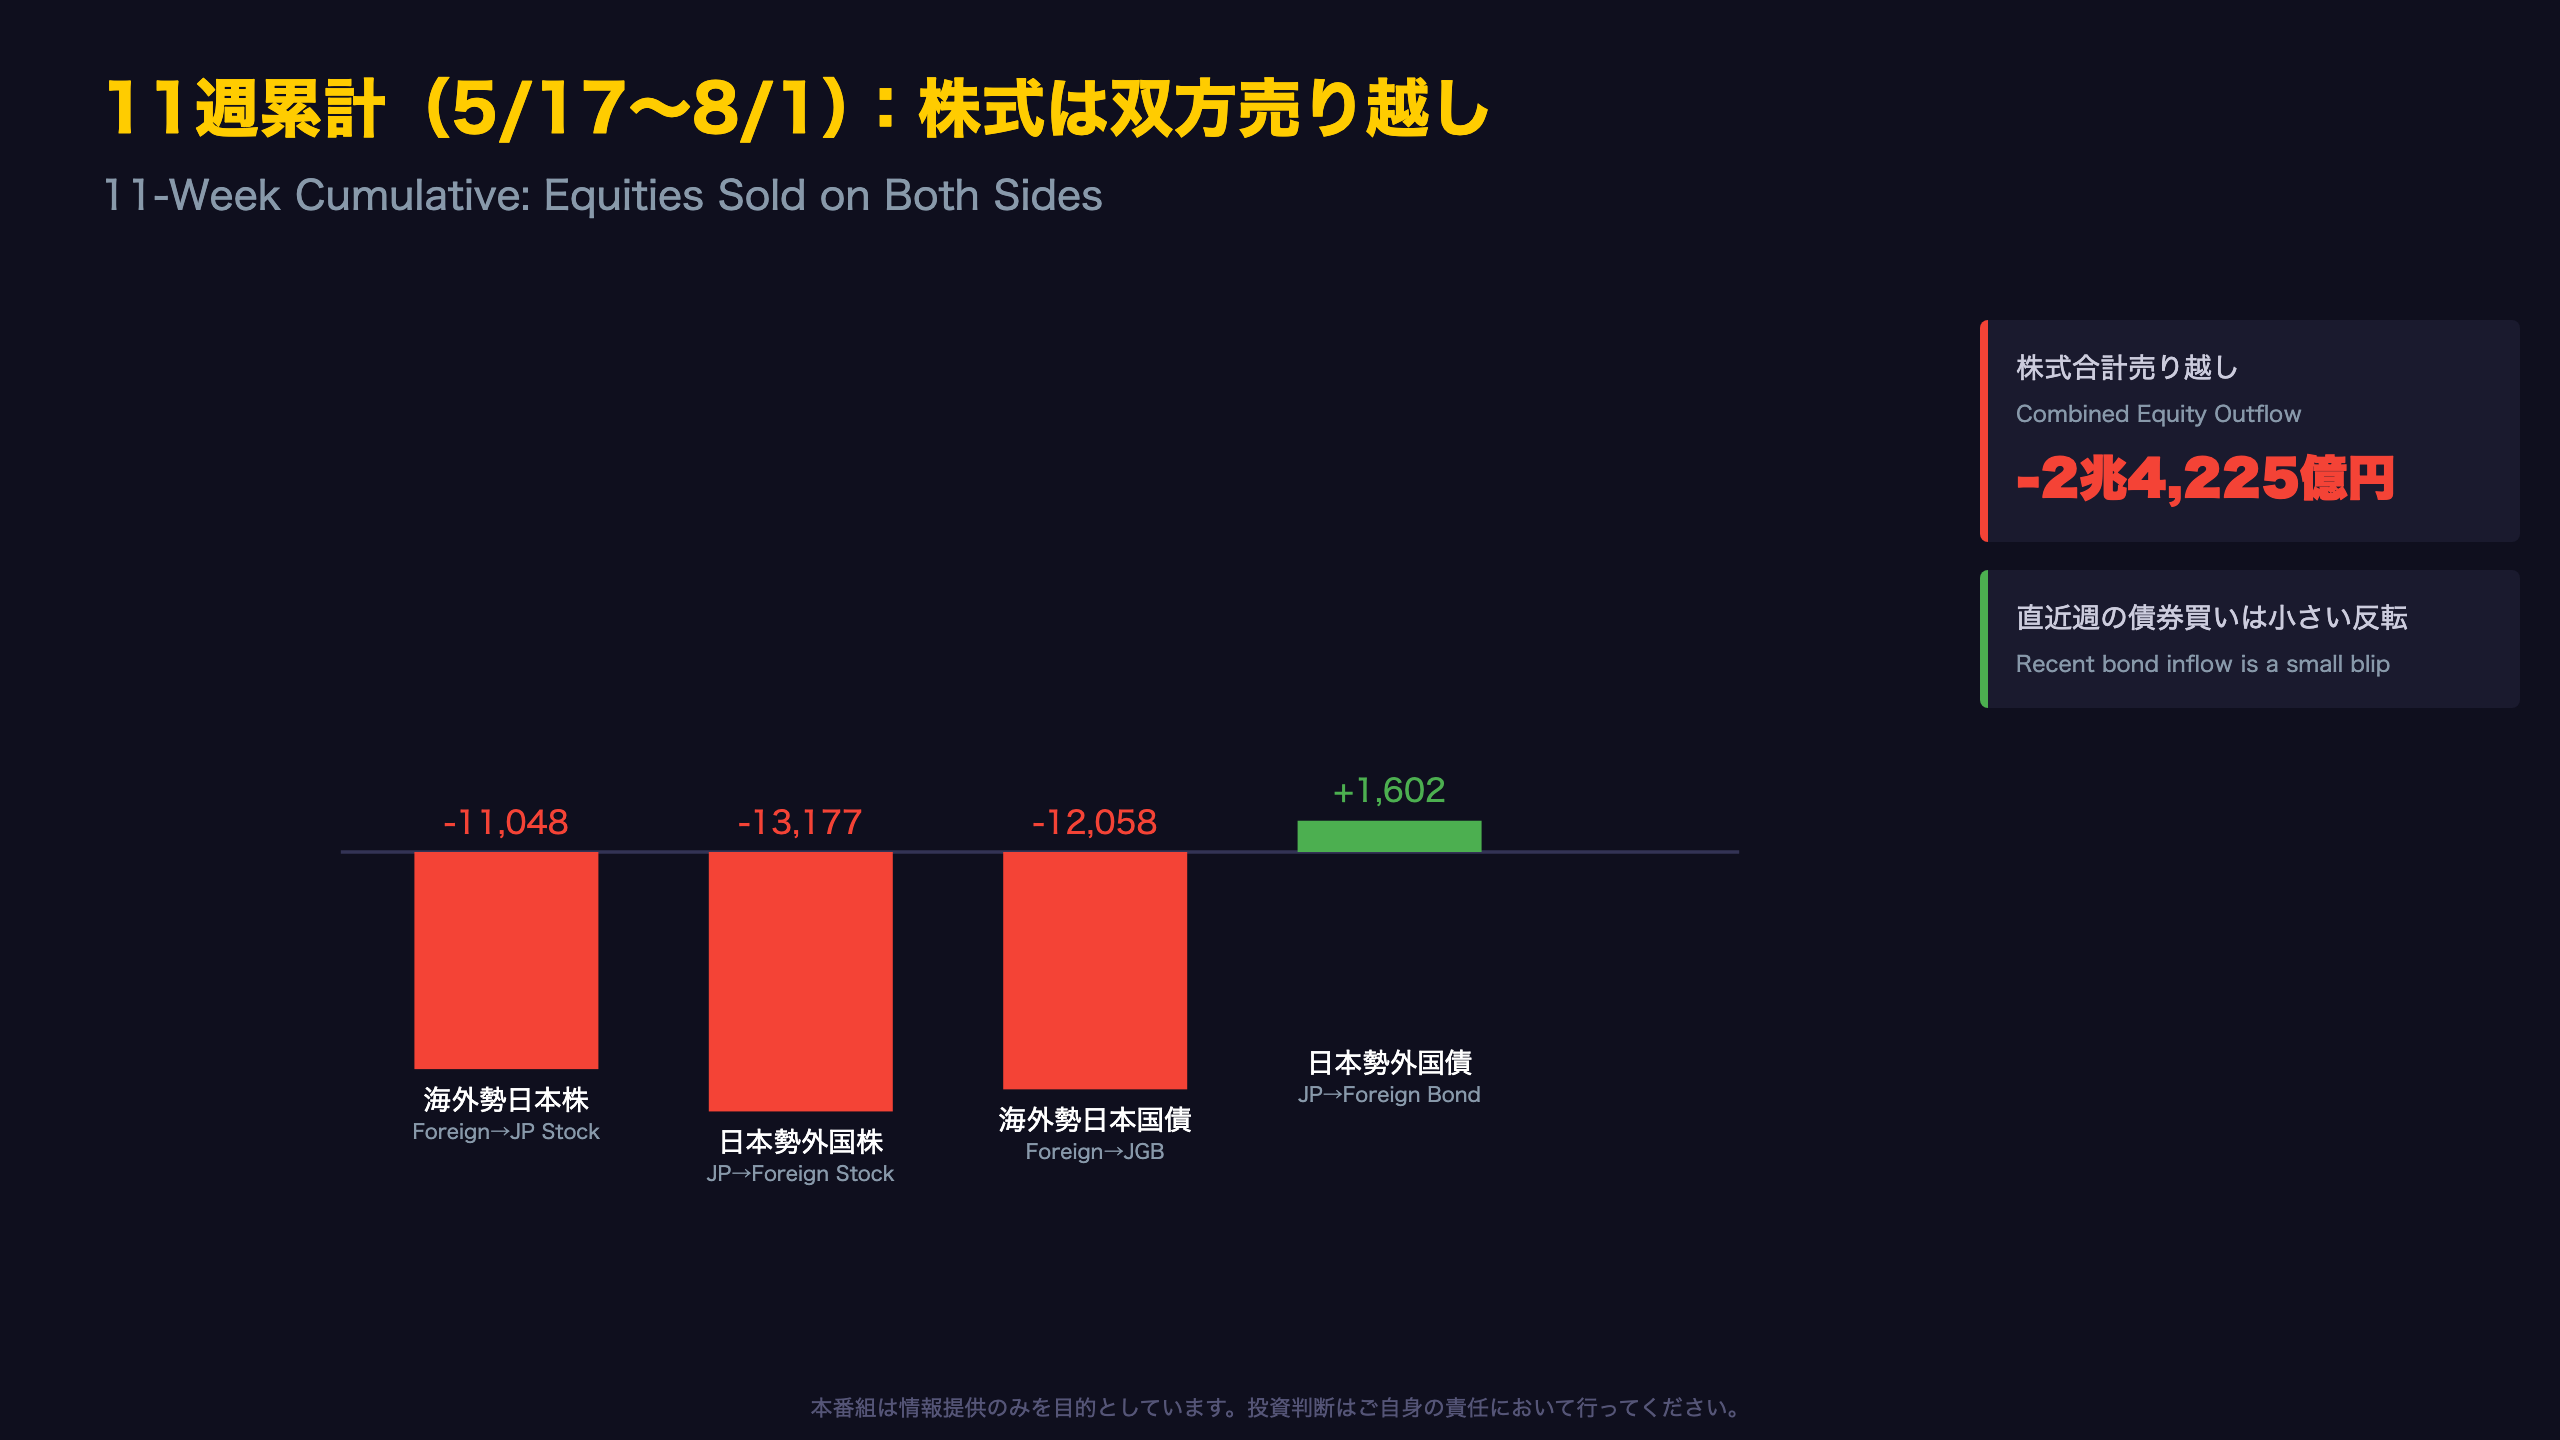
What 11 Weeks Reveal That a Single Week Cannot
Single-week flow data is prone to reversals and can mislead in isolation. Aggregating over multiple weeks reveals a clearer picture. Cumulative flows from May 17 to August 1 (11 weeks):
| Category | 11-Week Cumulative |
|---|---|
| Foreign flows into Japanese stocks | -¥1.1048tn |
| Japanese flows into foreign stocks | -¥1.3177tn |
| Foreign flows into JGBs | -¥1.2058tn |
| Japanese flows into foreign bonds | +¥160.2bn |
An Asymmetric Pattern
Equities show large net selling from both foreign and Japanese investors, while bonds show a milder foreign outflow and near-neutral Japanese flows. This asymmetry may suggest investors are broadly reducing equity risk while being more selective on bonds (a moderate-confidence, Level-B inference)—though it cannot be confirmed as structural from flow data alone.
For U.S. and European readers: this “equity de-risking, selective bond holding” pattern echoes global risk-off dynamics seen during periods of rate uncertainty, though Japan-specific factors (earnings season, political calendar) could equally be at play.
Critically, the recent week’s bond inflows (+¥558.9bn and +¥477.9bn) are small relative to this 11-week trend—not nearly large enough to reverse the broader pattern.
ドル円163円台から159円台へ ― 1週間で4.55円の急落
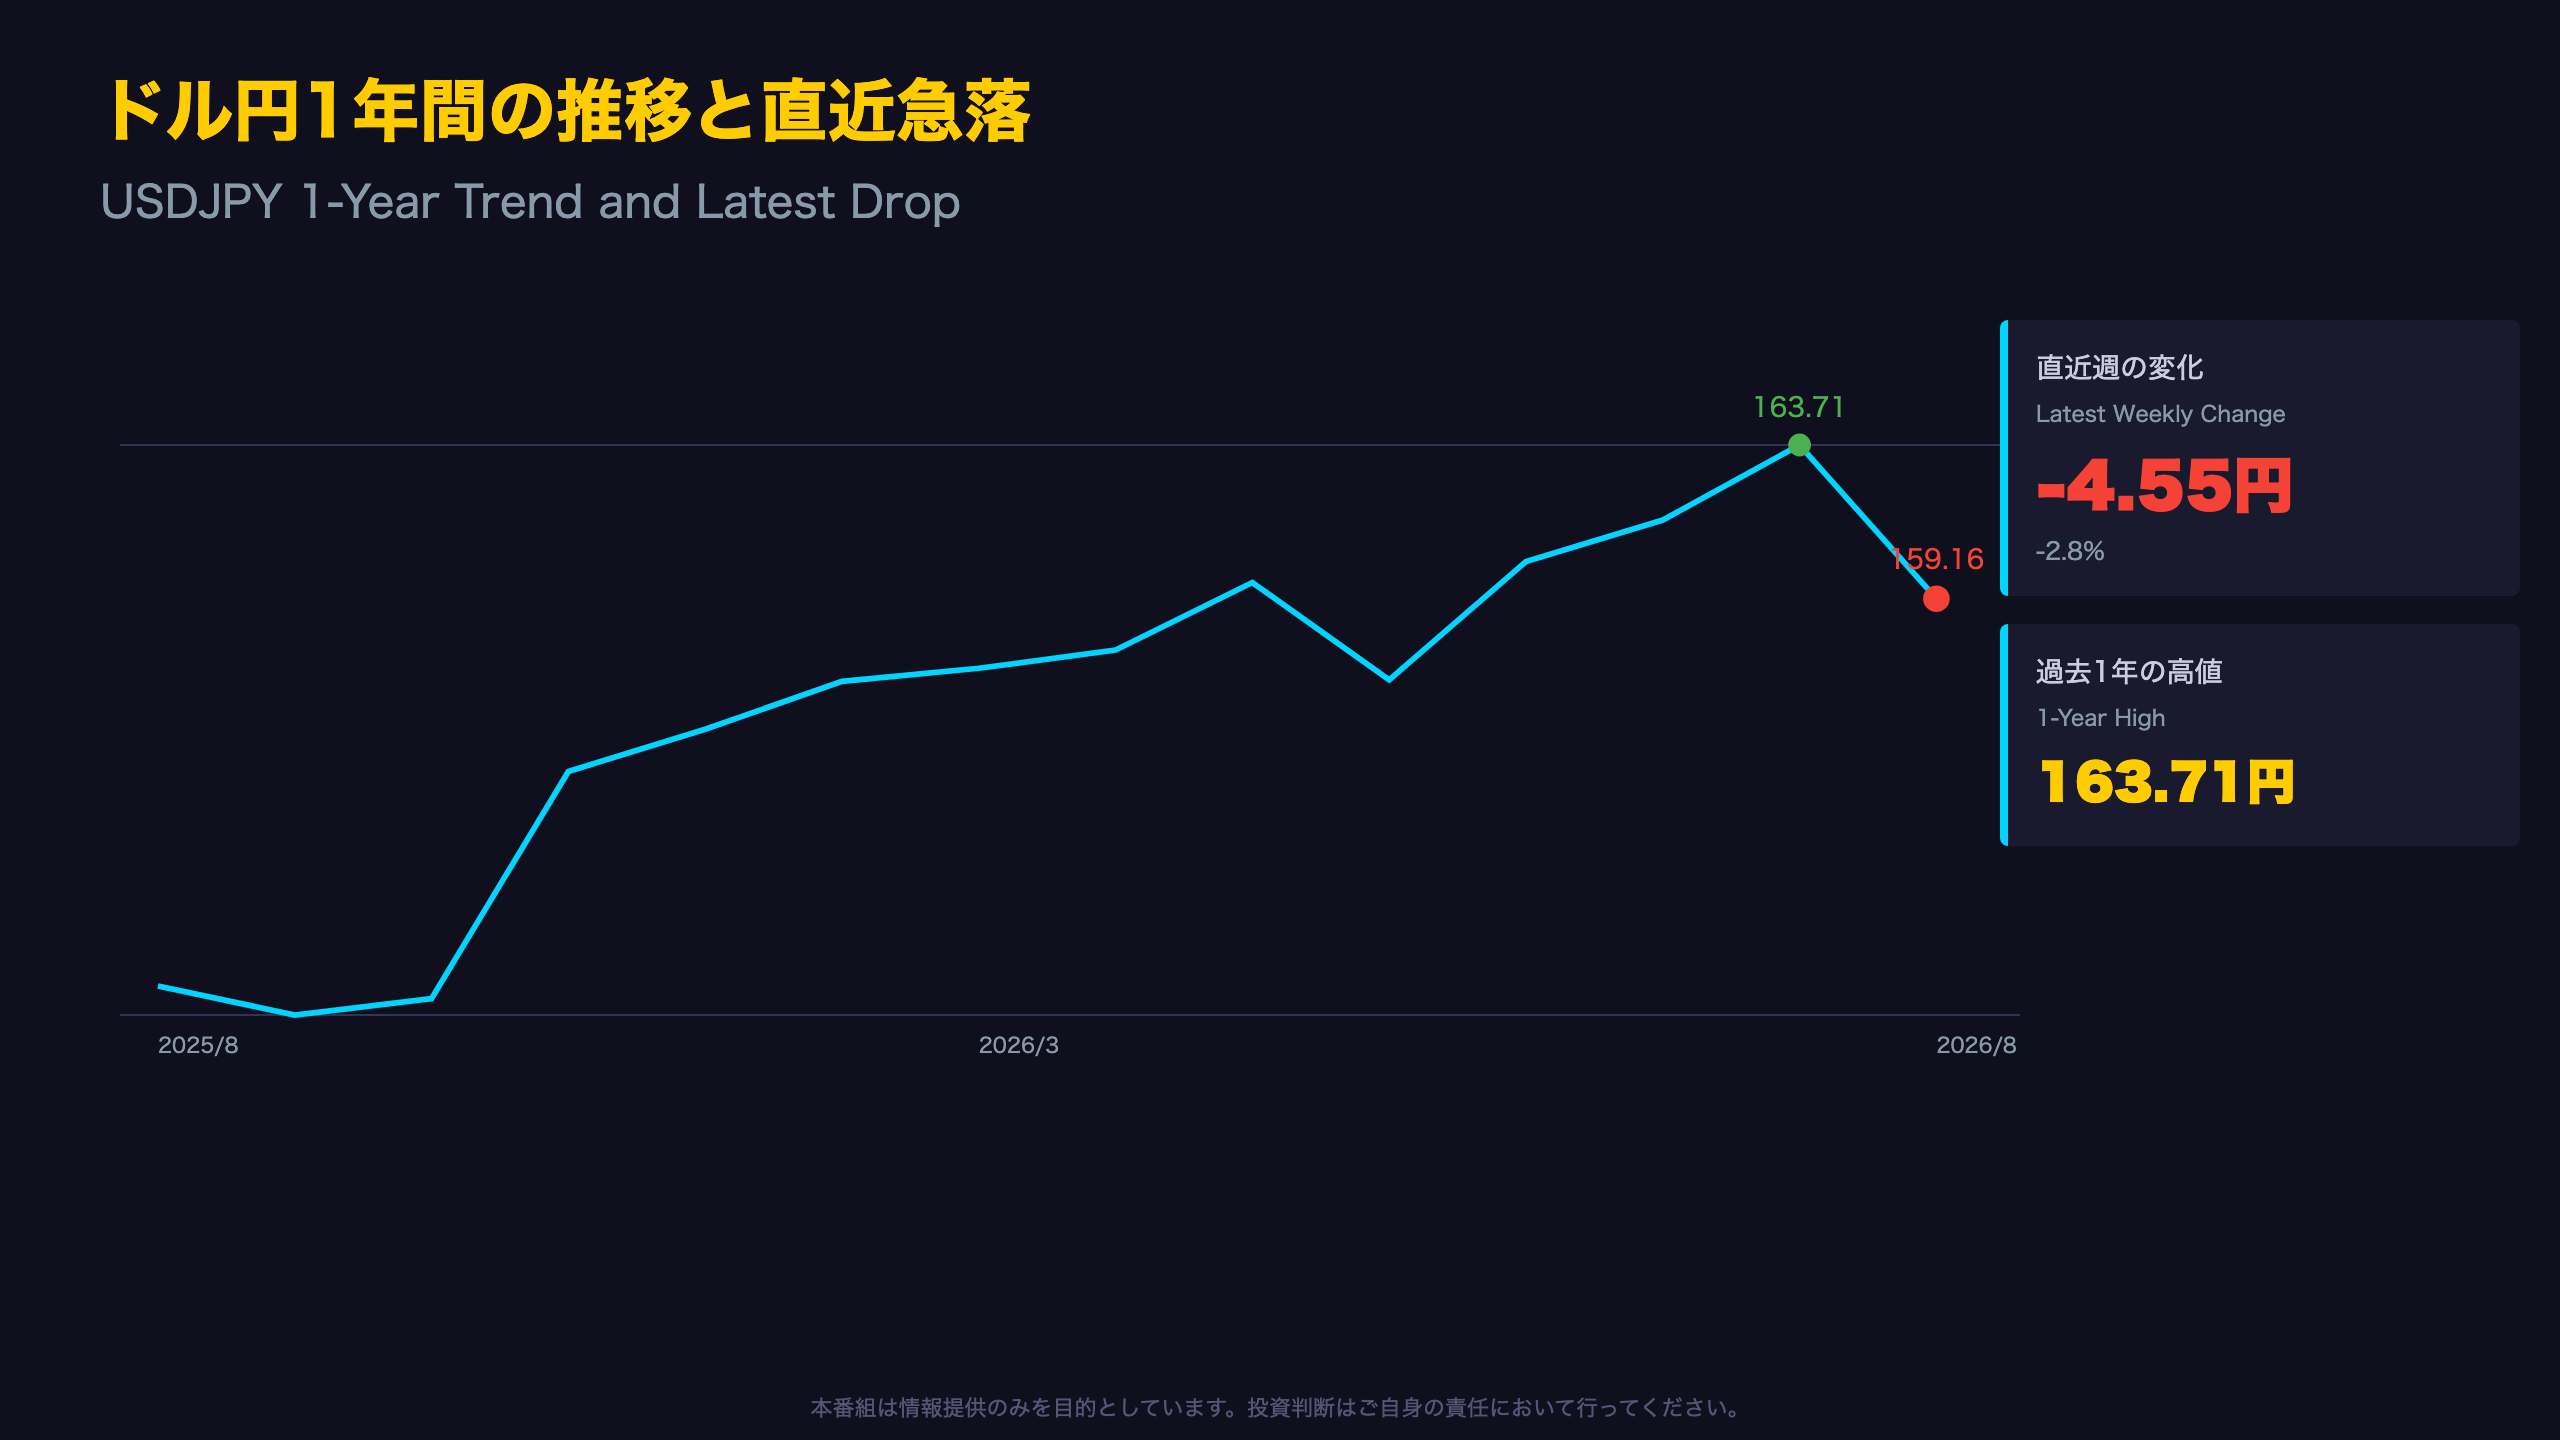
A Year in USDJPY
Tracing 52 weeks of data, USDJPY rose gradually from the 147 level in August 2025 to the 160 level by March-April 2026, briefly retreating to the 156 range in early May before climbing again to a one-year high of 163.71 on July 25.
Contextualizing the Latest Drop
The move from 163.71 to 159.16 is a relatively large weekly swing compared to the past year’s typical range, where most weeks stayed within roughly plus-or-minus 3 yen. A 4.55-yen move ranks among the larger weekly changes in the dataset.
That said, similarly sized weekly swings have occurred before (e.g., the jump to 151.94 in the week of October 5-11, 2025), so this move is not entirely unprecedented in scale.
Why This Matters for International Investors
Unlike the U.S. dollar, where Fed policy dominates flow narratives, the yen is particularly sensitive to Bank of Japan policy expectations and U.S.-Japan rate differentials. The equivalent Japan-side variable for readers used to watching Fed Funds futures is BOJ rate-hike pricing alongside these MOF weekly flow releases. Whether USDJPY stabilizes near 159 or reverts toward 163 next week will be a key signal of whether this reversal has legs.
強さと弱さの両論 ― 国債需要の復調と株式離れの継続
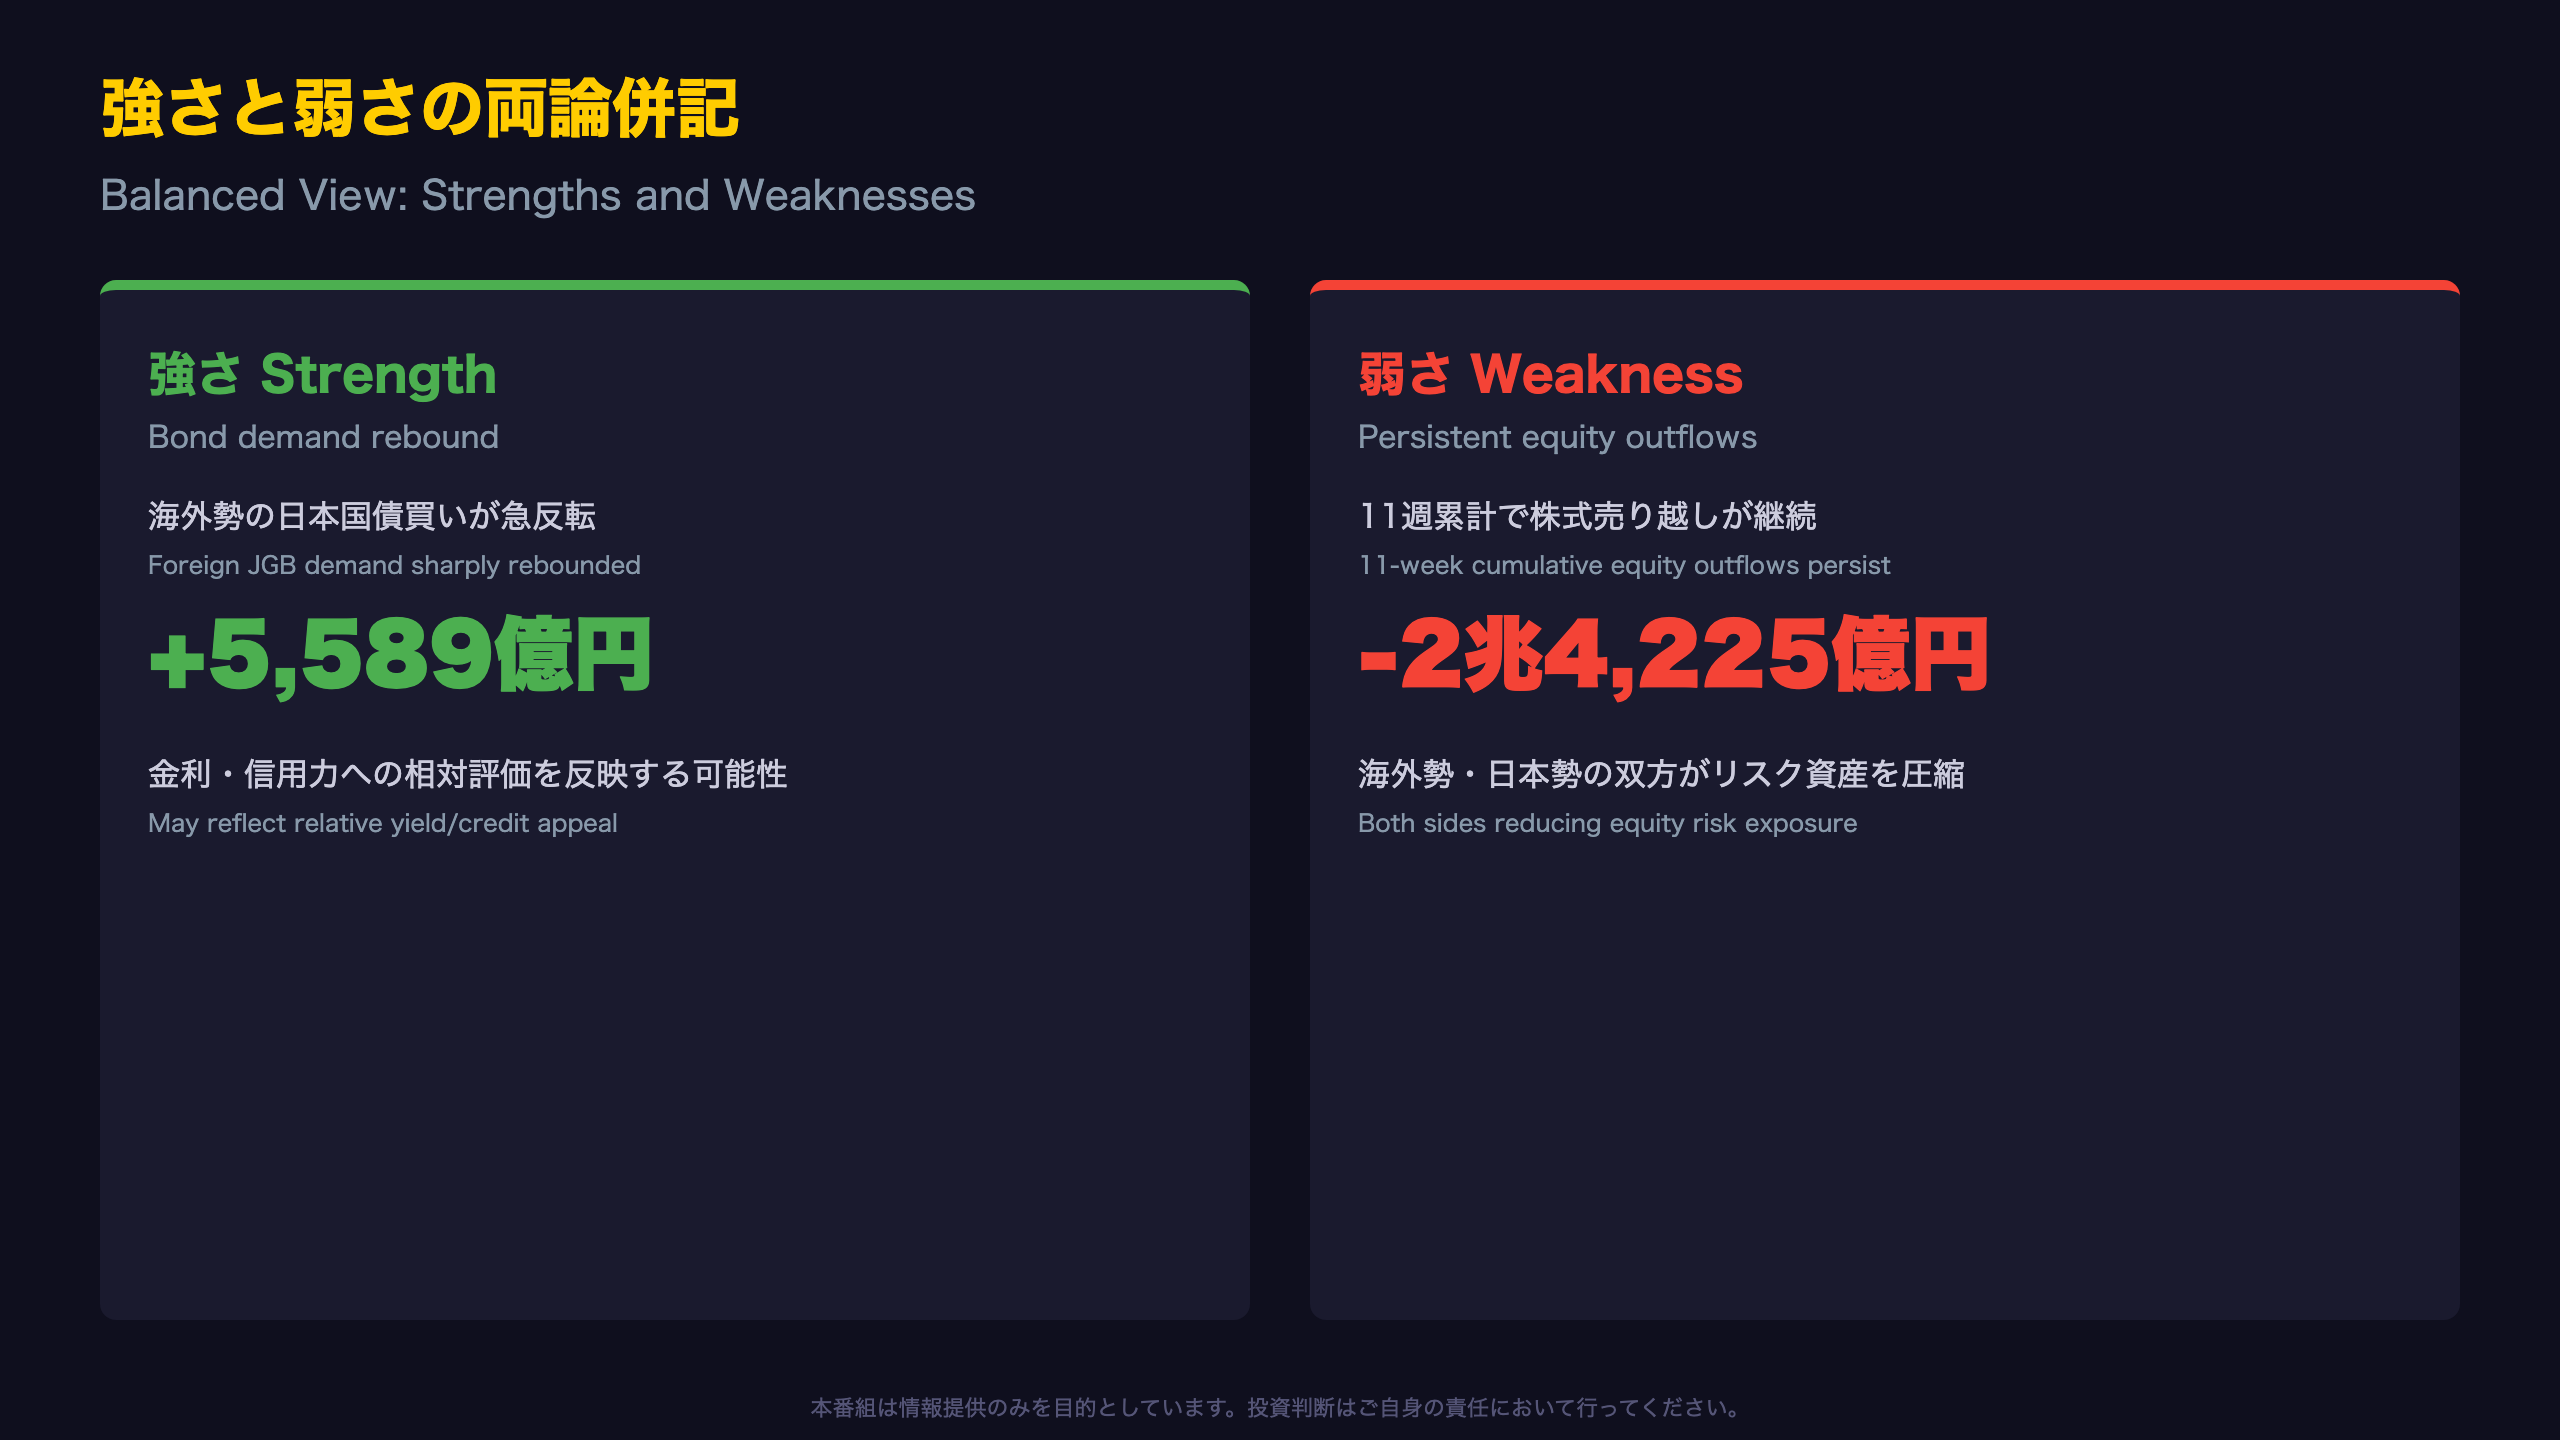
Weighing the Bull and Bear Case
The Bullish Signal
Foreign demand for JGBs reversed sharply from heavy selling to a net purchase of 558.9 billion yen. If driven by relative yield or credit appeal, this could be a constructive signal for Japan’s bond market—though a single week is not enough to confirm a trend.
The Bearish Signal
Cumulative 11-week equity flows are negative for both foreign and Japanese investors. Japanese investors’ foreign equity selling (-¥1.3177tn) is particularly notable, potentially indicating domestic investors are reducing exposure to overseas equity risk—perhaps a form of “home bias” reasserting itself.
Balancing the Two
At this point, a bond-side recovery signal coexists with equity-side persistent weakness. Emphasizing only one side would misrepresent the data.
For context, this dual pattern echoes periods when Japanese pension funds and life insurers—major players in these flows—rotate allocations between domestic bonds and global equities based on currency-hedged yield calculations. Whether the bond rebound continues while equity selling eases, or vice versa, will be the key variable to track in coming weekly releases.
市場へのインプリケーション ― 為替・株式・金利への含意
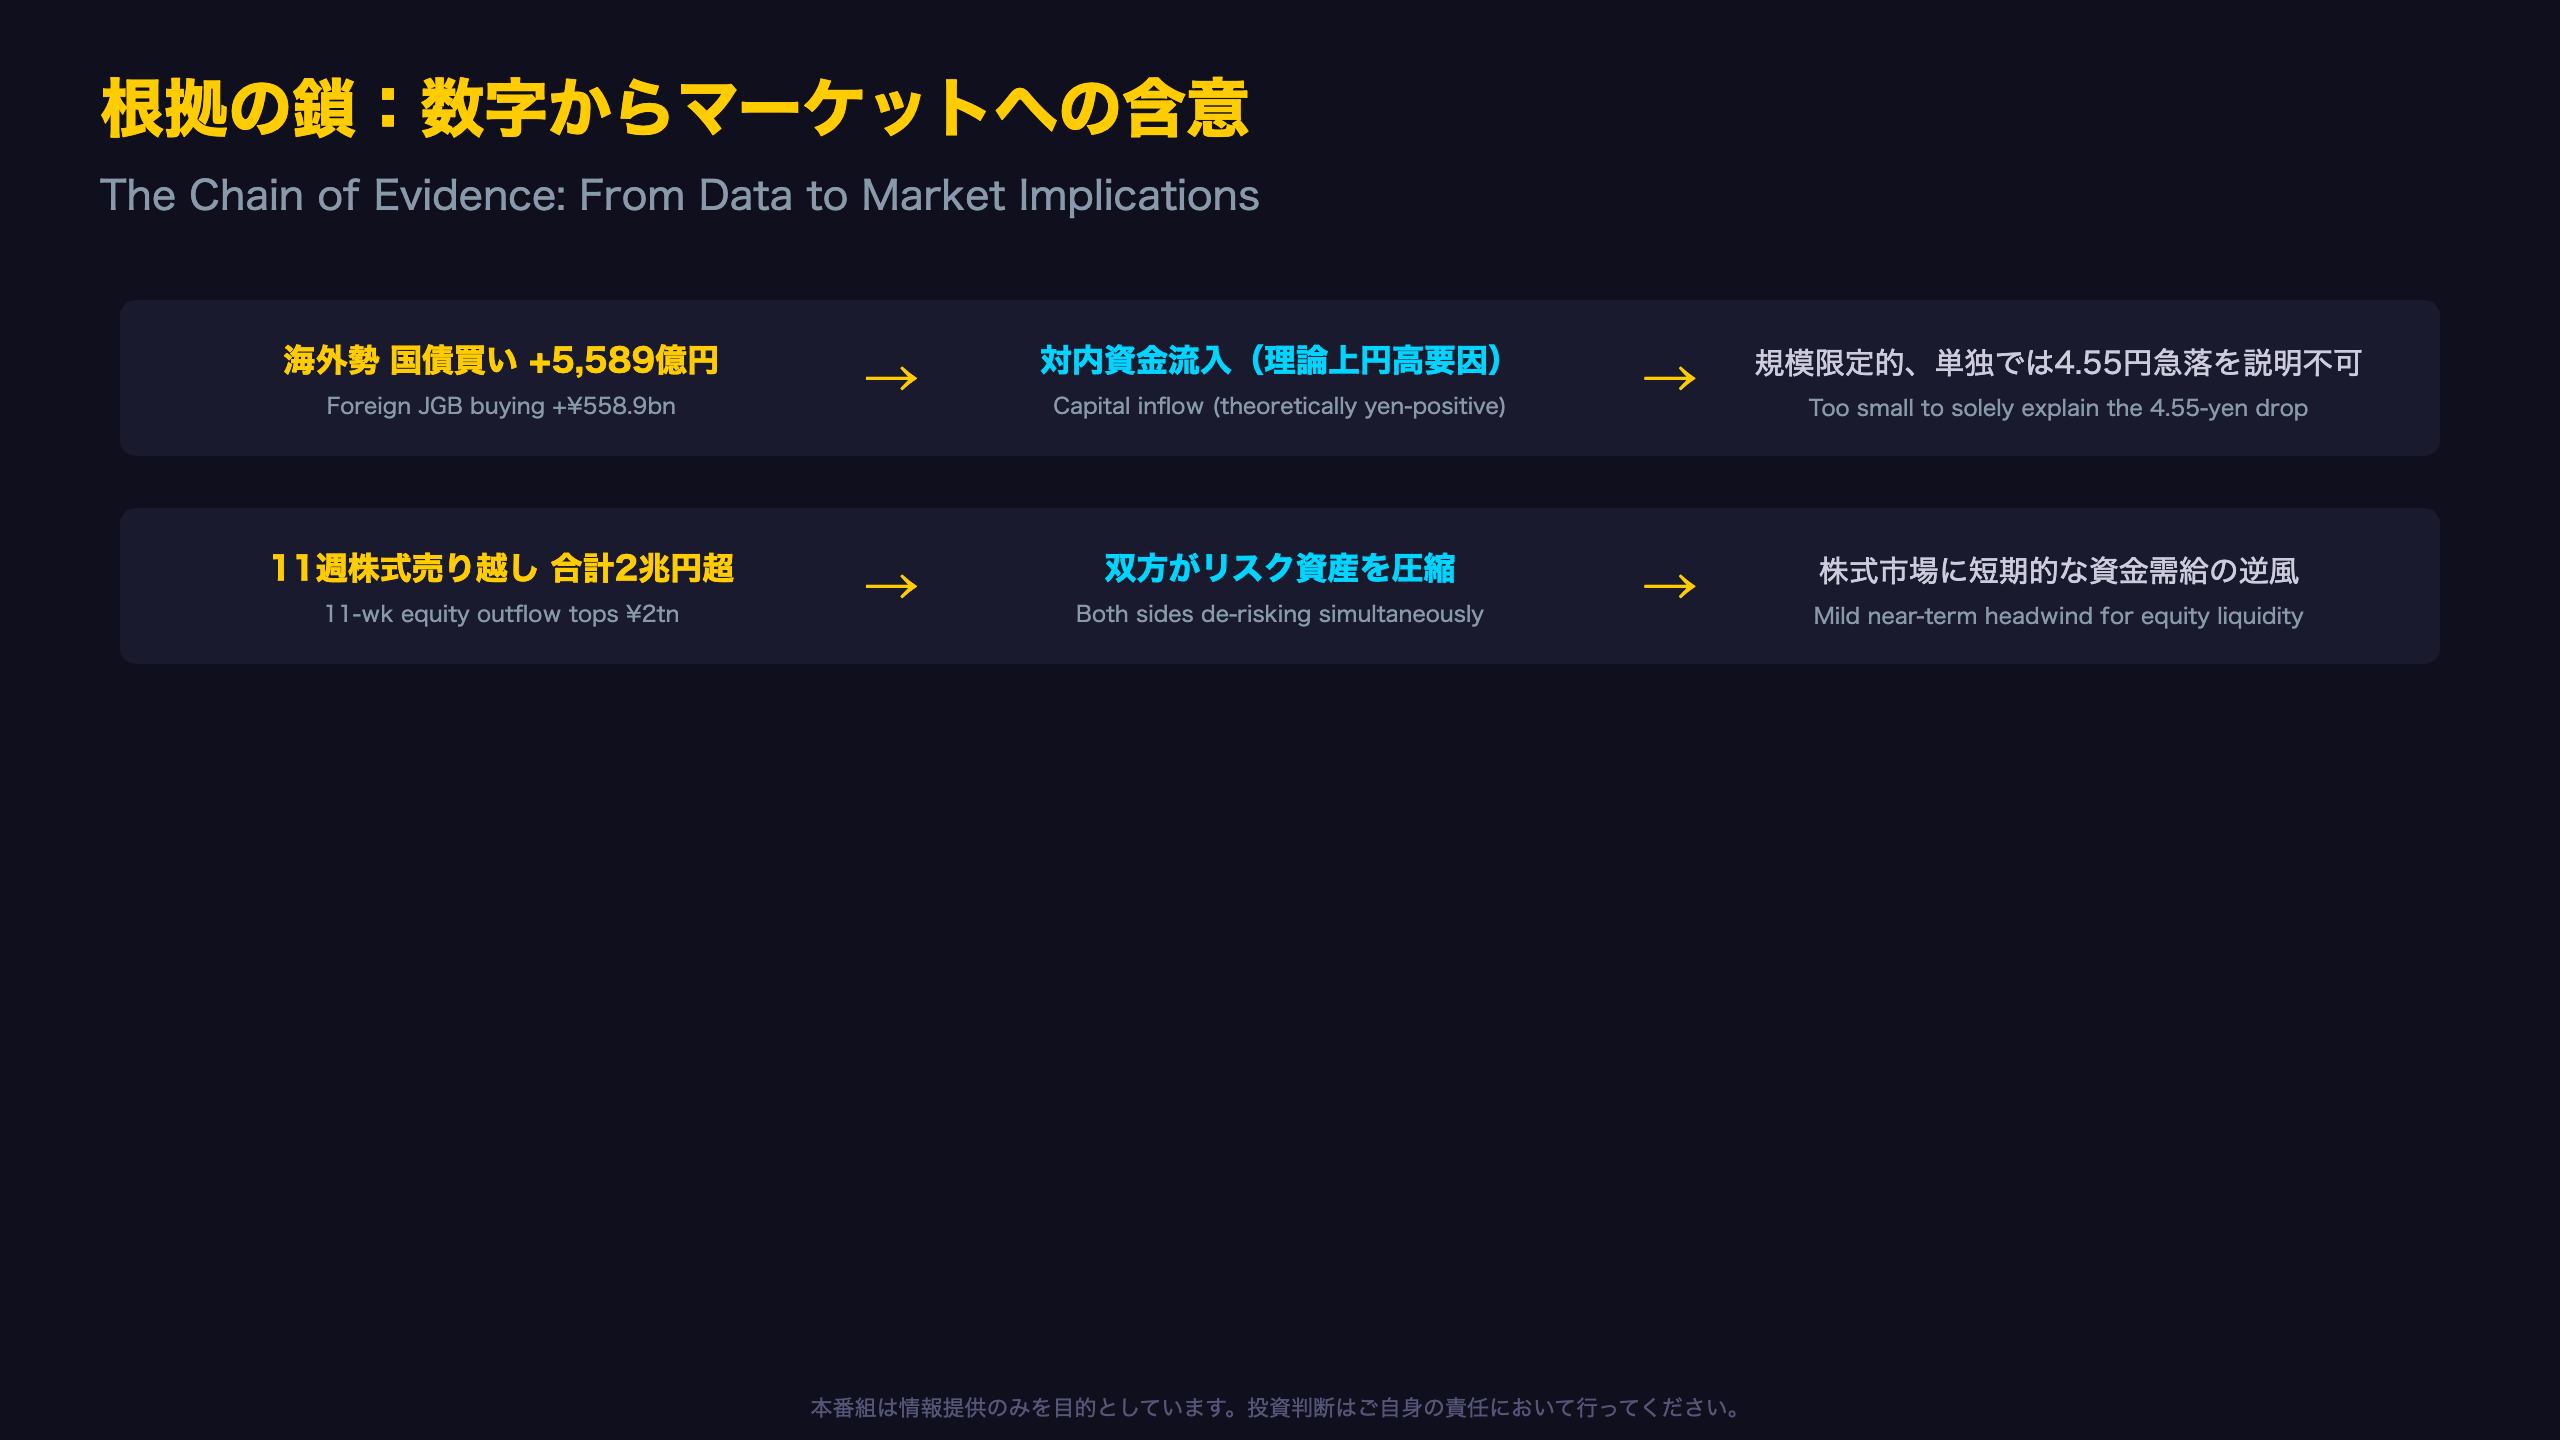
Market Implications From This Week’s Data
Currency Implications
Foreign JGB inflows (+¥558.9bn) → net capital inflows are theoretically yen-supportive → but the scale is too small to independently explain the 4.55-yen drop in USDJPY. It is more reasonable to attribute the move to a combination of factors, including shifting rate-differential expectations and monetary policy speculation, rather than this flow data alone.
Equity Market Implications
Combined 11-week equity outflows exceeding ¥2 trillion from both foreign and Japanese investors → both sides simultaneously reducing risk exposure → implies a mild near-term headwind for equity market liquidity, both domestic and international. Whether this represents a structural capital reallocation or a temporary risk adjustment cannot be confirmed from this data alone.
What to Watch Next
The next MOF release is due the following Tuesday, as usual. Key questions: does bond inflow persist, and does equity selling ease? Also watch whether USDJPY stabilizes near 159 or reverts toward 163—this will help confirm whether currency markets are responding to these flow dynamics or other drivers.
This analysis is based on contract-date flow data from Japan’s Ministry of Finance and does not constitute a forecast. International investors should cross-reference this with BOJ policy statements and U.S. Treasury yield movements for a fuller picture.
Disclaimer: This article is for informational purposes only. All investment decisions are made solely at your own risk.