📺 Watch the Full Video Analysis
This article was automatically generated by the NFC Market Live AI analysis system. (Updated: 2026-08-07 14:08 JST)
📄 Primary Source
内閣府経済社会総合研究所
https://www.esri.cao.go.jp/jp/stat/di/202606psummary.pdf
📊 Breaking down Japan’s Cabinet Office Composite Index (June 2026 preliminary).
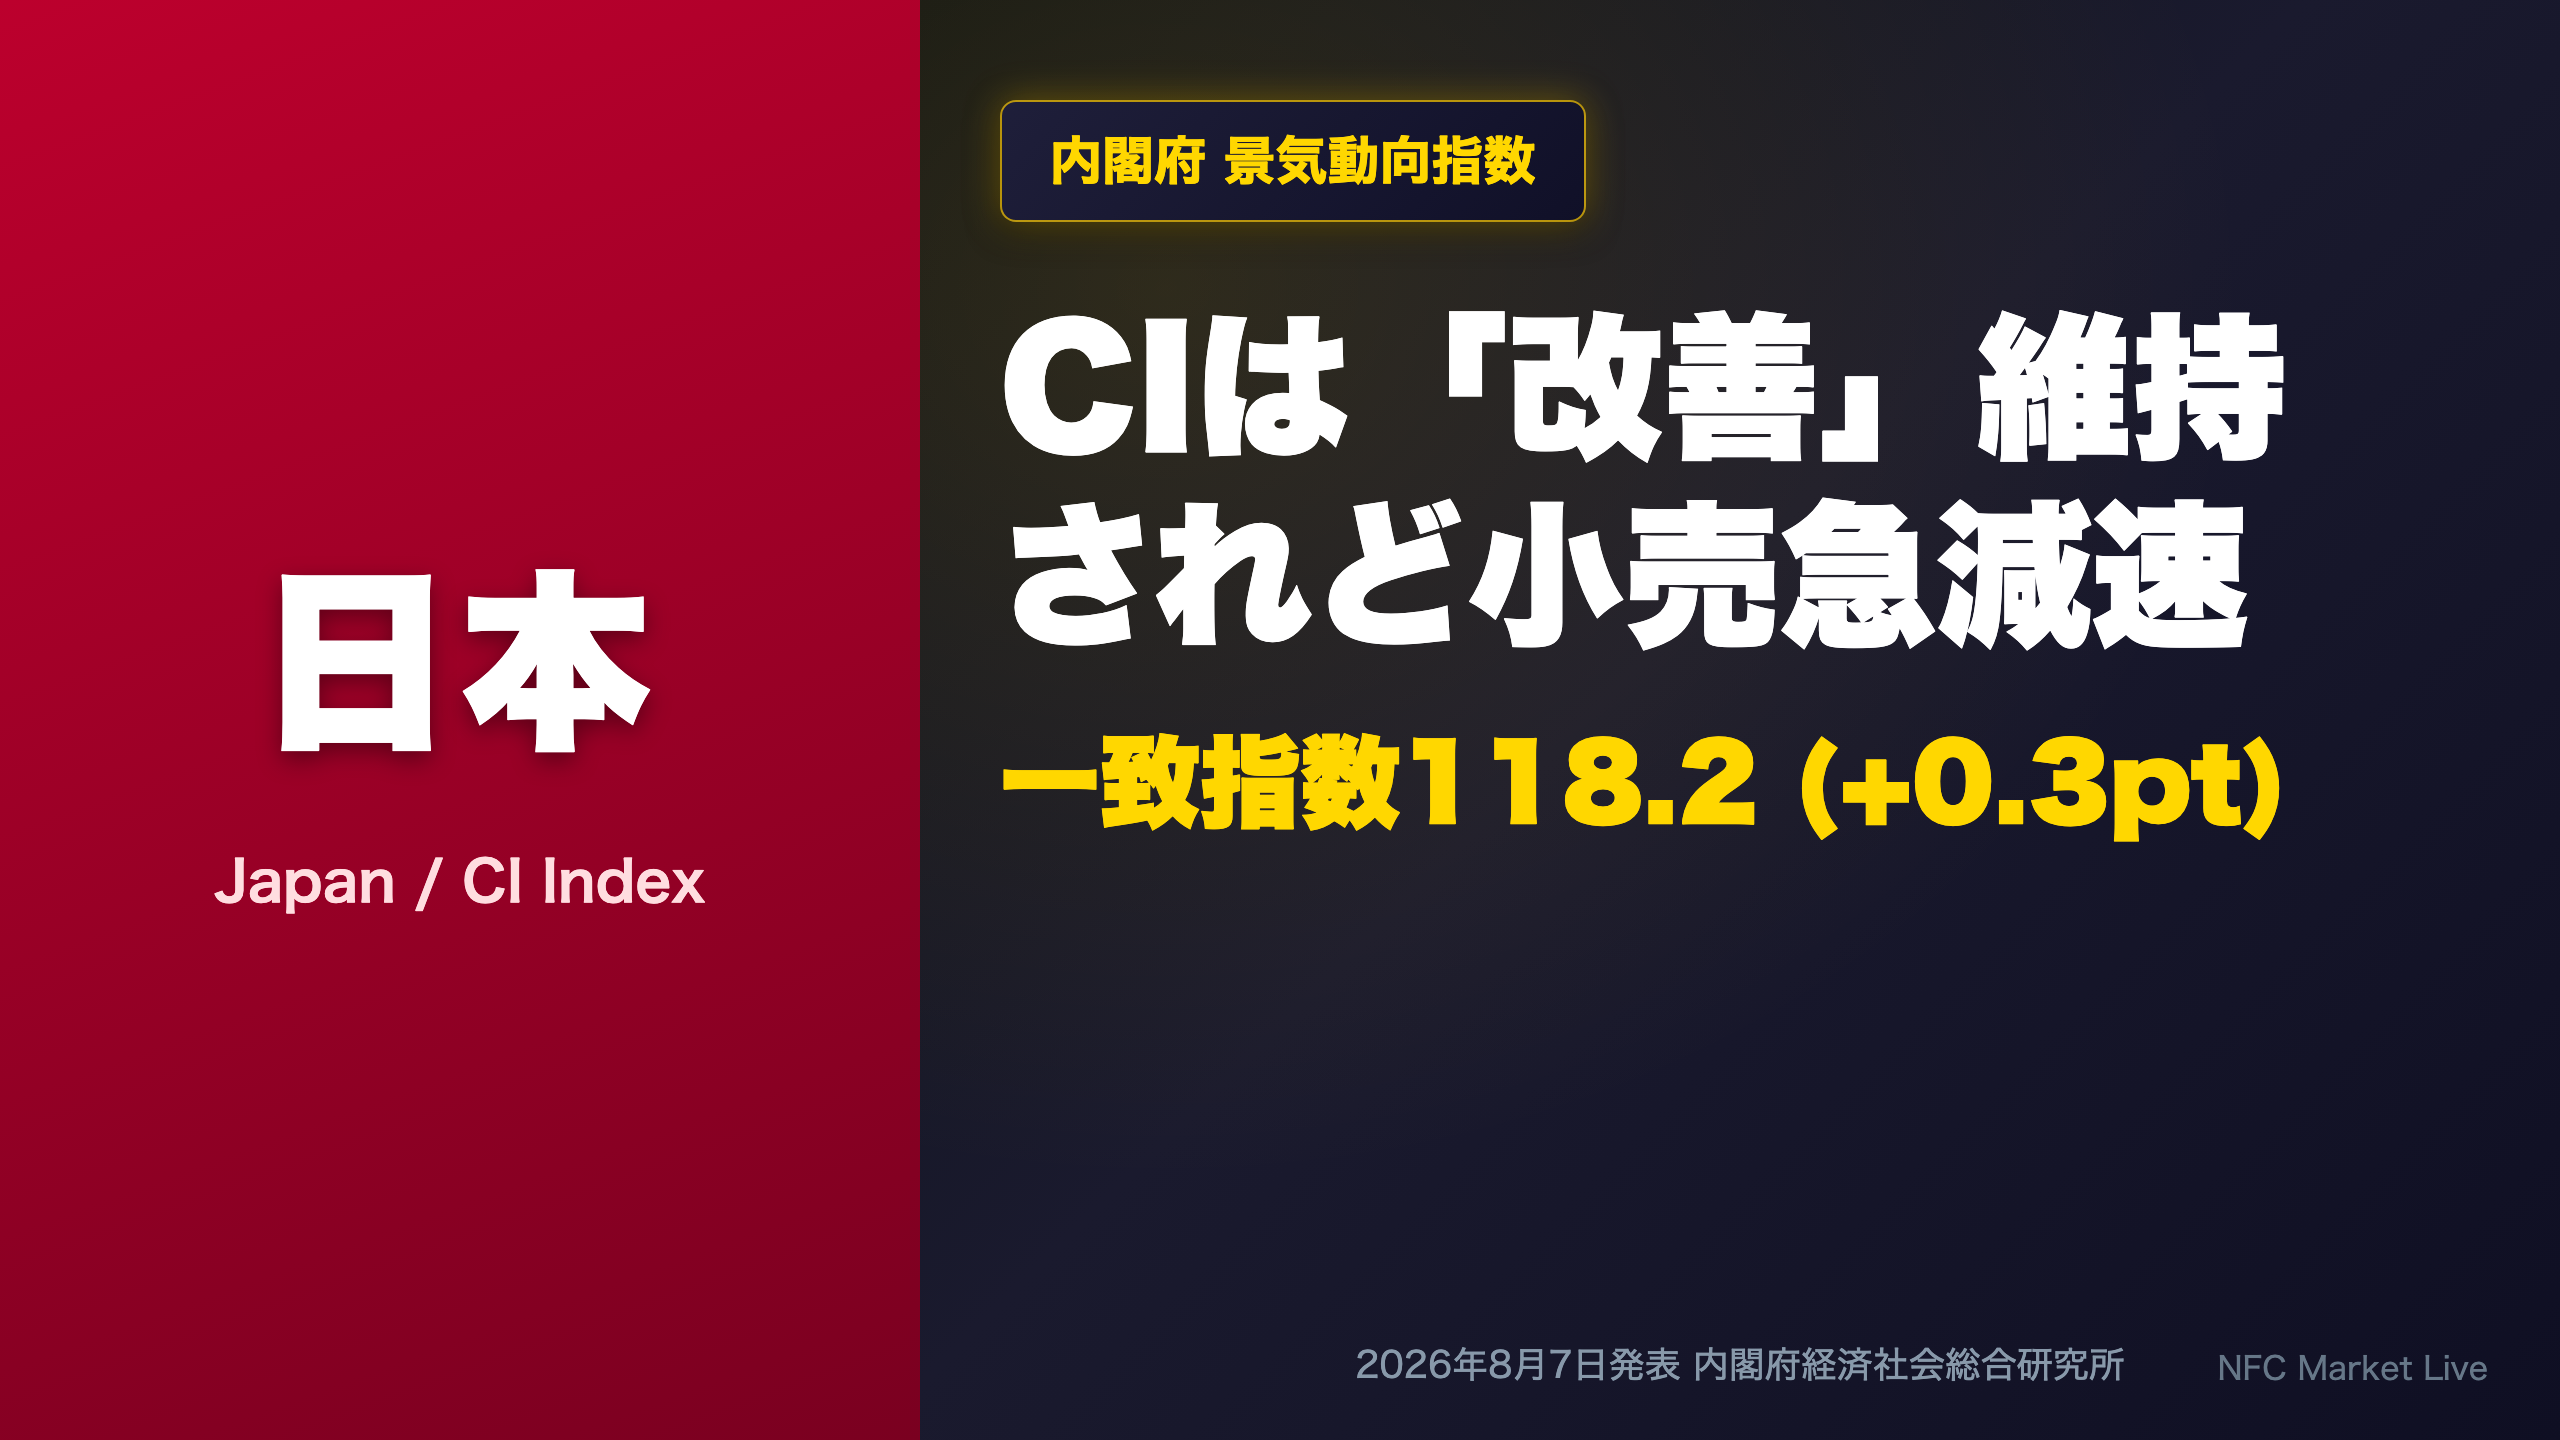
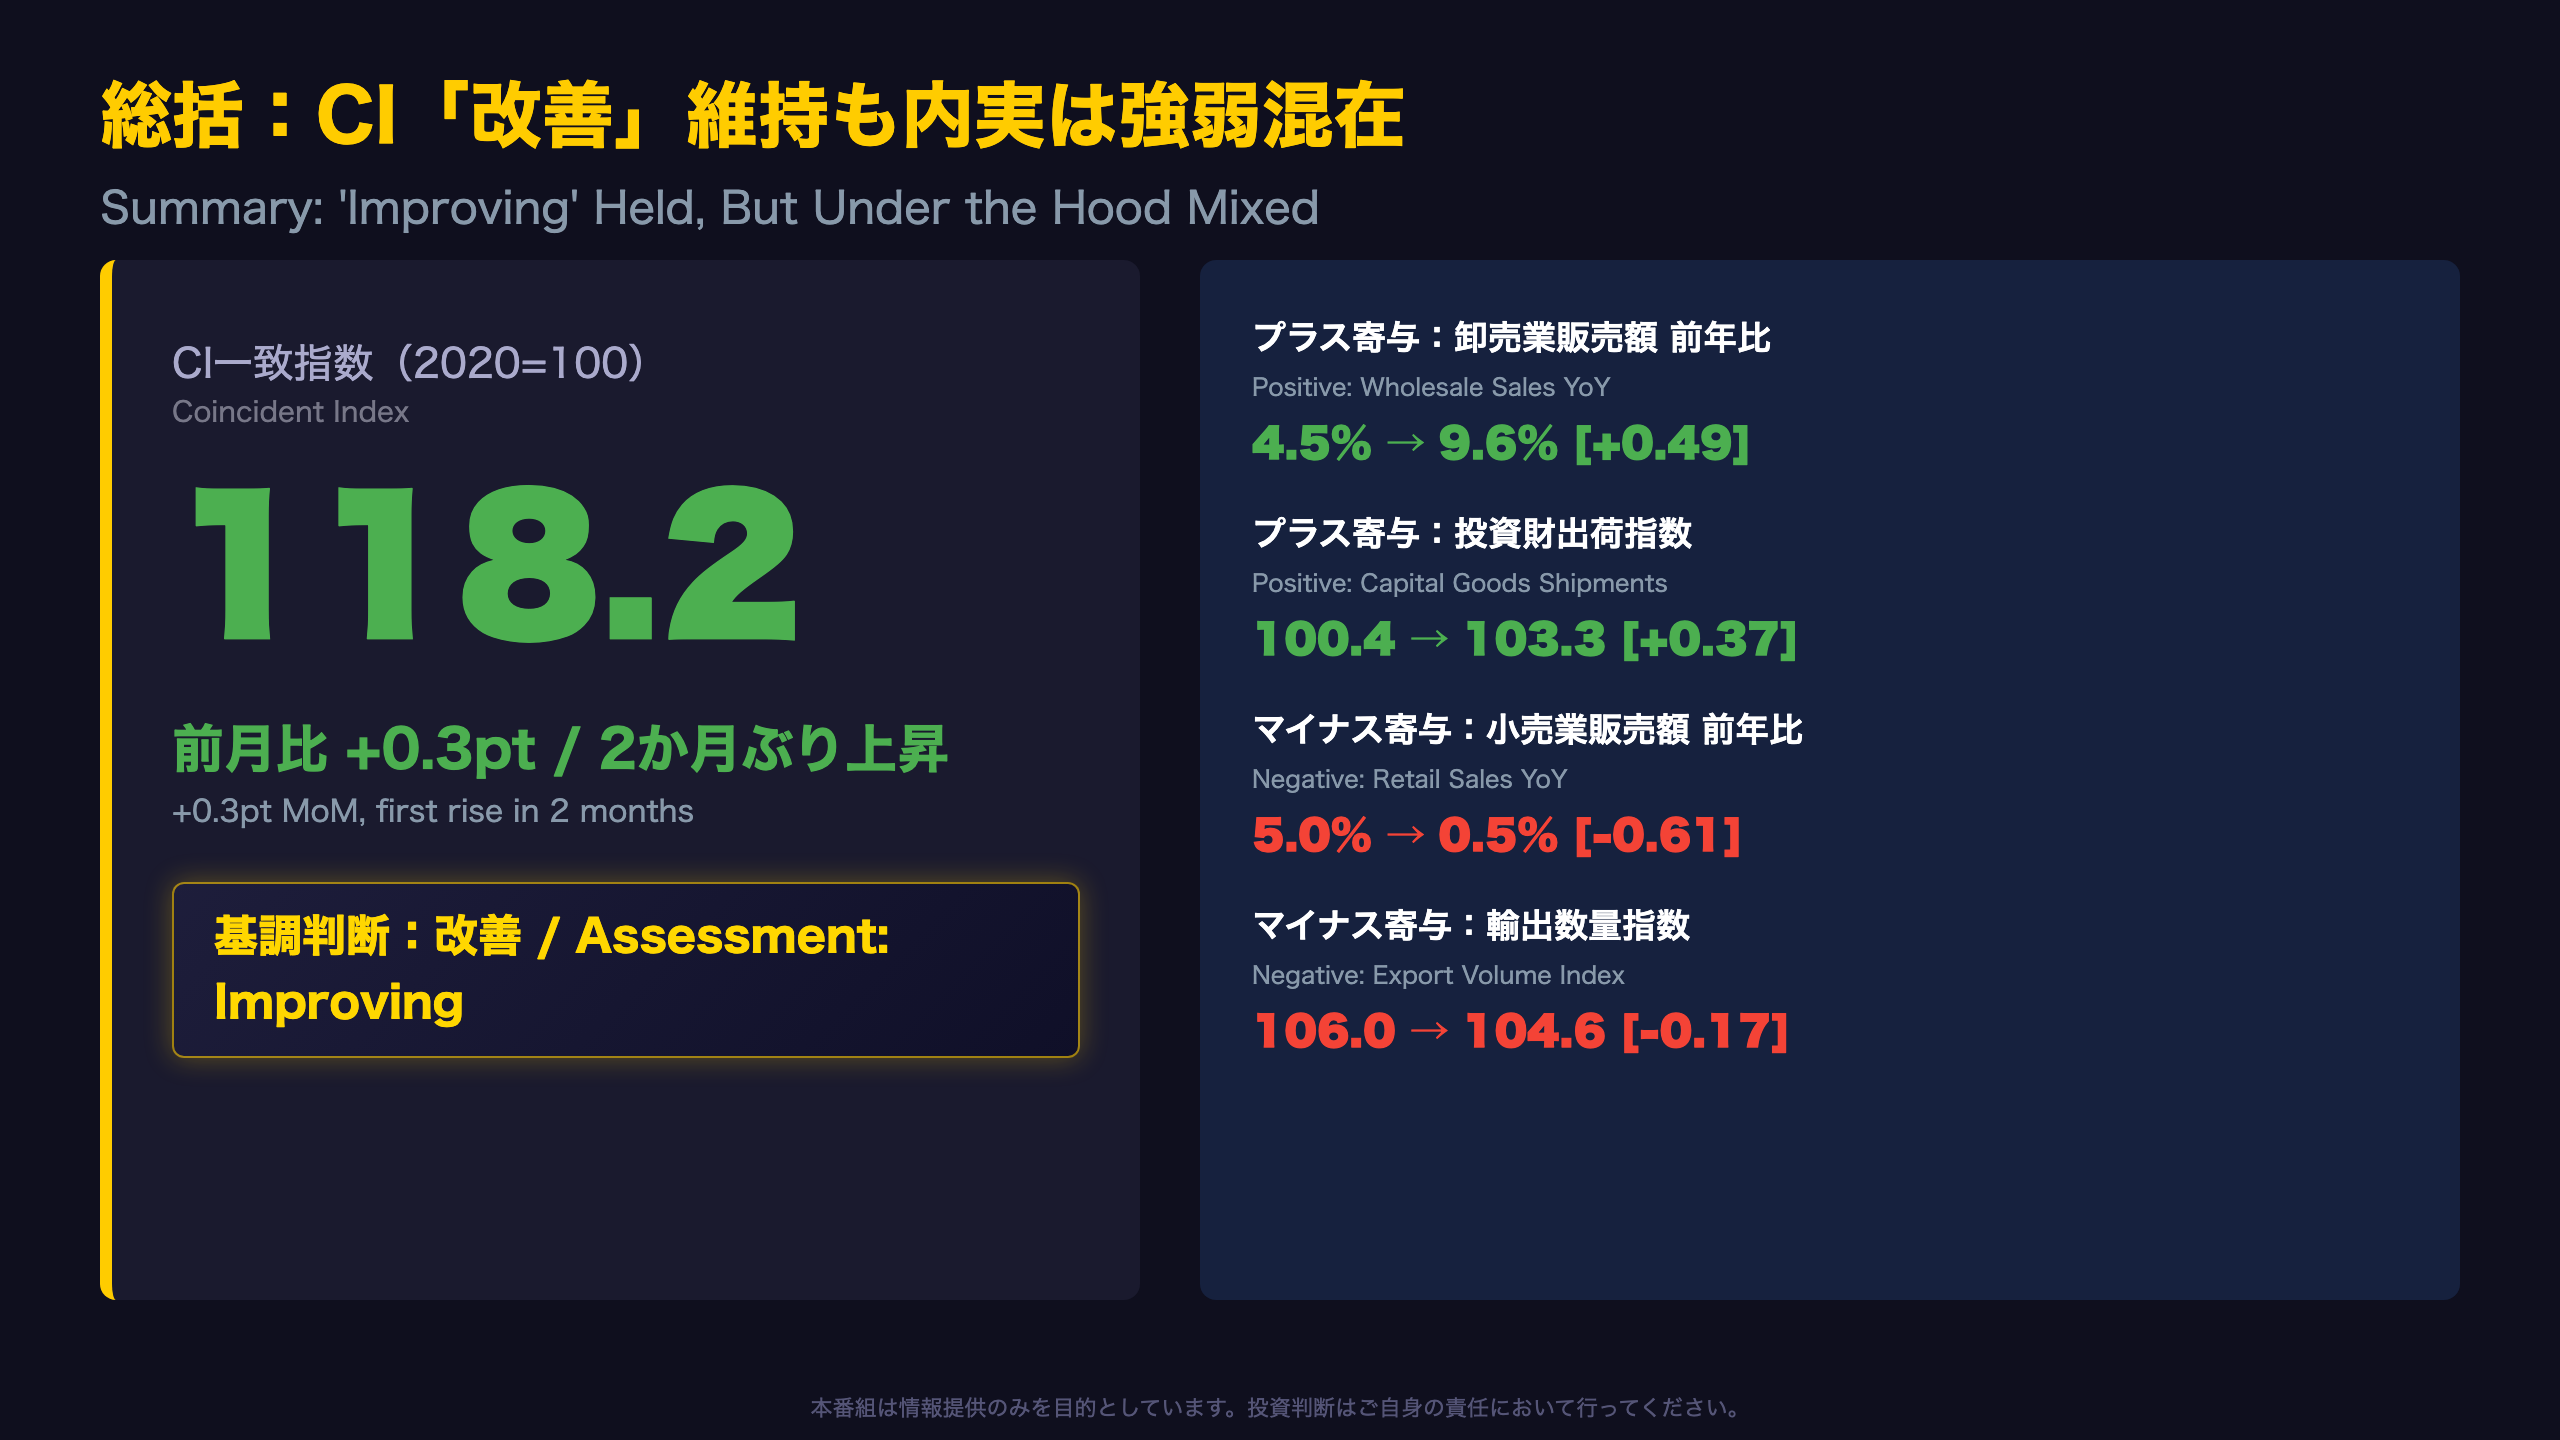
The coincident index rose to 118.2 (+0.3pt MoM), marking its first rise in 2 months. The ‘improving’ assessment was maintained.
📈 Production index, capital goods shipments, and wholesale sales were positive contributors.
📉 But retail sales YoY growth cooled sharply from 5.0% to 0.5%, and export volume also declined.
⚠️ May’s data was also revised down significantly, from +0.4pt (preliminary) to -0.2pt (final).
We unpack the strength beneath the headline ‘improvement’ and the demand-side softness lurking underneath.
総括:CI「改善」維持も内実は強弱混在
The Big Picture
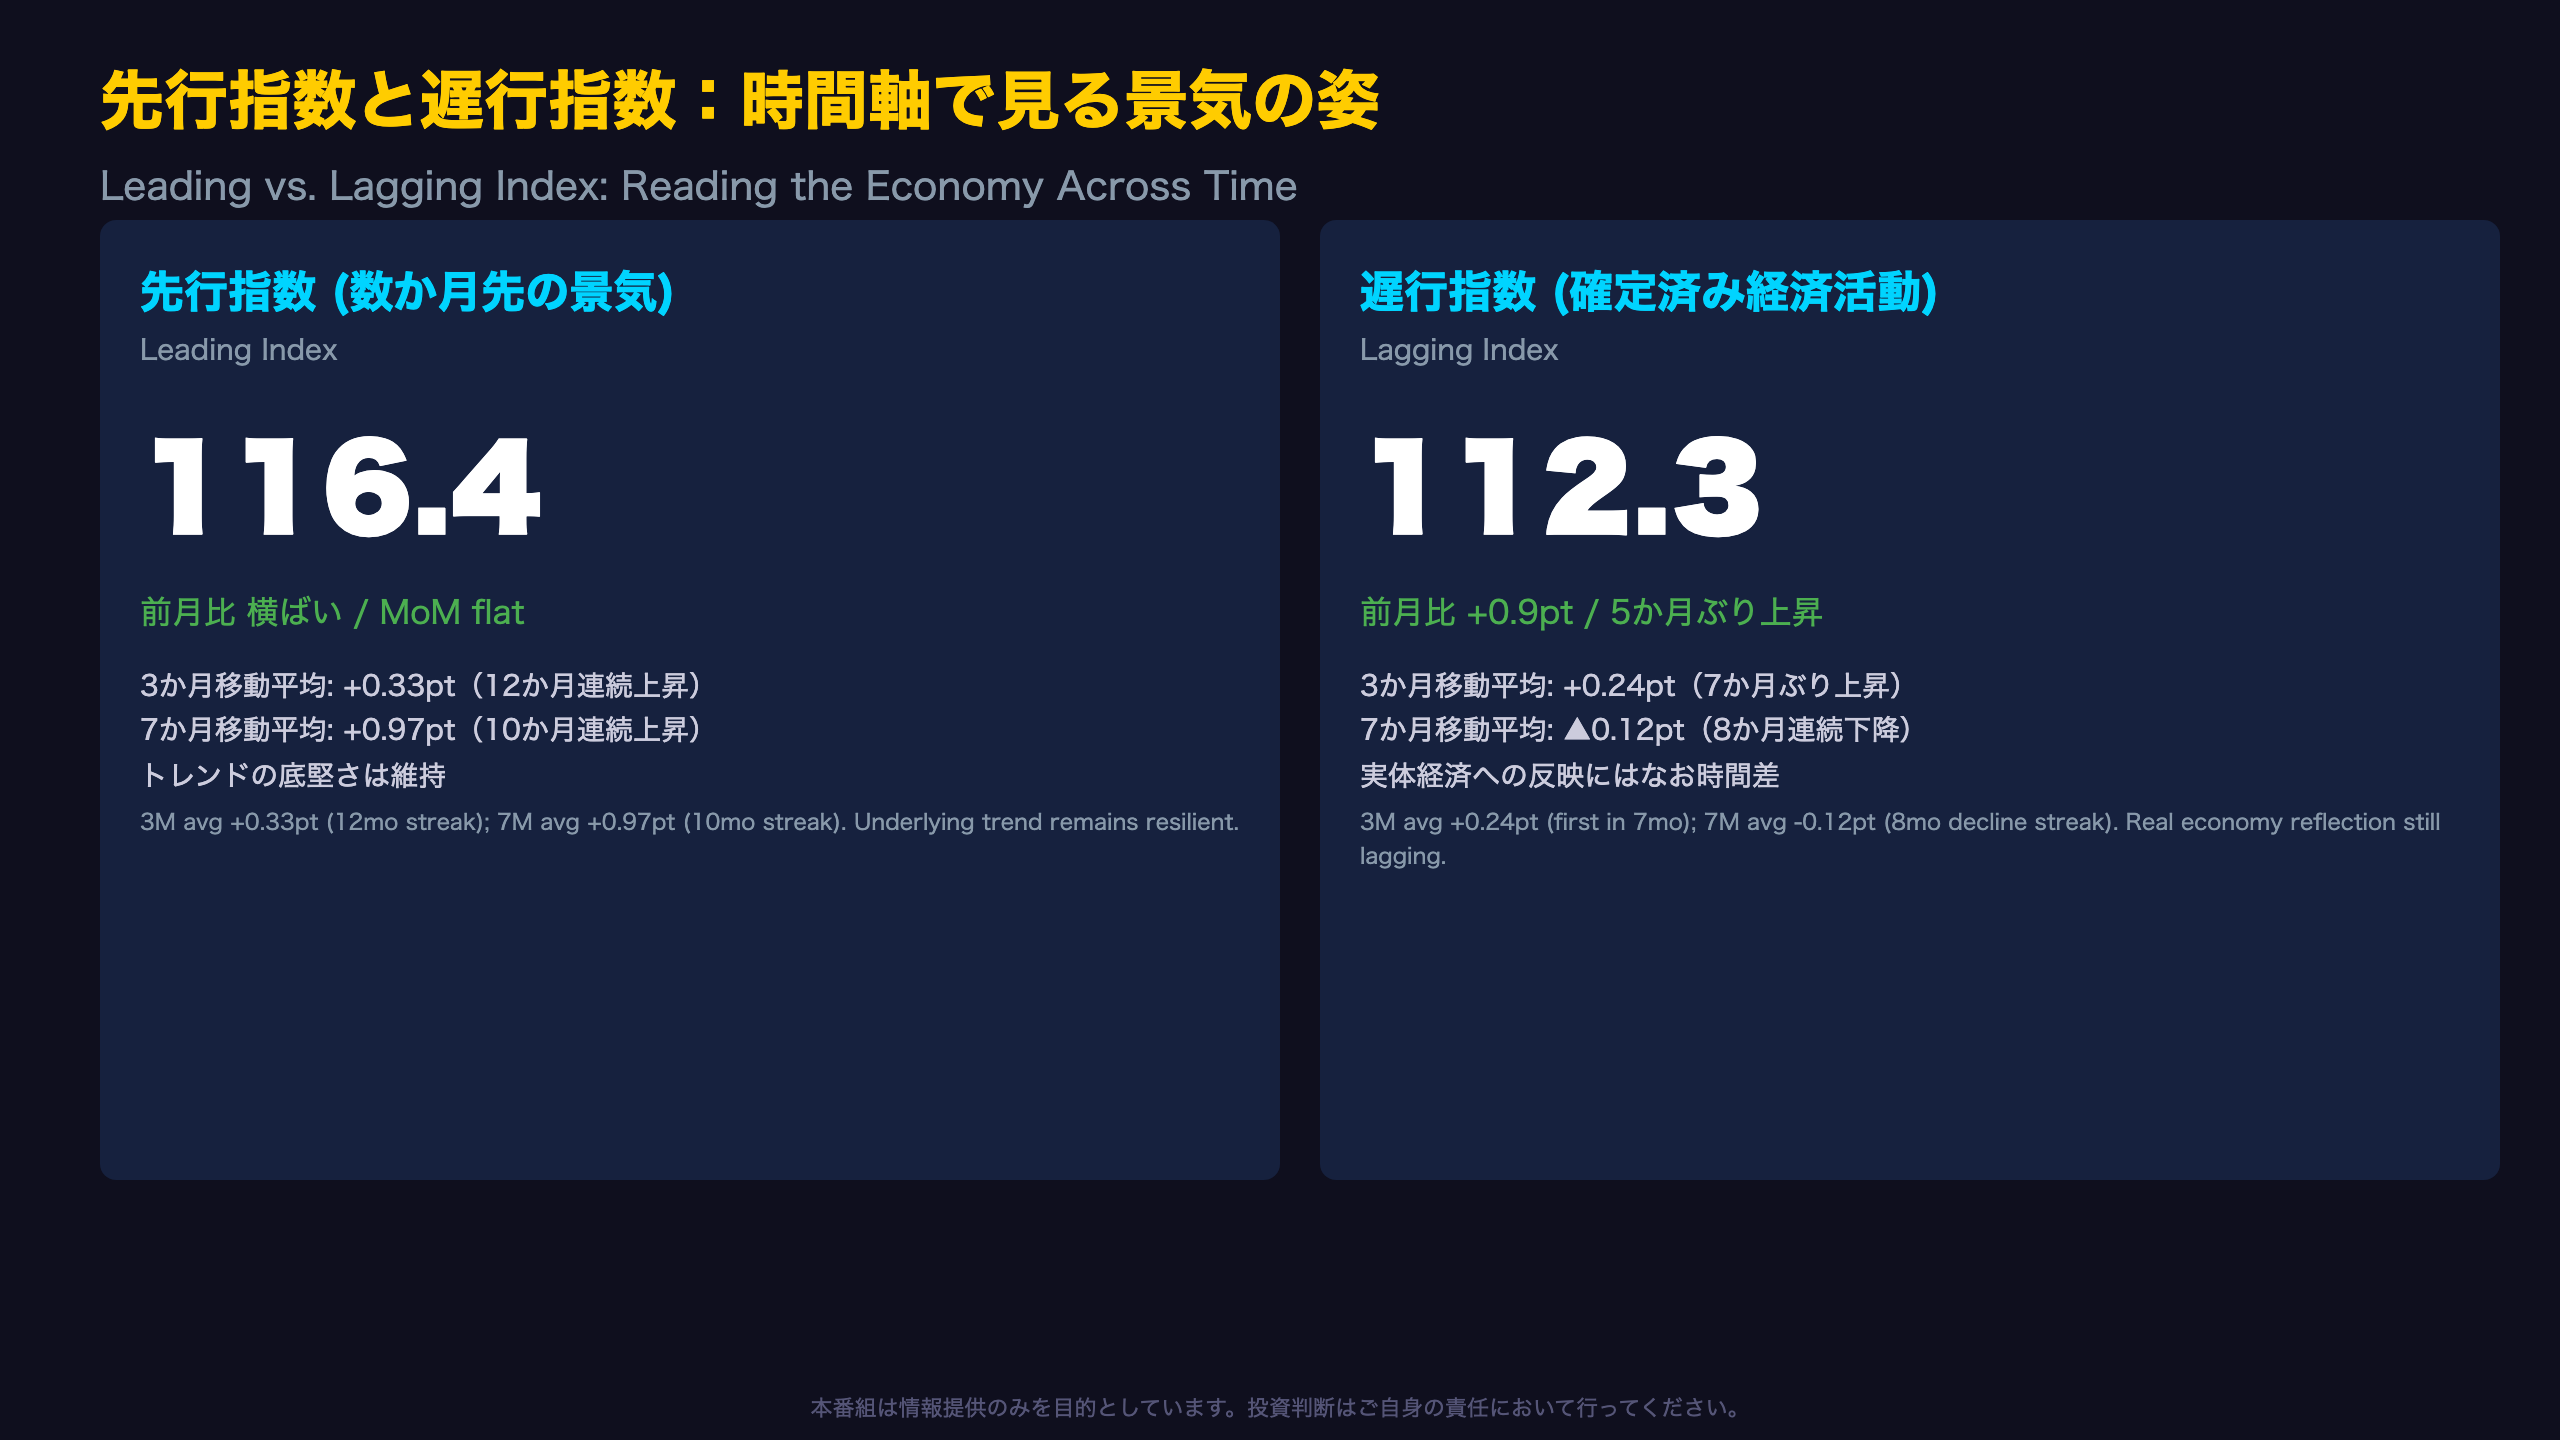
Japan’s Cabinet Office (Naikakufu) released its Composite Index (CI) for June 2026 on August 7. The coincident index came in at 118.2 (+0.3pt MoM), the leading index at 116.4 (flat), and the lagging index at 112.3 (+0.9pt).
“Positive contributions came from wholesale sales (YoY) and capital goods shipments excluding transport equipment,” the Cabinet Office noted in its release.
What is the CI?
For readers unfamiliar with Japanese macro data: the CI (Composite Index) is Japan’s equivalent of a diffusion-based leading/coincident economic indicator, similar in spirit to the US Conference Board’s Leading Economic Index (LEI), but built from 10 official coincident series including industrial production, retail sales, and job openings ratio, with equal weighting.
Time-Series Context
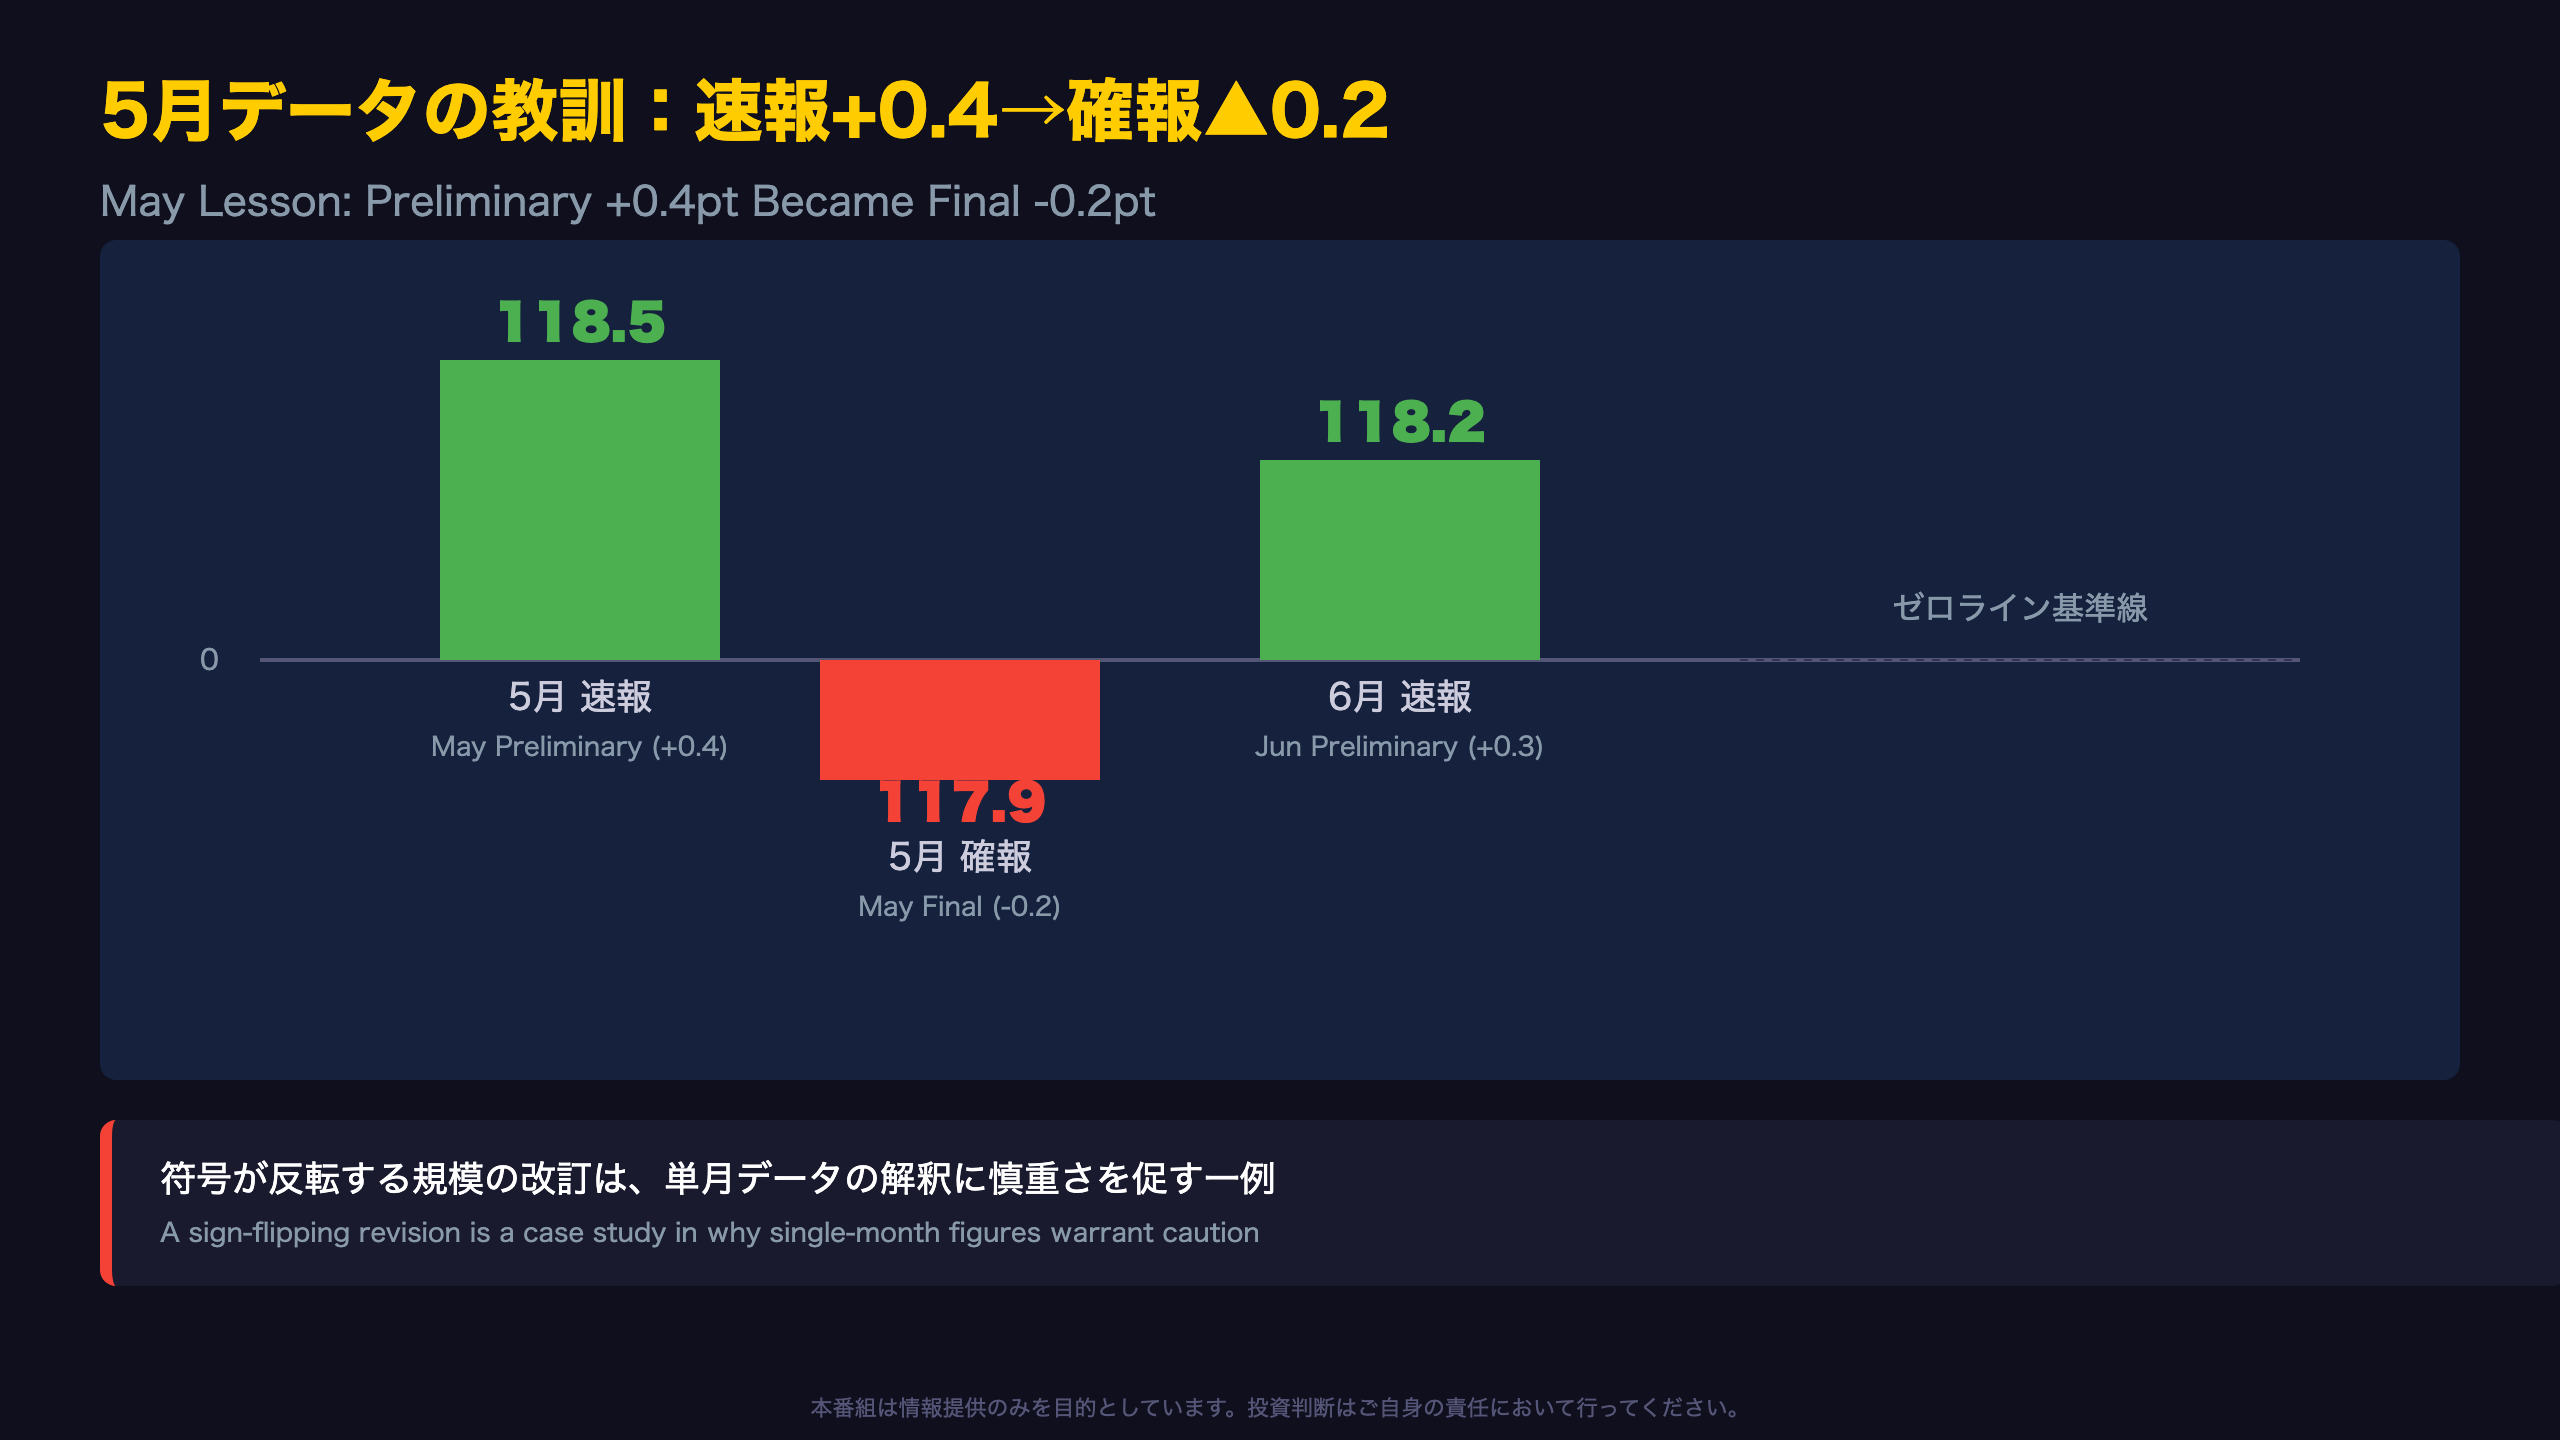
The coincident index has moved: 116.8 (Mar) → 118.1 (Apr) → 117.9 (May) → 118.2 (Jun). Notably, May’s figure was originally reported as 118.5 (+0.4pt) in the preliminary release, then revised down to 117.9 (-0.2pt) in the July 27 final report — a full sign reversal. This underscores a structural feature of Japanese preliminary data: single-month readings can flip entirely upon revision, similar to how US initial jobless claims or GDP advance estimates get revised.
Bull vs. Bear Read
Bulls note the 3-month moving average has risen for six straight months — a trend-based signal more robust than any single print. Bears point to the retail sales YoY deceleration (5.0% → 0.5%) as a possible early sign of consumer fatigue, though base effects from last year’s comparison period cannot be ruled out.
Market Implications
For USD/JPY watchers, a maintained ‘improving’ assessment is a mild positive that could reinforce BOJ policy normalization narratives, though this single dataset cannot be decisive given the revision risk demonstrated by May’s data.
5月データの教訓:速報+0.4→確報▲0.2
Anatomy of a Revision
According to the Cabinet Office’s July 27 “Revision Status” report, May’s coincident index was revised from a preliminary 118.5 down to a finalized 117.9 — flipping the monthly change from +0.4 points to -0.2 points, a full sign reversal.
Why This Matters for International Readers
Unlike the US ISM or Conference Board LEI, which rarely see sign reversals of this magnitude, Japan’s CI system explicitly builds in a two-stage release (preliminary then revised) precisely because several underlying series — like labor input and quarterly corporate profits — are not yet available at the preliminary stage and get backfilled a month later.
What Changed
The main drivers were the newly incorporated “C4 Labor Input Index” series (unavailable in the preliminary release) and modest downward revisions to production, retail sales, and wholesale sales sub-indices. Retail YoY was revised from 5.3% to 5.0%; wholesale YoY from 4.9% to 4.5%.
Bull vs Bear Take
Optimists argue the revision is within normal statistical noise and the underlying moving-average trend was unaffected — indeed, the official “improving” assessment survived both the preliminary and revised releases for May. Skeptics counter that a sign-flipping revision undermines confidence in reading too much into any single preliminary print, a caution equally applicable to comparable early estimates like the US GDP “advance” release.
Market Implications
Investors monitoring JGB yields or JPY sensitivity to macro surprises should treat Japan’s preliminary CI releases as directional signals only, confirmed by trend (moving averages), not point estimates.
個別系列の寄与度:供給堅調、需要は重し
Contribution Breakdown
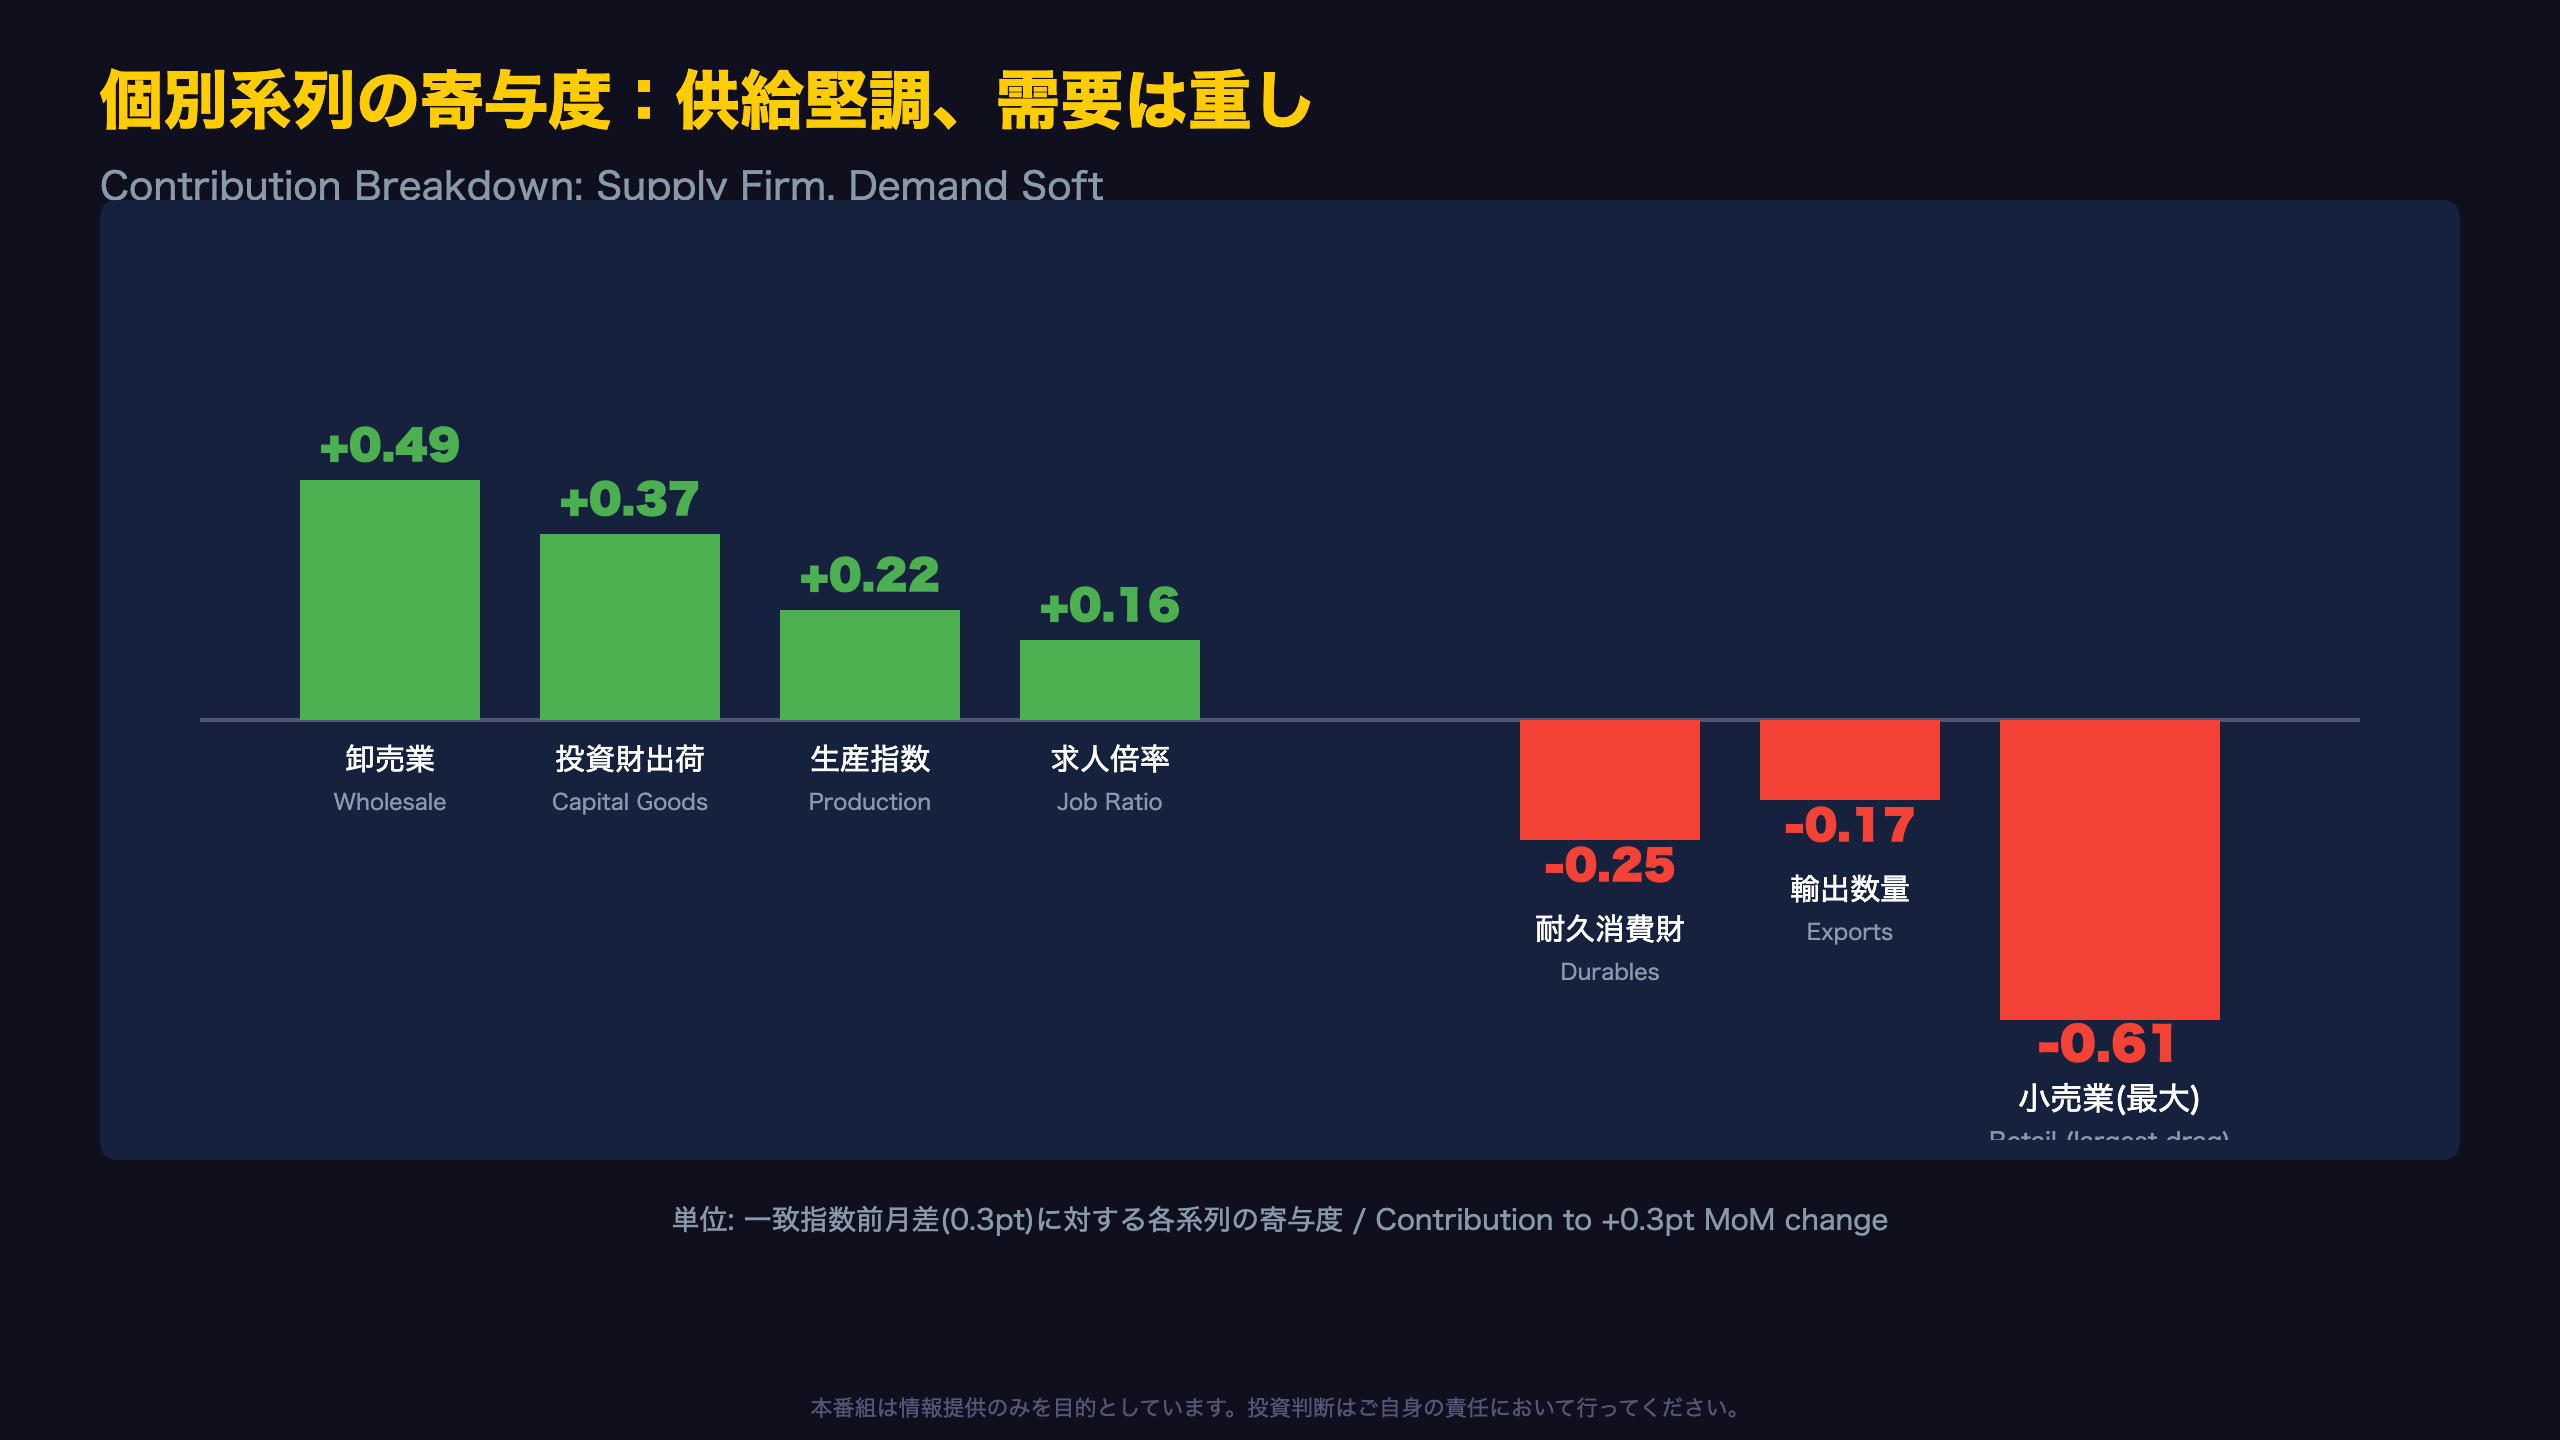
Of the 10 series making up the coincident index, five contributed positively in June: wholesale sales (+0.49), capital goods shipments (+0.37), industrial production (+0.22), the job openings ratio (+0.16), and corporate profits (+0.11, trend component only). Three series dragged: retail sales (-0.61), durable consumer goods (-0.25), and export volume (-0.17).
Context on Retail Deceleration
Retail sales YoY moved 1.4% (Mar) → 2.8% (Apr) → 5.0% (May) → 0.5% (Jun), peaking in May before decelerating sharply. A single month’s swing cannot distinguish between a base-effect reversal (last year’s comparison period) and a genuine change in consumer momentum. However, durable consumer goods shipments also fell from 111.4 to 108.2 in the same month — multiple consumption-linked series moving in the same direction lends some weight to the idea that consumer momentum may be cooling, though this remains a tentative read (Level B/C confidence per our framework).
The Wholesale-Retail Gap
Notably, the gap between wholesale sales growth (+9.6% YoY) and retail sales growth (+0.5% YoY) widened considerably in June. This divergence could reflect inventory adjustment timing or lags in price pass-through from wholesale to retail — a pattern worth monitoring for readers tracking Japan’s inflation pass-through dynamics relevant to BOJ policy.
Market Implications
For investors comparing this to the US retail sales report, the key takeaway is that Japan’s consumption data is signaling caution even as production-side indicators stay firm — a divergence that matters for consumption-sensitive sectors on the TSE.
先行指数と遅行指数:時間軸で見る景気の姿
Reading Three Indices Across Time
Japan’s CI system uses three indices — leading, coincident, and lagging — reflecting the economy several months ahead, the present, and confirmed past activity, respectively. This month’s data shows an interesting divergence in momentum across the three timeframes.
Leading Index Components
According to the revision report, positive contributors to the leading index included the Nikkei Commodity Index (42 items), the TOPIX (Tokyo Stock Price Index), and the manufacturing investment environment index. Real machinery orders (manufacturing) — a notoriously volatile series comparable to US durable goods orders — swung sharply, falling 14.8% month-on-month in May. New housing starts floor area rebounded 4.5% in the same month.
The Lagging Index’s Persistent Downtrend
The lagging index’s 7-month moving average has now declined for eight consecutive months. This likely reflects two structural drivers: Japan’s core CPI (excluding fresh food) has cooled from 3.0% YoY in October 2025 to 1.4% YoY in May 2026 — a gradual disinflation trend relevant to BOJ watchers — and the unemployment rate has stayed relatively elevated in recent months.
Bull vs. Bear
Bulls argue the leading index’s persistent uptrend will eventually feed through to the coincident and lagging indices, consistent with the CI’s built-in transmission lag. Bears note the lagging index’s continued decline could reflect a maturing expansion phase, though this reading requires more confirmation and should not be treated as definitive from this data alone.
Market Implications
For JGB and rate-sensitive investors, the cooling core CPI trend embedded in the lagging index is a relevant data point for gauging the durability of Japan’s inflation trajectory relative to the BOJ’s 2% target.
インプリケーション:改善基調と需要の重しの共存
Market Implications Through the Chain of Evidence
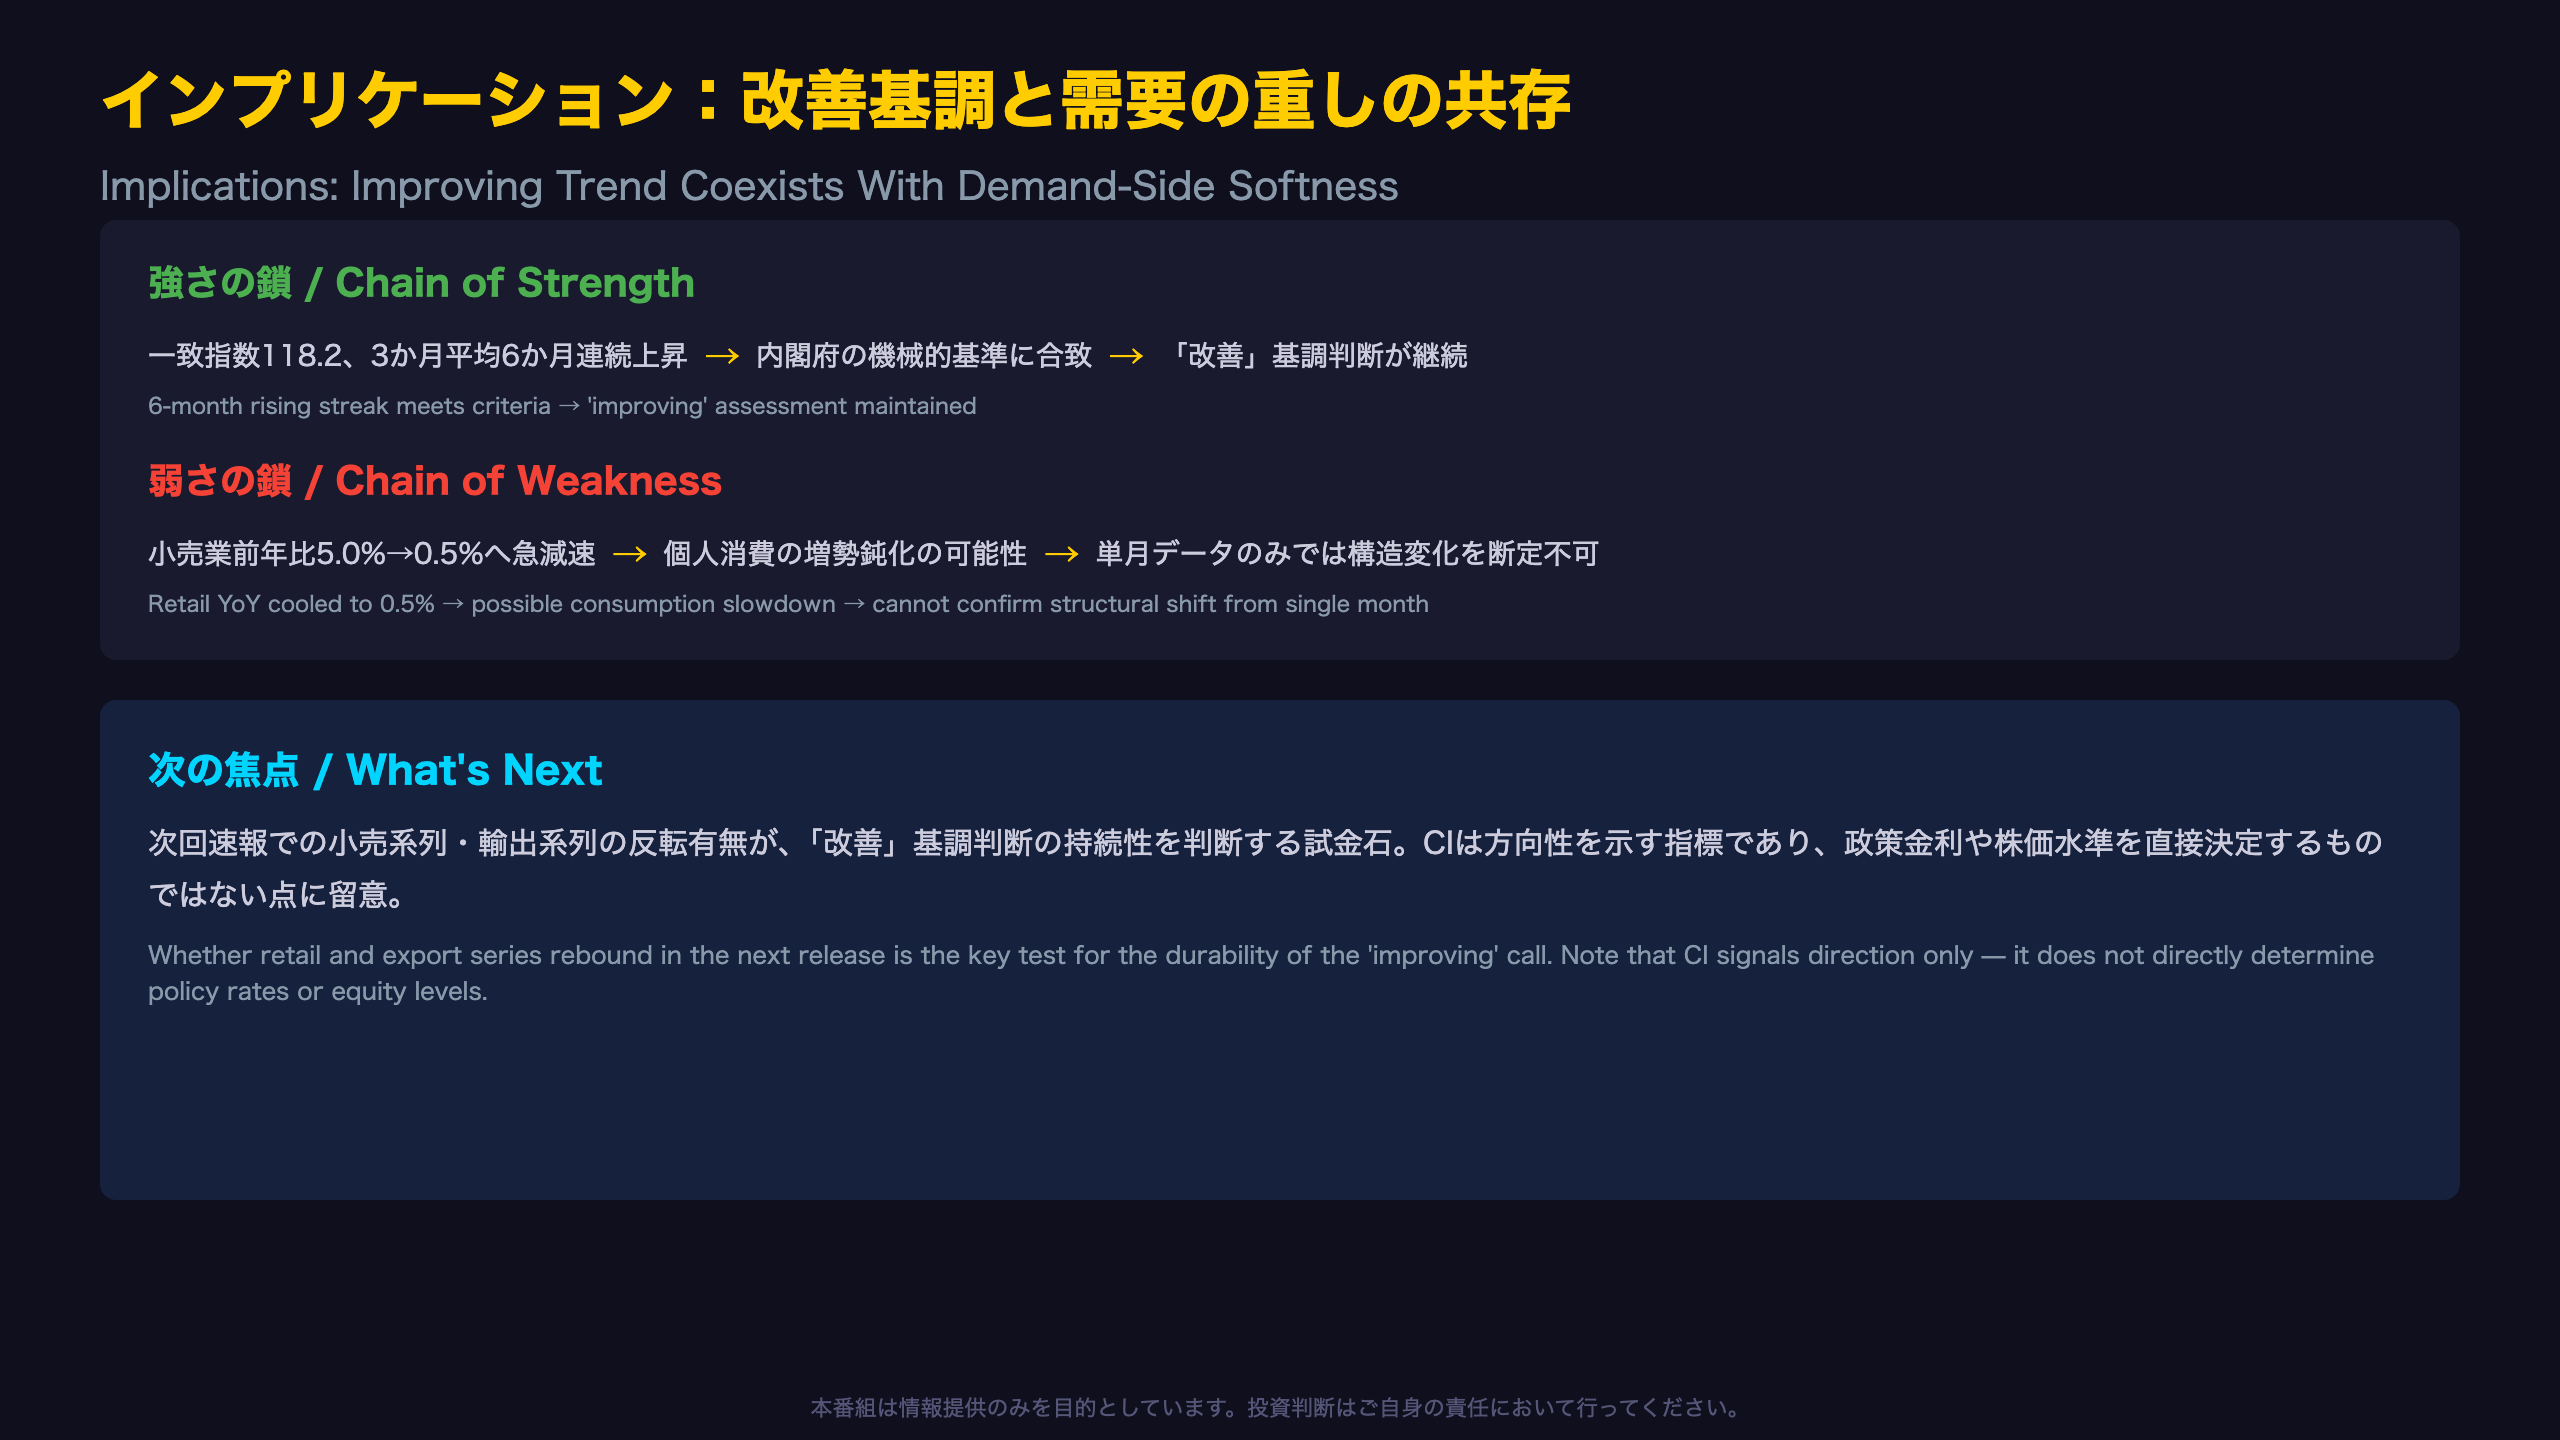
Chain of Strength: Coincident index at 118.2, with the 3-month moving average rising for six straight months → this satisfies the Cabinet Office’s mechanical assessment criteria (3+ consecutive months of rising 3M average, plus a positive monthly change) → the official ‘improving’ assessment is maintained, reinforcing the view that Japan’s economic expansion continues.
Chain of Weakness: Retail sales YoY decelerated sharply from 5.0% to 0.5% → this suggests consumer spending momentum may be cooling → while consumption slowdowns are generally thought to ease inflationary pressure, this is a single-month data point, and this report alone cannot distinguish a base-effect reversal from a structural slowdown.
Policy and Market Context
The Bank of Japan (BOJ) is understood to weigh consumption trends alongside production and employment data in its policy deliberations. The job openings ratio improving from 1.17 to 1.18 signals a still-tight labor market, while core CPI (ex-fresh food) has cooled to 1.4% YoY as of the latest reading — meaning the durability of Japan’s wage-price virtuous cycle cannot be judged from this CI release alone.
For International Investors
Unlike the US ISM or ECB survey-based indicators, Japan’s CI is a composite of hard, mostly non-survey data — making it a useful, if lagging-and-leading-blended, gauge of trend direction rather than a market-moving surprise indicator. It rarely triggers immediate JPY or Nikkei reaction on release day but matters for the medium-term BOJ policy narrative.
Official Cabinet Office statement: “The Composite Index (coincident) is showing improvement.”
Bottom Line
CI is a directional trend gauge, not a precise policy-rate predictor. The persistence of the multi-month uptrend is one data point suggesting Japan’s economy is not in an abrupt downturn, even as consumption-side softness warrants continued monitoring.
Disclaimer: This article is for informational purposes only. All investment decisions are made solely at your own risk.