📺 Watch the Full Video Analysis
This article was automatically generated by the NFC Market Live AI analysis system. (Updated: 2026-08-13 09:04 JST)
📄 Primary Source
日本銀行
https://www.boj.or.jp/statistics/pi/cgpi_release/cgpi2607.pdf
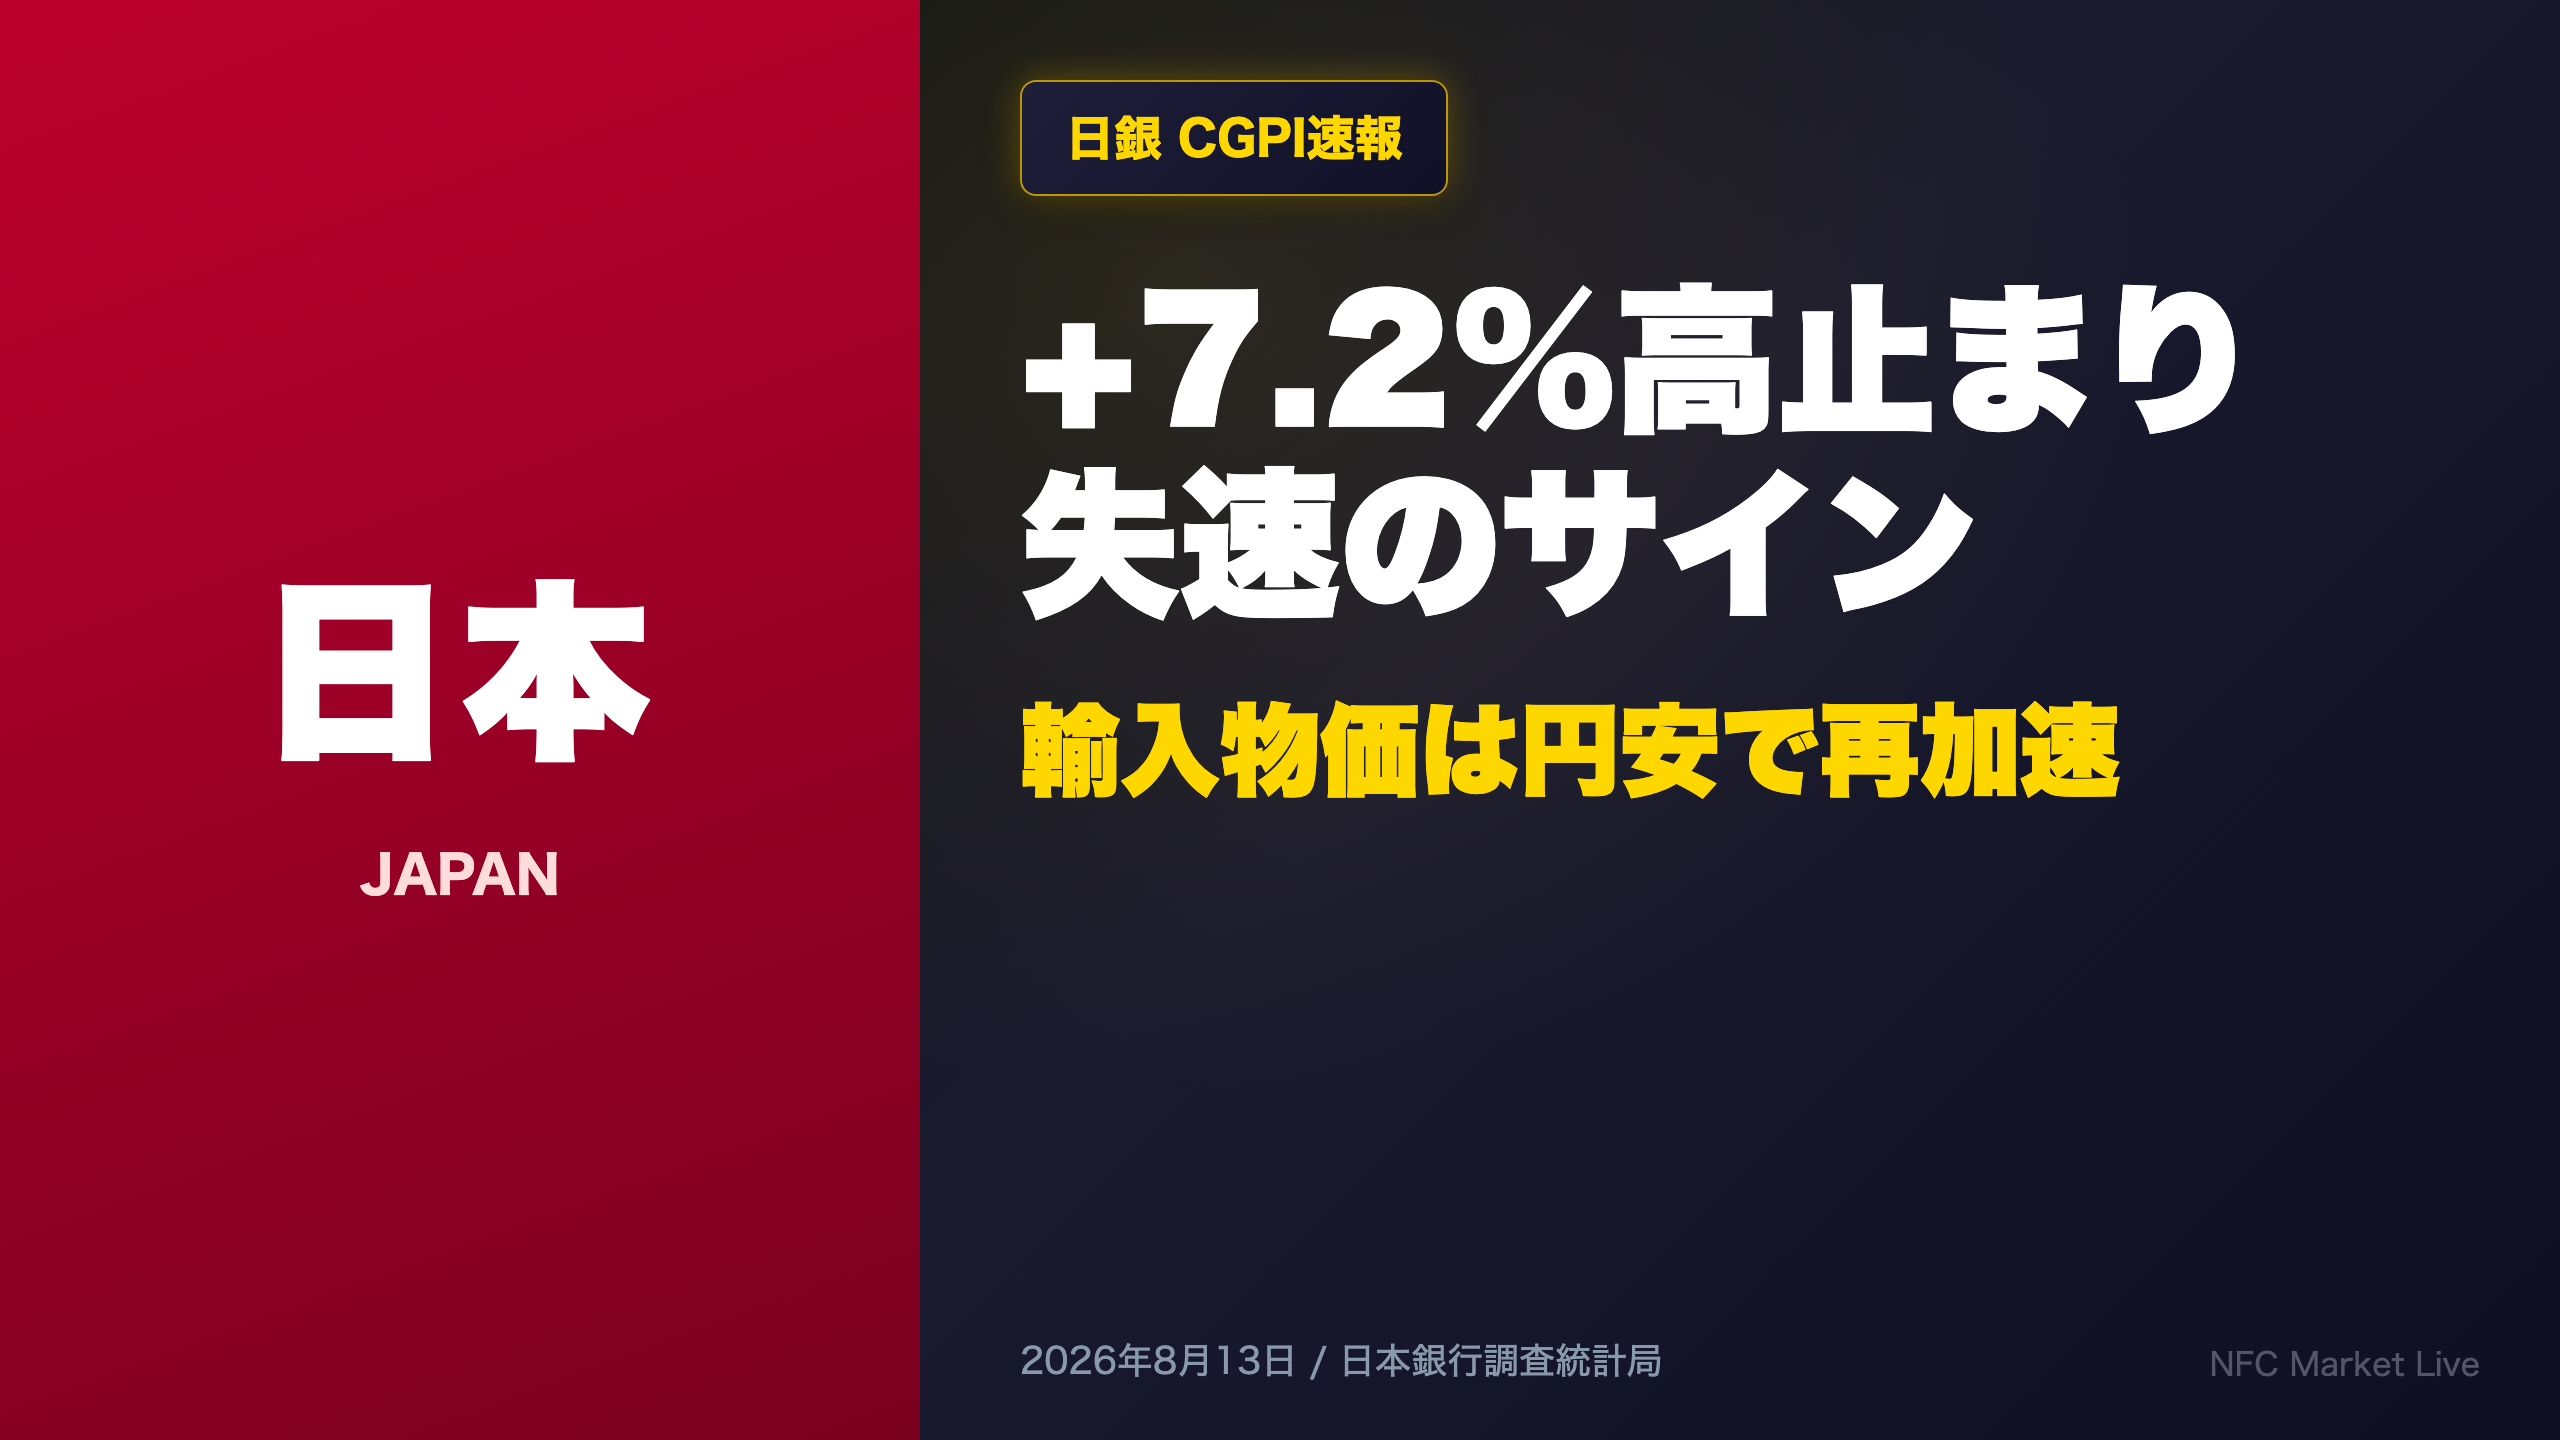
A deep dive into Japan’s July 2026 Corporate Goods Price Index (CGPI), released by the Bank of Japan.
📊 Headline domestic PPI held at +7.2% YoY, but MoM growth slowed sharply from +0.4% to +0.1% (flat after seasonal electricity adjustment).
📉 Export prices fell for a second straight month on a contract-currency basis.
📈 Import prices turned positive on a contract-currency basis, with yen weakness adding 11.4pp to the YoY figure.
💡 Price pass-through varies widely across upstream and downstream categories, leaving mixed signals for the BOJ’s next policy move.
総括:高止まりの裏で進む減速 / The Big Picture: Deceleration Beneath the Surface
July’s CGPI: A Familiar Headline, a Different Underlying Story
Japan’s Corporate Goods Price Index (CGPI), published monthly by the Bank of Japan’s Research and Statistics Department, is the Japanese equivalent of a producer price index (PPI). It tracks prices at the wholesale/factory-gate level before goods reach the consumer, making it a key leading indicator for the Bank of Japan’s (BOJ) inflation outlook — much like how U.S. PPI is watched ahead of CPI.
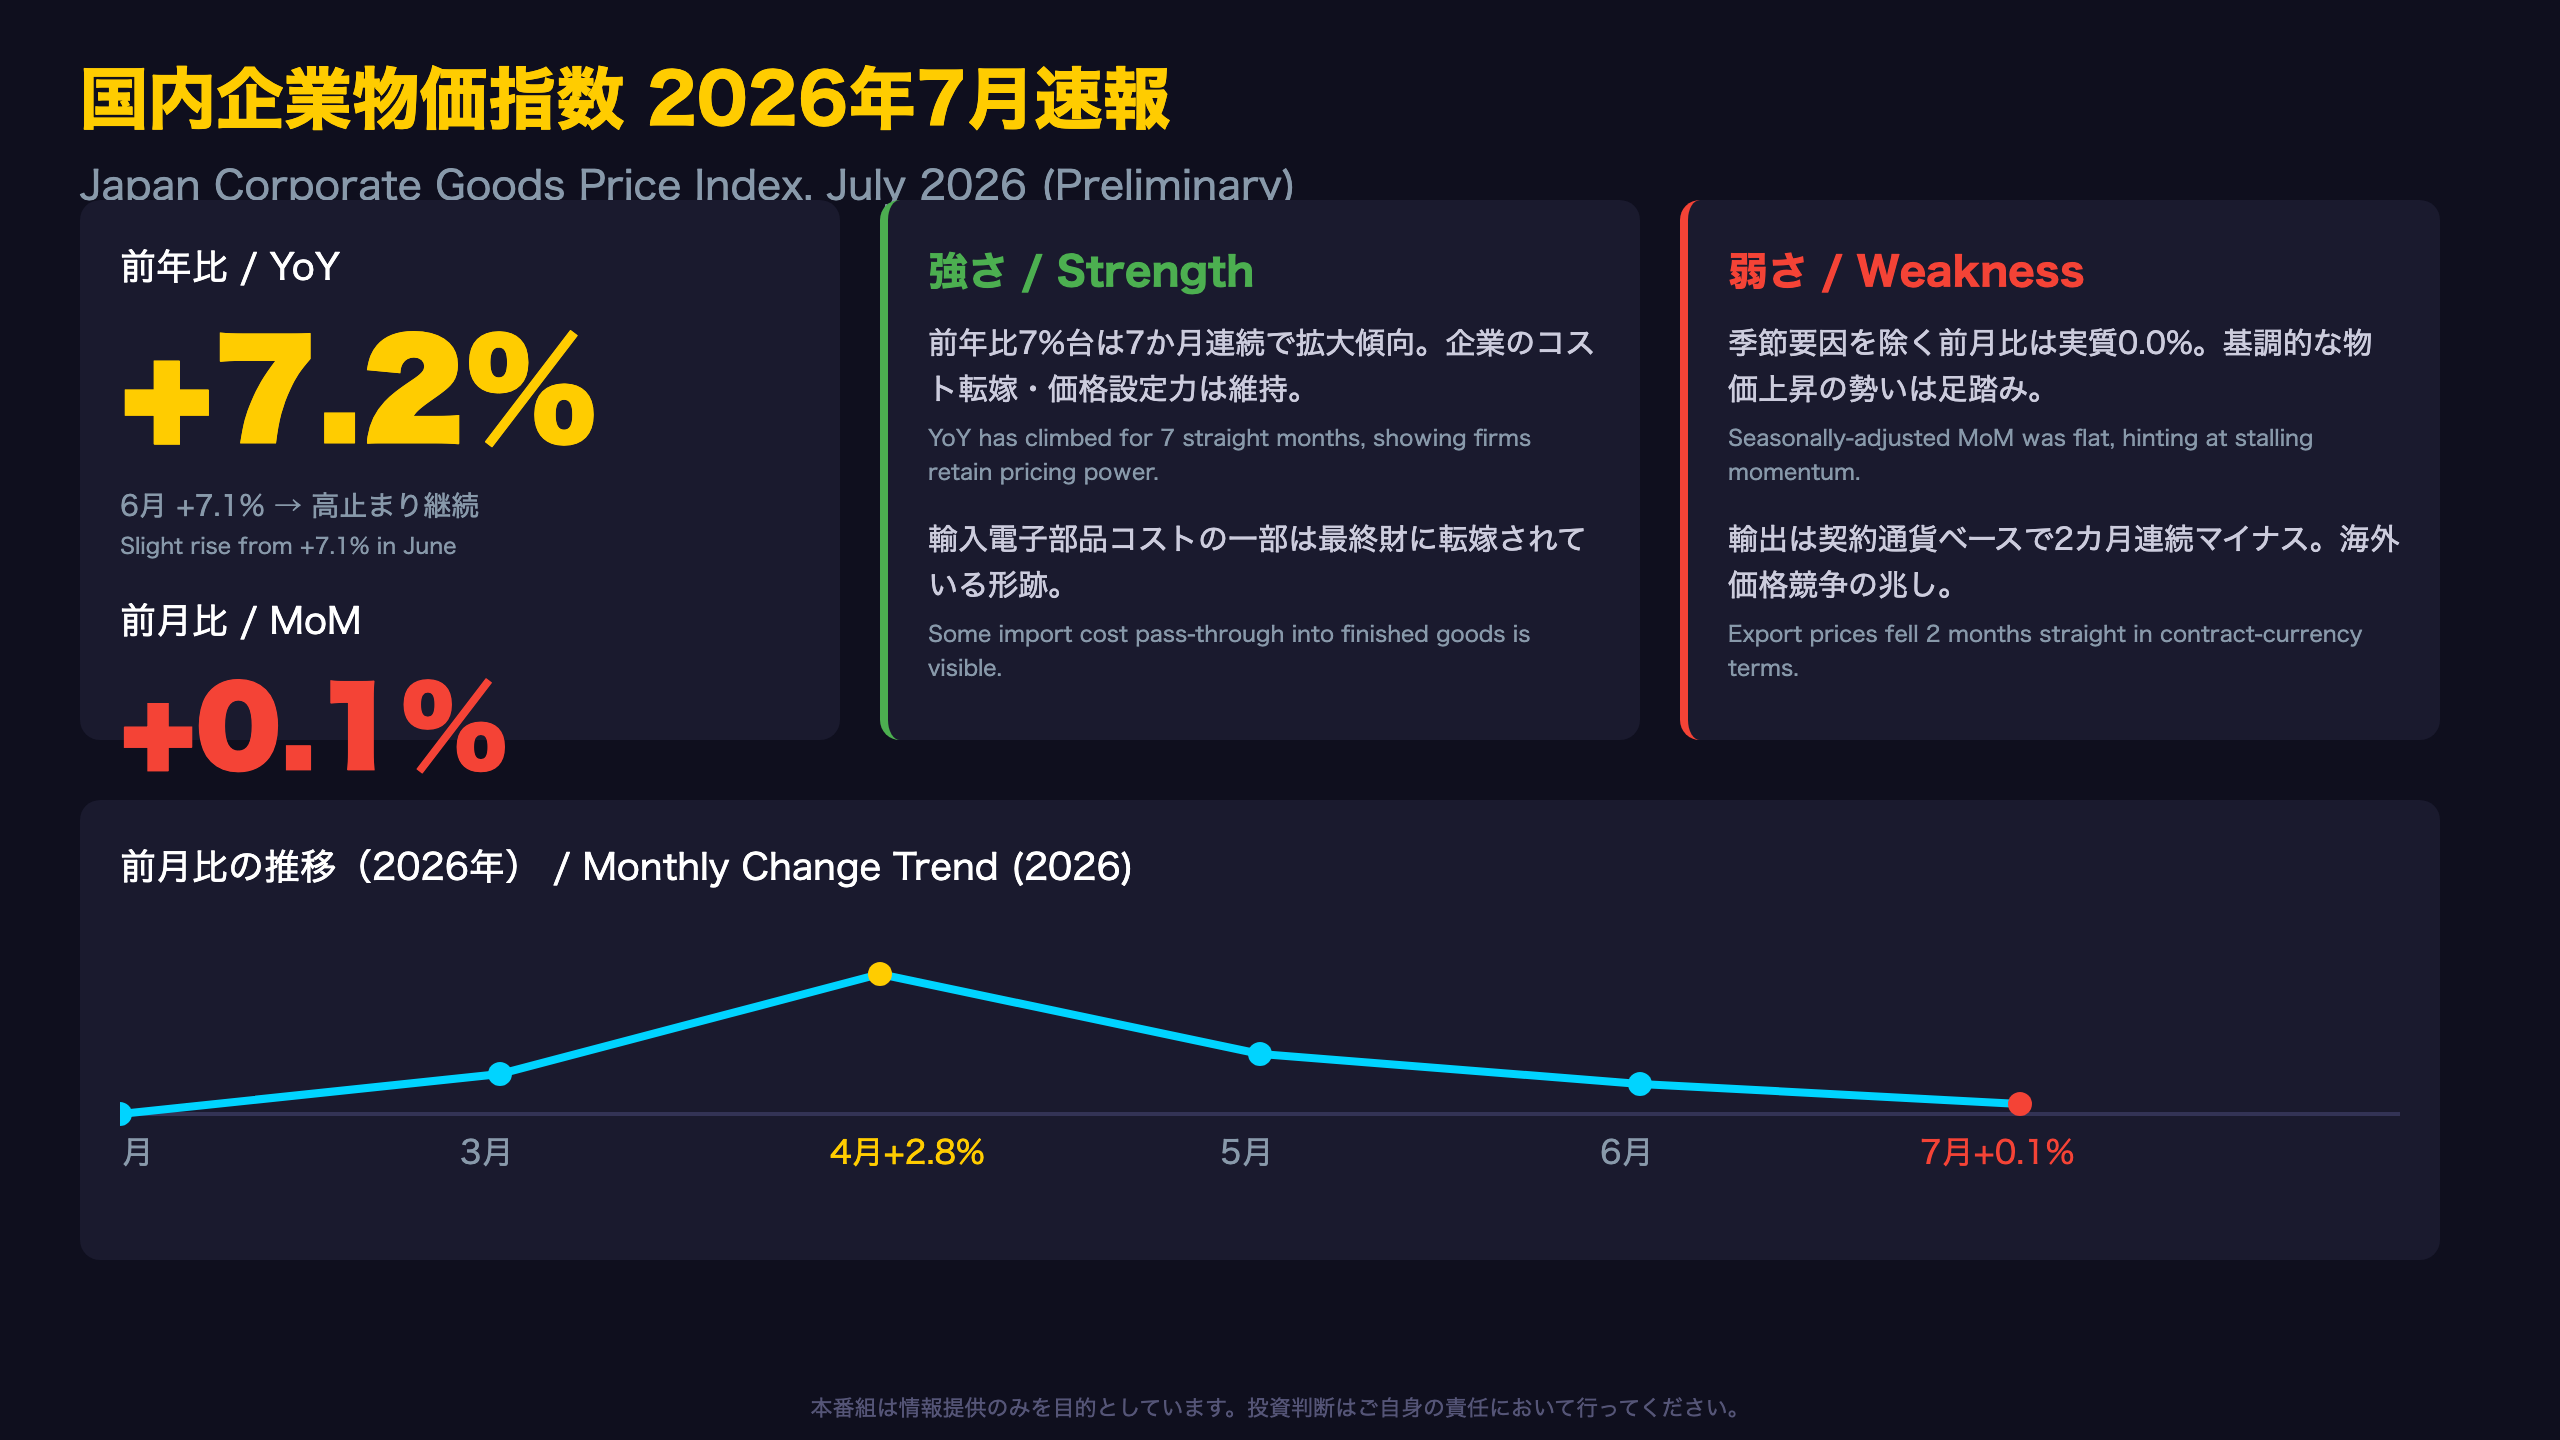
July’s release shows the headline YoY figure at +7.2%, continuing a steady climb from +5.1% in April, +6.6% in May, to over +7% in June. On the surface, this looks like sustained cost-push inflation.
“The Domestic CGPI rose 0.1% month-on-month (up 7.2% year-on-year). Adjusted for seasonal summer electricity charges, it was flat at 0.0%.” — Bank of Japan release
The Real Story: A Four-Month Deceleration
Looking at the month-on-month (MoM) sequence tells a very different story: 0.0% (Feb) → +1.0% (Mar) → +2.8% (Apr) → +1.1% (May) → +0.5% (Jun, revised) → +0.1% (Jul). The April spike likely reflects Japan’s fiscal-year-start repricing cycle, when many annual supply contracts are renegotiated. Since then, momentum has decelerated for four consecutive months.
Bull vs. Bear Read
- Bullish: A sustained +7% YoY print suggests firms have retained pricing power — consistent with Japan’s broader narrative of exiting deflation.
- Bearish: Once seasonal electricity effects are stripped out, the underlying monthly momentum has essentially flatlined, suggesting cost-push pressures may be fading.
What’s Next
The next CGPI release is scheduled for September 11. Whether the MoM pace re-accelerates or stays near zero will be a key signal for gauging Japan’s inflation trajectory into year-end — and for the BOJ’s policy calculus.
国内企業物価:季節要因を分離する / Domestic PPI: Separating the Seasonal Effect
Strip Out Utility Rates, and Growth Is Essentially Zero
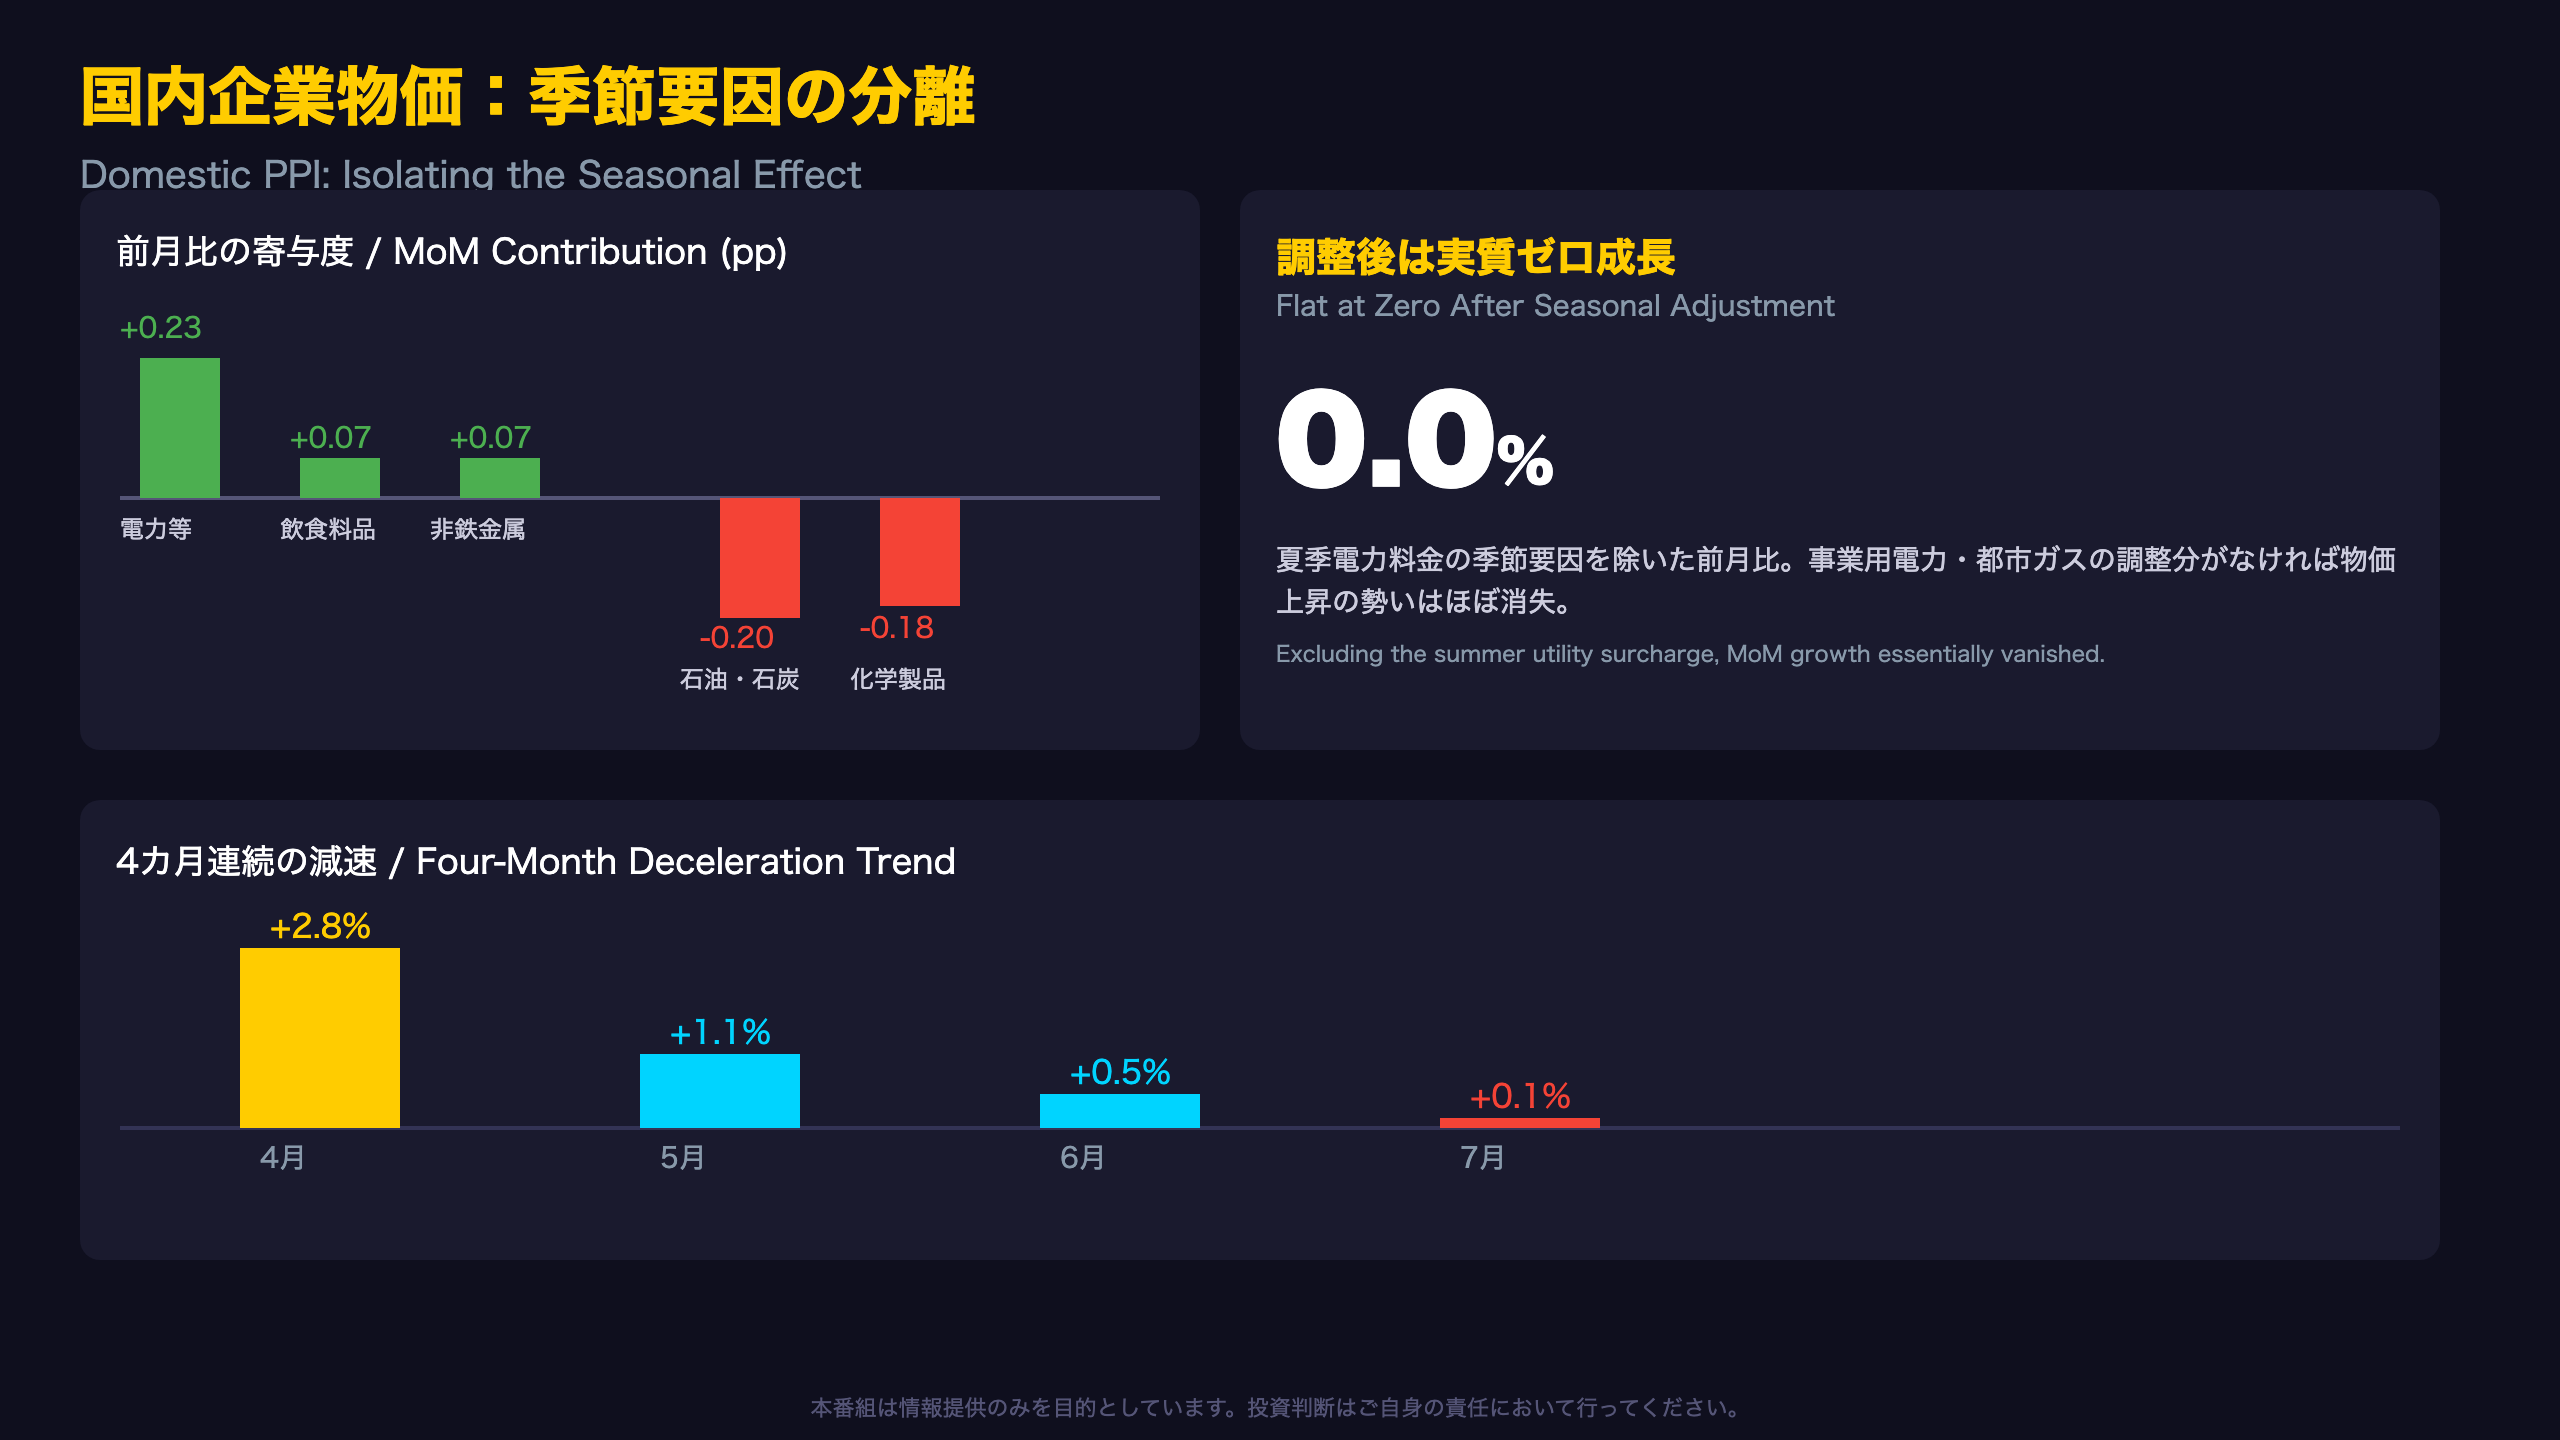
July’s +0.1% month-on-month reading for Japan’s domestic CGPI hides an important detail: the electricity, gas and water category alone contributed +0.23 percentage points — more than the entire headline gain. This reflects Japan’s seasonal summer electricity surcharge, which utilities apply from July through September. The BOJ explicitly notes that once this seasonal effect is excluded, the adjusted MoM figure was flat at 0.0%.
What Rose, What Fell
Upward contributors: Electricity/gas/water (+0.23pp), food products (+0.07pp), non-ferrous metals (+0.07pp).
Downward contributors: Petroleum & coal products (−0.20pp, driven by naphtha and jet fuel), chemical products (−0.18pp, driven by ethylene and xylene), agricultural/marine products (−0.04pp).
The clear declines in petroleum and basic chemicals suggest some relief in midstream input costs — a genuinely encouraging signal for firms further down the supply chain.
The Four-Month Deceleration Pattern
Context matters here. April’s outsized +2.8% MoM jump likely reflects Japan’s fiscal-year-start repricing convention, where many industrial supply contracts are renewed each April. Since then, the pace has decelerated for four consecutive months: +1.1% (May), +0.5% (June), +0.1% (July). This is a multi-month pattern, not a single noisy data point, which strengthens its signal value for BOJ watchers gauging underlying cost-push inflation.
Looking Ahead
The seasonal electricity surcharge unwinds around September–October. How this seasonal drag reverses in upcoming releases will be the key test of whether underlying pricing momentum is genuinely fading or merely pausing.
輸出物価:契約通貨ベース2カ月連続マイナス / Export Prices: Two Straight Monthly Declines
Exporters Face Real Price Pressure Abroad
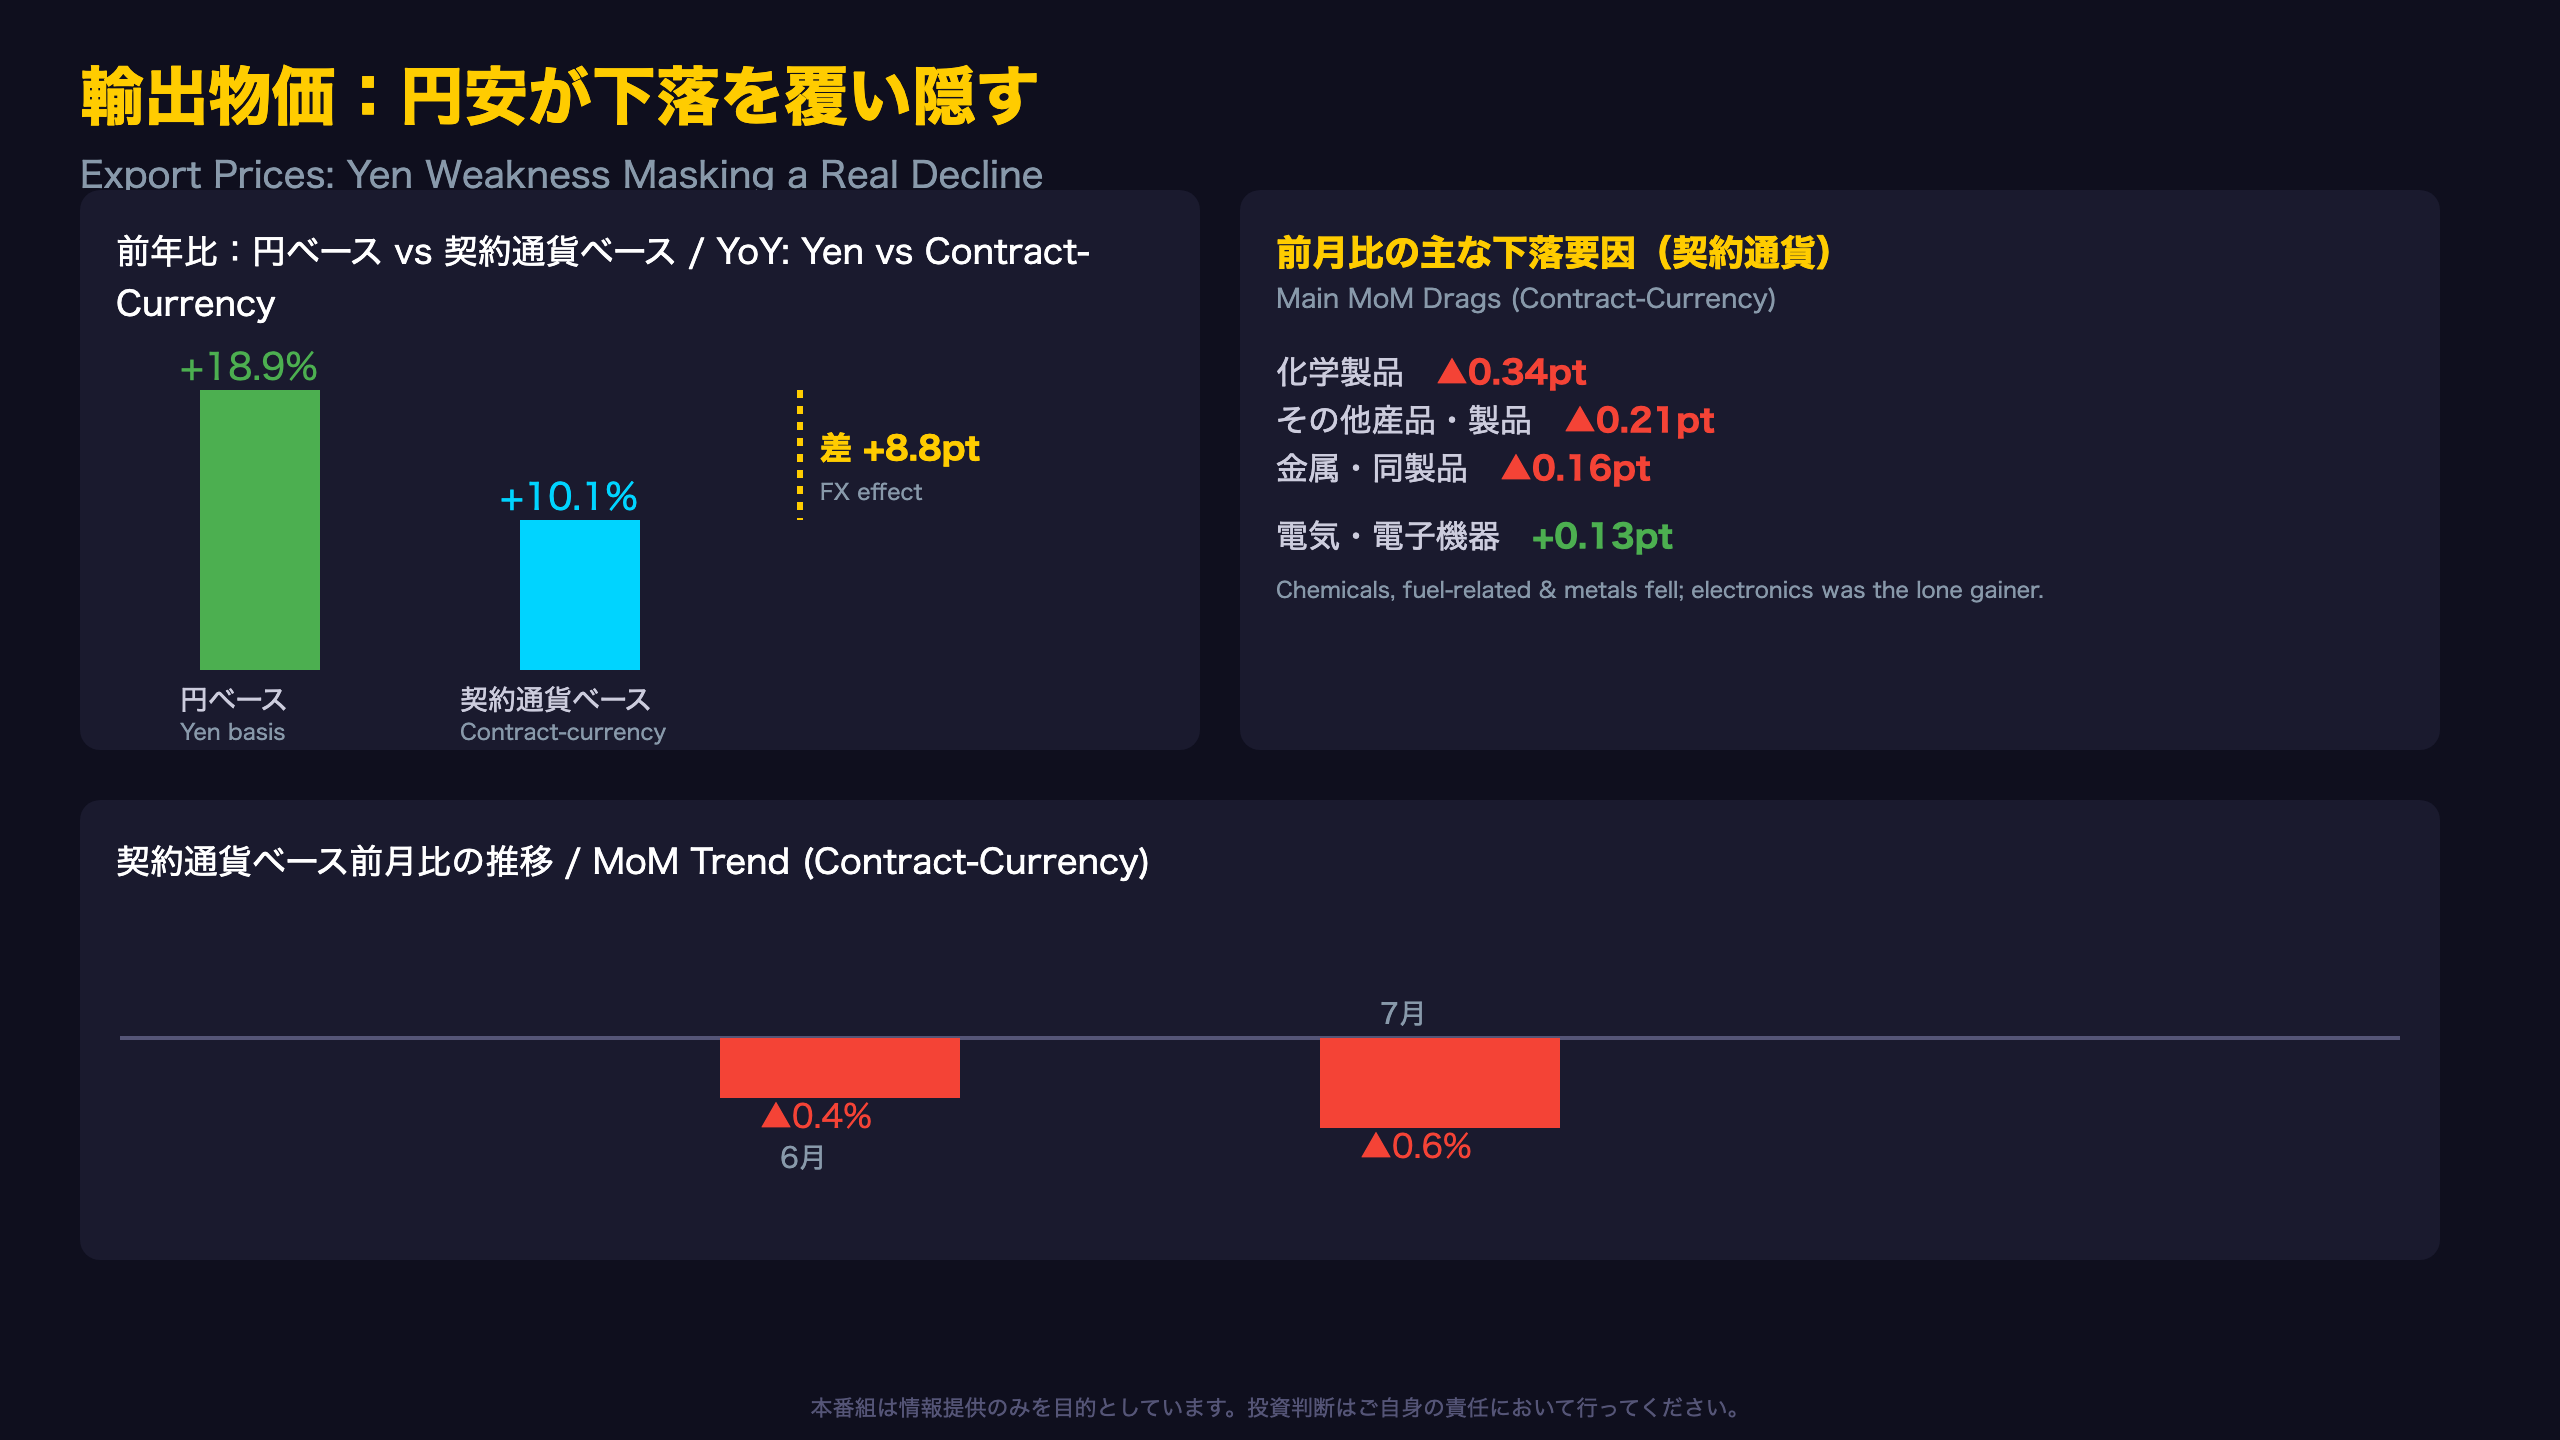
Japan’s export price index, measured on a contract-currency basis (i.e., stripping out exchange-rate effects to show the actual price charged in the original transaction currency), fell 0.6% month-on-month in July — a deeper decline than June’s 0.4% drop, marking the second consecutive monthly fall. Because this measure removes currency noise, it suggests Japanese exporters are facing genuine downward price pressure in overseas markets (a Level-B inference based on two consistent monthly readings).
“Export prices fell 0.6% month-on-month on a contract-currency basis, while rising 0.1% on a yen basis (up 18.9% year-on-year).” — BOJ release
How the Weak Yen Masks the Decline
On a yen basis, the same index actually rose 0.1% month-on-month — the opposite sign. That 0.7-point gap is purely the currency effect. Annually, the gap is even starker: +18.9% (yen basis) vs. +10.1% (contract-currency basis), an 8.8-point currency contribution. In other words, roughly half of exporters’ apparent revenue growth in yen terms is a currency illusion, not real pricing power — a nuance that matters greatly for equity analysts modeling exporter margins.
Category Breakdown
- Chemical products: −0.34pp (paraxylene, synthetic rubber, ethylene)
- Other products (fuel-related): −0.21pp
- Metals (gold bullion, precious metal products): −0.16pp
- Electric/electronic equipment: +0.13pp, the sole notable positive contributor, likely reflecting resilient semiconductor demand
Two Ways to Read This
Bearish: broad-based contract-currency declines across chemicals and metals may reflect eroding competitiveness or softening global demand. Bullish: the positive contribution from electronics could reflect genuine strength in the global chip cycle rather than Japan-specific weakness — likely tied to broader commodity market softness (Level-C inference), not necessarily a Japan-specific competitiveness problem.
輸入物価:円安が再びコストを押し上げる / Import Prices: The Yen Reignites Cost Pressure
Semiconductor Costs Are Driving Import Price Growth
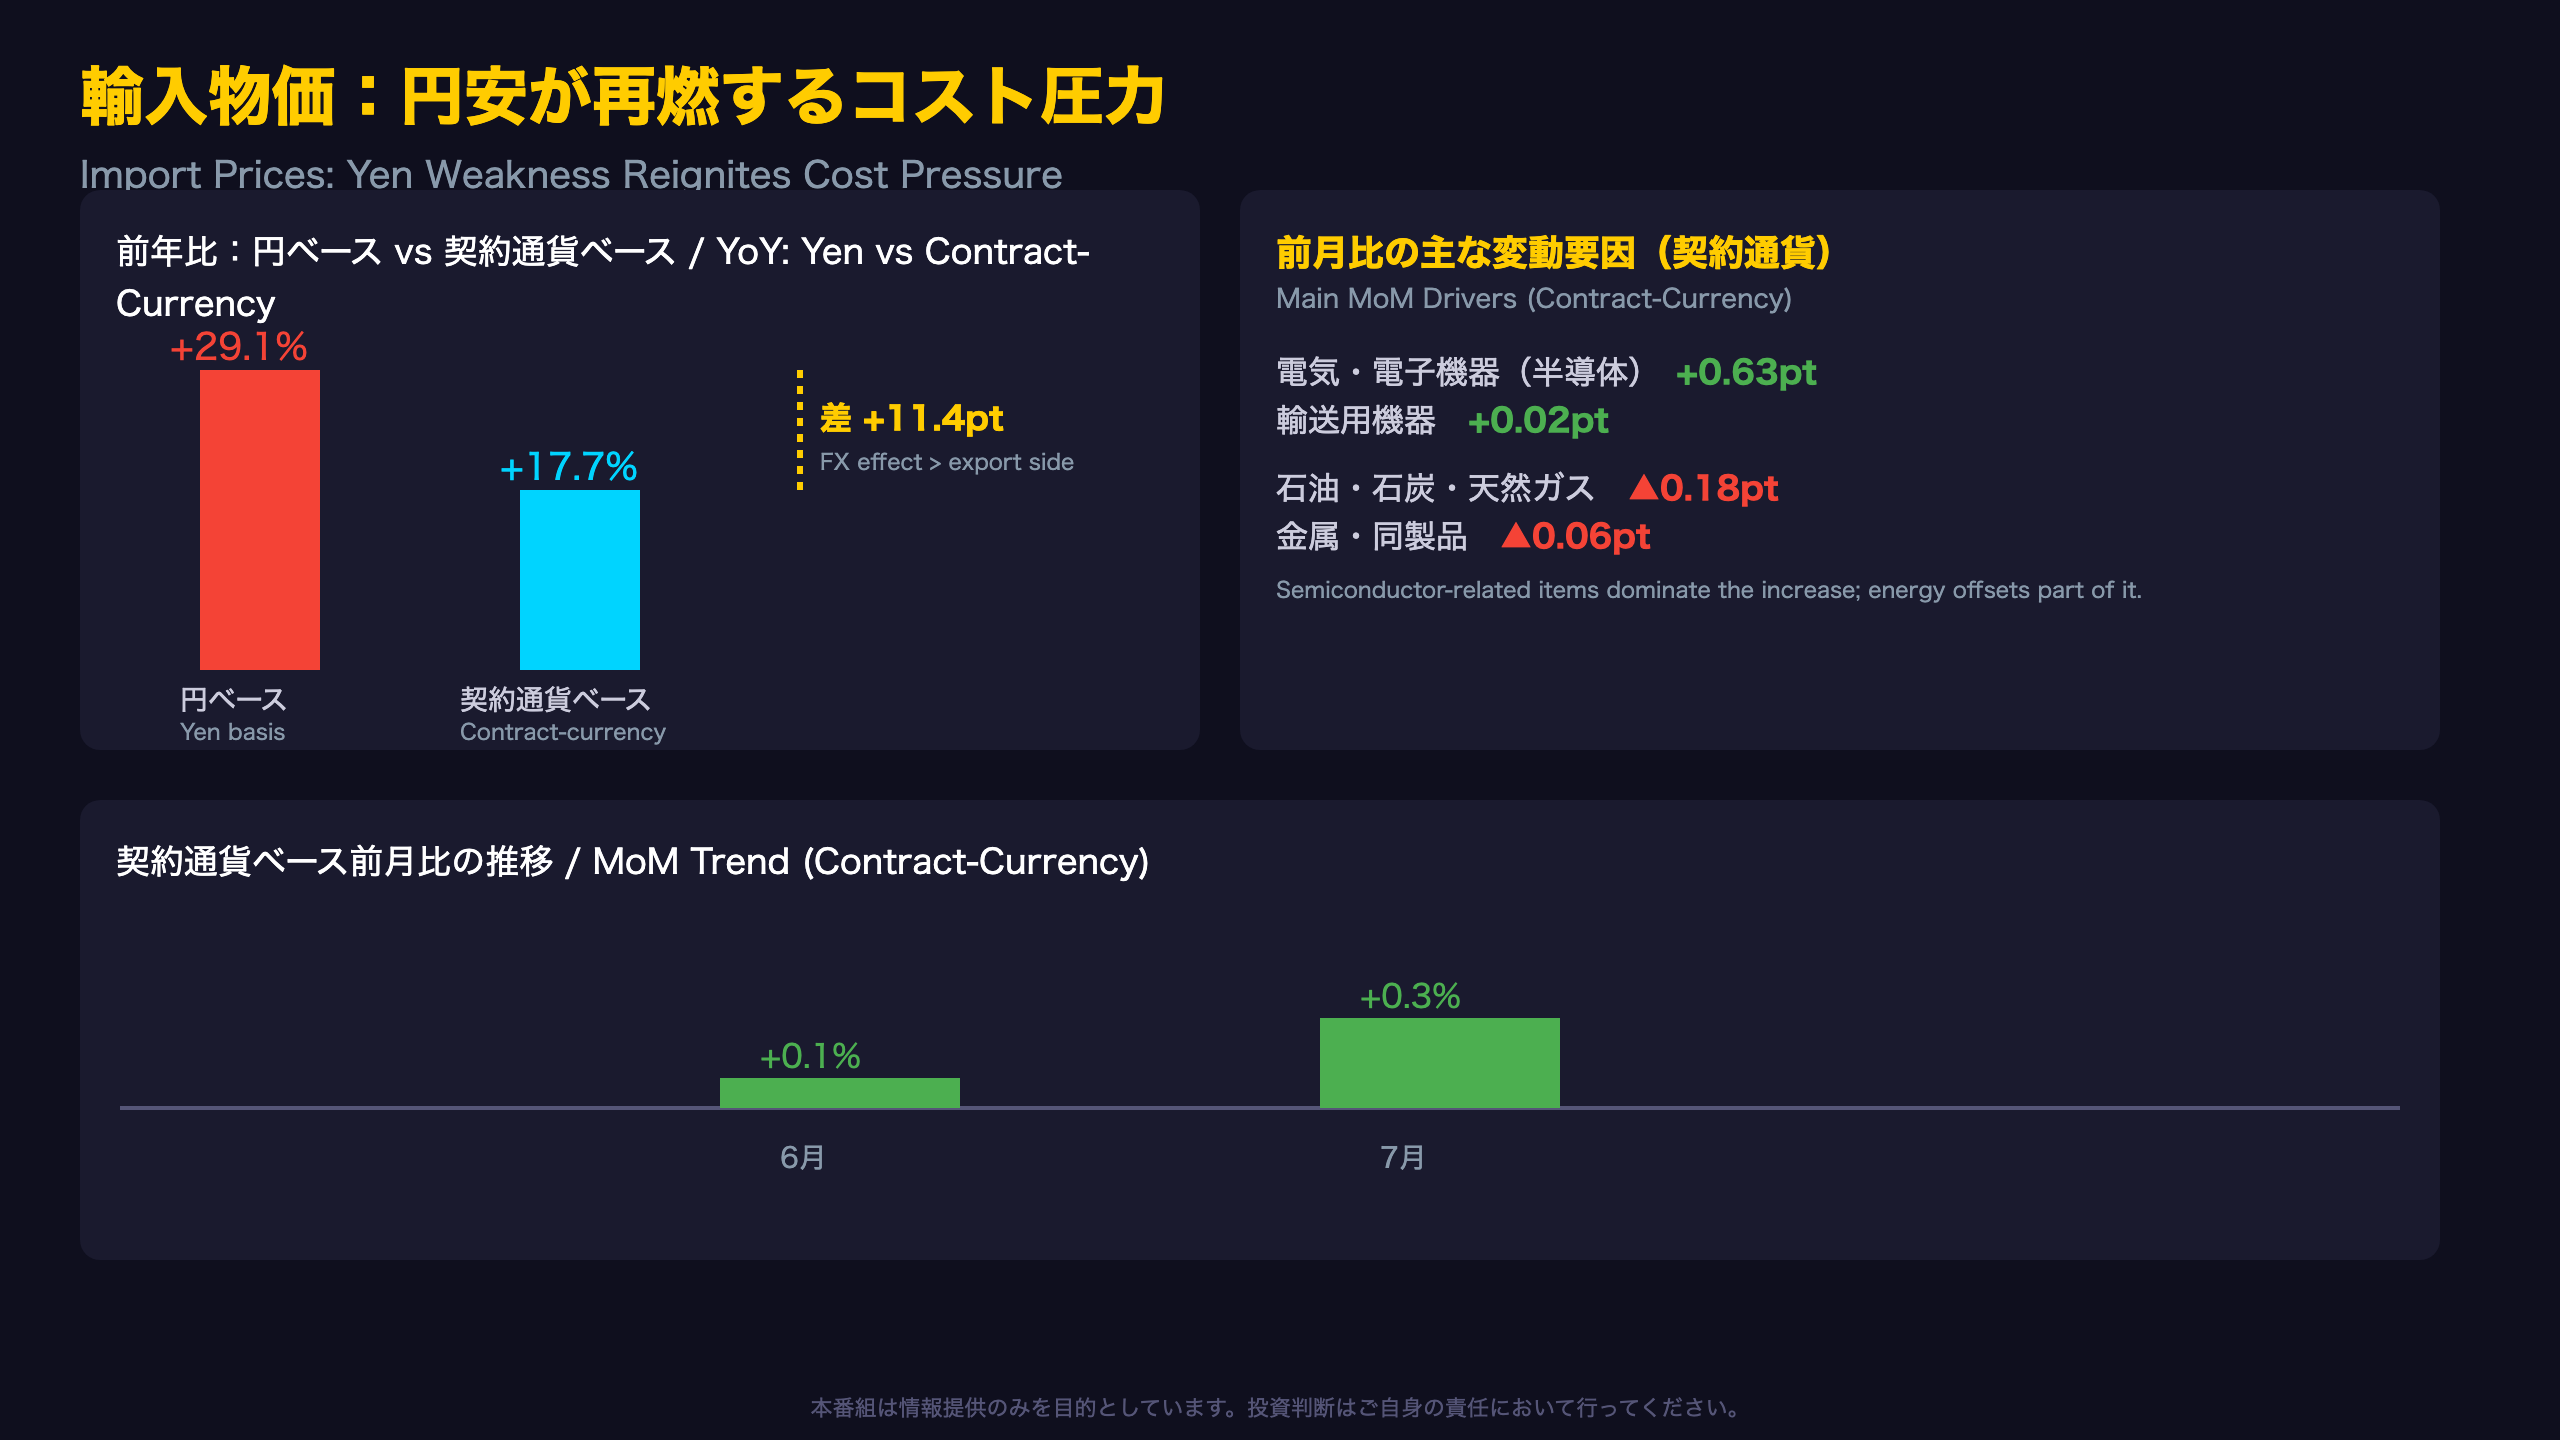
Japan’s import price index, on a contract-currency basis, rose 0.3% month-on-month in July, up from a 0.1% gain in June. The largest contributor was electric and electronic equipment, adding 0.63 percentage points — driven specifically by MOS memory integrated circuits, wiring harnesses, and conveyance equipment. This suggests that robust global semiconductor demand is feeding directly into Japan’s import cost base (a Level-B inference, consistent with global chip-cycle strength reported elsewhere).
“Import prices rose 0.3% month-on-month on a contract-currency basis, and 1.3% on a yen basis, up 29.1% year-on-year.” — BOJ release
The Yen Effect Is Bigger Here Than in Exports
Import prices are more sensitive to yen depreciation than export prices. The year-on-year gap between the yen-based figure (+29.1%) and the contract-currency figure (+17.7%) is 11.4 percentage points — notably larger than the 8.8-point gap seen on the export side. This asymmetry matters: Japan, as a net energy and resource importer, feels yen weakness more acutely on the cost side than it benefits on the revenue side, at least in currency-adjusted terms.
What Offset the Increase
Petroleum, coal, and natural gas subtracted 0.18 points, as naphtha, crude oil, and jet fuel prices declined — reflecting some easing in global energy markets that partially offset the semiconductor-driven cost increase.
The CPI Pass-Through Question
It is generally believed that rising import prices feed through to domestic producer and consumer prices with a time lag of several months to a year — a mechanism familiar to observers of the U.S. PPI-to-CPI relationship as well. However, this single month’s data cannot by itself confirm the speed or magnitude of that pass-through. The critical variable to watch is which downstream product categories ultimately absorb the semiconductor-driven cost increase, and how much reaches household budgets.
価格転嫁の進捗:素原材料→中間財→最終財 / Price Pass-Through: Upstream to Downstream
No Formal Demand-Stage Breakdown — Using Category Data as a Proxy
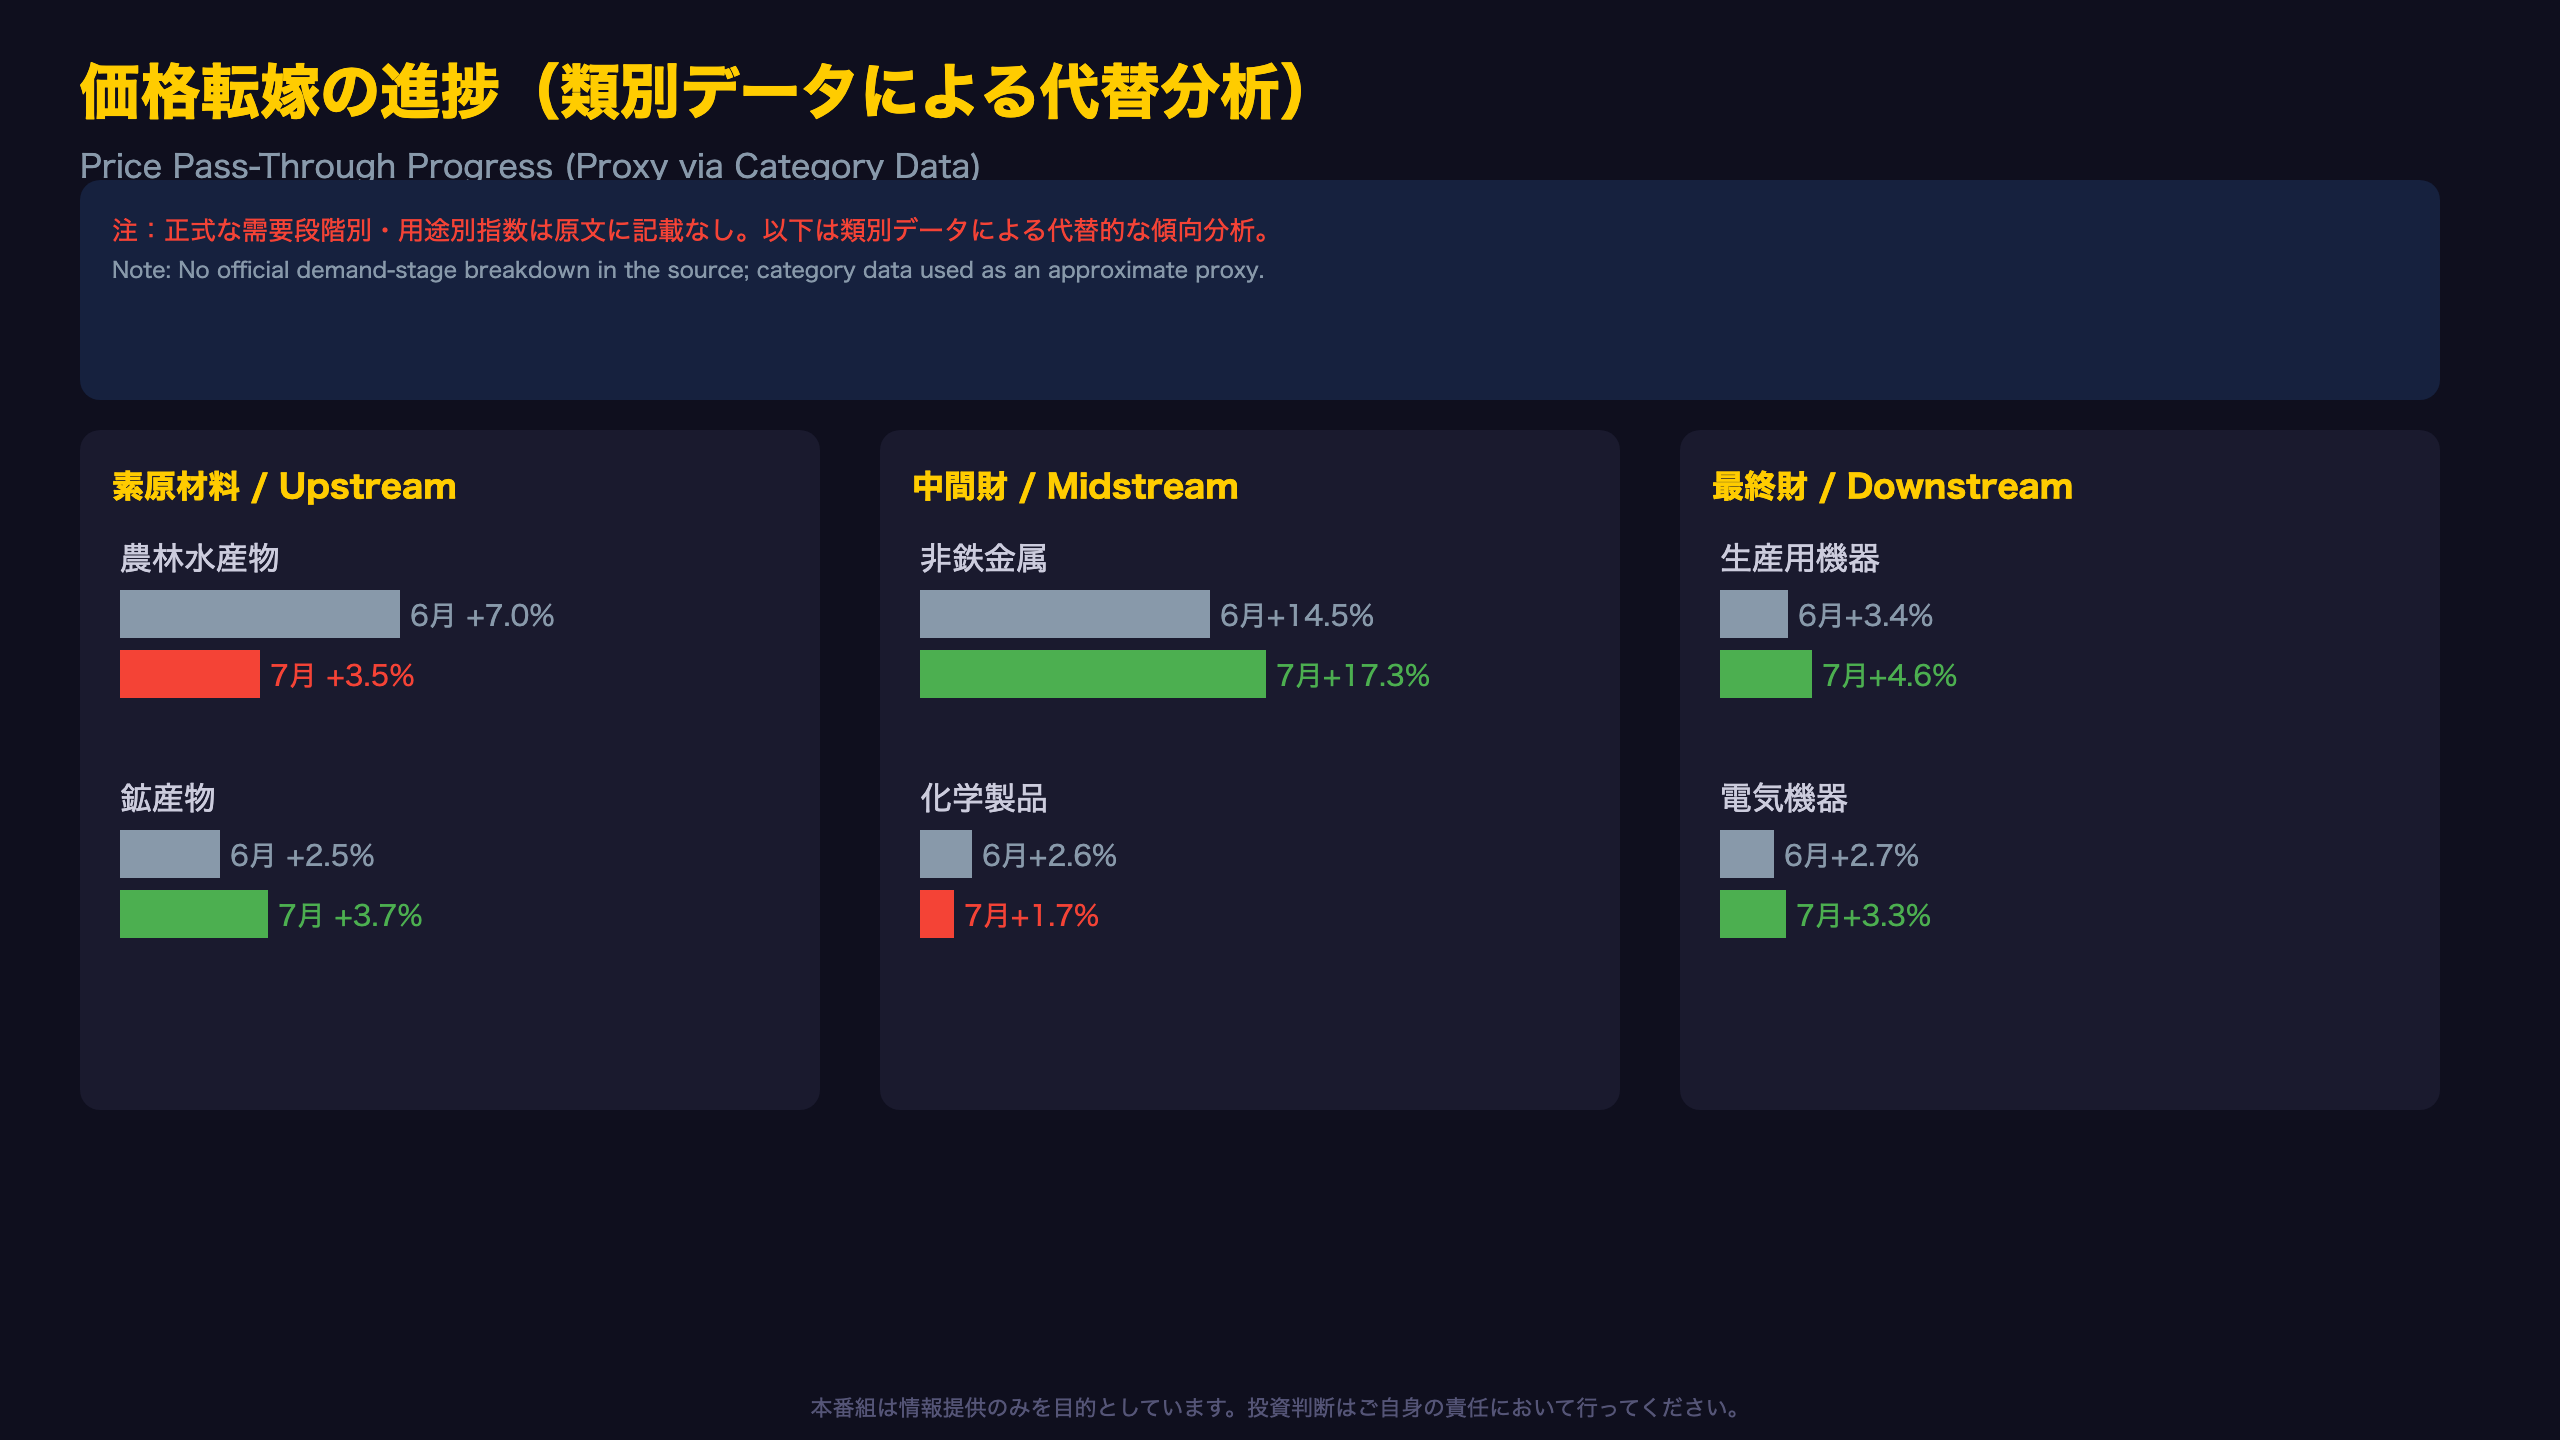
Japan’s CGPI typically includes a breakdown by demand stage — raw materials, intermediate goods, and finished goods — which is the standard way analysts assess how cost pressures move through the supply chain toward consumers. This breakdown is not included in the July release provided here. As a substitute, we use the disclosed category-level (by-industry) data as an approximate proxy, with the caveat that this is directional, not a precise substitute for the official demand-stage series.
Upstream-Like Categories (YoY, June → July)
- Agricultural/marine products: +7.0% → +3.5% (sharp deceleration, possibly reflecting adjustments in rice, eggs, and chicken prices — a Level-C inference)
- Mining products: +2.5% → +3.7%
Midstream-Like Categories
- Non-ferrous metals: +14.5% → +17.3% (acceleration, likely tracking global commodity markets for aluminum and copper)
- Chemical products: +2.6% → +1.7% (deceleration)
- Steel: +2.6% → +3.3%
Downstream-Like Categories
- Production machinery: +3.4% → +4.6%
- Electric machinery: +2.7% → +3.3%
- Transport equipment: +2.6% → +2.6% (unchanged)
What This Suggests
The fact that several downstream categories accelerated in July suggests that partial cost pass-through into finished goods pricing is underway (a Level-B inference based on multiple corroborating categories). However, transport equipment showed no change at all, underscoring that pass-through is proceeding unevenly across industries — a nuance important for equity investors assessing margin resilience by sector.
日銀への政策インプリケーション / Policy Implications for the BOJ
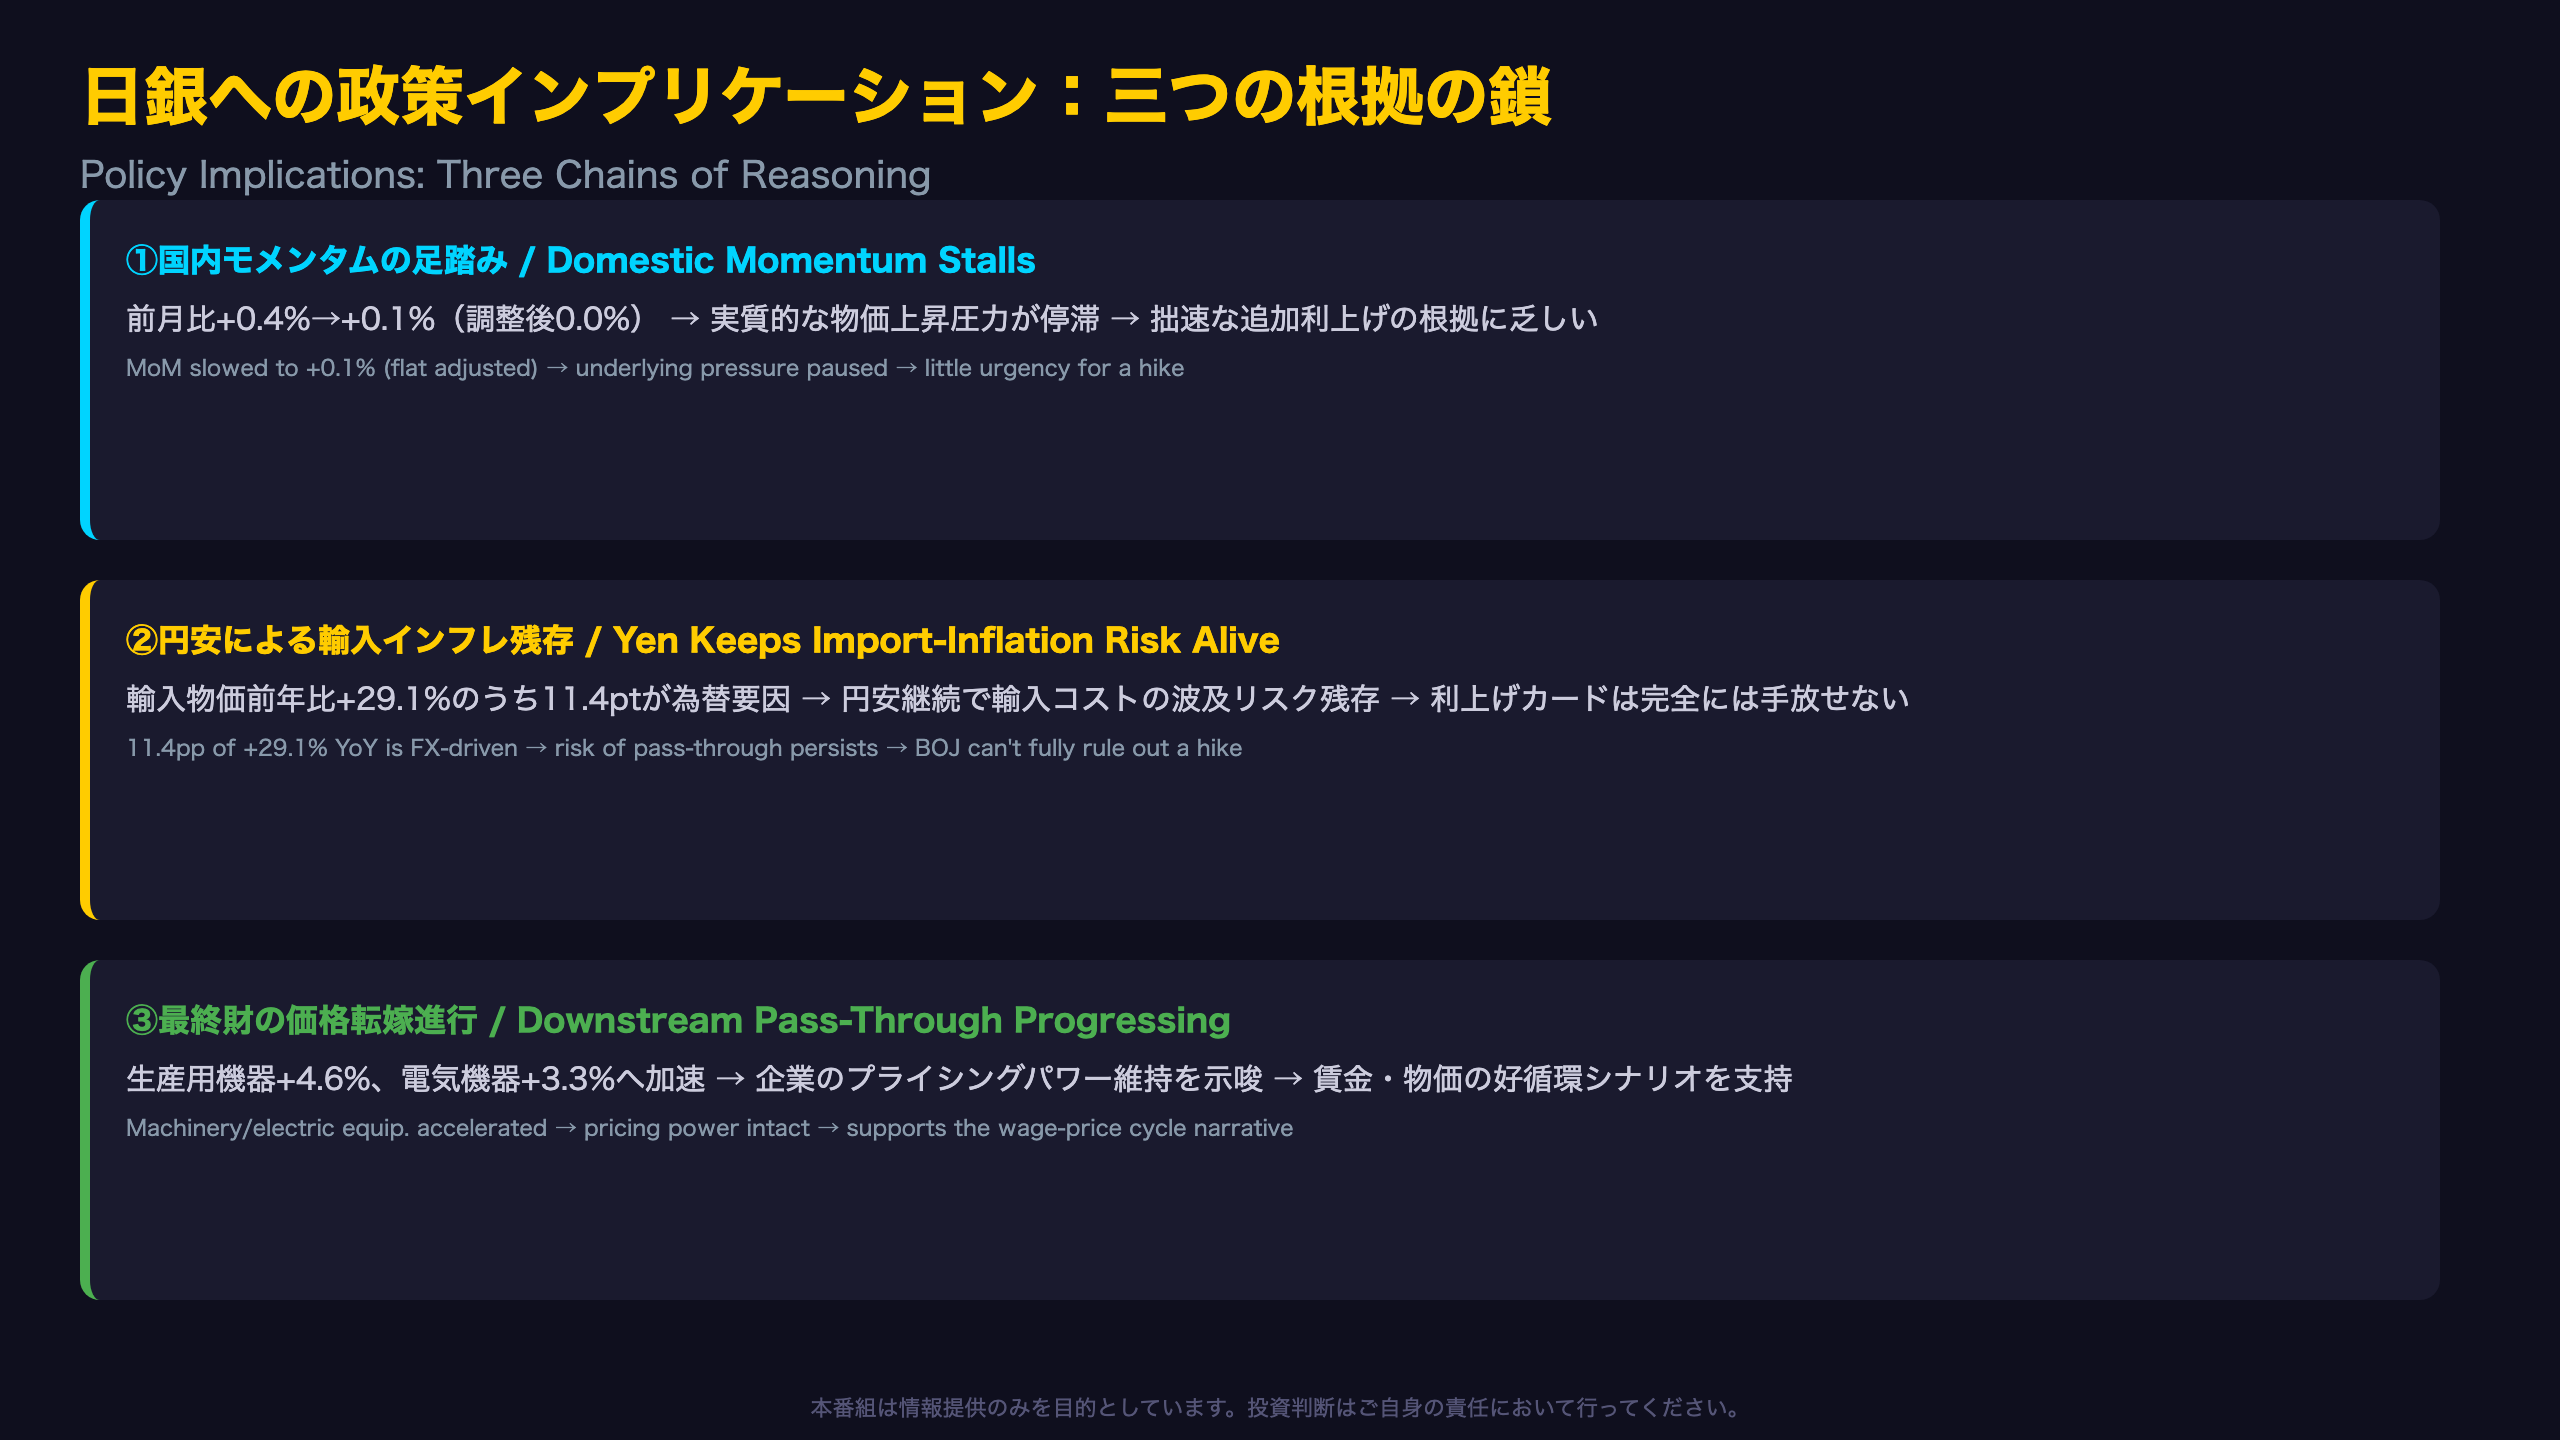
Three Chains of Reasoning: What the BOJ Is Watching
Producer price data rarely offers the BOJ a simple binary signal. Here are three distinct chains of reasoning likely shaping the policy discussion.
Chain 1: Domestic Momentum Has Stalled
Fact: Domestic PPI’s MoM growth slowed from +0.4% to +0.1% (flat at 0.0% after seasonal adjustment). Mechanism: Once the seasonal electricity surcharge is excluded, underlying cost-push pressure appears to have paused. Market/Policy Implication: This gives the BOJ little urgency to pursue an additional rate hike in the near term.
Chain 2: Yen Weakness Keeps an Import-Inflation Risk Alive
Fact: Of the 29.1% YoY yen-based rise in import prices, 11.4 percentage points is attributable to currency effects alone (contract-currency basis: +17.7%). Mechanism: As long as the yen stays weak, rising import costs will continue feeding through to domestic prices with a lag — a transmission channel familiar from the U.S. dollar-import-price relationship. Market/Policy Implication: The BOJ cannot fully discount upside inflation risk and will likely keep monitoring USD/JPY closely, keeping the rate-hike option on the table.
Chain 3: Downstream Pass-Through Is Progressing
Fact: YoY growth accelerated in downstream-like categories such as production machinery (+4.6%) and electric machinery (+3.3%) compared to June. Mechanism: This suggests firms are partially succeeding in passing intermediate costs through to finished-goods prices. Market/Policy Implication: This supports the BOJ’s long-sought “virtuous cycle” of wages and prices, a structural precondition for policy normalization.
Bottom Line
It is generally understood that producer price trends feed into CPI with a lag of several months to half a year, but this single data release cannot confirm the pace or magnitude of that pass-through. With domestic momentum cooling even as yen-driven import costs stay elevated, the BOJ has ample reason to maintain a strictly data-dependent, neutral policy stance rather than committing to a clear directional bias.
市場への示唆:円相場が次の焦点 / Market Implications: The Yen Is the Next Focal Point
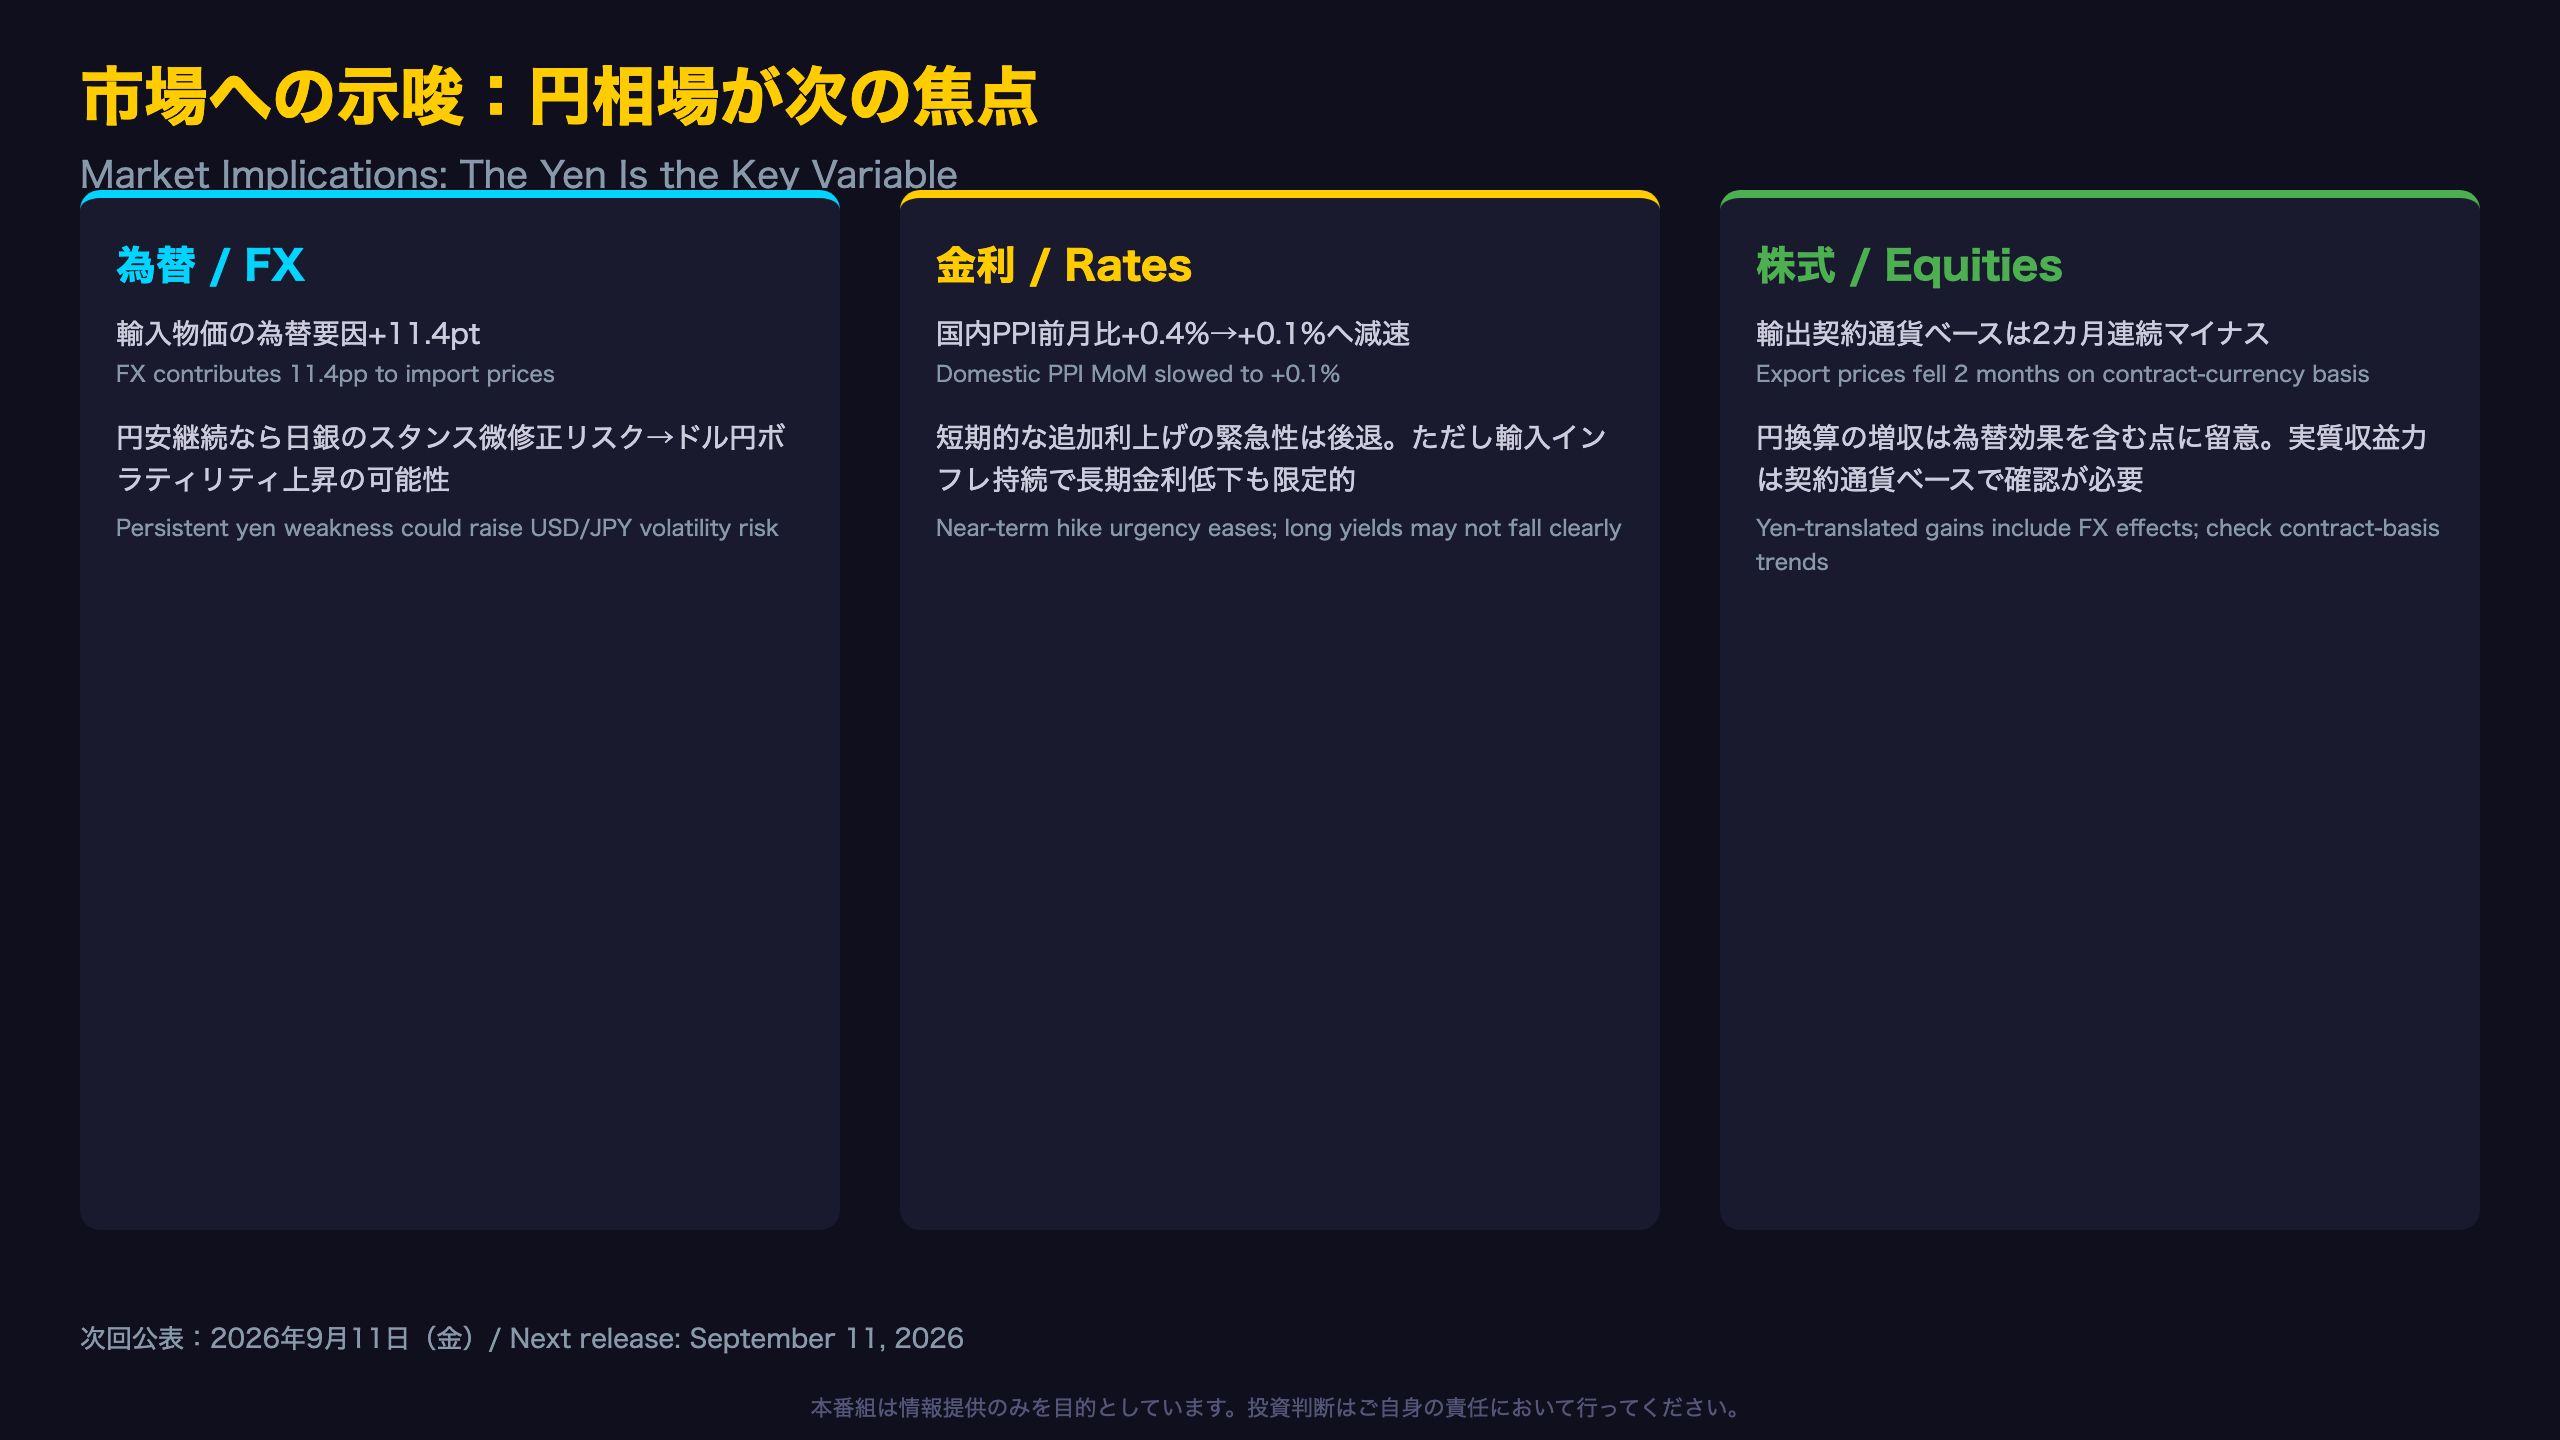
The Yen Is the Next Fork in the Road
The central tension in this CGPI release is a genuine crosscurrent: domestic price momentum is cooling, even as yen-driven import cost pressure persists. These two forces tend to pull BOJ policy calculus in opposite directions, reinforcing a wait-and-see stance.
Implications for FX Markets
[Fact] 11.4 of the 29.1% YoY yen-based rise in import prices is purely currency-driven. [Mechanism] As long as the yen stays weak, this import-cost channel keeps feeding through to domestic prices. [Market implication] If the BOJ begins treating yen weakness explicitly as a price-stability risk, verbal intervention or subtle policy-stance shifts could increase USD/JPY volatility. It is generally understood that shifts in a central bank’s tone can trigger short-term overreactions in FX markets, though this single data release cannot quantify the scale of any such reaction.
Implications for Rates Markets
[Fact] Domestic PPI’s MoM pace slowed from +0.4% to +0.1% (flat when seasonally adjusted). [Mechanism] This reduces the urgency for an imminent additional rate hike. [Market implication] JGB yields may face limited near-term upward pressure. That said, with import-inflation risk still present, a clear downward trend in long-term yields isn’t guaranteed either — this is a genuinely two-sided setup, not a one-directional dovish signal.
Implications for Equities
Exporters are enjoying an apparent revenue boost in yen terms (roughly 8.8 percentage points of “phantom” currency-driven growth), even as they face two straight months of real price declines on a contract-currency basis. This underscores why equity analysts assessing exporter margin durability should look beyond simple yen-translated figures and examine underlying contract-currency price trends as well.
Looking Ahead
The next CGPI release lands on September 11. Key variables to watch: how the seasonal electricity adjustment unwinds, where USD/JPY trades, and whether downstream pass-through in finished-goods categories continues to broaden.
Disclaimer: This article is for informational purposes only. All investment decisions are made solely at your own risk.