
📺 Watch the Full Video Analysis
This article was automatically generated by the NFC Market Live AI analysis system. (Updated: 2026-08-20 08:59 JST)
📄 Primary Source
財務省
https://www.customs.go.jp/toukei/shinbun/trade-st/gaiyo2026_07.pdf
Deep dive into Japan’s July 2026 trade statistics released by the Ministry of Finance.
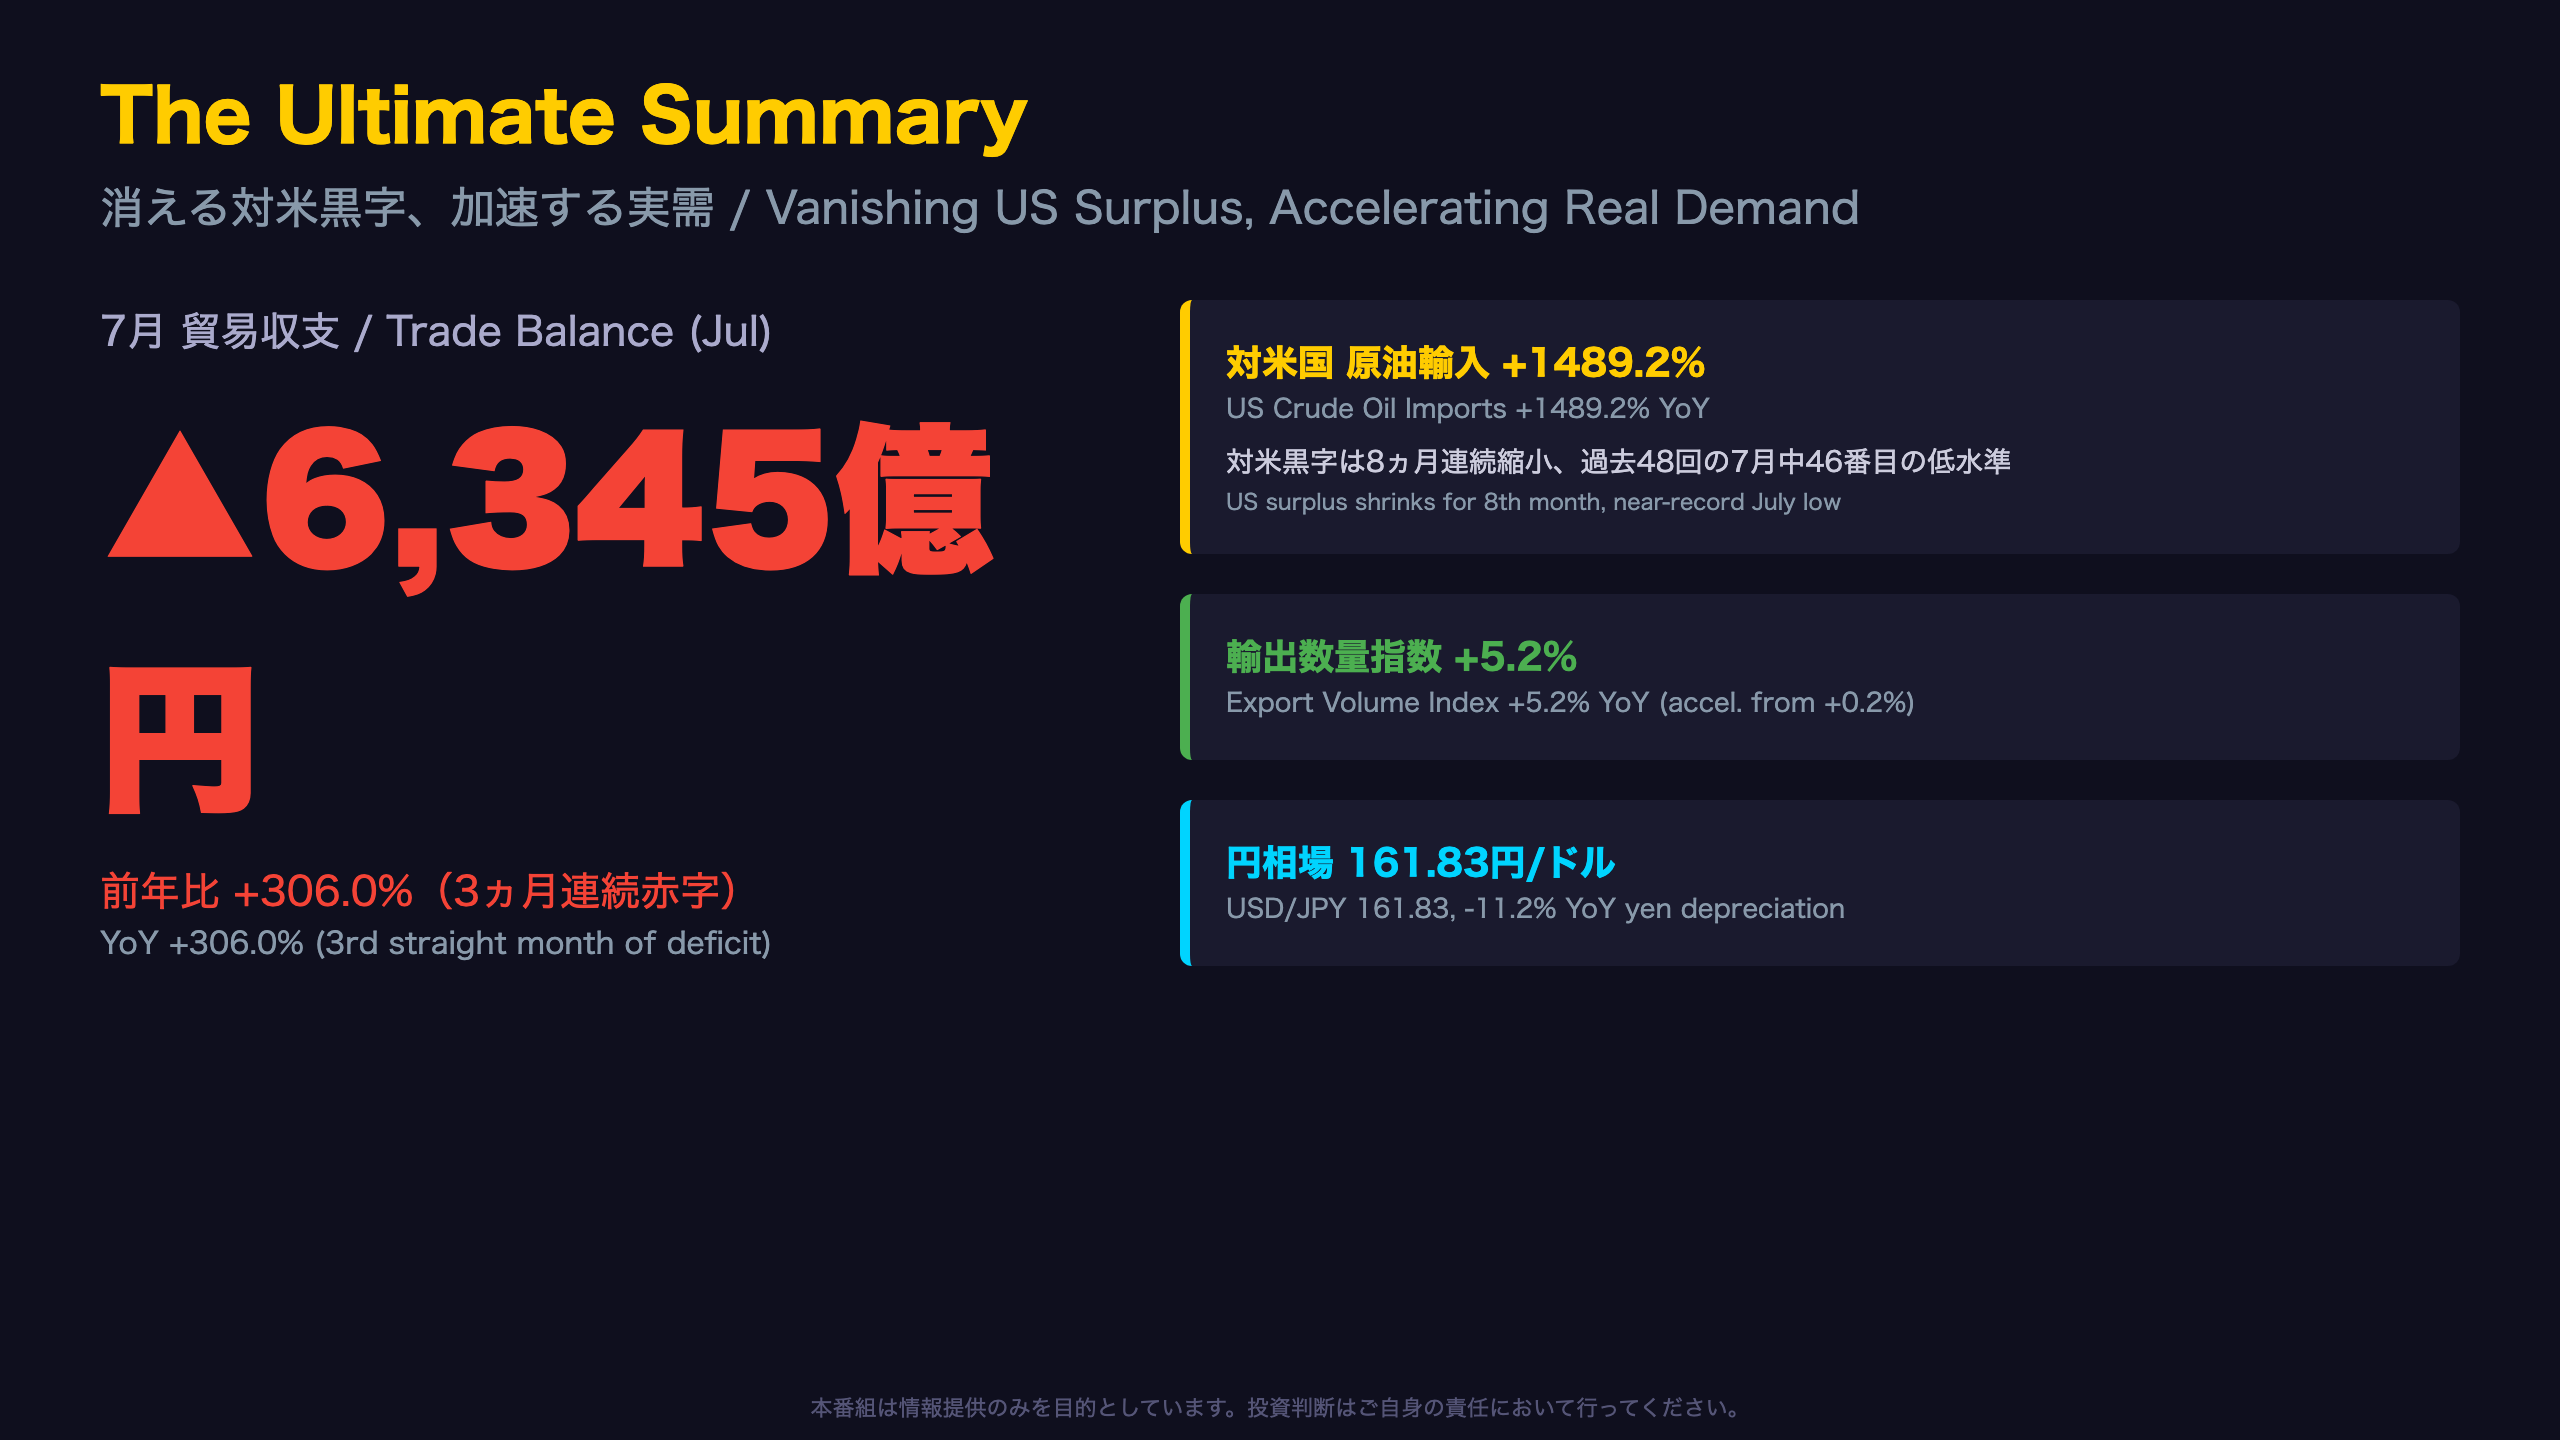
📊 Trade deficit hit ¥634.5bn, a third straight monthly shortfall, up 306% YoY.
🛢️ The real driver: US crude oil imports surged an extraordinary +1489.2% YoY, shrinking Japan’s bilateral surplus with the US for an 8th straight month to near-record July lows.
📈 Meanwhile, real export volumes accelerated to +5.2%, the fastest in months, led by semiconductor demand.
💴 The yen weakened to 161.83/USD, down 11.2% YoY.
We break down both the price-driven deficit and the underlying strength in real trade volumes.
The Ultimate Summary:消える対米黒字、加速する実需
Headline at a Glance
Japan’s Ministry of Finance (MOF) released preliminary July 2026 trade statistics showing a deficit of ¥634.5 billion, the third consecutive monthly shortfall. But the real story is the historical positioning of the net balances:
- World balance: ranks 501st of 571 months on record; 44th of 48 Julys
- US balance: ranks 504th of 571 months; 46th of 48 Julys
- China balance: ranks 557th of 571 months; 48th of 48 Julys — the worst July on record
For context, Japan’s MOF trade statistics are the closest equivalent to the US Census Bureau’s monthly trade balance report, though Japan reports both nominal value and a volume (quantity) index separately — a distinction US data rarely emphasizes as clearly.
What makes this release unusual is the coexistence of record-high gross export and import values with historically weak net balances. That combination — not the deficit figure itself — is what quant desks should be watching. For US-based investors, this dynamic also intersects with bilateral trade politics, as Japan’s surplus with America (long a point of tension in tariff negotiations) is shrinking rapidly, a theme explored in later slides.
ヘッドライン全体像:価格要因が主導する赤字拡大
Nominal vs. Real: Quantifying the Price Effect
Japan’s trade data uniquely separates nominal value growth from a volume (quantity) index, offering a cleaner read on real demand than headline value alone — a distinction that’s harder to find in comparable US Census trade releases.
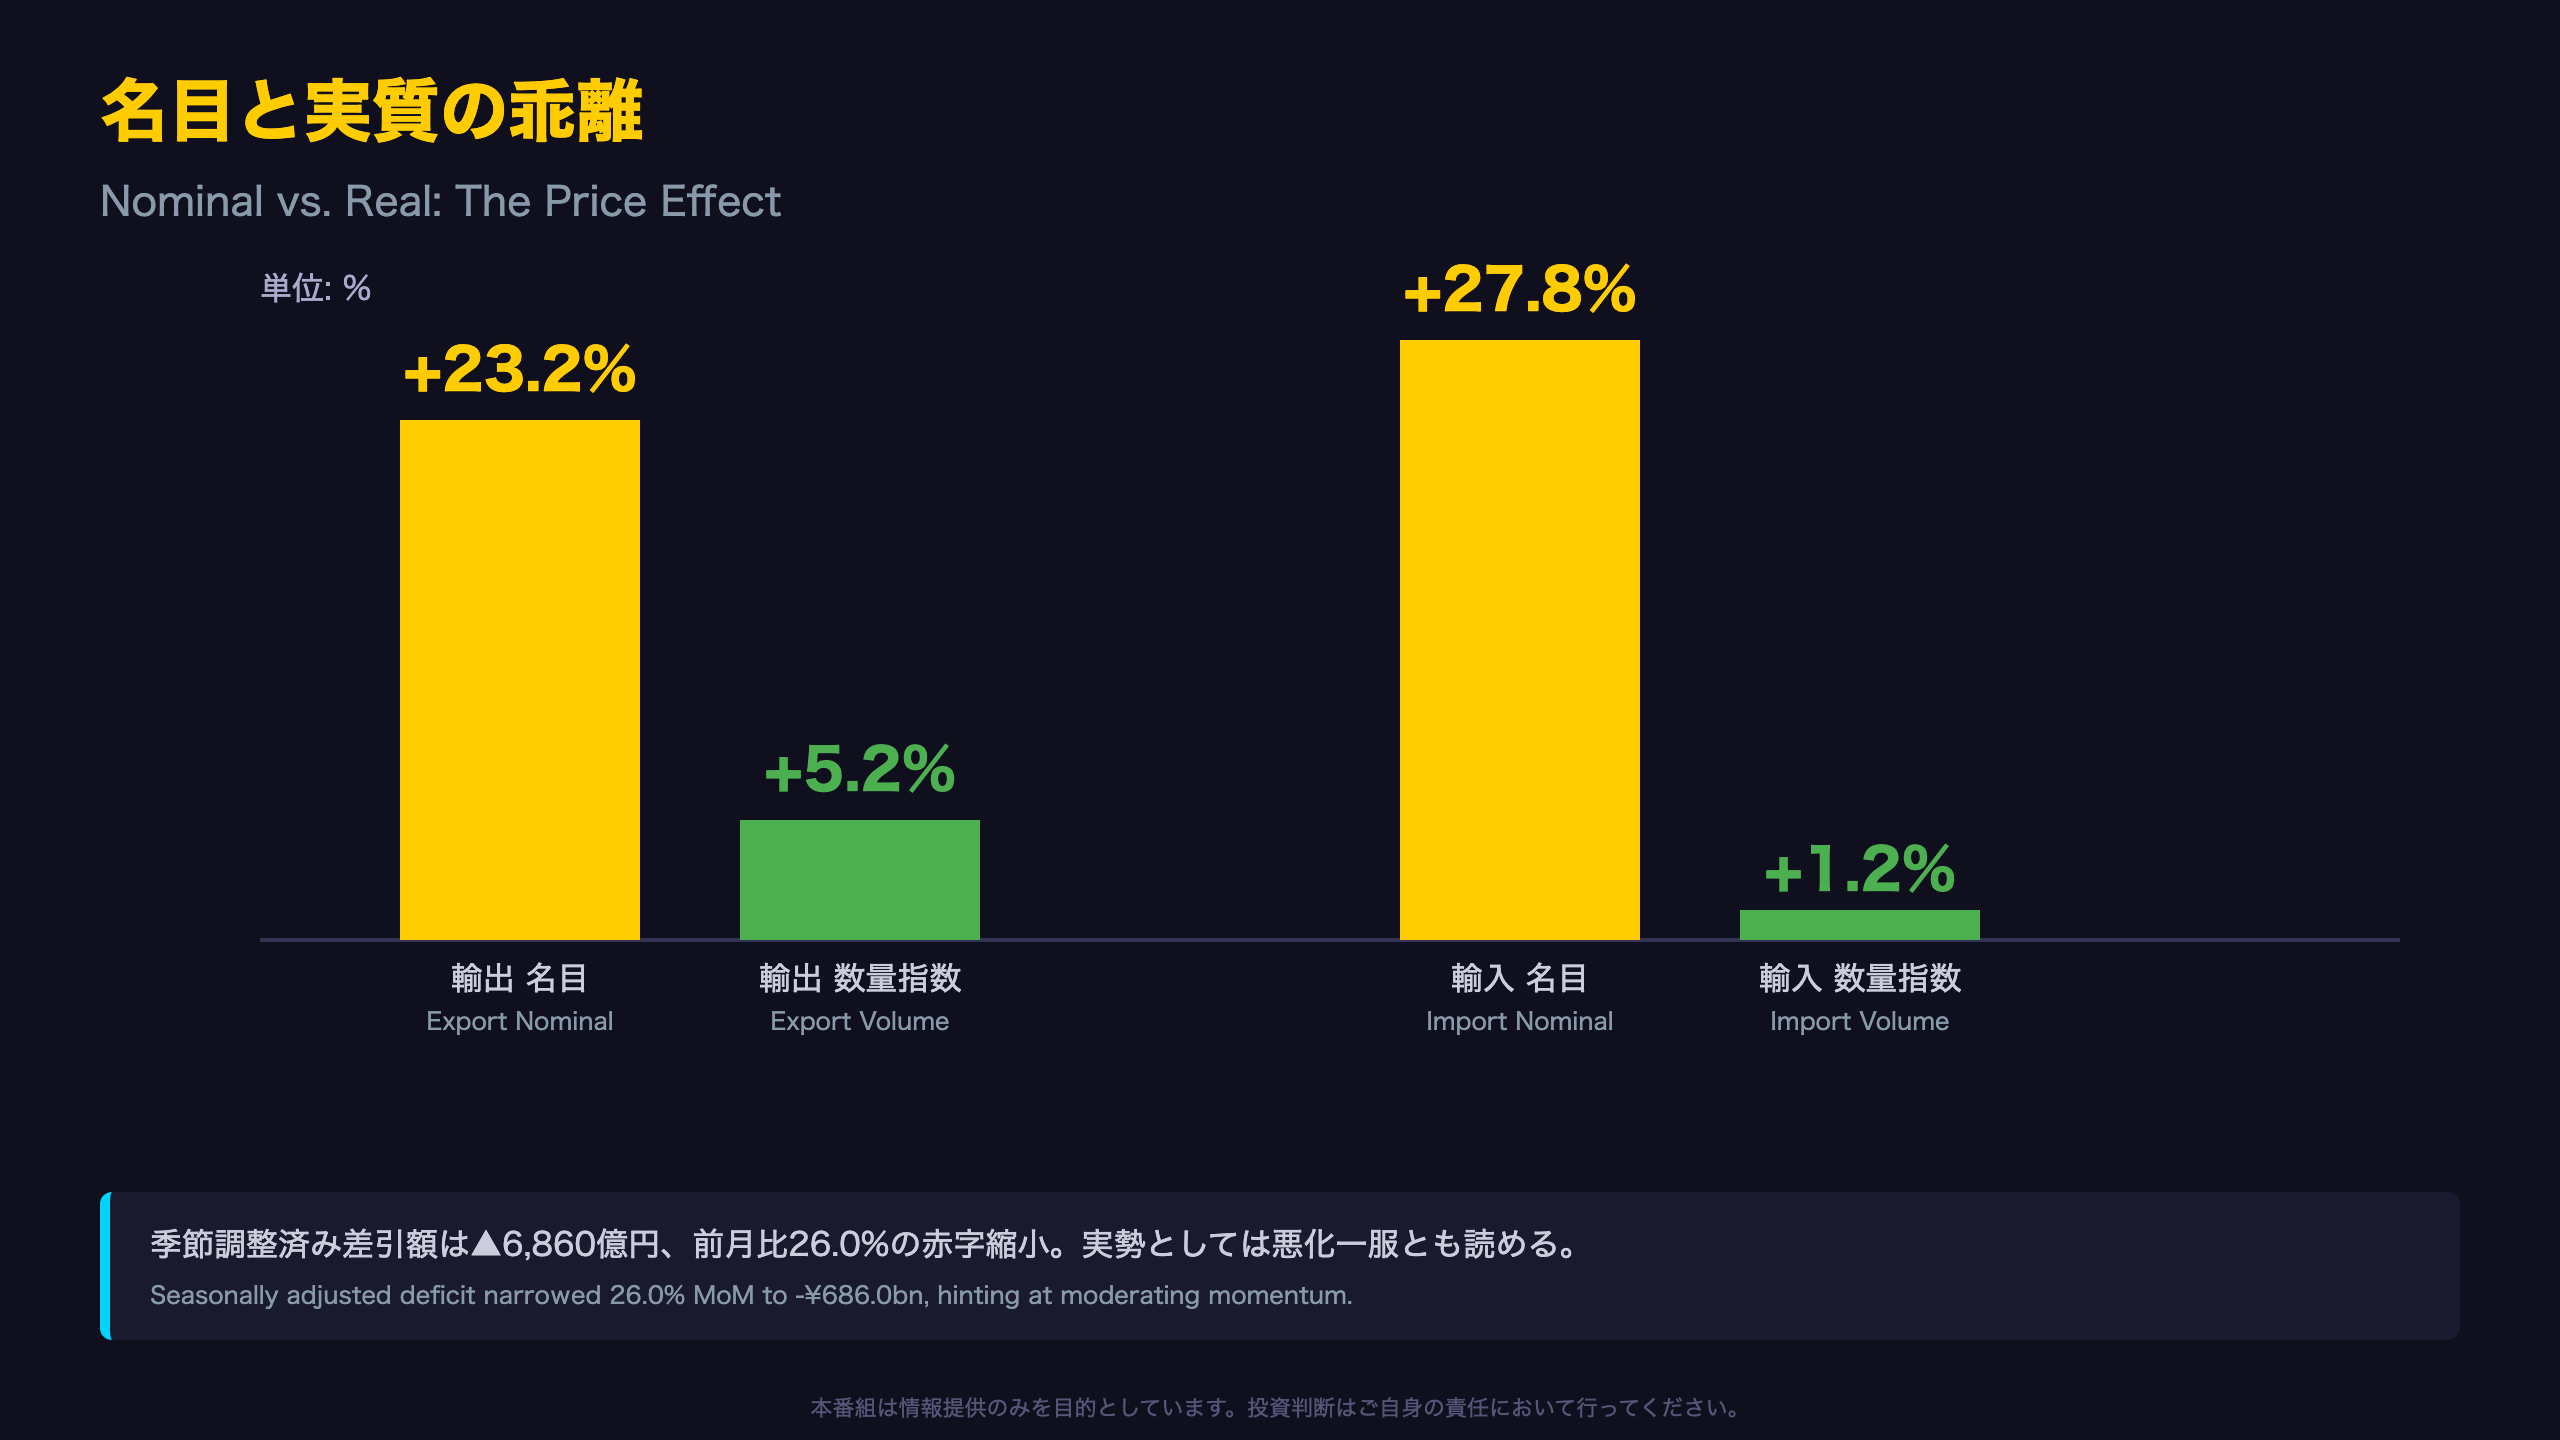
| Metric | Nominal YoY | Volume Index YoY | Implied Price/FX Effect |
|---|---|---|---|
| Exports | +23.2% | +5.2% | ~18pt |
| Imports | +27.8% | +1.2% | ~26.6pt |
This gap suggests the bulk of July’s headline surge is a price and currency story, not a demand story — consistent with the yen’s continued slide to 161.83 per dollar and elevated global energy prices.
On a seasonally adjusted month-on-month basis, the deficit actually narrowed to ¥686.0 billion from ¥882.0 billion in June, a 26.0% improvement. For US and European investors accustomed to headline-driven trade narratives, this nuance matters: the year-on-year deterioration may partly reflect a high base effect and currency translation rather than a genuine acceleration in import demand. That said, energy-driven import costs remain a real drag on Japan’s terms of trade, a dynamic explored further in the following slides on US crude oil imports.
対米国:原油輸入+1489%が黒字を消す
The Anatomy of an Oil Import Shock
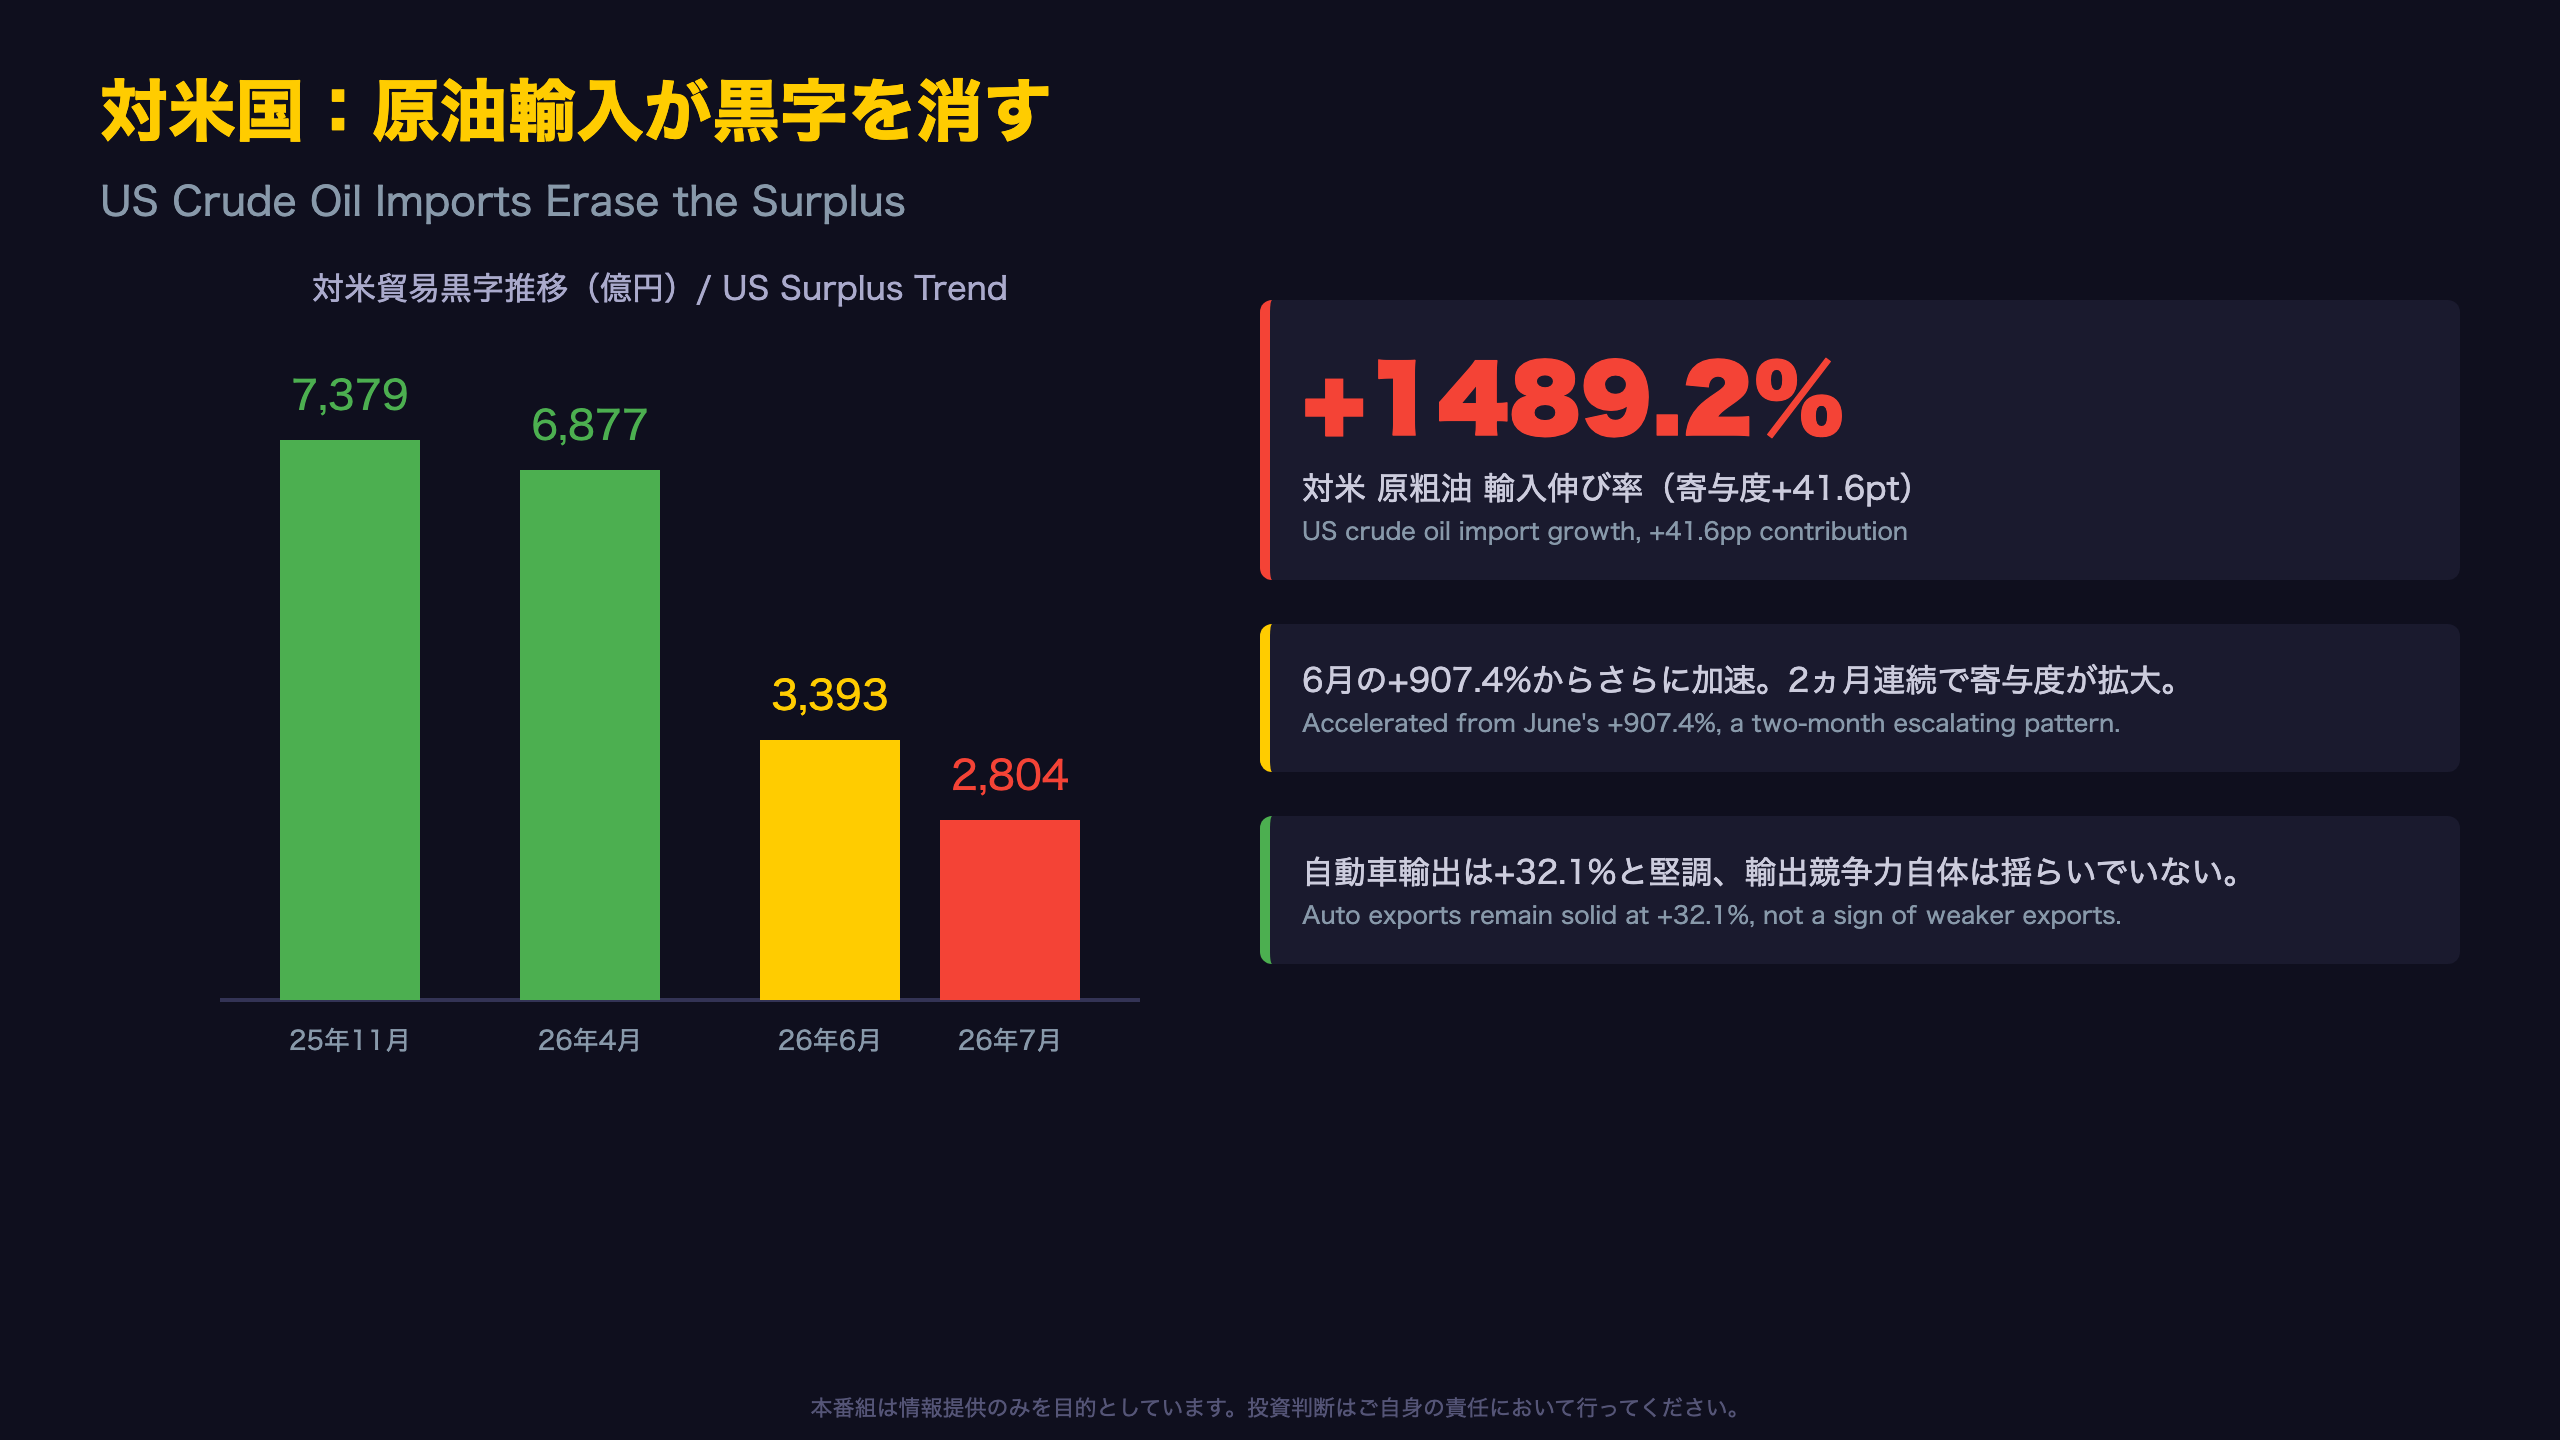
US crude oil imports into Japan grew 907.4% YoY in June (contributing +29.1pp to total US import growth) and then accelerated further to 1489.2% in July (+41.6pp contribution) — a two-month pattern that suggests this is more than a one-off statistical quirk.
Japan’s Trade Surplus with the US (¥ billions)
| Month | Surplus |
|---|---|
| Nov 2025 (peak) | 737.9 |
| Apr 2026 | 687.7 |
| Jun 2026 | 339.3 |
| Jul 2026 | 280.4 |
From its November 2025 peak, Japan’s surplus with the US has contracted roughly 62% in eight months.
For context, US readers should note this is the mirror image of the US-Japan bilateral trade balance long tracked by the US Census Bureau and frequently cited in tariff negotiations under the current US administration. A shrinking Japanese surplus — driven by energy purchases rather than weaker Japanese exports — could be read as easing a long-standing point of bilateral friction, even though the report itself offers no explicit policy commentary on the cause.
Notably, Japanese auto exports to the US remained robust at +32.1% YoY, underscoring that the surplus compression is an import-side (energy) phenomenon, not a sign of weakening Japanese export competitiveness — a nuance that matters for auto-sector equity investors.
対中国:半導体等製造装置輸出+129.2%の構造変化
Decomposing China Export Growth
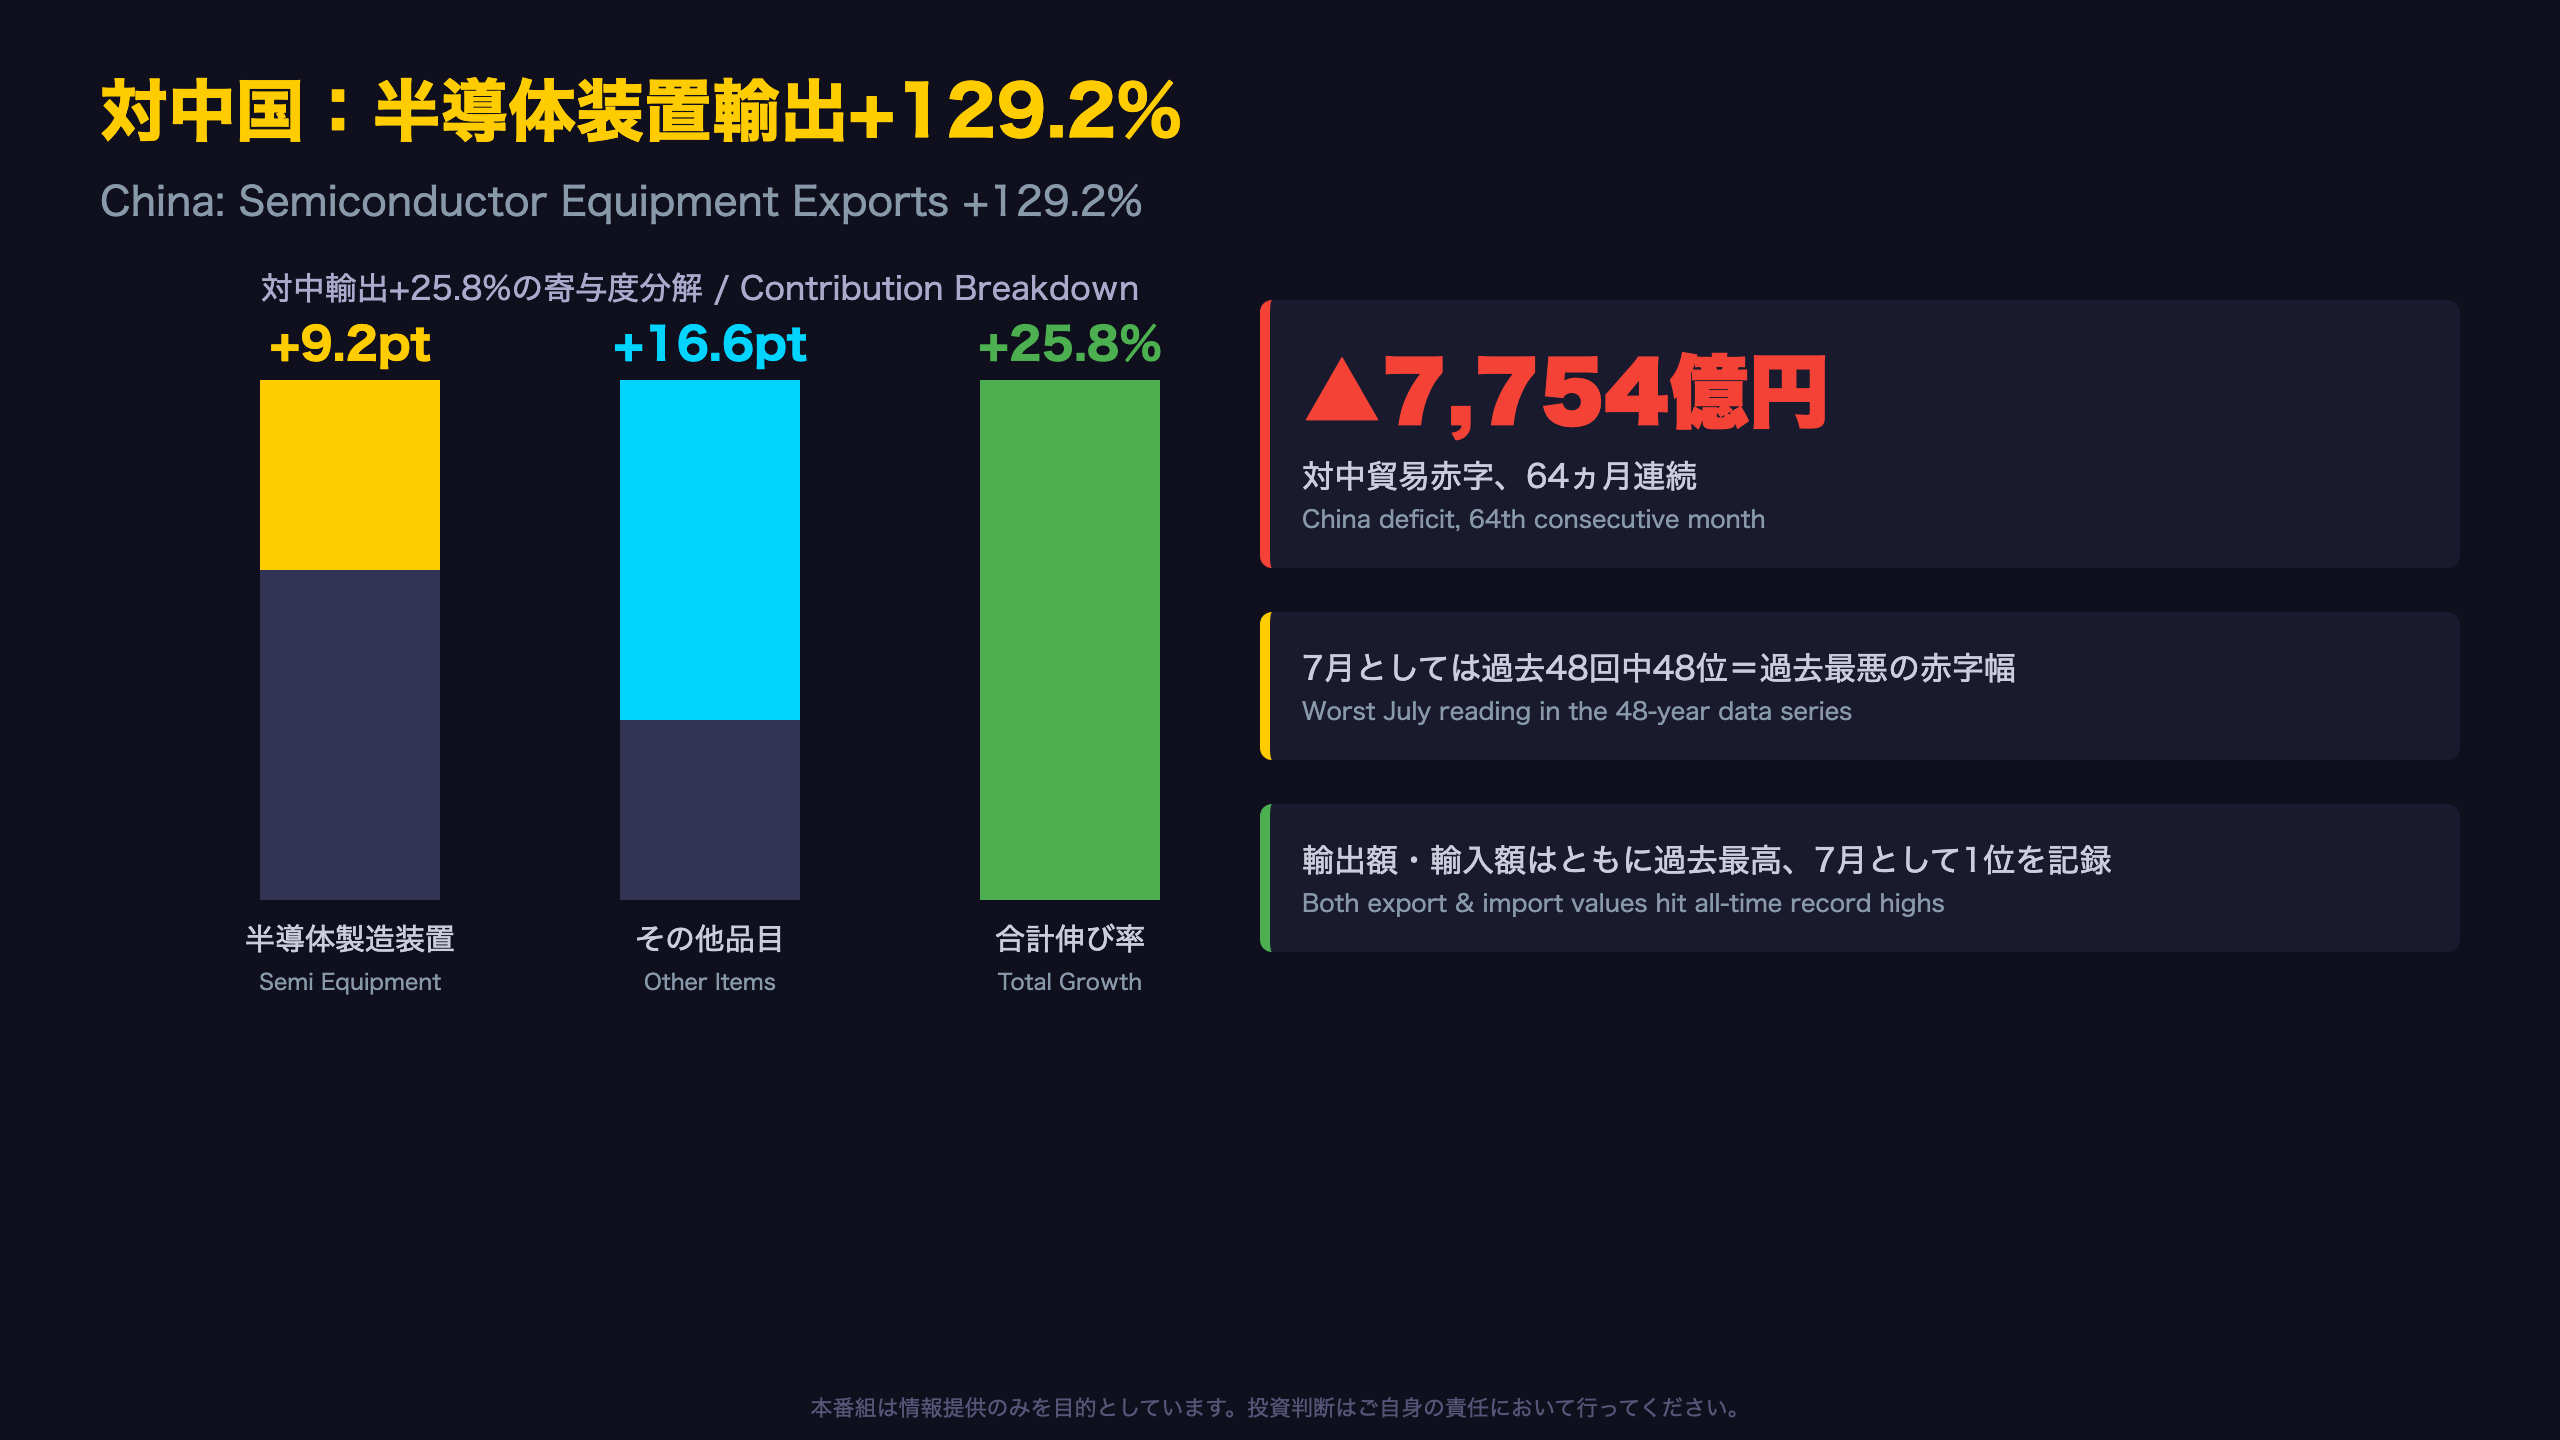
Of China exports’ +25.8% YoY growth, semiconductor manufacturing equipment alone contributed +9.2 percentage points — over a third of the total gain concentrated in a single product category.
China Trade Balance in Context
- 64 consecutive months in deficit (over five years)
- July deficit ranking: 48th of 48 — the worst July on record
- Yet both export and import values hit all-time record highs
This is a case of “record gross trade, record net deficit” simultaneously — Japan’s trade relationship with China is expanding in scale even as the structural deficit deepens.
For context, US and European readers should note this dynamic sits against the backdrop of tightening US-led semiconductor export controls targeting China. Japanese equipment makers (companies like Tokyo Electron, Advantest, and Disco, though not named in the MOF release) are frequently cited as beneficiaries of Chinese firms’ capital-expenditure front-loading and localization drives.
However, the report itself provides no causal explanation — whether this reflects panic-buying ahead of tighter controls or a genuine capex upcycle in China cannot be determined from a single month’s data. This is a key theme for semiconductor equipment sector investors to monitor alongside company-level earnings guidance in the coming quarters.
輸出数量指数の加速:実需の底堅さ
Volume Index: A Month-on-Month Acceleration
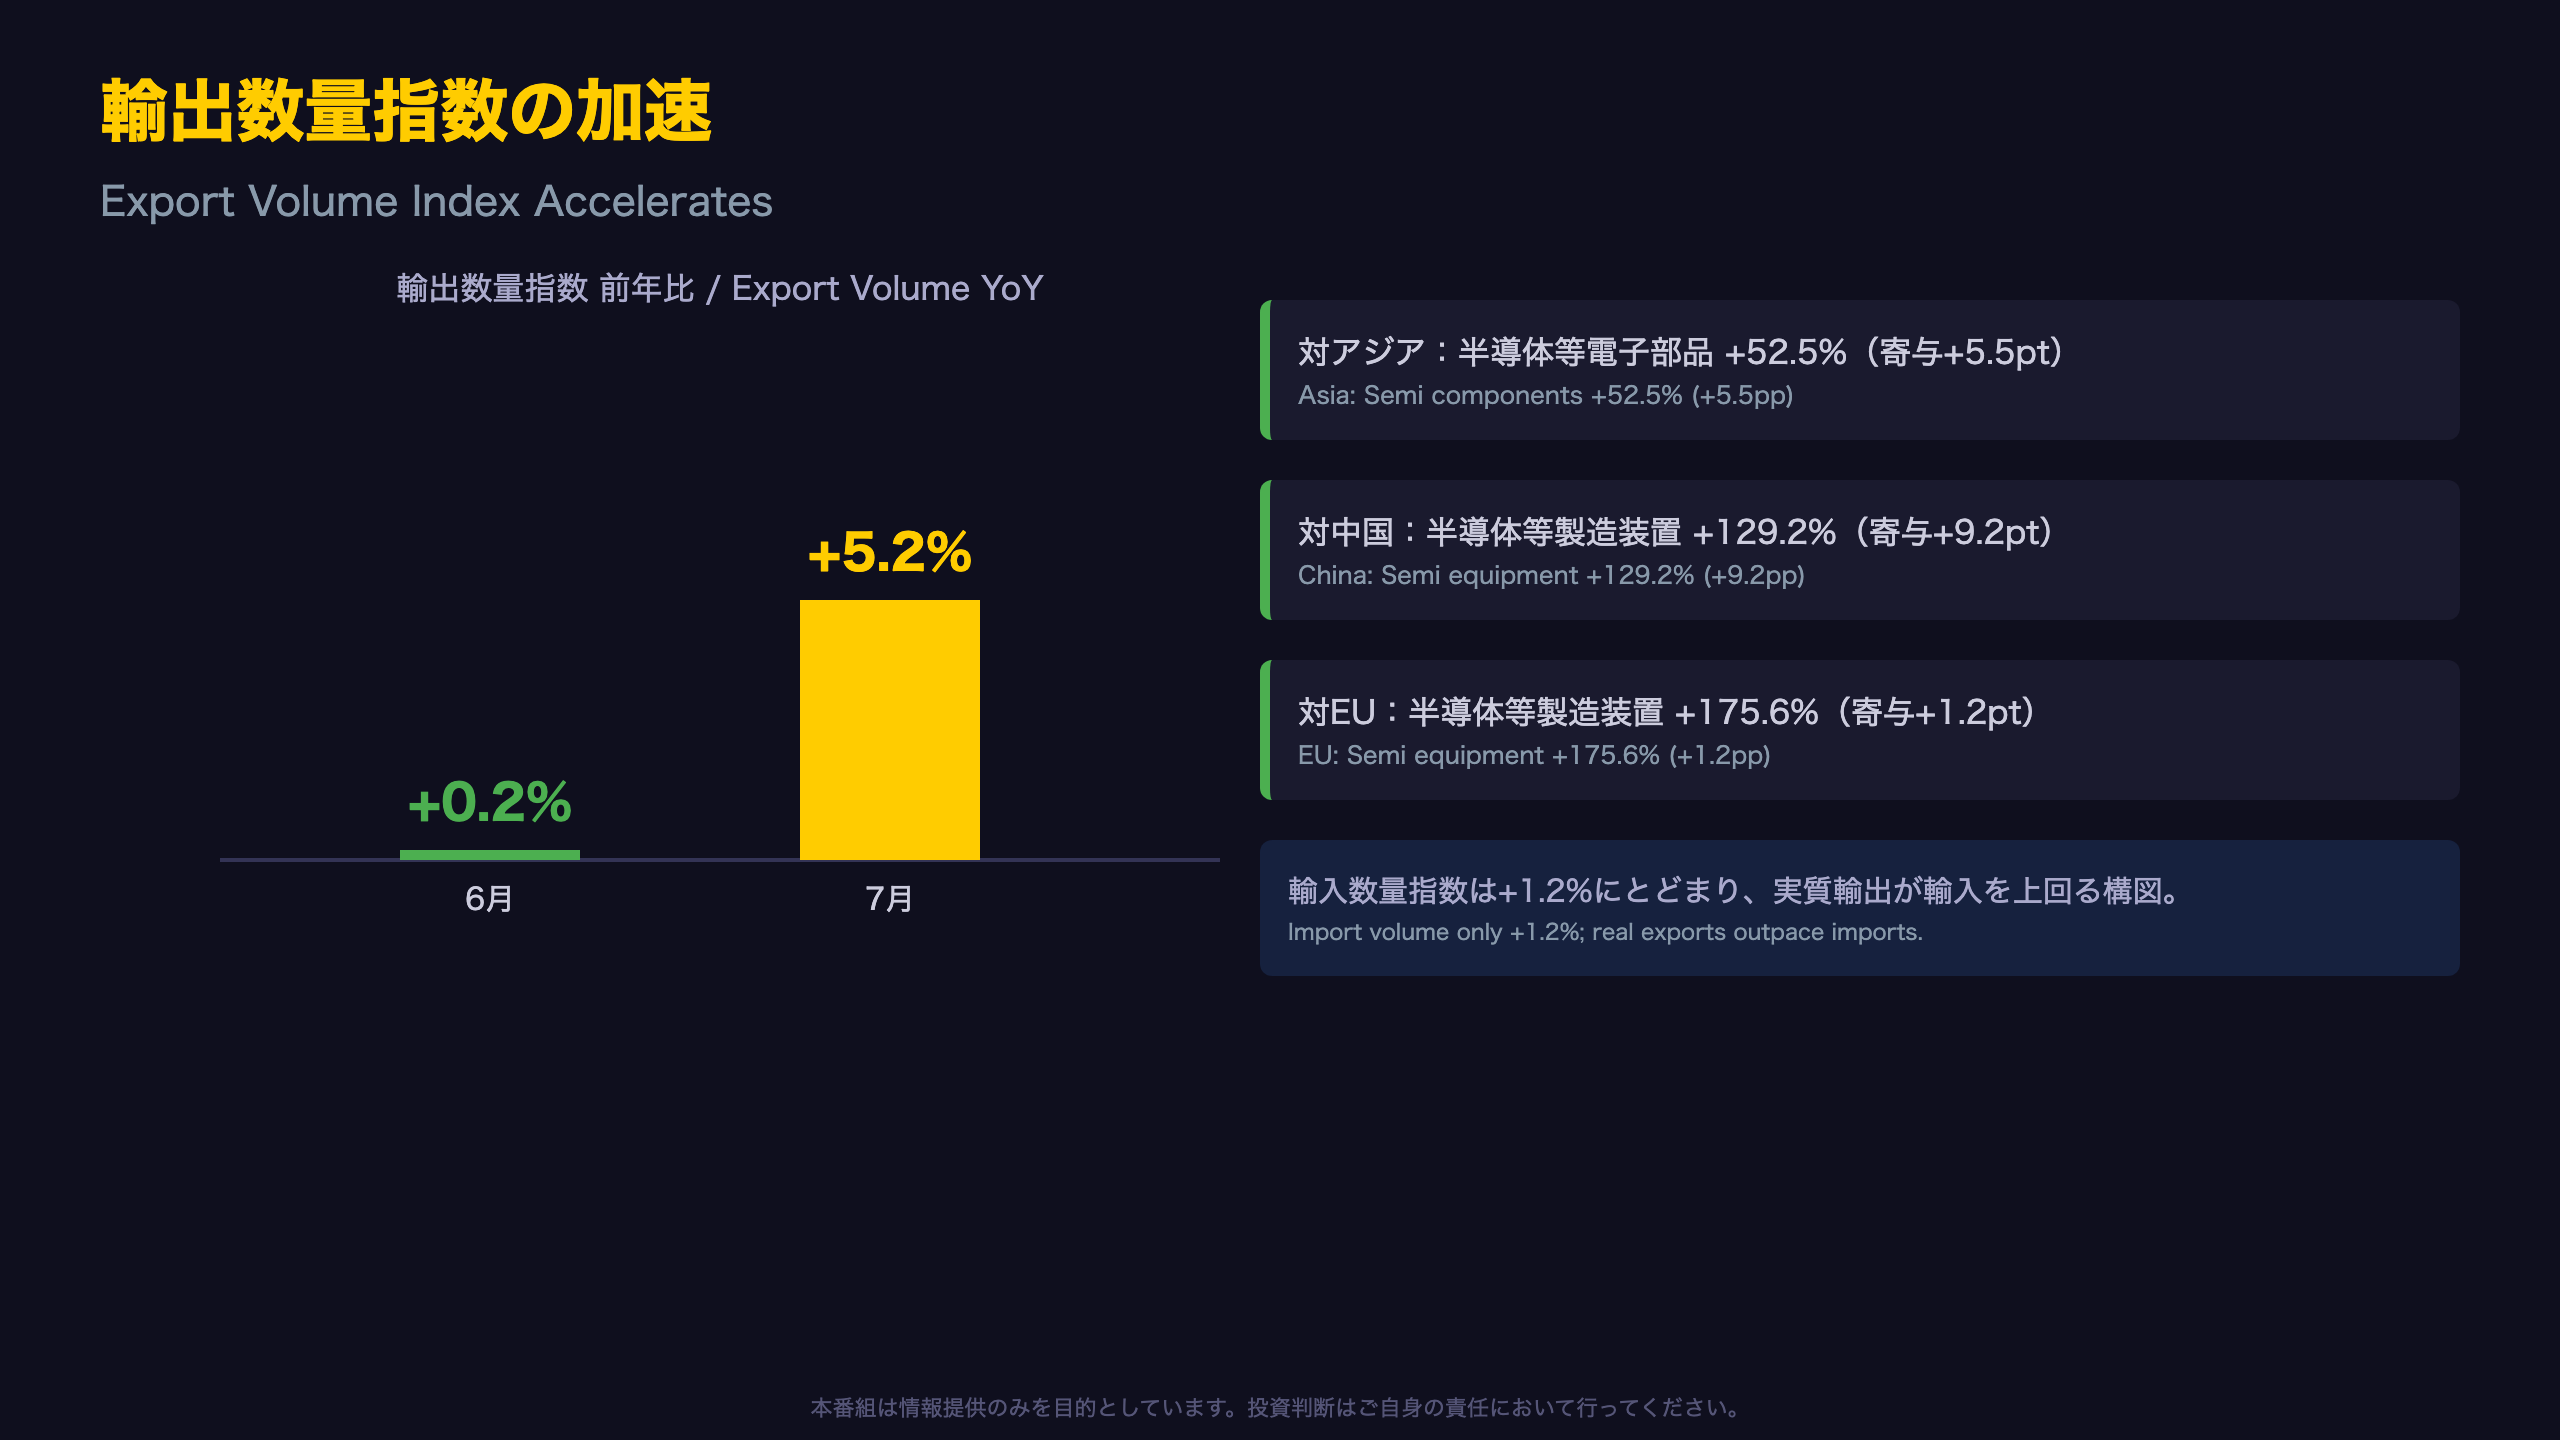
Japan’s export volume index growth jumped from +0.2% YoY in June to +5.2% in July — a five-point swing in a single month. While a one-month move alone warrants caution, the fact that semiconductor-related items appear at the top of increase-item lists across the US, EU, Asia, and China simultaneously strengthens the read that this reflects a genuine, broad-based reacceleration in the global chip capex cycle, not a regional anomaly.
Semiconductor-Related Contributions by Region
| Region | Item | Growth | Contribution |
|---|---|---|---|
| Asia | Semiconductor components | +52.5% | +5.5pp |
| China | Semiconductor equipment | +129.2% | +9.2pp |
| EU | Semiconductor equipment | +175.6% | +1.2pp |
Import volumes grew a modest +1.2%, meaning real export growth is outpacing real import growth — an export-led pattern in physical trade terms.
For international investors, this matters because Japan’s volume index functions similarly to real trade volume data used by the US Bureau of Economic Analysis in real net exports calculations — but is reported at a more granular monthly cadence. The takeaway: beneath a headline nominal deficit story driven by currency and energy prices, the physical volume of Japanese exports — closely tied to the global AI/semiconductor capex cycle — is showing genuine underlying strength, a potentially bullish signal for Japan’s export-oriented industrials and equipment makers.
総合評価:円安・実需二面性と日銀への含意
Tracking the Pace of Yen Depreciation
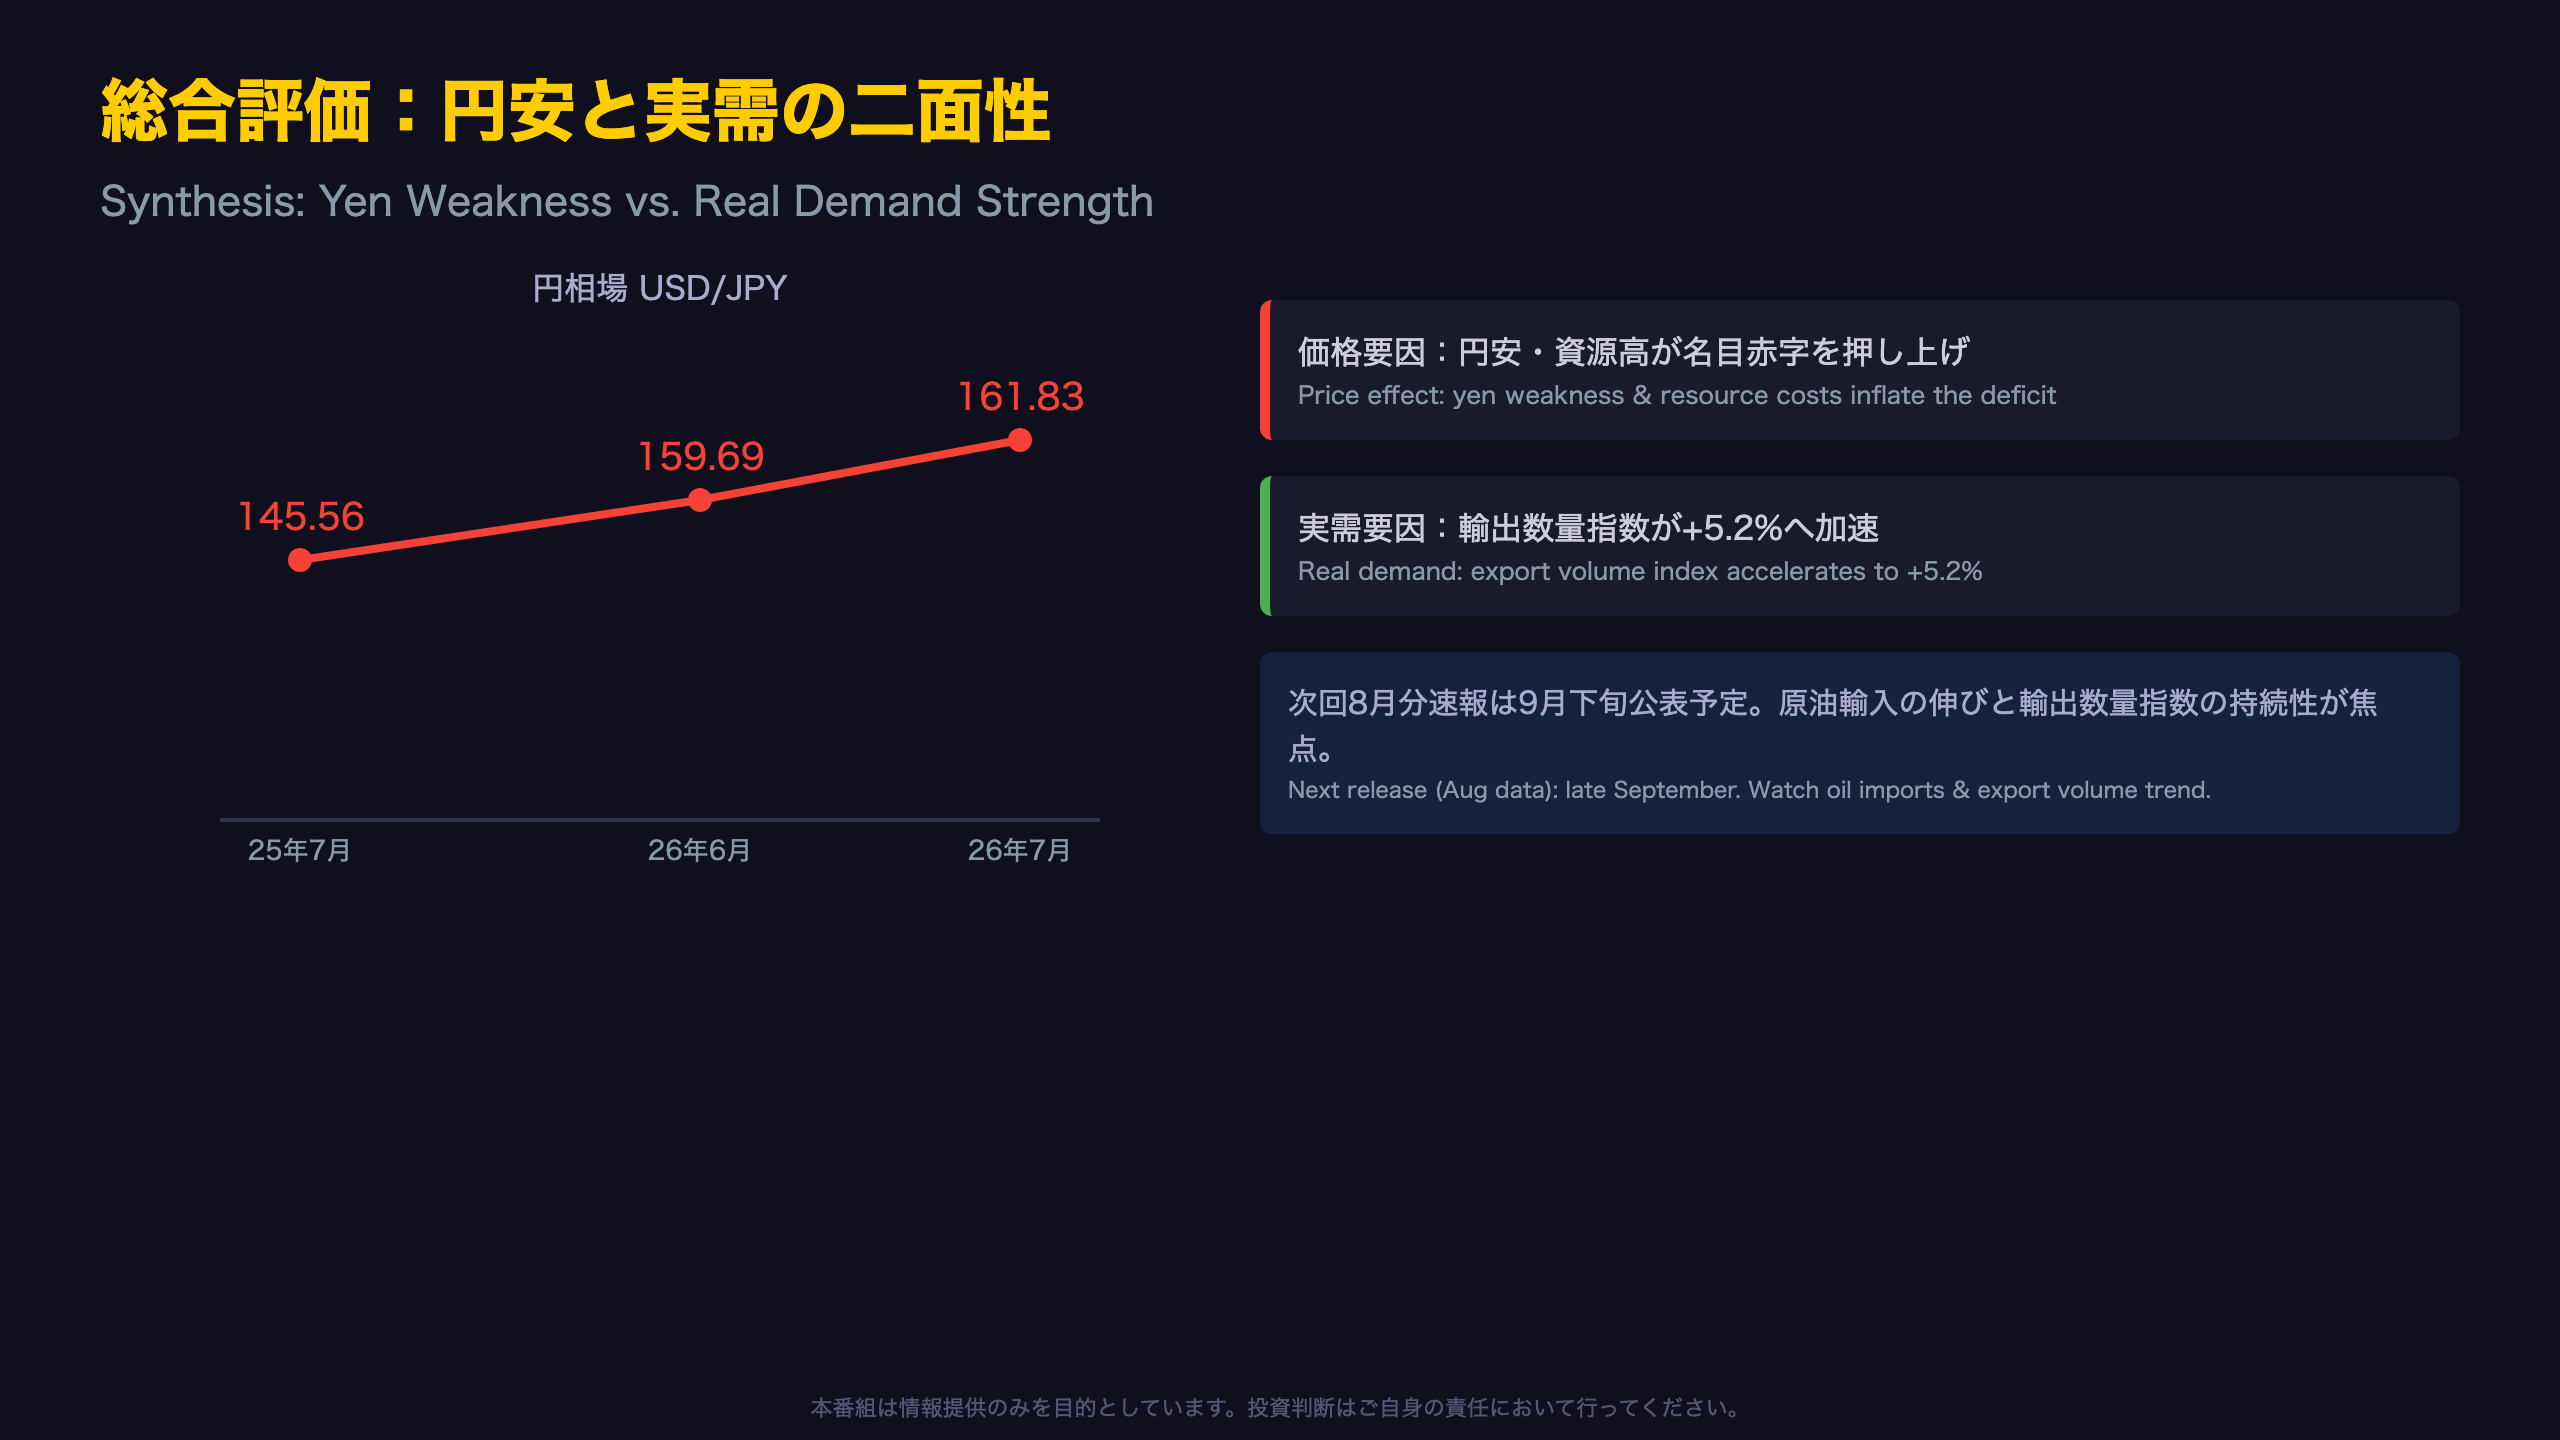
The average customs-clearance exchange rate weakened from 159.69 yen/dollar in June to 161.83 in July — a further 1.3% monthly slide. The year-on-year depreciation rate edged up slightly to 11.2% from June’s 10.9%.
A Data Release With Two Faces
- Price-driven: Yen weakness and elevated resource costs are inflating the nominal deficit; an extraordinary surge in US crude oil imports is the single largest driver of the vanishing US surplus.
- Demand-driven: The export volume index accelerated to +5.2%, pointing to genuinely resilient global semiconductor-related demand.
For the Bank of Japan, this creates a genuinely mixed signal. Rising import prices support the case for continued vigilance on inflation (potentially a hawkish input), while resilient real export volumes suggest the broader economy is not deteriorating — arguing against urgency for aggressive tightening. Trade data alone, however, is only one input into BOJ policy deliberations, which also weigh wage growth, core CPI, and consumption trends.
For USD/JPY watchers, note that a shrinking Japan-US trade surplus — driven by import-side energy purchases rather than weaker Japanese export competitiveness — could reduce a recurring point of bilateral trade tension, a modest positive for diplomatic and tariff-related headline risk.
The next release, covering August 2026 trade data, is expected in late September following the standard publication cadence. Key watch points: whether the US crude oil import surge persists at July’s pace, and whether the export volume index continues its acceleration.
Disclaimer: This article is for informational purposes only. All investment decisions are made solely at your own risk.







