📺 Watch the Full Video Analysis
This article was automatically generated by the NFC Market Live AI analysis system. (Updated: 2026-08-20 08:59 JST)
📊 A deep dive into the Ministry of Finance’s weekly capital flow data (Aug 9-15).
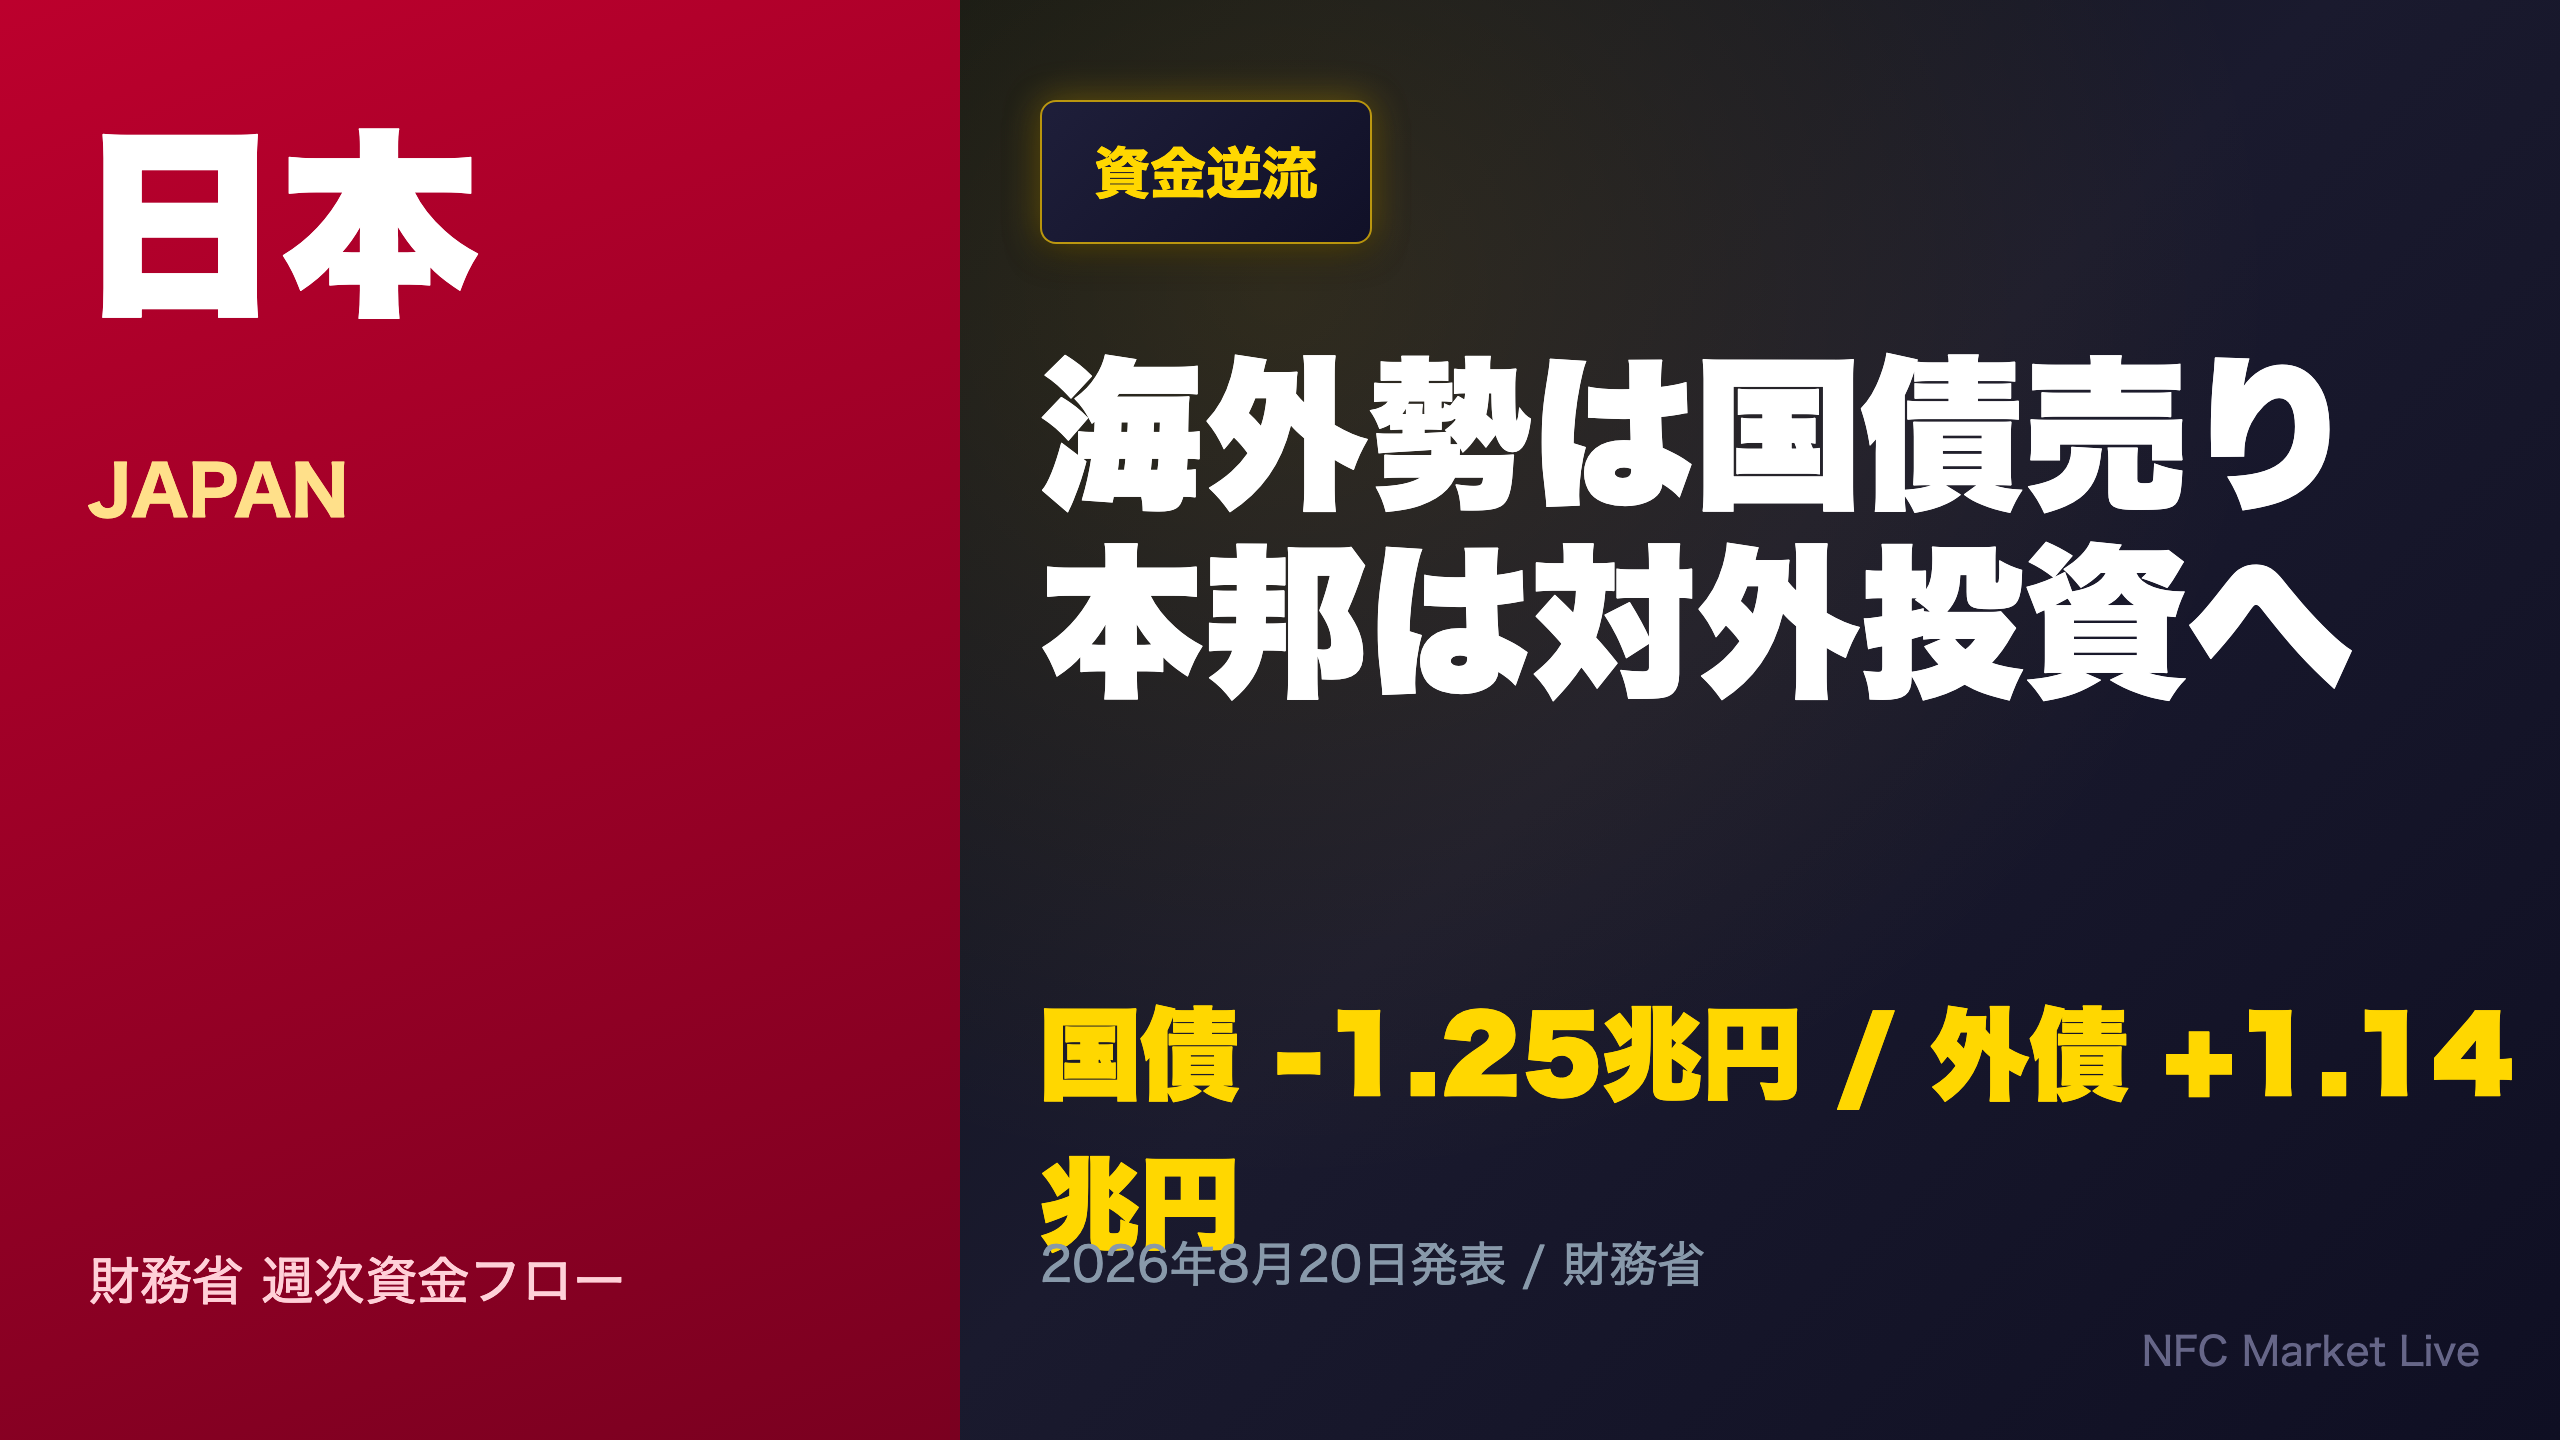
Foreign investors net-sold 1.25 trillion yen of Japanese long-term bonds, while Japanese investors bought 1.39 trillion yen in foreign stocks and 1.14 trillion yen in foreign bonds.
💹 Outbound Japanese investment topped 1 trillion yen for a second straight week.
⚠️ Foreign JGB selling volatility is rising, with USD/JPY hovering around 159.
We break down what this flow divergence means for currency and rate markets, using a full year of historical data.
総括:本邦マネー対外流出と海外勢の国債売り越し
Overview of Weekly Capital Flows
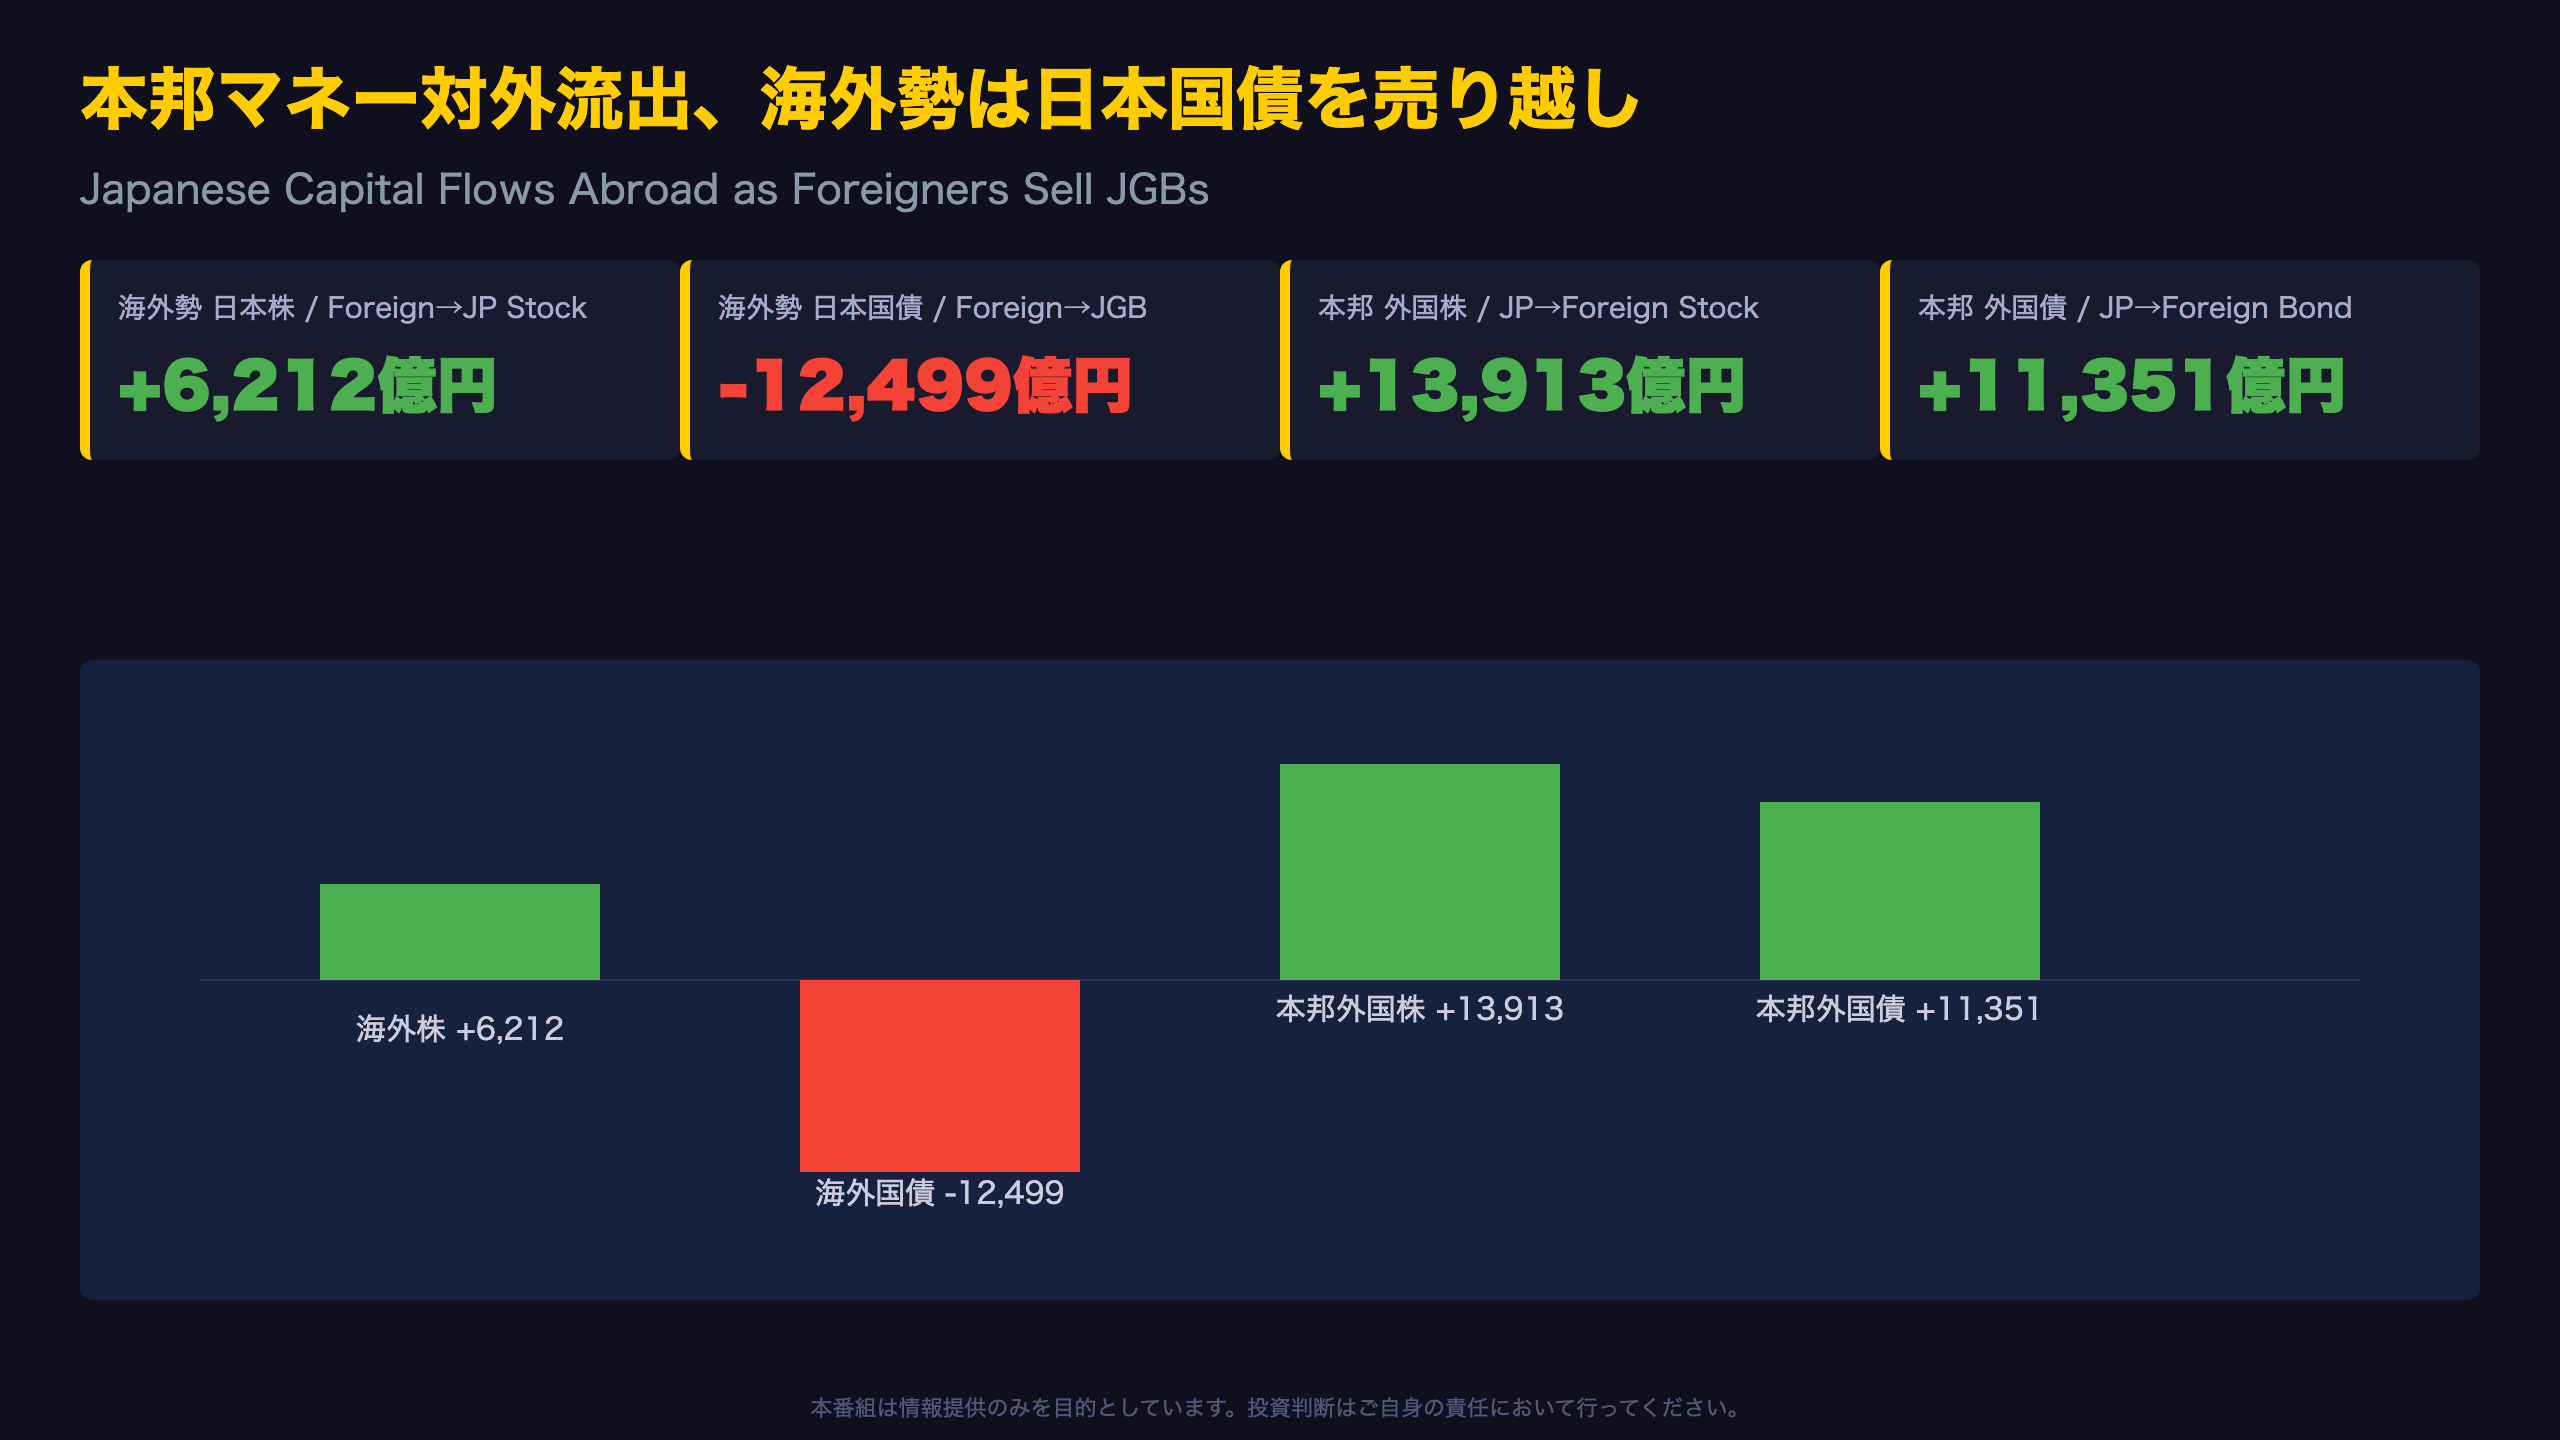
The latest Ministry of Finance (MOF) data, covering August 9-15, highlights a growing divergence in Japan’s cross-border securities flows.
The Four Key Figures
| Category | Amount (JPY bn) | Direction |
|---|---|---|
| Foreign → JP Stocks | +621.2 | Net Buy |
| Foreign → JGBs | -1,249.9 | Net Sell |
| Japan → Foreign Stocks | +1,391.3 | Net Buy |
| Japan → Foreign Bonds | +1,135.1 | Net Buy |
Compared to the prior week (Aug 2-8), foreign net selling of JGBs expanded sharply from 58.7 billion yen to 1.25 trillion yen. Meanwhile, Japanese investors’ foreign stock purchases grew from 927.4 billion yen to 1.39 trillion yen, underscoring persistent outbound investment appetite.
Note: MOF’s weekly release is a preliminary figure and may be revised in subsequent reports — a standard caveat for this data series, similar to how U.S. TIC data is often revised.
For international readers unfamiliar with this dataset, MOF’s weekly securities report is Japan’s equivalent of the U.S. Treasury International Capital (TIC) system, tracking cross-border portfolio flows between residents and non-residents. The following slides explore the structural drivers behind each flow and place them in a one-year historical context.
本邦マネー、外債買いが2週連続で1兆円超え
Reading Japan’s Foreign Bond Buying Over Time
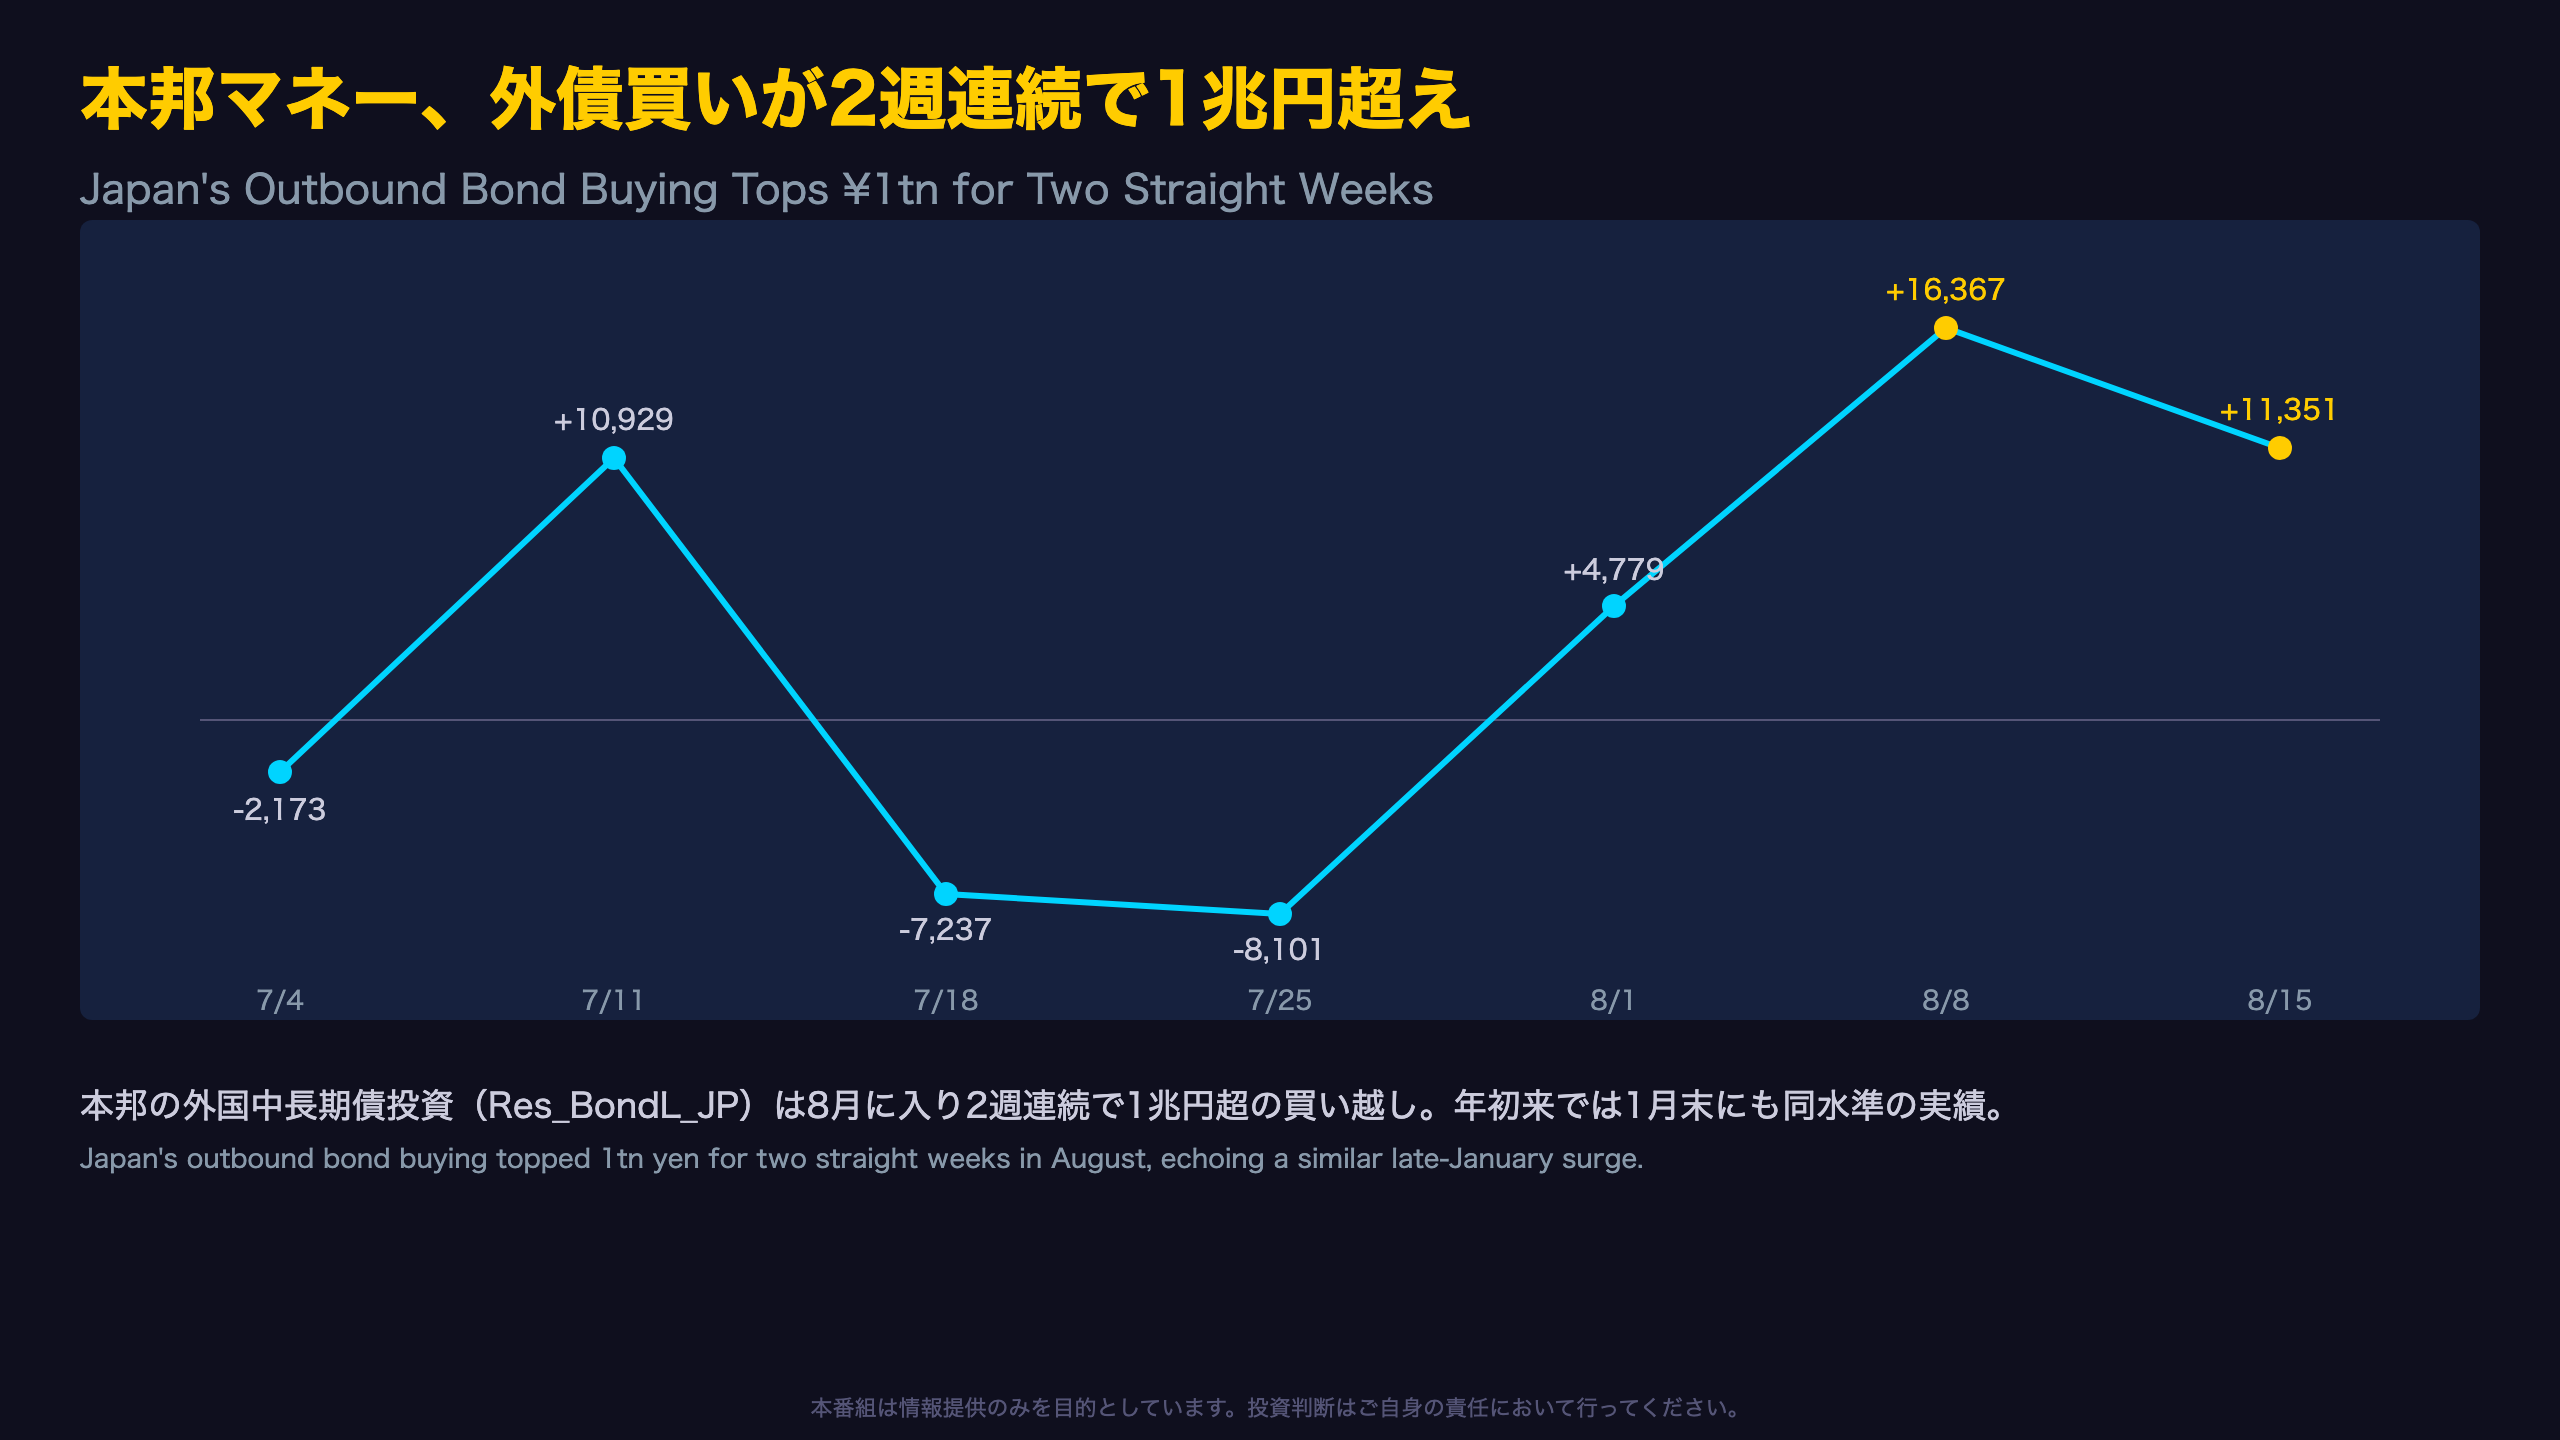
Looking at the past seven weeks of Res_BondL_JP (Japanese investors’ net flow into foreign long-term bonds) reveals both volatility and a notable August surge.
| Week | Amount (JPY bn) |
|---|---|
| Jul 4-10 | -217.3 |
| Jul 11-17 | +1,092.9 |
| Jul 18-24 | -723.7 |
| Jul 25-31 | -810.1 |
| Aug 1-7 | +477.9 |
| Aug 2-8 | +1,636.7 |
| Aug 9-15 | +1,135.1 |
July showed no clear direction, alternating between buying and selling weeks. August, by contrast, delivered two consecutive weeks of large-scale net buying. Earlier in the year, the week of Jan 25-31 saw an even larger purchase of 2.08 trillion yen — among the biggest of the year — suggesting this is less a one-off move and more a persistent structural flow from Japanese institutional investors such as life insurers and pension funds seeking yield abroad.
For international readers: this pattern echoes the ‘search for yield’ behavior seen among Japanese lifers even during the era of ultra-low domestic rates, but the underlying driver here may be more about diversification amid a weaker yen. One caveat — whether these purchases are currency-hedged is not disclosed in this dataset; unhedged flows would exert more direct downward pressure on the yen than hedged ones.
海外勢、日本国債を大幅売り越し ボラティリティ拡大
Examining a Year of Volatility in Foreign JGB Flows
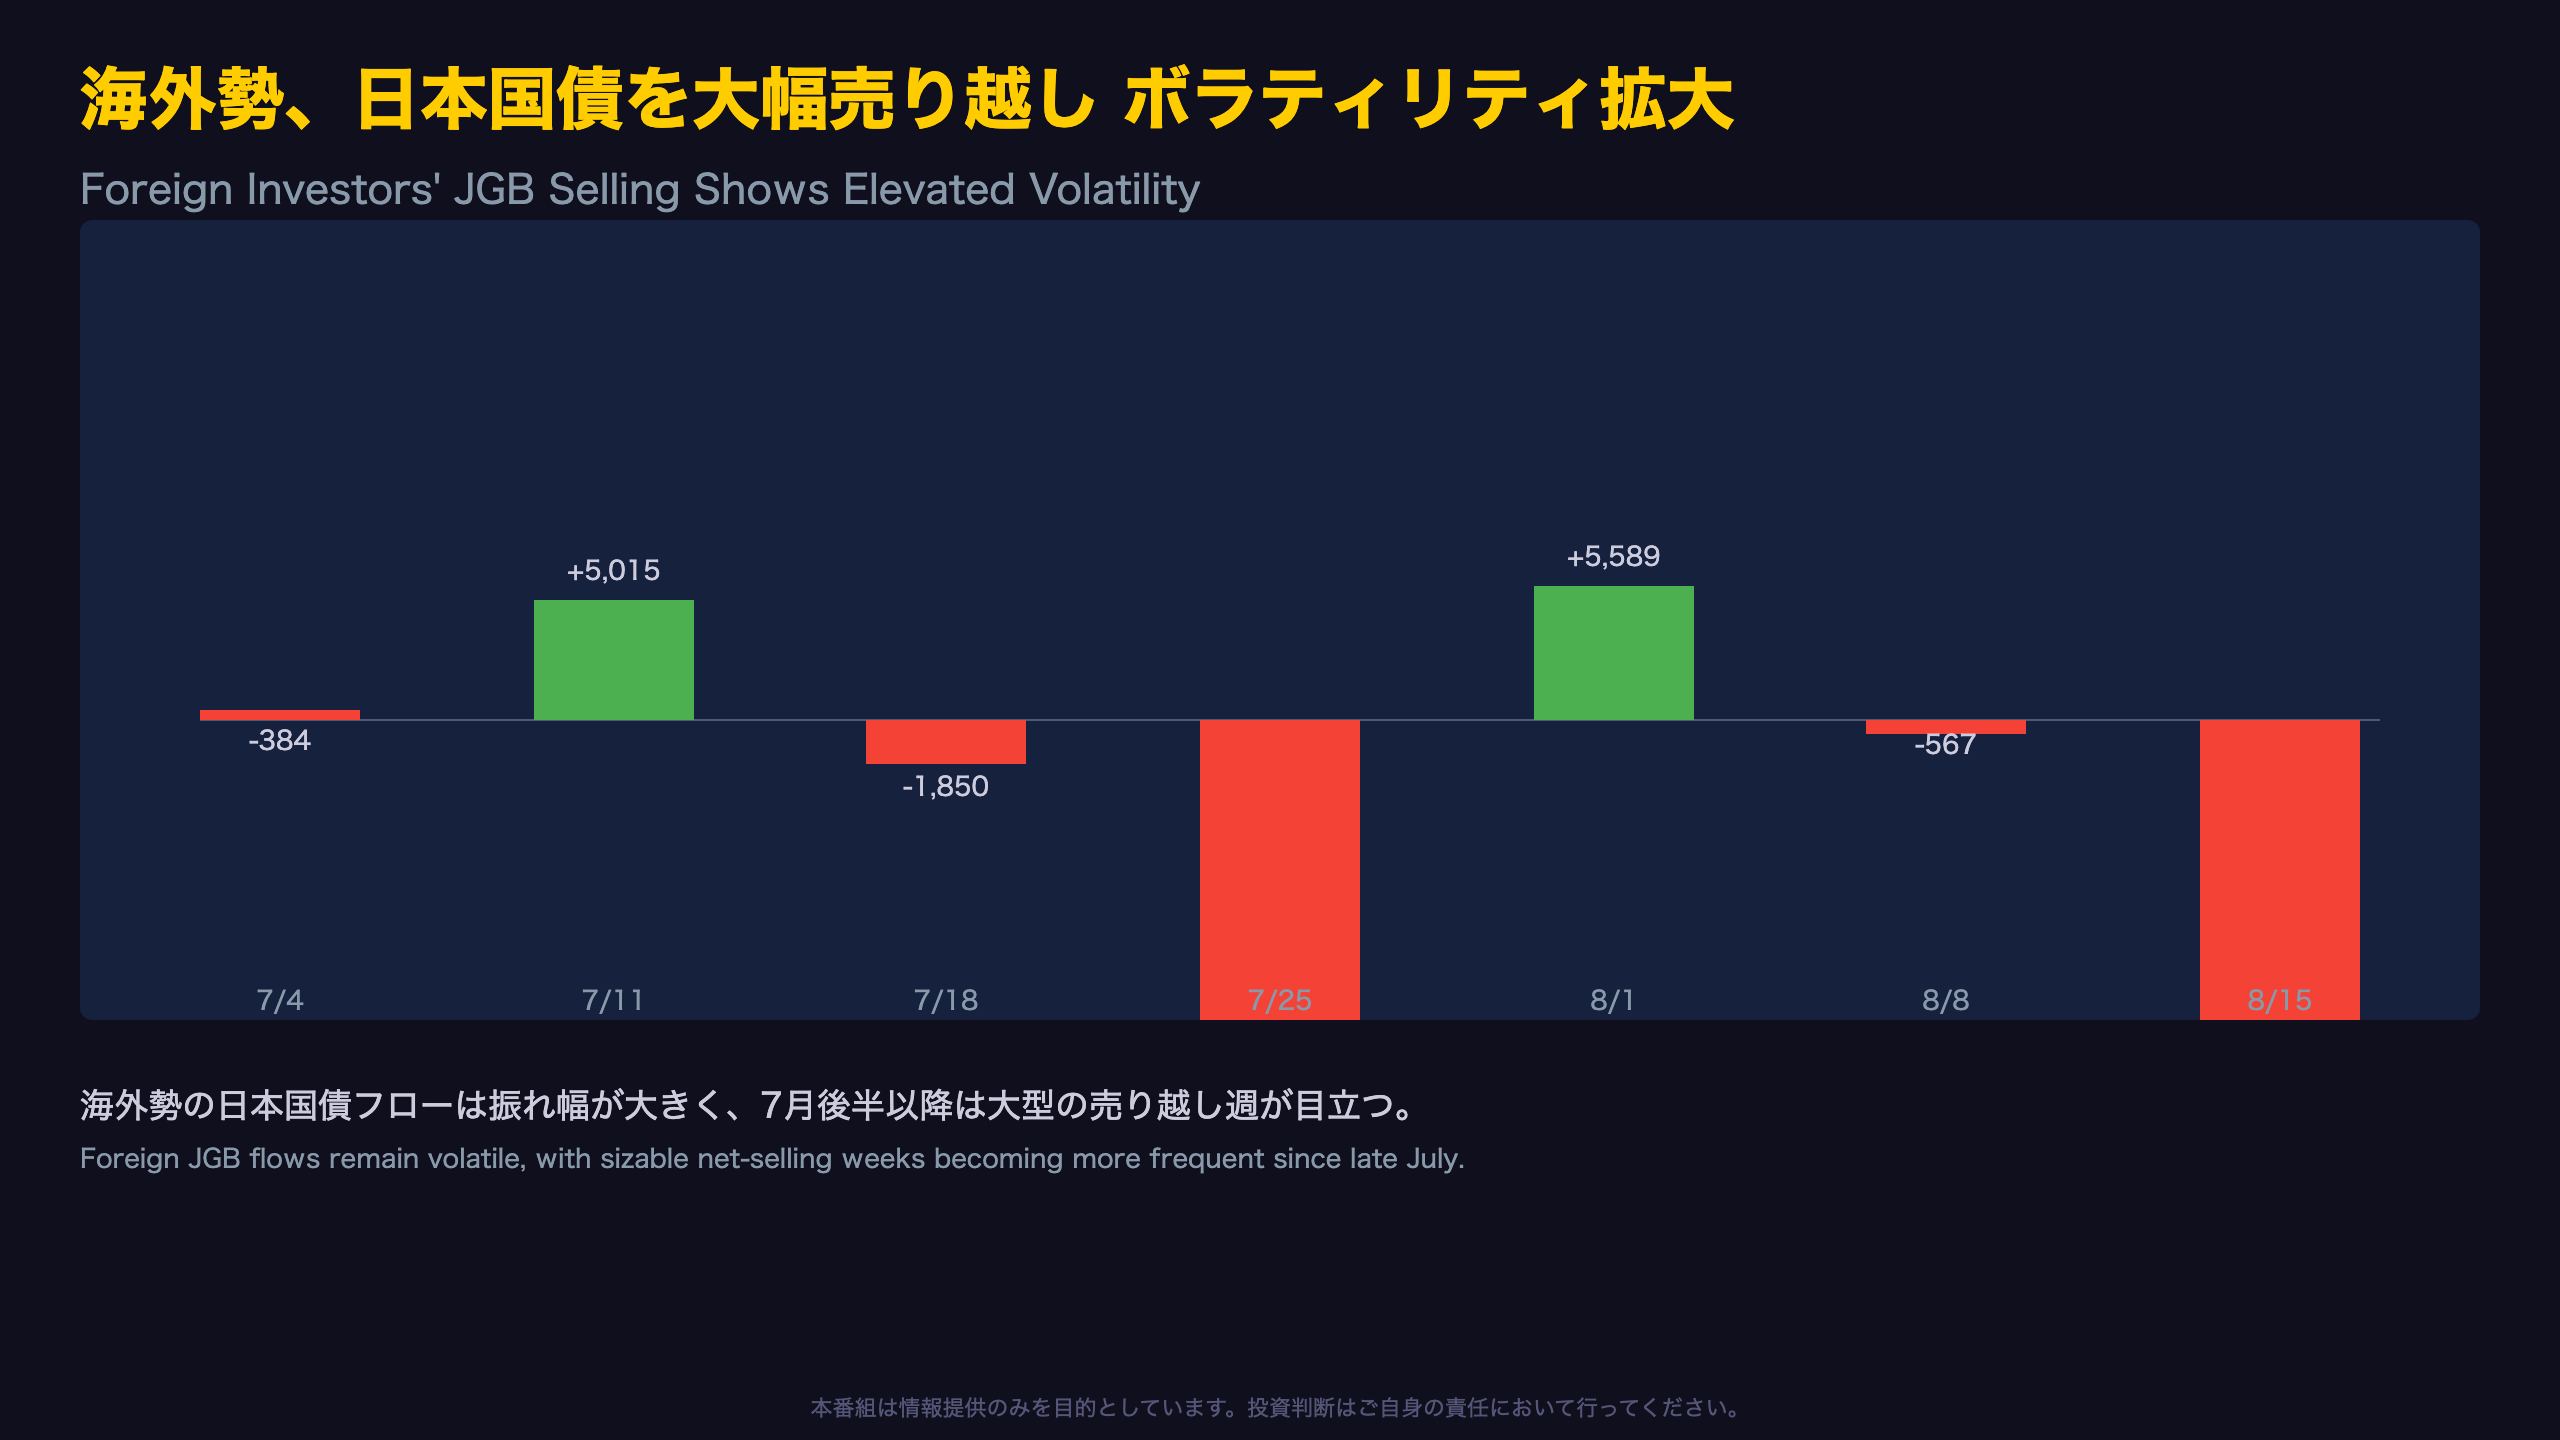
Here are the past seven weeks of NonRes_BondL_Foreign (foreign investors’ net flow into Japanese long-term bonds):
| Week | Amount (JPY bn) |
|---|---|
| Jul 4-10 | -38.4 |
| Jul 11-17 | +501.5 |
| Jul 18-24 | -185.0 |
| Jul 25-31 | -1,514.1 |
| Aug 1-7 | +558.9 |
| Aug 2-8 | -56.7 |
| Aug 9-15 | -1,249.9 |
Over the past year, weekly flows generally stayed within a ±2 trillion yen band, but late March 2026 (week of Mar 22-28) saw an outsized net sale of 2.65 trillion yen — among the largest of the year — followed almost immediately by a sharp reversal to net buying of 706.9 billion yen in the week of April 5-11. This illustrates how quickly foreign positioning in JGBs can flip.
For context, this is analogous to how foreign holders of U.S. Treasuries can swing between buying and selling based on shifting rate expectations, though JGB flows are additionally sensitive to Bank of Japan policy signals given Japan’s history of yield curve control. While a single week cannot confirm a structural trend shift, it is a factual observation that selling weeks (Jul 25, Aug 15) have grown larger in scale since mid-July. The specific drivers — whether BOJ policy speculation or global rate differentials — are not disclosed in the source data, so any causal claim beyond correlation should be treated as speculative.
日本株、国内勢が主役に 海外勢は方向感定まらず
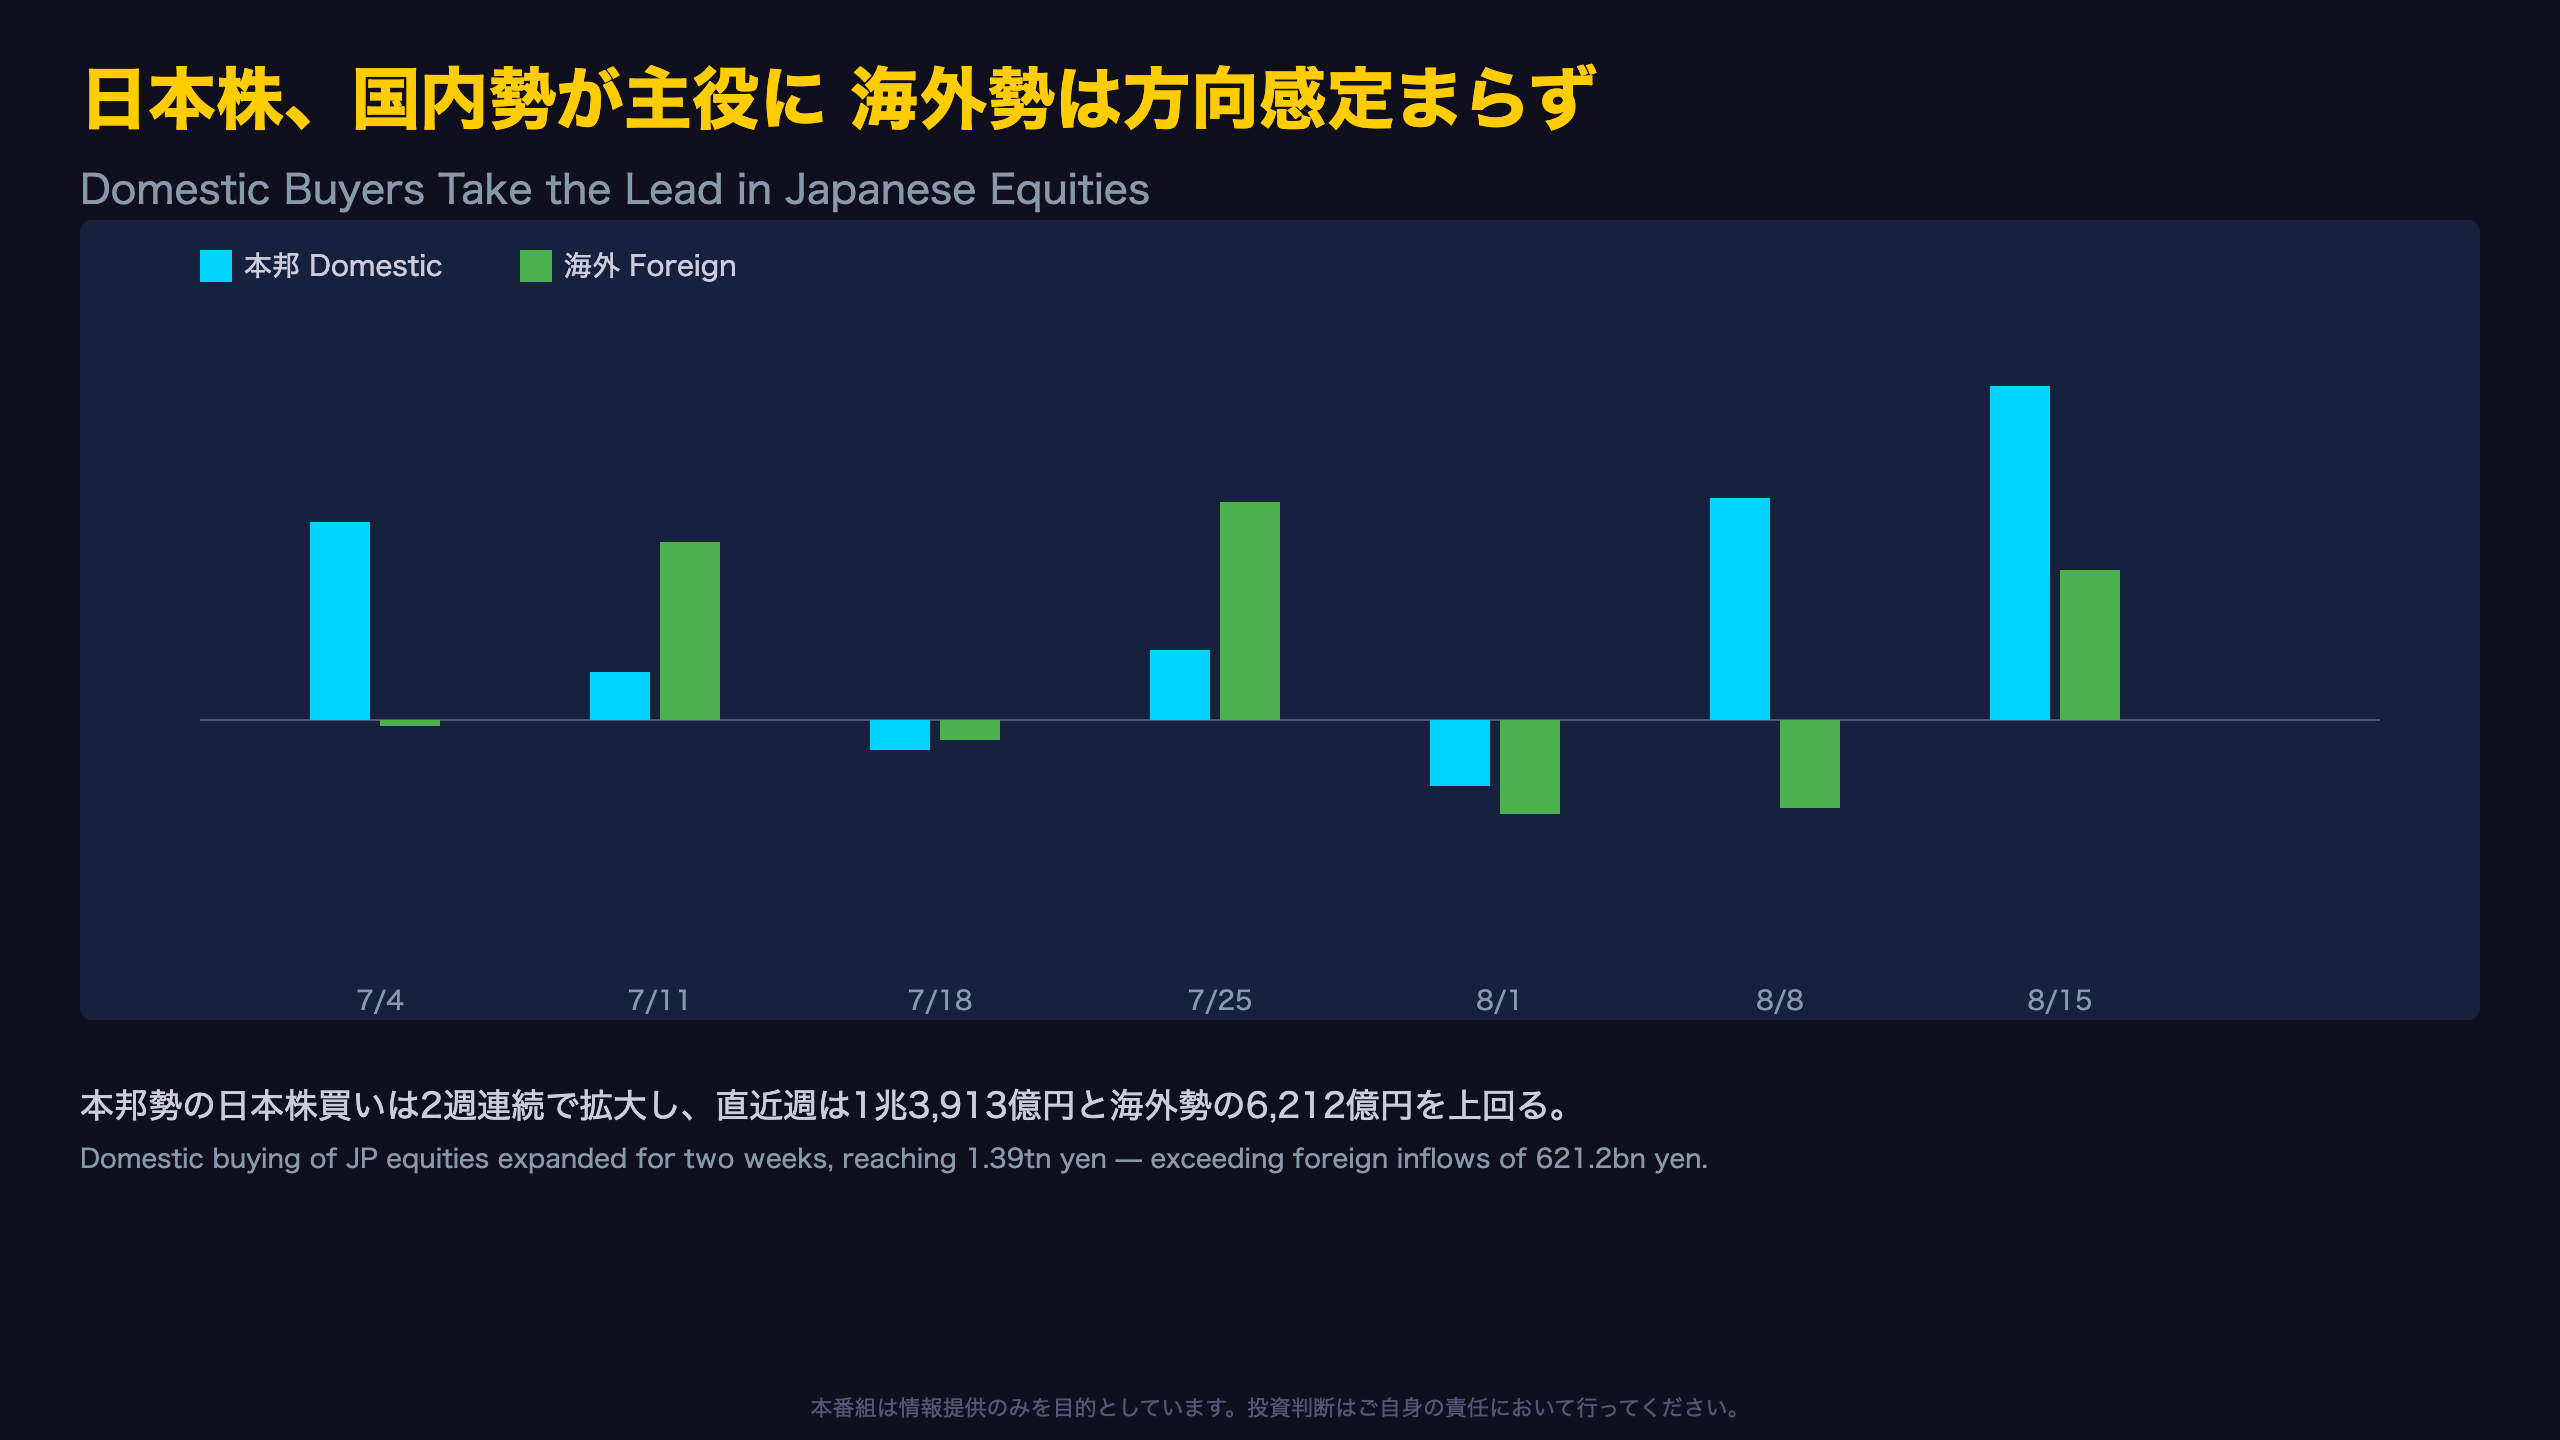
Japanese Equity Flows: Domestic vs. Foreign Investors
Comparing the past seven weeks of Res_Stock_JP (domestic Japanese investors’ net flow into JP equities) and NonRes_Stock_Foreign (foreign investors’ net flow into JP equities):
| Week | Domestic (JPY bn) | Foreign (JPY bn) |
|---|---|---|
| Jul 4-10 | +826.6 | -21.3 |
| Jul 11-17 | +196.2 | +742.6 |
| Jul 18-24 | -121.3 | -81.9 |
| Jul 25-31 | +289.1 | +912.4 |
| Aug 1-7 | -276.4 | -392.5 |
| Aug 2-8 | +927.4 | -368.6 |
| Aug 9-15 | +1,391.3 | +621.2 |
In July, foreign flows drove several notable weeks (Jul 11, Jul 25), but since early August, domestic Japanese buying has expanded for two consecutive weeks, reaching 1.39 trillion yen in the week of Aug 9-15 — one of the larger domestic buying weeks this year.
For perspective, this isn’t a one-way trend: earlier in the year, the week of May 2 saw domestic investors net-sell 2.43 trillion yen of Japanese equities, showing that Res_Stock_JP flows are themselves quite volatile. That said, two consecutive weeks of strong domestic buying could reflect a shift in sentiment among Japanese retail and institutional investors — though with only two data points, calling this a durable ‘home bias’ trend would be premature. International readers should note this dynamic differs from the U.S., where foreign ownership of equities (via TIC data) tends to be more stable week-to-week; Japan’s weekly retail/institutional flow data is comparatively choppier.
ドル円159円台、資本フローとの相関に注目
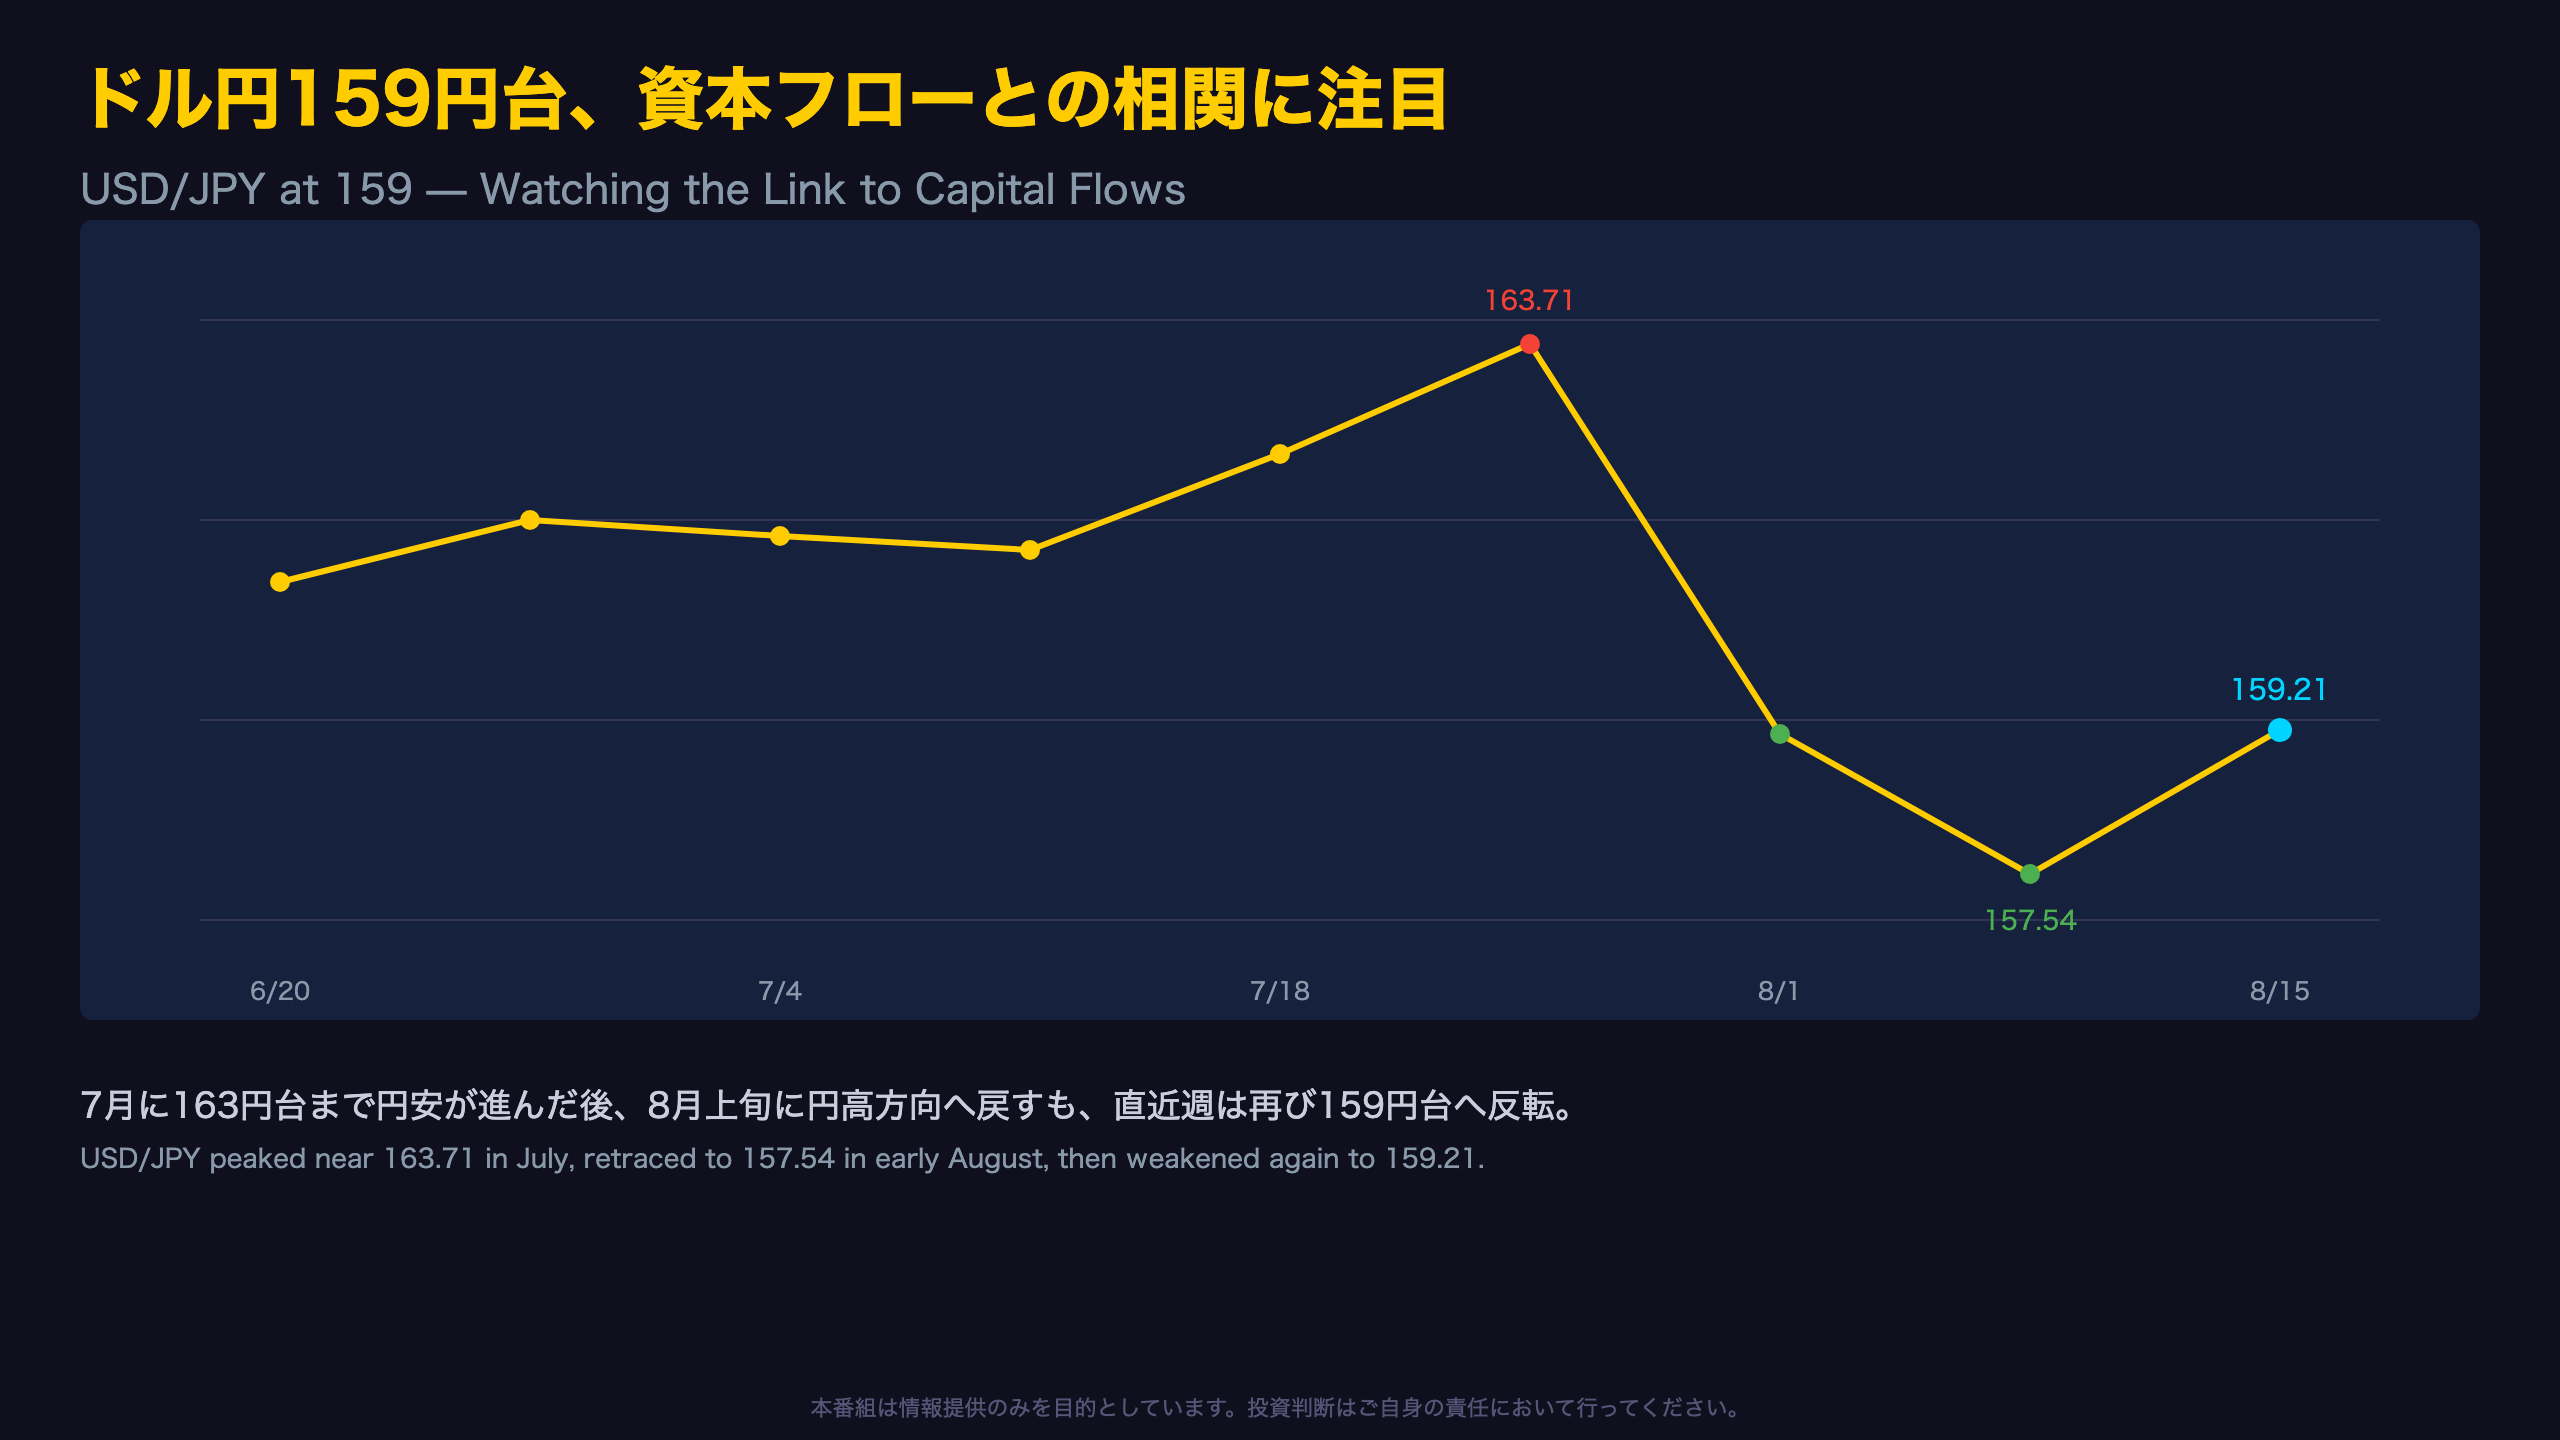
USD/JPY Trends and Their Overlap with Capital Flows
Tracking USD/JPY over the past nine weeks shows a peak in late July, a subsequent retracement, and a renewed weakening in the most recent week.
| Week | USD/JPY |
|---|---|
| Jun 14-20 | 160.95 |
| Jun 21-27 | 161.67 |
| Jun 28-Jul 4 | 161.49 |
| Jul 5-11 | 161.31 |
| Jul 12-18 | 162.43 |
| Jul 19-25 | 163.71 |
| Jul 26-Aug 1 | 159.16 |
| Aug 2-8 | 157.54 |
| Aug 9-15 | 159.21 |
The rate of 163.71 in the week of July 19-25 was near the year’s weaker-yen extreme, followed by roughly a 6-yen retracement toward yen strength by the week of Aug 2-8. The most recent week reversed again toward 159.21, suggesting the pair remains range-bound rather than trending decisively in either direction.
This latest reversal coincides with two consecutive weeks of elevated Japanese outbound investment into foreign stocks and bonds, plus expanding foreign net-selling of JGBs — both of which are capital-account channels that can theoretically pressure the yen weaker. For U.S. and European investors accustomed to thinking of USD/JPY primarily through the lens of Fed-BOJ rate differentials, this data offers a useful supplementary lens: portfolio flow data. However, this MOF report does not include interest rate differential or trade balance data, so attributing the yen’s move solely to portfolio flows would overstate the certainty of this relationship — it is best read as one contributing factor among several.
総括:本邦マネーの対外シフトと国債市場の分岐
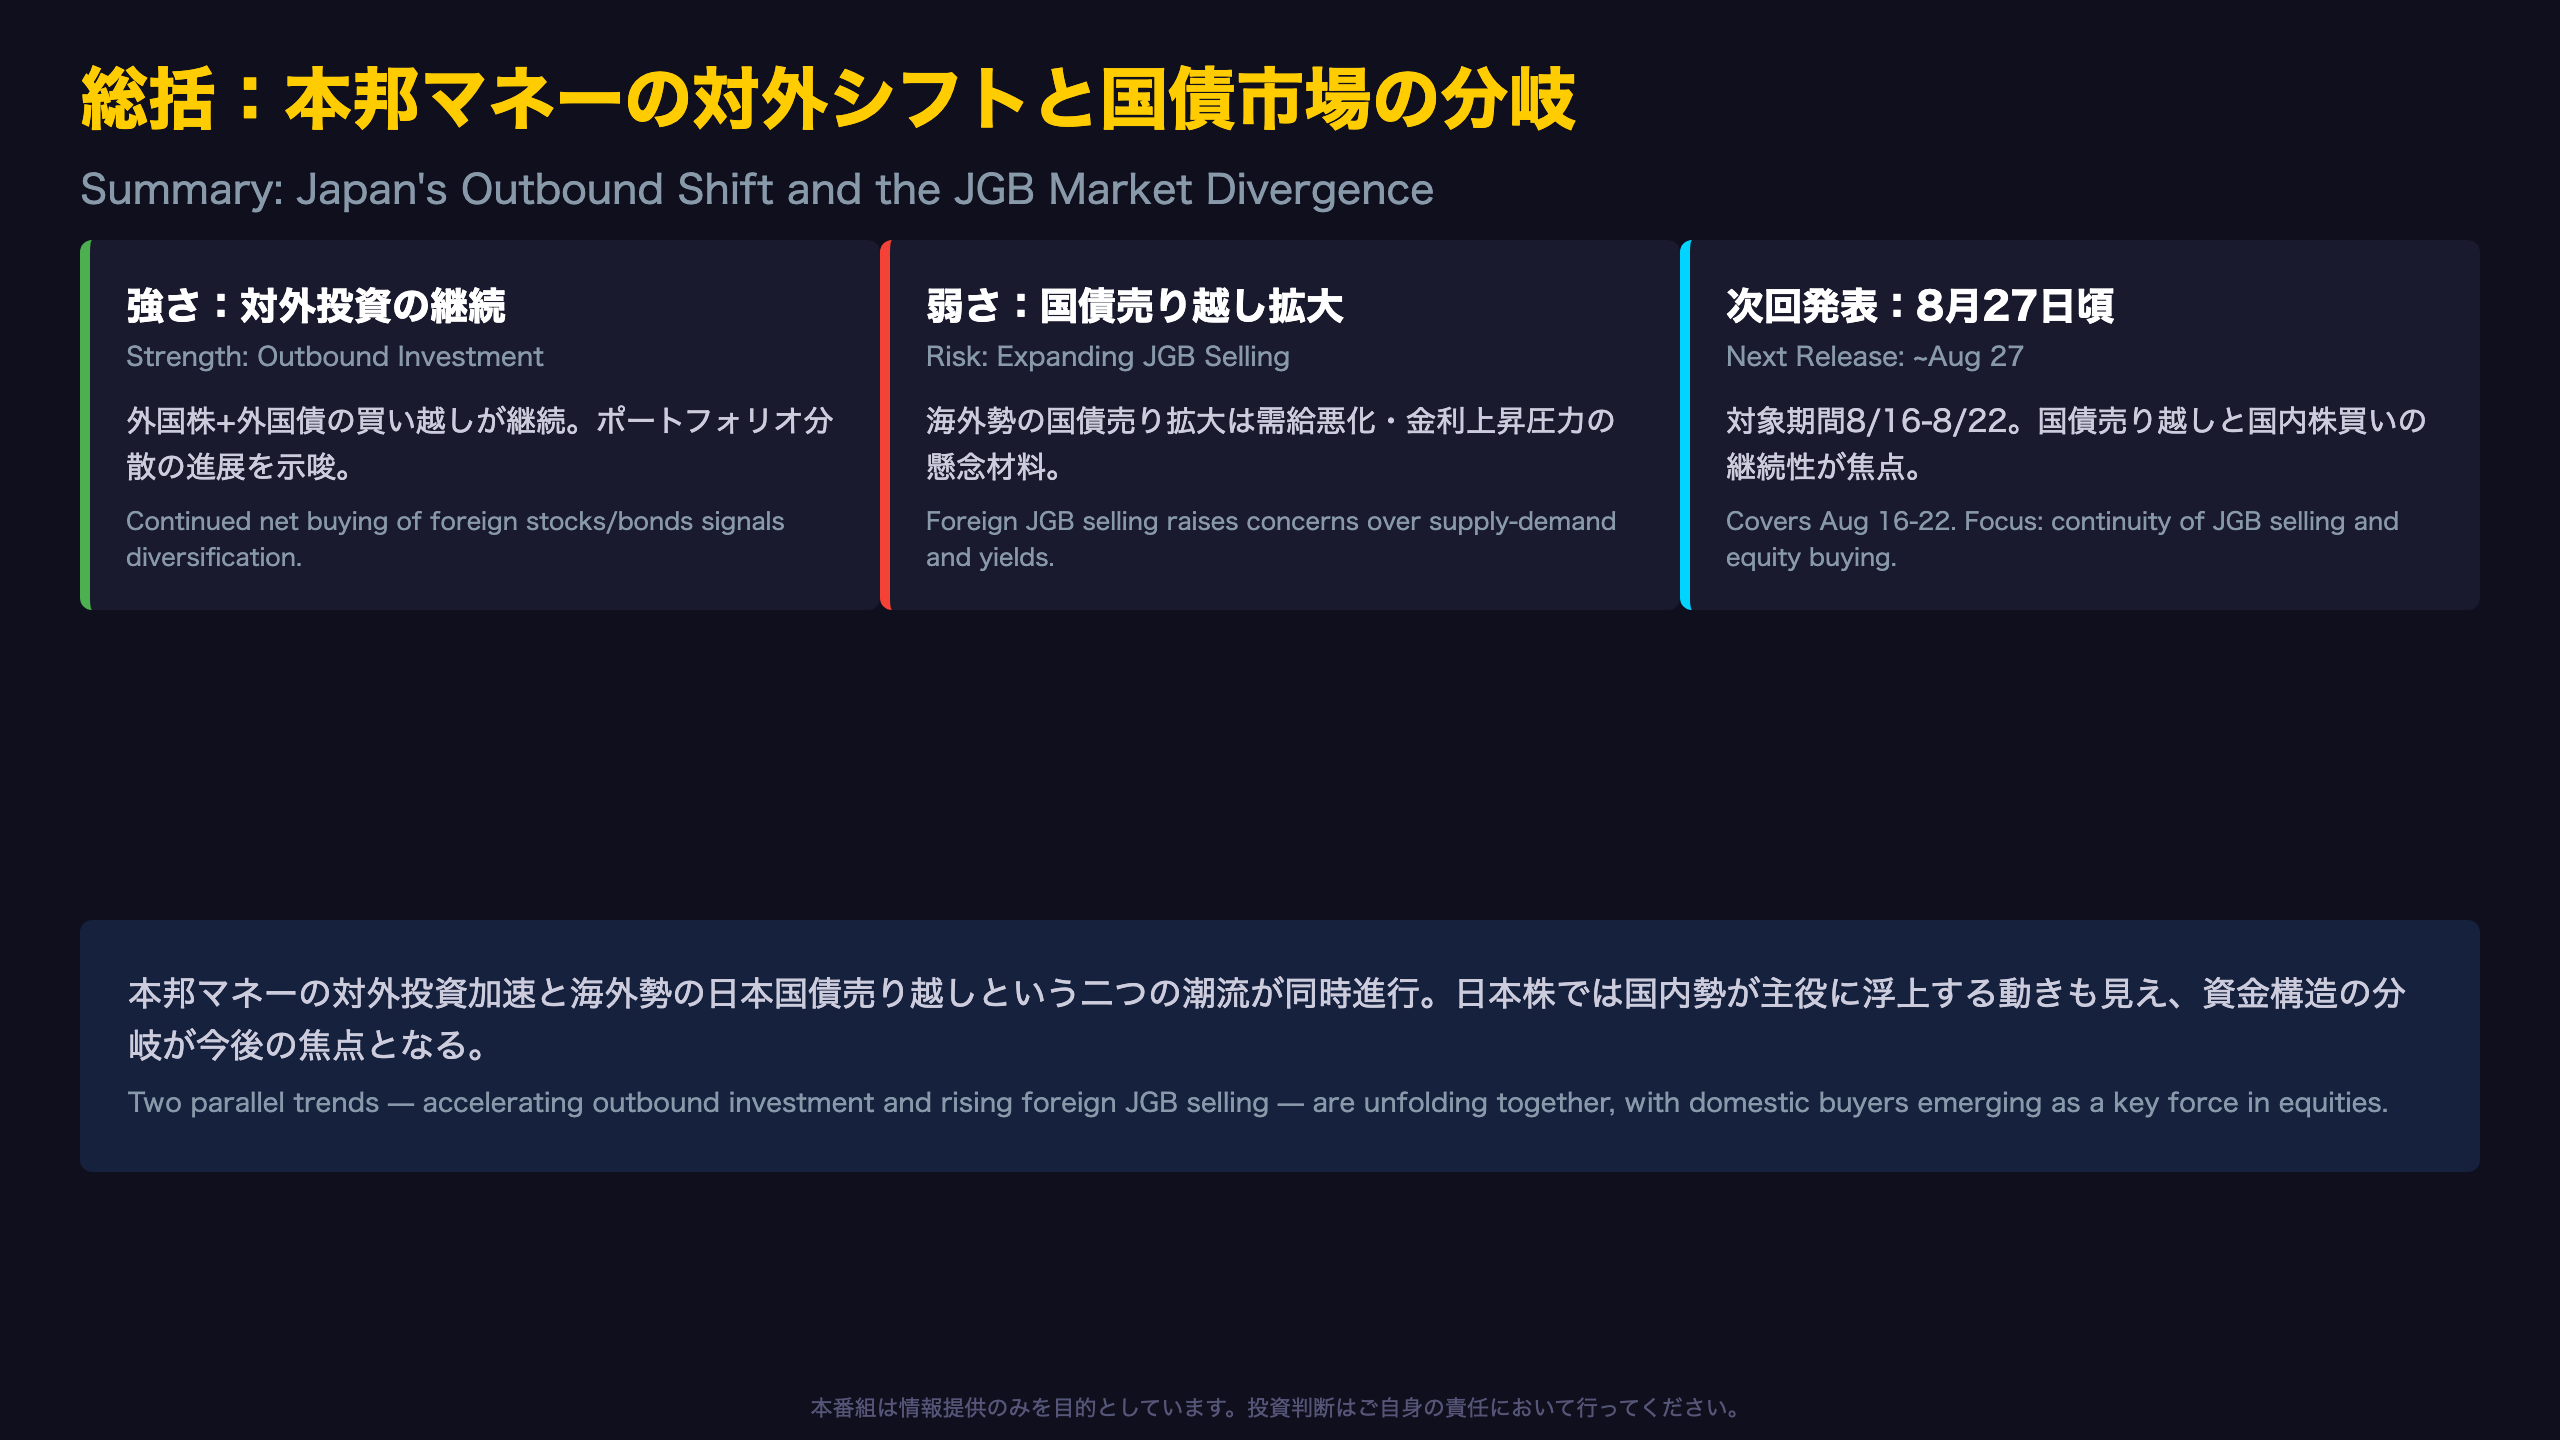
Two Parallel Themes in This Week’s Data
Synthesizing this week’s analysis, two structural themes emerge:
- Accelerating Japanese Outbound Investment: Both foreign stock and bond purchases remain elevated, with foreign bond buying topping 1 trillion yen for two consecutive weeks in August.
- Expanding Foreign JGB Selling: Net-selling weeks have grown larger in scale since late July.
Additionally, in the Japanese equity market, domestic buying has outpaced foreign inflows in recent weeks, hinting at a potential shift in market leadership.
Weighing Strengths and Risks
- Strength: The sustained appetite of Japanese investors for overseas assets reflects ongoing portfolio diversification among households and institutions — a generally constructive development for long-term returns, comparable to how U.S. pension funds diversify into international equities.
- Risk/Caveat: Growing foreign net-selling of JGBs could signal deteriorating demand-supply balance in the domestic bond market and upward pressure on yields, which merits attention given Japan’s fiscal debt load — a dynamic international readers may compare to periods of foreign Treasury selling pressuring U.S. yields higher.
Both readings are based on a limited number of weekly data points; continuity should be confirmed with future releases before drawing firm conclusions.
Looking Ahead
Based on the typical weekly (Thursday) publication cycle, the next MOF release is expected around August 27, covering the period of August 16-22. This upcoming report will be an important test of whether foreign JGB selling is a temporary phenomenon or part of a more durable trend, and whether the recent domestic equity buying persists.
Disclaimer: This article is for informational purposes only. All investment decisions are made solely at your own risk.







