📺 Watch the Full Video Analysis
This article was automatically generated by the NFC Market Live AI analysis system. (Updated: 2026-10-15 14:39 JST)
📄 Primary Source
NFC Market Live
https://www.meti.go.jp/statistics/tyo/iip/result/pdf/press/b2020_202608kj.pdf, https://www.meti.go.jp/statistics/tyo/iip/result/pdf/press/b2020_202608nj.pdf
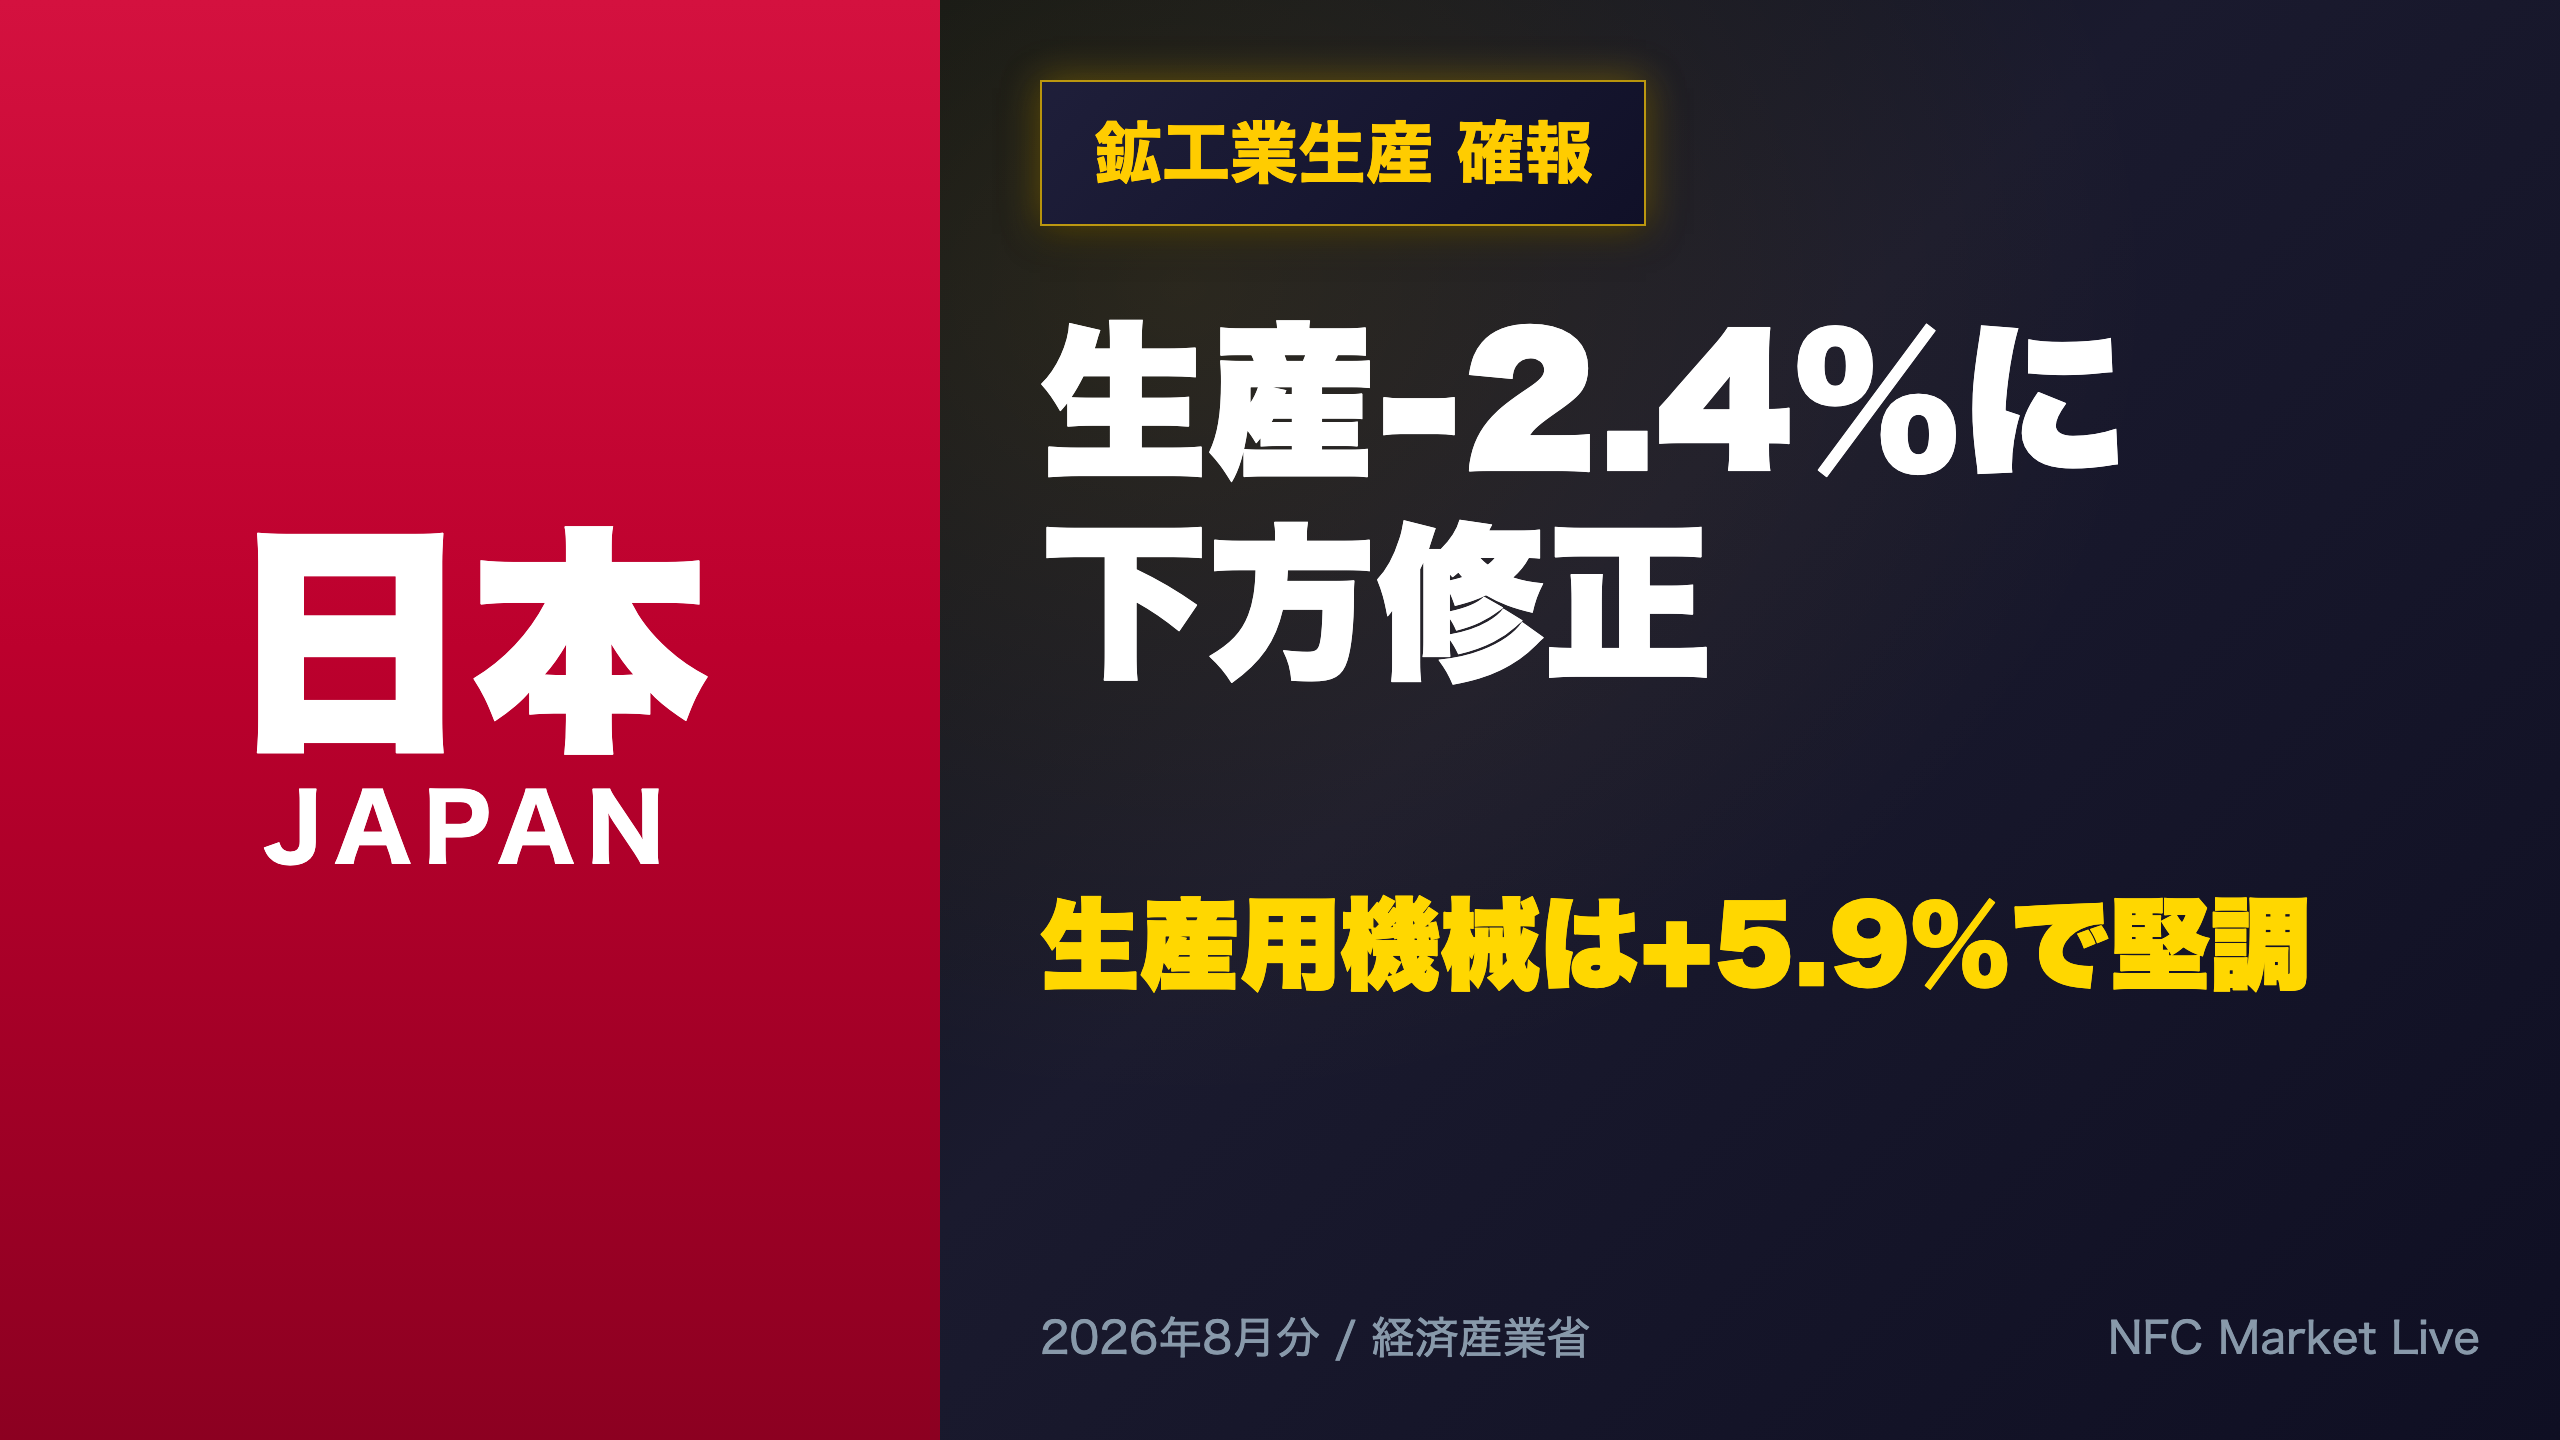
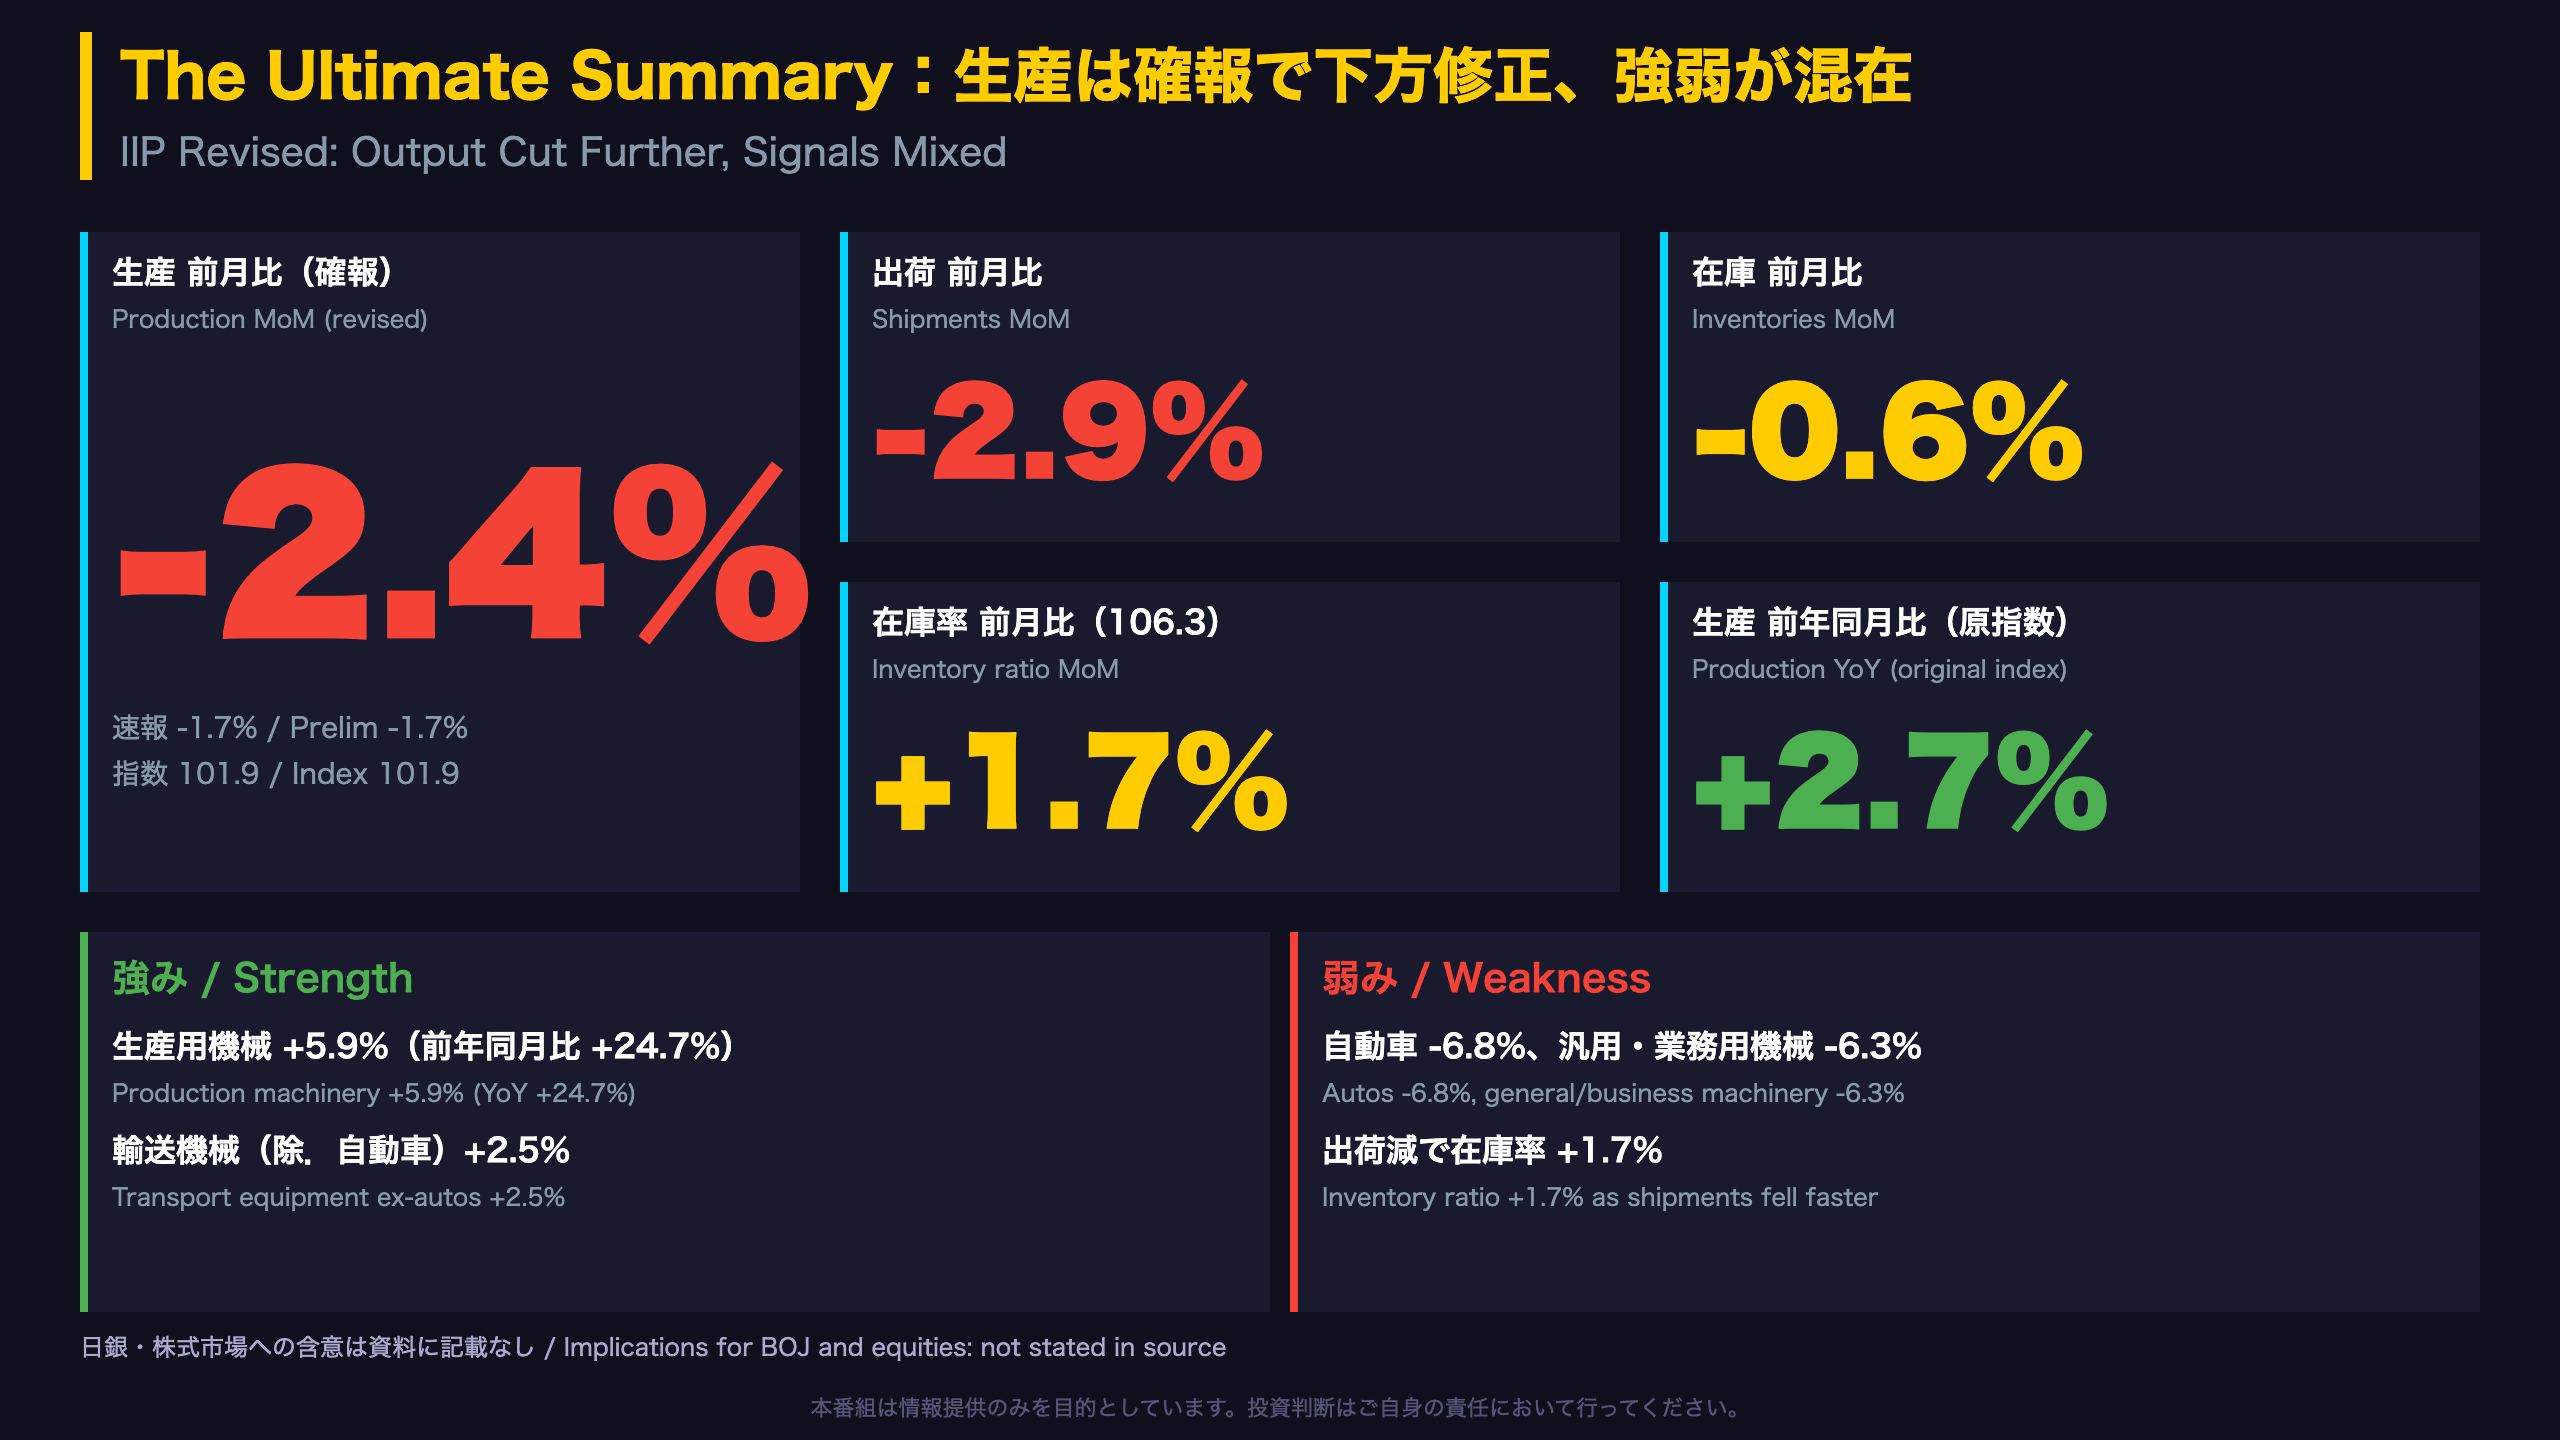
📉 Japan’s August industrial production (revised): output -2.4% m/m vs -1.7% in the preliminary release; shipments -2.9%, inventories -0.6%, inventory ratio +1.7% to 106.3.
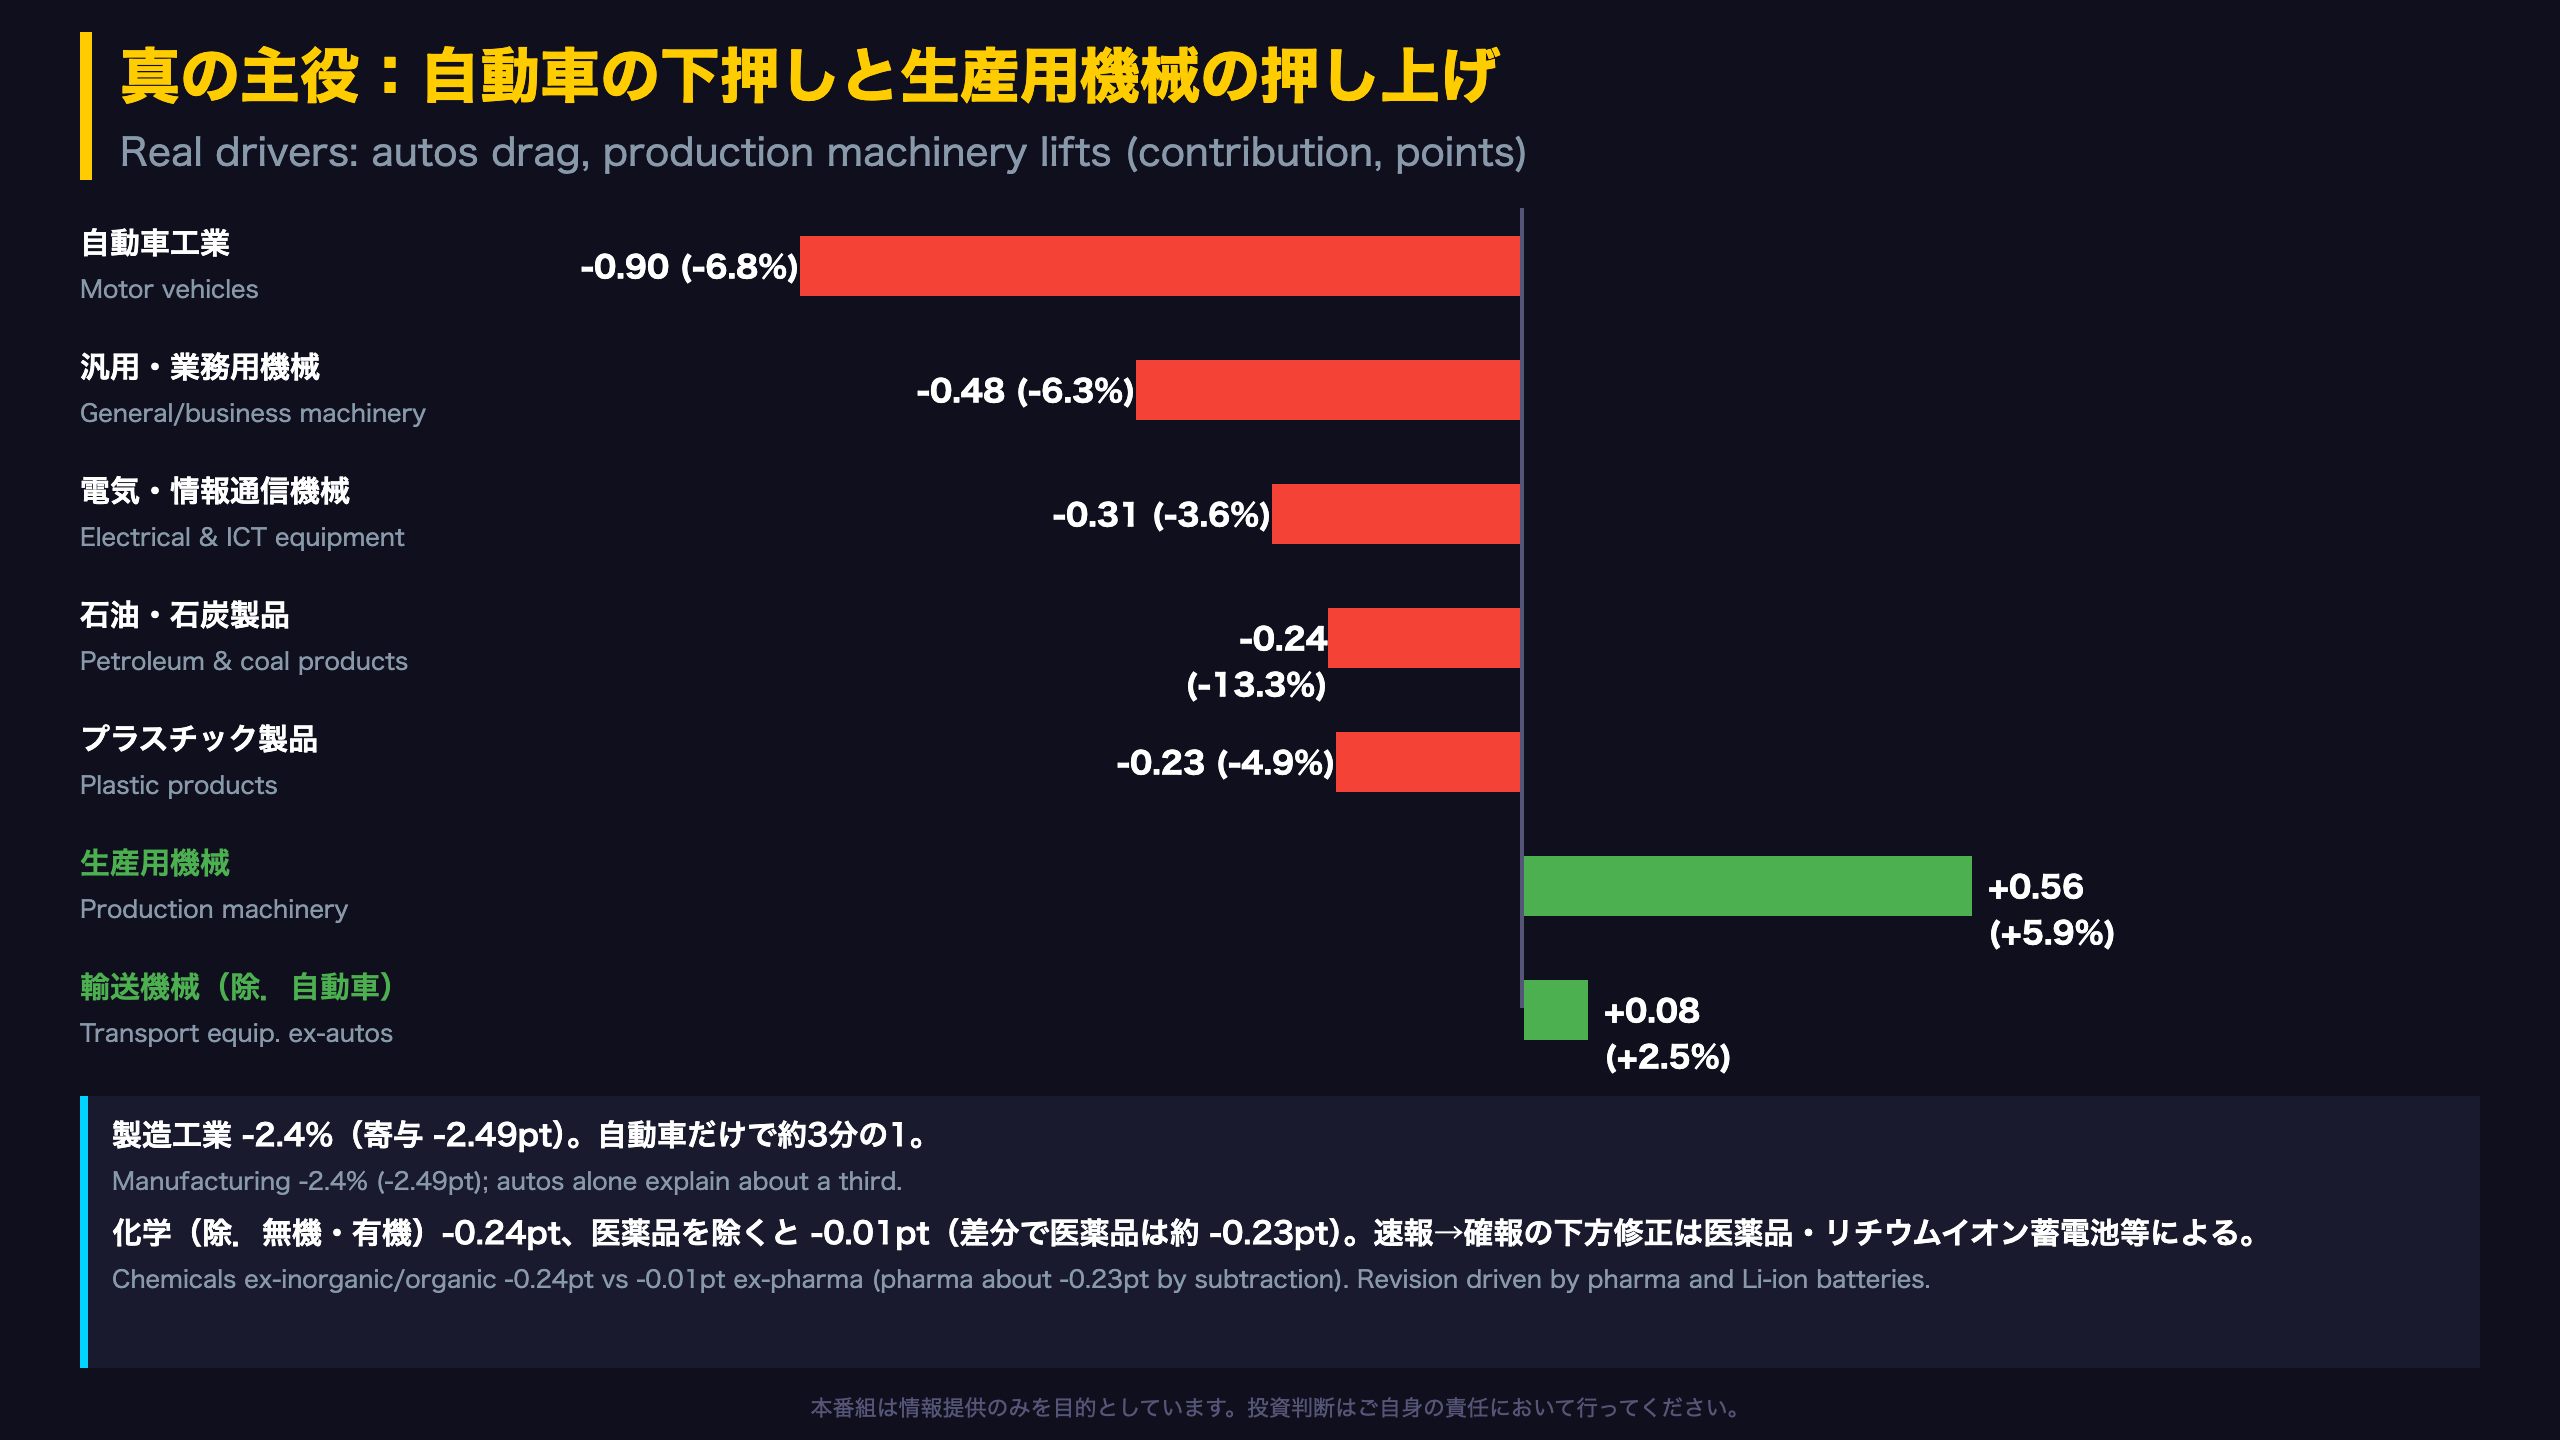
🚗 Autos fell 6.8% (-0.90pt contribution), the biggest drag, while production machinery rose 5.9% (+24.7% y/y).
📊 The higher inventory ratio appears driven by weaker shipments; y/y, inventories and the ratio keep falling, but auto inventories are up 24.9% y/y.
💡 The preliminary-release forecast showed +3.2% for September and +3.1% for October, yet August’s realization ratio was -8.8%.
⚠️ Capacity utilization is not covered in this report.
The Ultimate Summary:生産は確報で下方修正、強弱が混在
Revised IIP: what changed from the preliminary print
Japan’s Index of Industrial Production (IIP), compiled by the Ministry of Economy, Trade and Industry (METI), tracks output, shipments, inventories and the inventory ratio (2020 = 100). The revised August report shows output at 101.9, down 2.4% m/m (preliminary: -1.7%), shipments -2.9% (prelim -2.5%), inventories -0.6% (prelim -0.5%) and an inventory ratio of 106.3, up 1.7%. METI attributes the downward revision to pharmaceuticals and lithium-ion batteries, among others.
Context
- Output was 104.6 in June and 104.4 in July, so August is the second straight monthly decline (July -0.2%).
- Year on year, output is +2.7%, the third consecutive gain.
- The preliminary release described production as moving sideways, a judgment unchanged since July 2024.
International comparison
The closest US analogue is the Federal Reserve’s G.17 industrial production release. Unlike G.17, Japan’s IIP is published together with a forward-looking producer survey of planned output, which this program uses as a cross-check.
Reading the data
Constructive: production machinery is up 24.7% y/y. Cautious: the inventory ratio rose for the first time in two months and shipments fell faster than output. This is a single month, so it does not establish a trend change.
Market angle
The source makes no statement on markets or monetary policy, and we do not infer one. Investors may instead track the September preliminary report and whether planned output materializes.
生産を動かした真の主役:自動車の下押しと生産用機械の押し上げ
What drove the move: item-level detail
In the preliminary item tables, the auto decline centered on large passenger cars (-5.7% m/m, -0.31 pt) and small passenger cars (-17.3%, -0.14 pt). Notebook PCs fell 42.2% (-0.14 pt). On the upside: molds +30.0%, aircraft engine parts +9.6% and consumer packaging machinery +56.4%. Item data are from the preliminary release; revised item data are not in this document.
Reading contributions
METI’s contribution figures show how many points of the headline change each sector explains. Autos explain -0.90 pt of the -2.49 pt manufacturing decline. By end-use, durable consumer goods fell 7.8% (-0.57 pt) and producer goods fell 2.1% (-1.02 pt), while capital goods excluding transport were nearly flat (-0.1%).
Pharmaceuticals and the revision
Chemicals excluding inorganic and organic chemicals contributed -0.24 pt, but only -0.01 pt once pharmaceuticals are removed, implying roughly -0.23 pt from pharmaceuticals by subtraction.
International comparison
In the US Fed’s G.17 release, autos are likewise a volatile swing factor; Japan’s data show the same sensitivity, as autos alone explain about a third of the decline.
Balanced view
The drag is concentrated rather than broad, which tempers the downside reading. But the five largest negative sectors account for most of the drop, and one month cannot separate temporary swings from structural ones. The report itself makes no market forecast.
在庫サイクル診断:出荷減主導の在庫率上昇、局所に在庫圧力
Reading the four-way balance
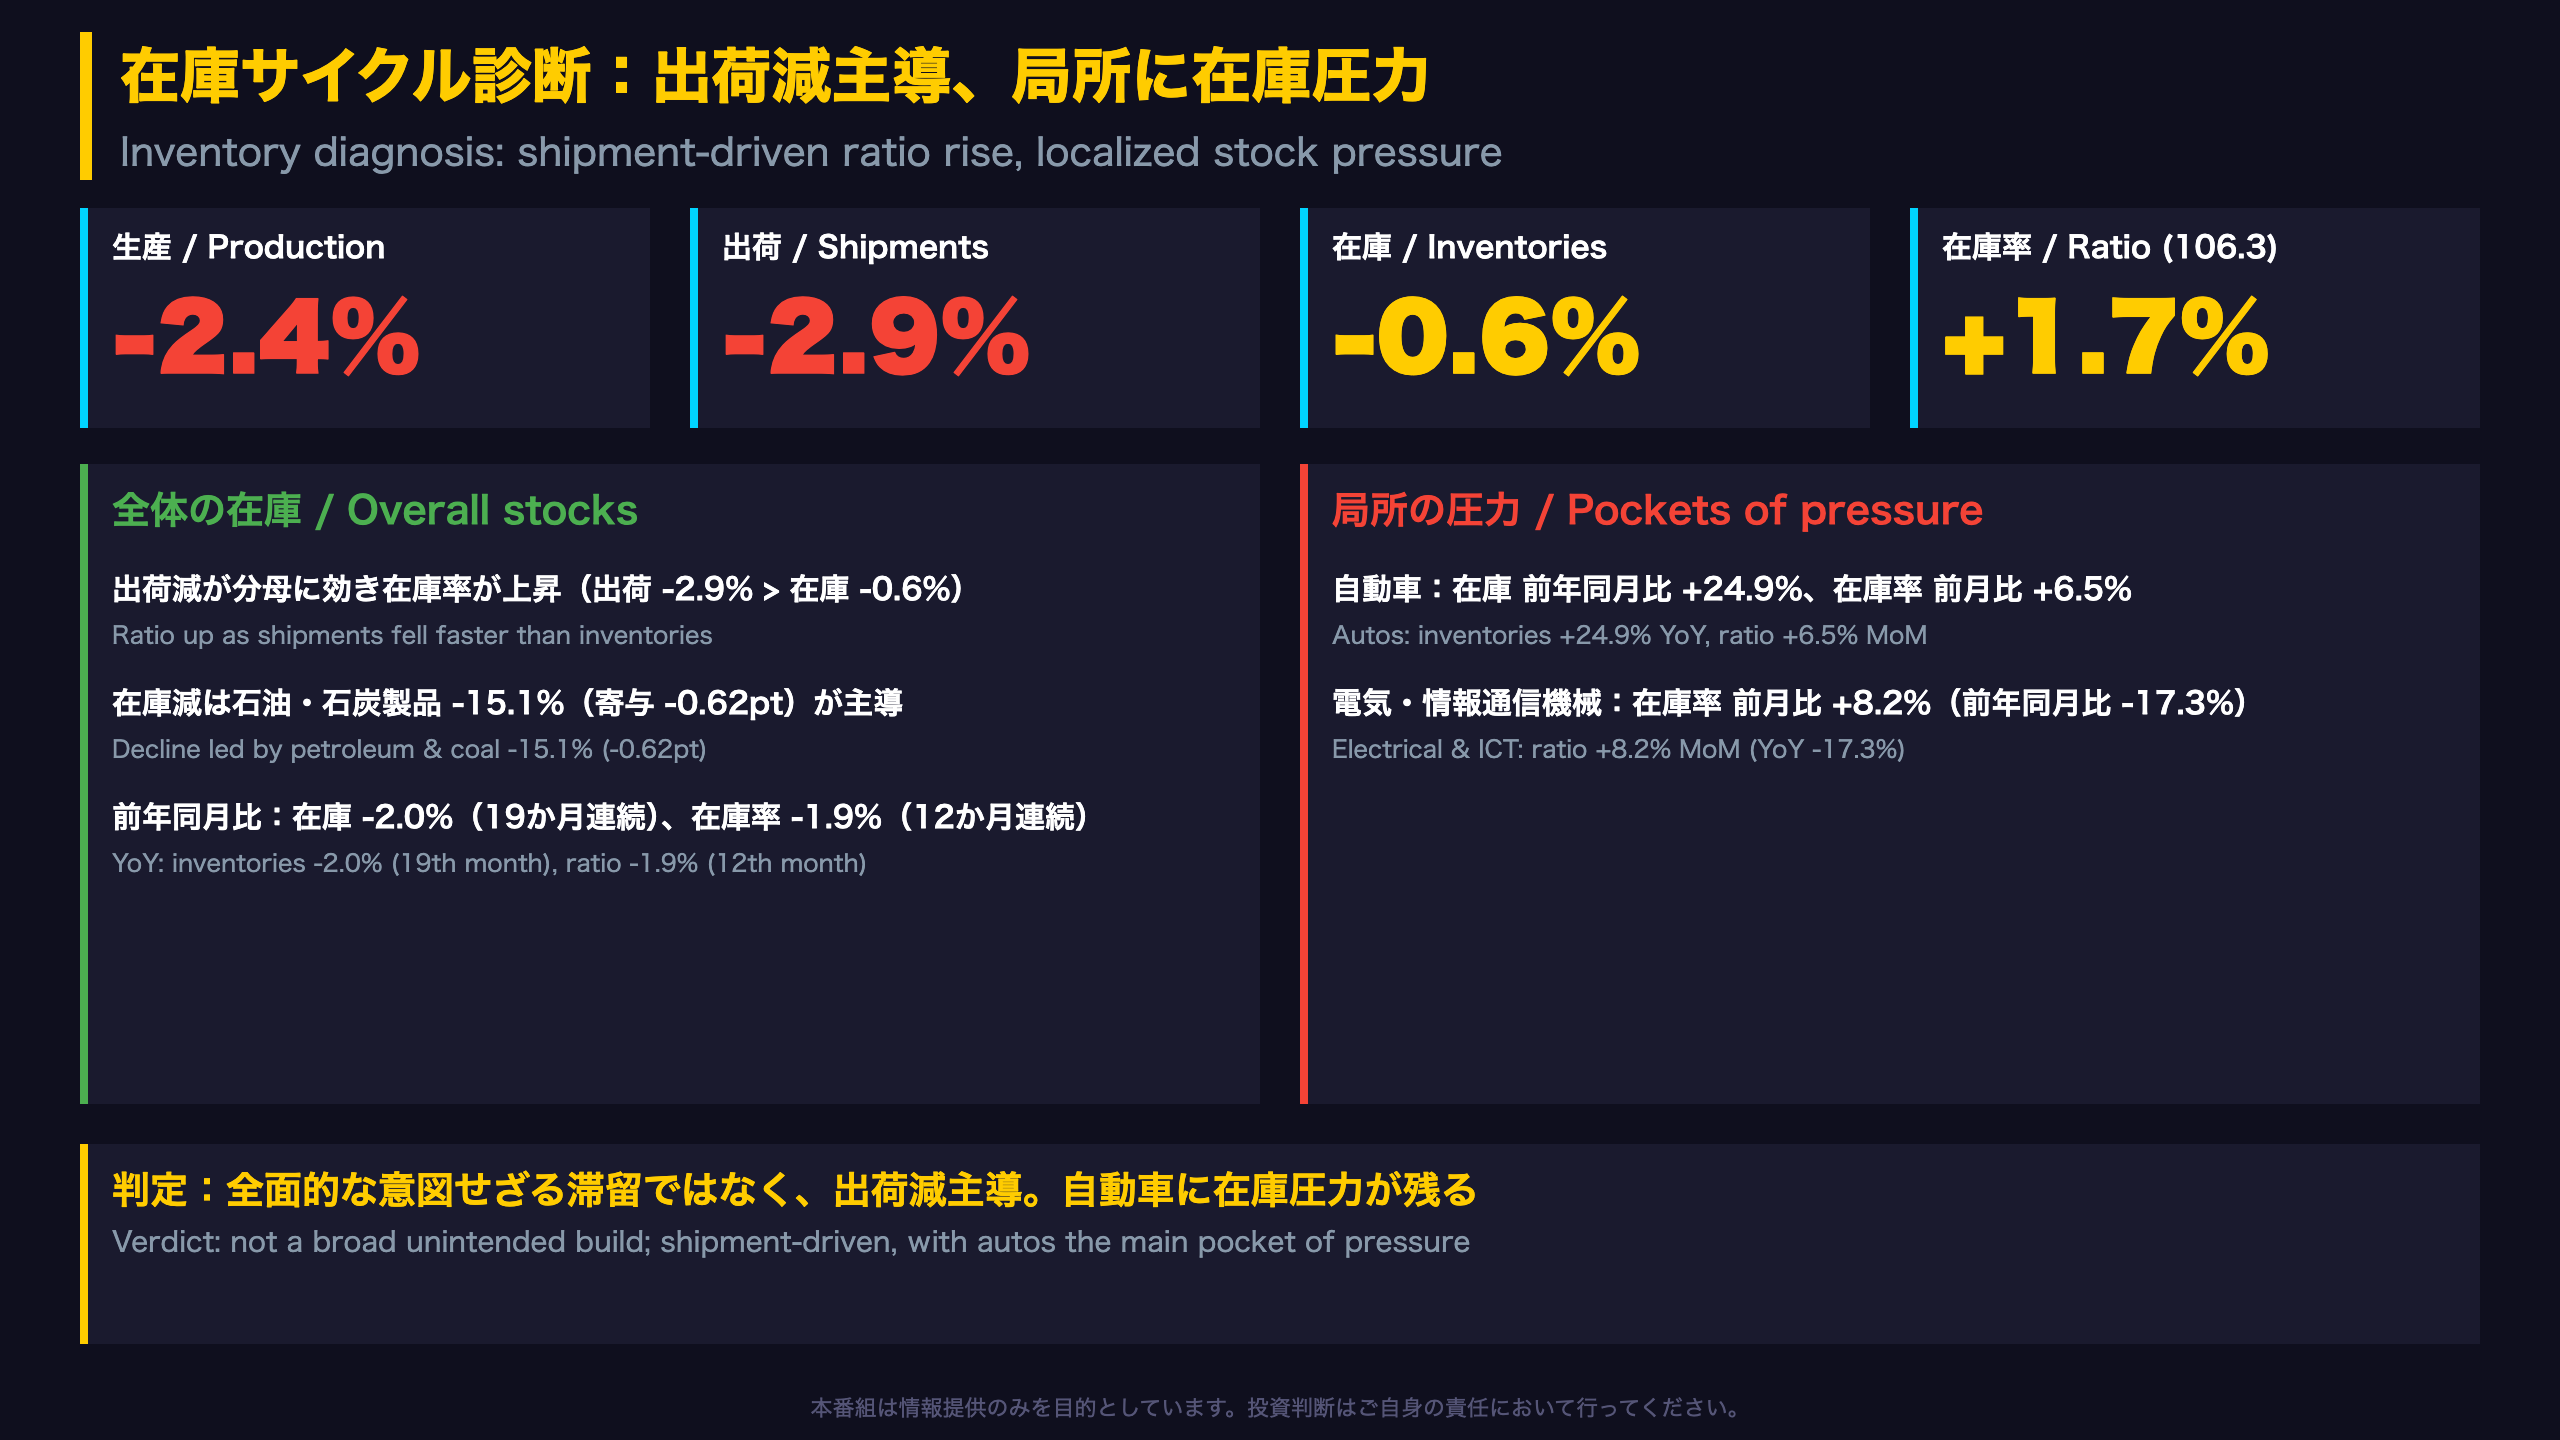
The inventory ratio is inventories divided by shipments (seasonally adjusted, 2020 = 100). In August, production (-2.4%), shipments (-2.9%) and inventories (-0.6%) all fell, yet the ratio rose 1.7% to 106.3 because shipments fell faster. This is closer to a denominator effect than to a surge in unsold goods.
Where the ratio rose
Contributions to the ratio increase: electrical and information machinery +0.51 pt (ratio +8.2%), transport equipment +0.45 pt, autos +0.44 pt (+6.5%), plastics +0.42 pt and iron/steel and non-ferrous +0.43 pt. Production machinery moved the other way (-0.32 pt, ratio -4.9%).
Inventories themselves
Petroleum and coal inventories fell 15.1% (-0.62 pt); gasoline stocks dropped 28.5% in the preliminary item table. Auto inventories fell 3.3% m/m but remain 24.9% above a year ago.
Year-on-year backdrop
Inventories have fallen y/y for 19 straight months (-2.0%) and the ratio for 12 months (-1.9%), which argues against a broad build-up.
Why it matters internationally
The US analogue is the inventory-to-sales ratio from the Census Bureau and the Fed’s G.17; Japan’s ratio is built on producers’ shipments, so it is more sensitive to factory-gate demand swings.
Caveats
METI’s inventory cycle chart is not reproduced in the text, so we do not classify the cycle phase. The report makes no market call.
設備投資シグナル:生産用機械が突出、稼働率は資料外
Production machinery trend (seasonally adjusted)
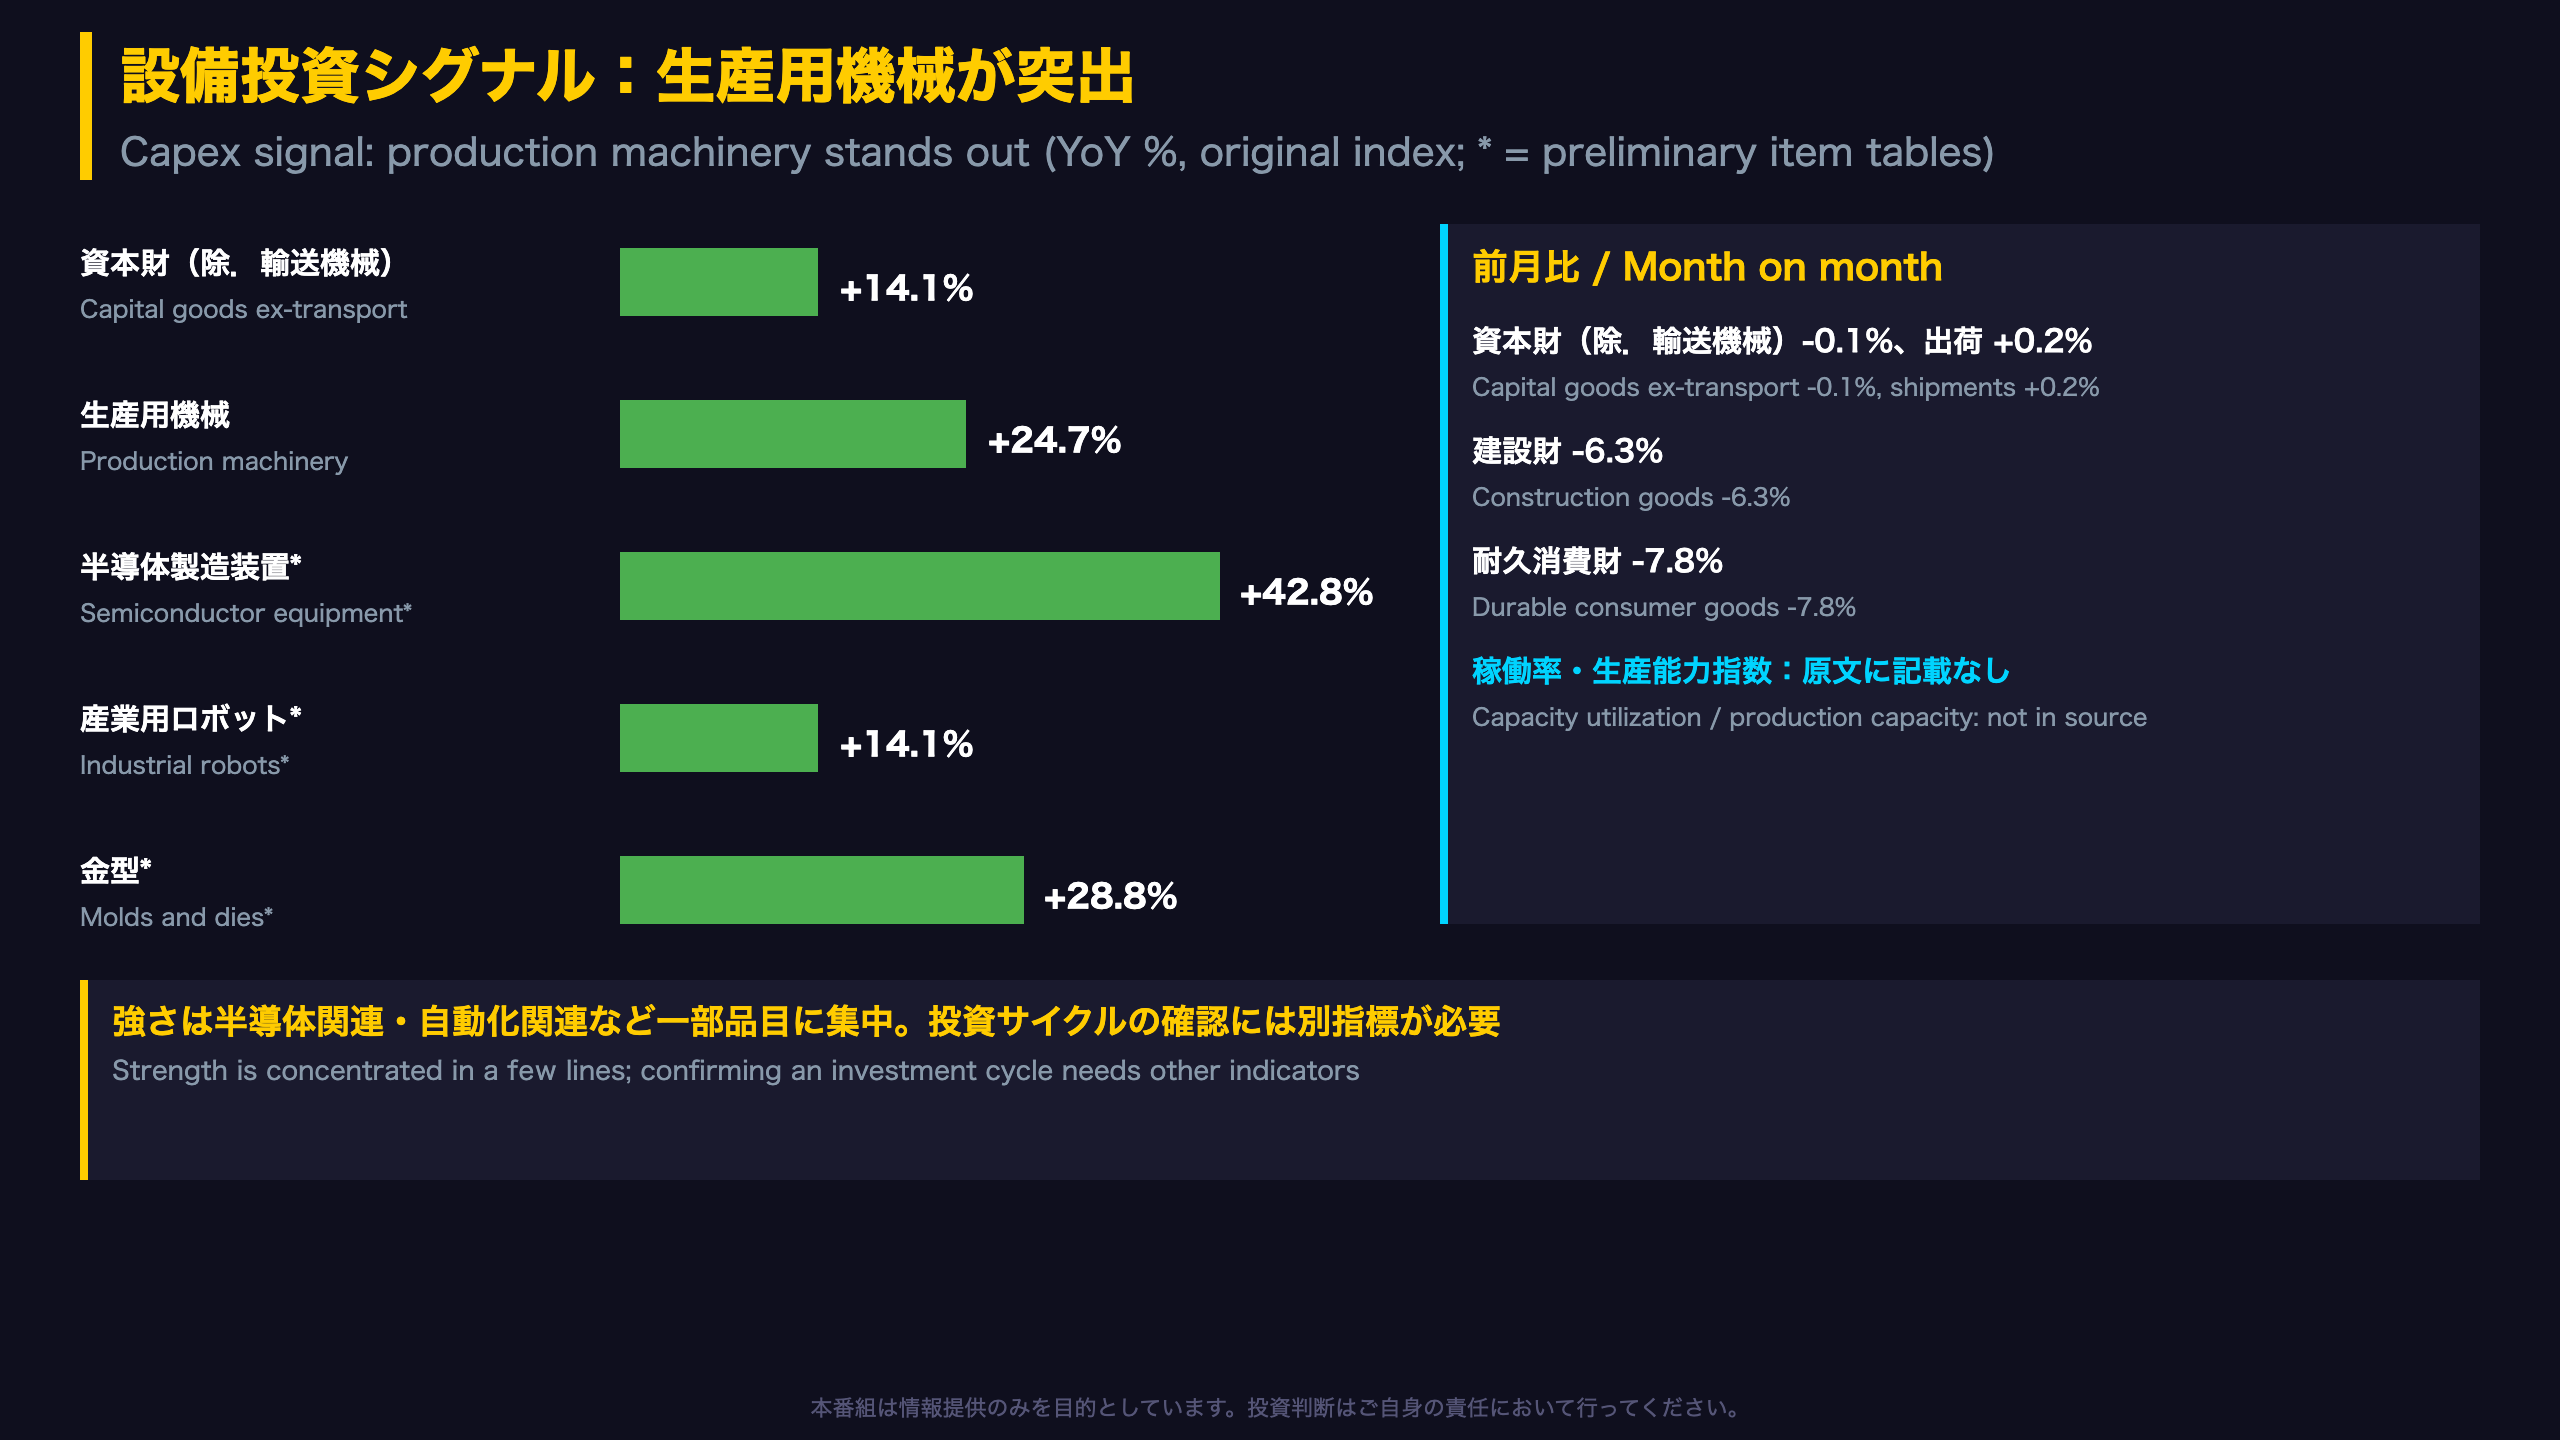
The production machinery index went from 118.8 in May to 142.4 in August: +7.7% in June, +5.1% in July, +5.9% in August, a third straight gain. Shipments of the sector reached 140.5 (+4.9% m/m) and 23.3% above a year earlier.
Sub-items (preliminary tables, original index, y/y)
- Semiconductor manufacturing equipment: +42.8%
- Flat-panel display equipment: +53.4%
- Machining centers +15.7%, lathes +20.9%
- Industrial robots +14.1%, molds +28.8%
What Japan’s capital goods series measure
METI’s capital goods (excluding transport) series proxies business equipment output: pumps, machine tools, electrical equipment and similar. It is a production measure, not an orders or capex survey like the Cabinet Office’s machinery orders or the BOJ Tankan, so it should be read alongside them.
Weak spots
Construction goods fell 6.3% (-0.34 pt) and durable consumer goods 7.8%. Total capital goods shipments fell 4.0%, mostly because transport equipment (ships, marine engines) fell 19.8%; excluding transport, shipments rose 0.2%.
Limits of this report
Capacity utilization and capacity indexes are not included, so we avoid declaring an investment-cycle upturn. Strength is concentrated in semiconductor-related and automation lines.
Next
The preliminary-release survey pointed to production machinery +12.9% in October. The report itself offers no market view.
先行きシグナル:計画は強いが実現率に課題
The forecast survey (from the preliminary release)
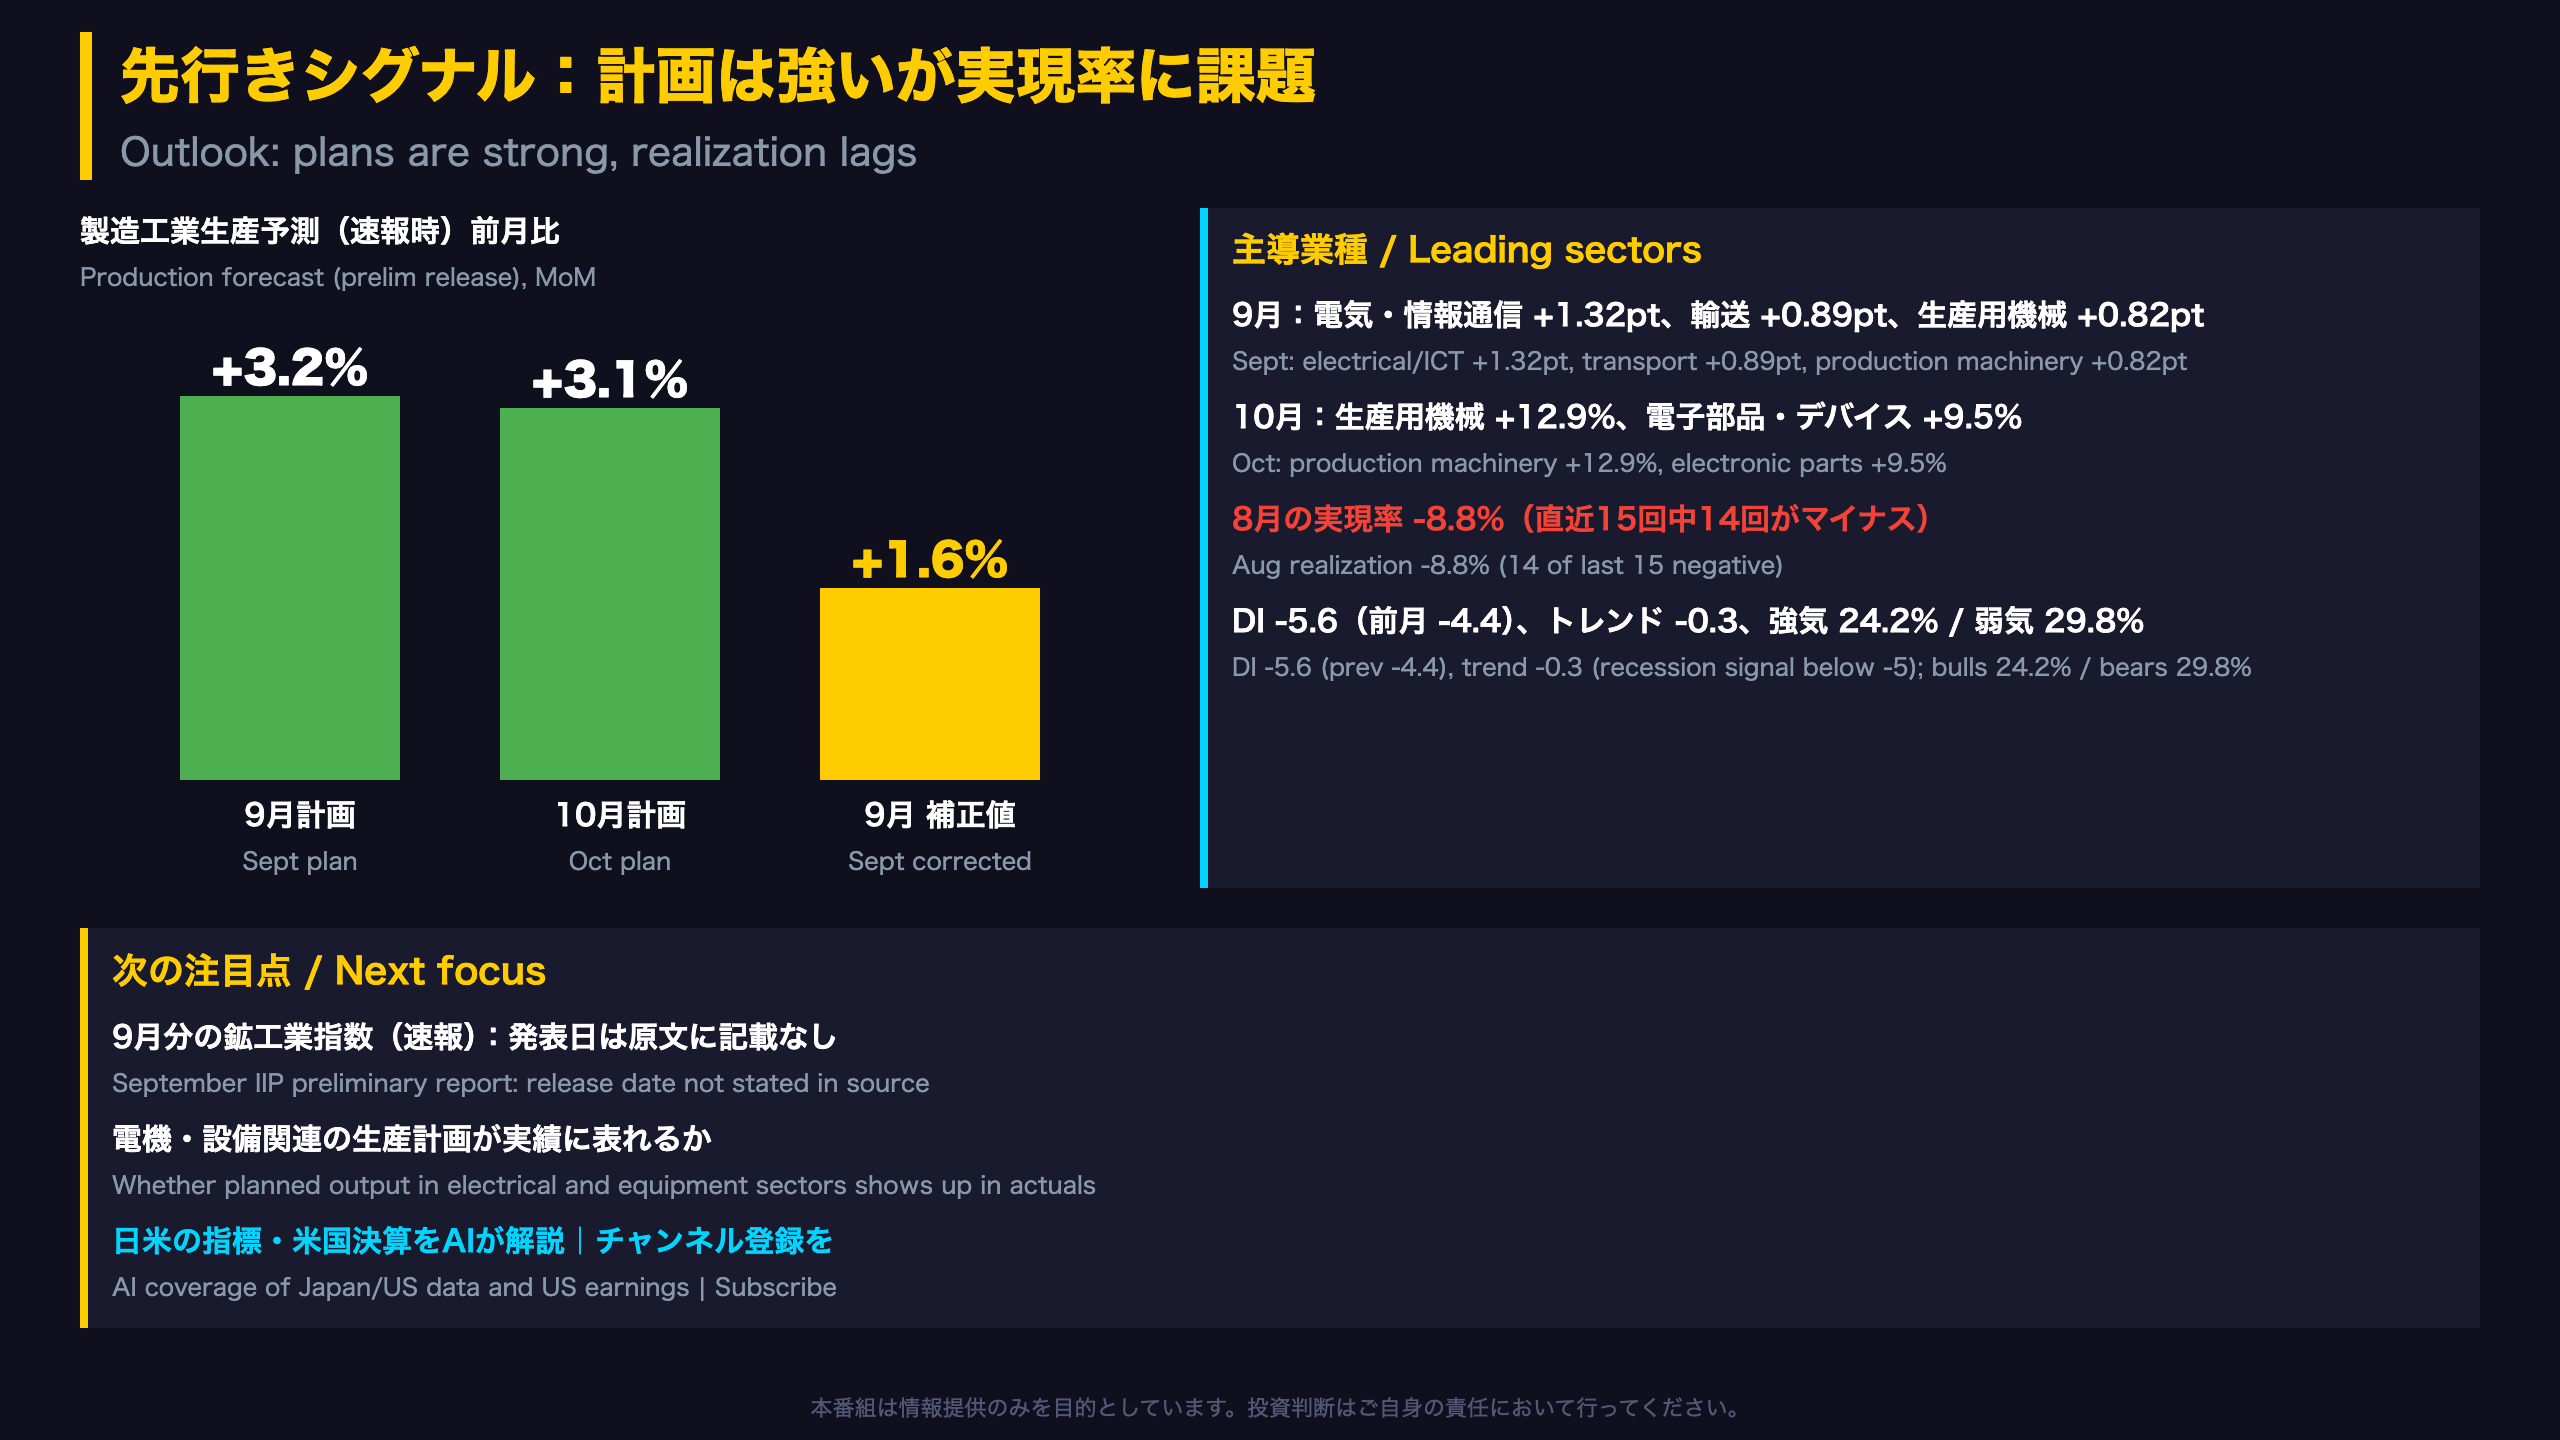
METI’s Survey of Production Forecast covers about 186 manufactured goods and asks major firms for planned output in the current and following month. The September survey implied output growth of +3.2% in September and +3.1% in October. Capital goods excluding transport are planned at +4.5% (September) and +12.7% (October, contributing 2.79 points).
How reliable are the plans?
The realization ratio (actual versus last survey’s plan) was -8.8% for August, and 14 of the last 15 readings were negative, indicating plans have tended to overshoot. METI’s bias-corrected September estimate is +1.6% (index 104.2) and the revision ratio was -1.8%.
Sentiment
The production sentiment DI is -5.6 (previous -4.4). METI notes that a DI trend below -5 suggests a likely recession phase; the trend is -0.3. Bullish firms are 24.2% and bearish 29.8%.
International comparison
There is no exact US equivalent of a government-published production-plan survey; the closest are regional Fed manufacturing surveys and the ISM, which are sentiment-based, whereas this is a quantity-based plan.
Balanced view
Plans are led by equipment-related sectors, a positive. But chronic negative realization and a falling DI mean the plans need confirmation. The report offers no market conclusion; the next data point is the September preliminary report, date not stated in the source.
Disclaimer: This article is for informational purposes only. All investment decisions are made solely at your own risk.