
📺 Watch the Full Video Analysis
This article was automatically generated by the NFC Market Live AI analysis system. (Updated: 2026-10-26 07:15 JST)
📊 A deep dive into this week’s global bond data.
📉 The US 10-year yield was 4.96% (as of Oct 22), down 0.14 points on the week. The 2-year and 30-year also fell, and the 10Y-2Y spread held at +0.31 points, so the curve shape was preserved.
📈 In Japan, JGB auctions (2Y on Sep 30; 5Y, 10Y, 20Y and 30Y in October) showed higher bid-to-cover ratios than the previous round for the same maturity.
⚠️ US Treasury auction results and UK gilt yields could not be retrieved, so judgment is withheld. OAT and BTP are monthly data; the wider spreads come mechanically from lower Bund yields.
💡 In the NFC HMM, only the ECB regime changed this week: Above-Target Drift to Moderate.
グローバル金利スナップショット
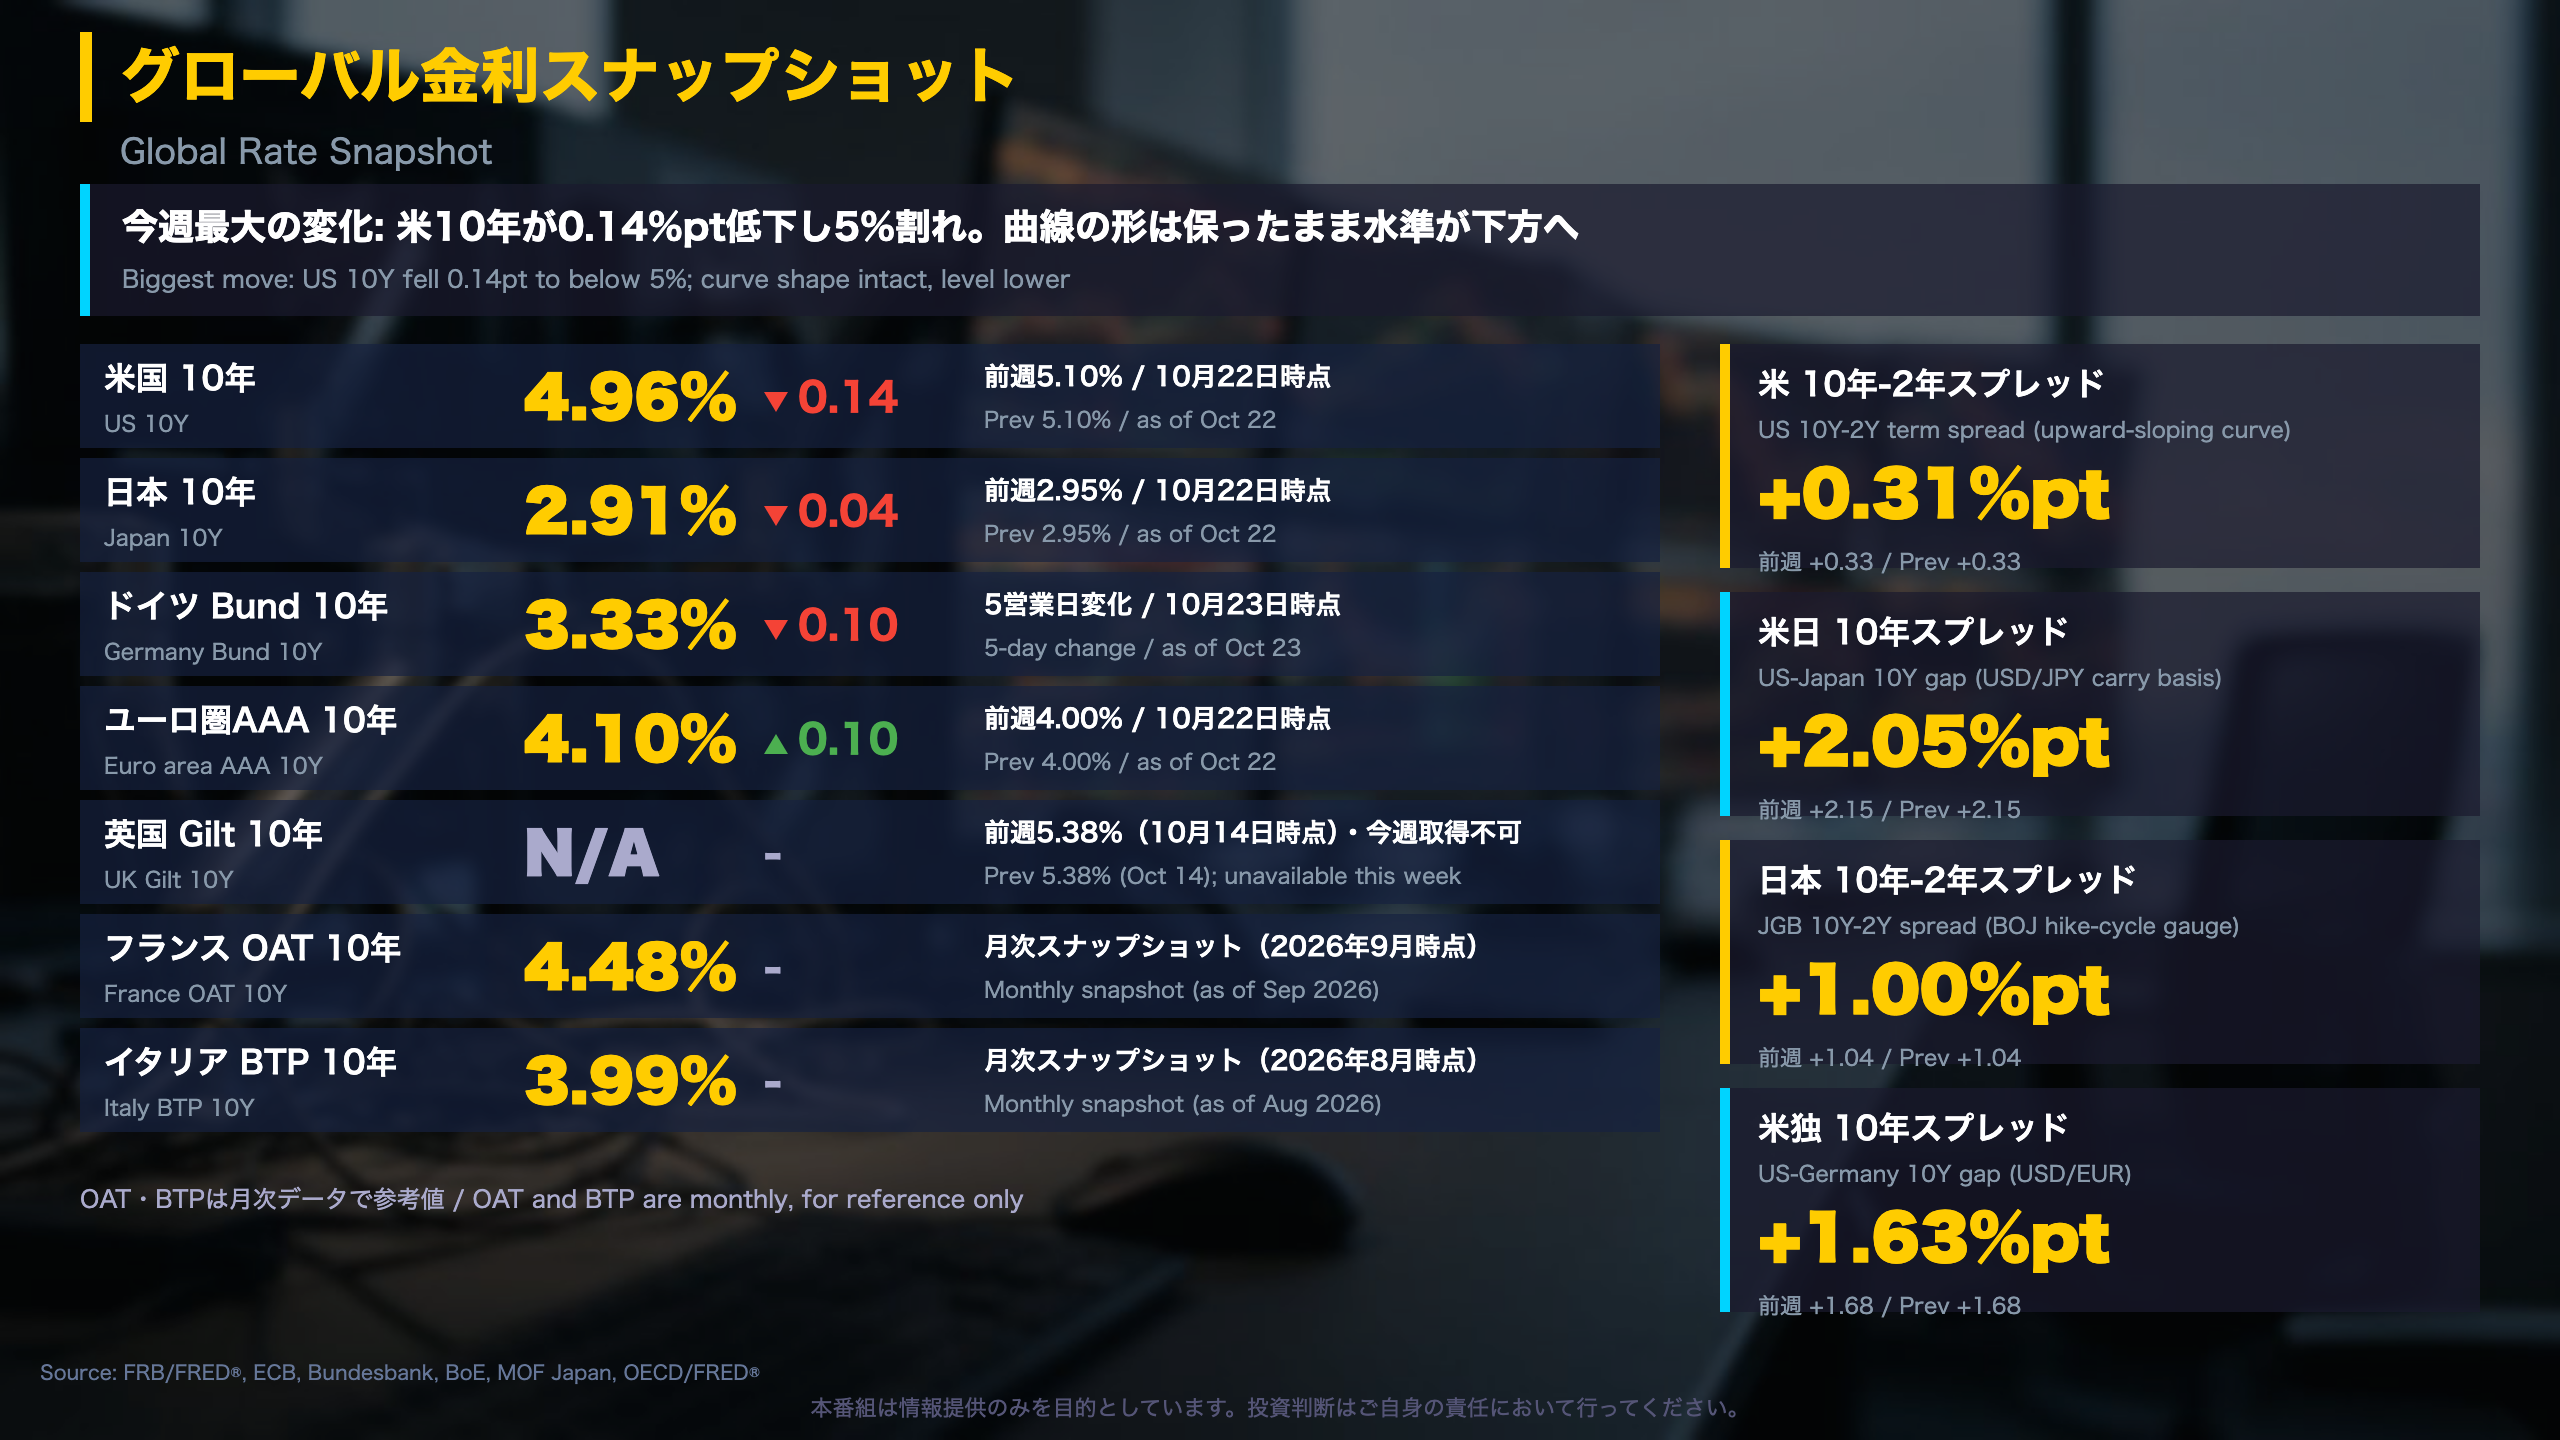
Global rate snapshot: lower levels, same curve shape
This weekly report pulls together data from the Federal Reserve (H.15, via FRED), the European Central Bank, Deutsche Bundesbank, the Bank of England, Japan’s Ministry of Finance and the OECD.
What moved
| Series | This week | Last week | Change |
|---|---|---|---|
| US 2Y | 4.65% | 4.77% | -0.12 |
| US 10Y | 4.96% | 5.10% | -0.14 |
| US 30Y | 5.29% | 5.43% | -0.14 |
| Japan 10Y | 2.91% | 2.95% | -0.04 |
| Germany 10Y | 3.33% | 3.42% | -0.10 (5-day, per source) |
| Euro AAA 10Y | 4.10% | 4.00% | +0.10 |
Context. The prior report showed the US 10Y down 0.18 points over its window, so long-term US yields have now fallen in two consecutive reports. The 10Y-2Y spread of +0.31 points (0.33 a week earlier) says the curve is still upward-sloping.
International comparison
A US 10Y near 5% against Japan’s 2.91% leaves a +2.05 point gap, down from +2.15. Against Germany the gap is +1.63 points.
Market implications (conditional)
A narrower US-Japan gap may reduce the interest-rate appeal of yen-funded dollar positions, though one week does not establish a trend. Missing US auction and UK gilt data limit how far supply-demand conclusions can go.
Next: check whether the US auction results and gilt data are available, and whether the US-Japan gap keeps narrowing.
米国債:利回りの低下と入札データの欠落
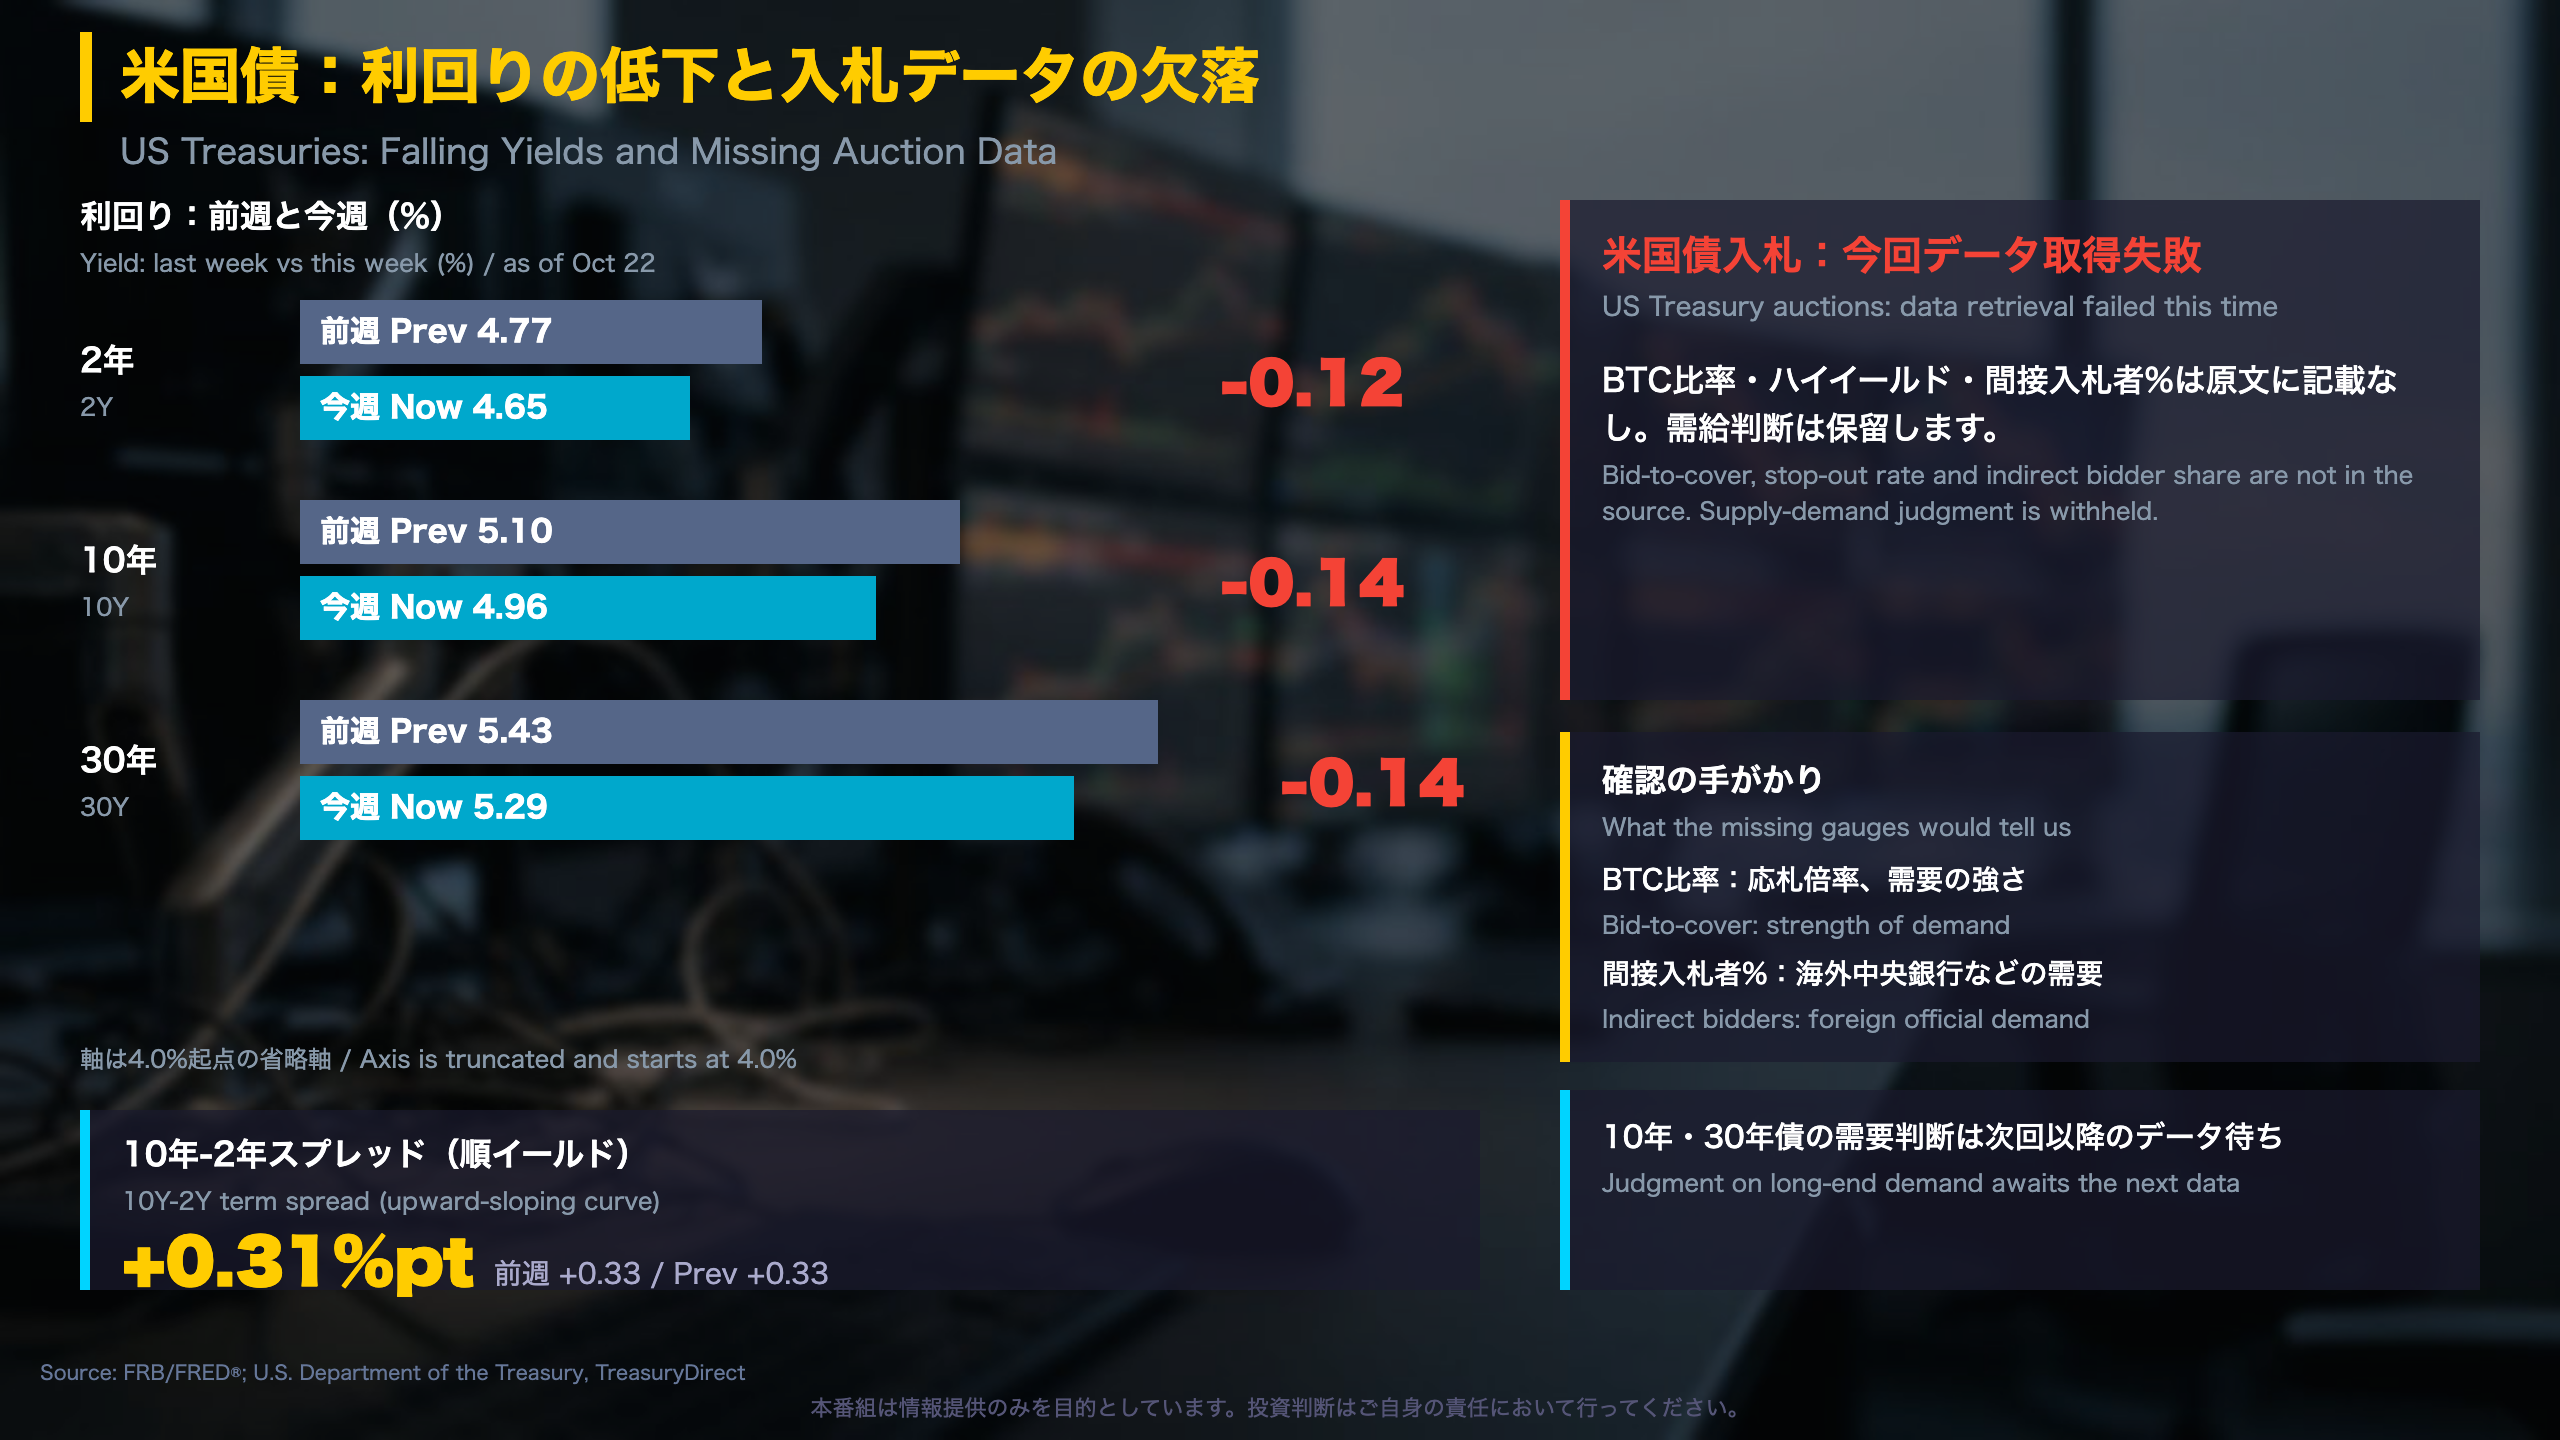
US Treasuries: what the decline shows, and what we cannot see
Data context
Yield data come from the Federal Reserve’s H.15 release (via FRED). Auction data come from the US Treasury’s TreasuryDirect, which sells and publishes results for all marketable Treasury securities.
| Maturity | Last week | This week | Change |
|---|---|---|---|
| 2Y | 4.77% | 4.65% | -0.12 |
| 10Y | 5.10% | 4.96% | -0.14 |
| 30Y | 5.43% | 5.29% | -0.14 |
Time-series note
In the prior report the 2Y was flat (+0.00), while the 10Y fell 0.18 and the 30Y fell 0.24. This week the front end joined the move. The 10Y-2Y spread slipped from +0.33 to +0.31 points, so the curve stayed upward-sloping.
What is missing
The auction table in the source reads “data retrieval failed.” That means three standard demand gauges are unavailable: the bid-to-cover ratio, the indirect bidder share (a proxy for foreign official and institutional demand) and the stop-out yield.
Two readings
One reading is that a decline across all maturities reflects broad-based buying. The other is that, without auction data, the buyer base and supply-demand balance cannot be verified. This report cannot choose between them.
International comparison
A US 10Y just under 5% sits well above Germany’s 3.33% and Japan’s 2.91%, which is why US-Japan and US-Germany gaps are tracked closely by FX participants.
Next: once auction results are available, compare 10Y and 30Y bid-to-cover and indirect bidder shares against prior auctions.
ヨーロッパ債券市場
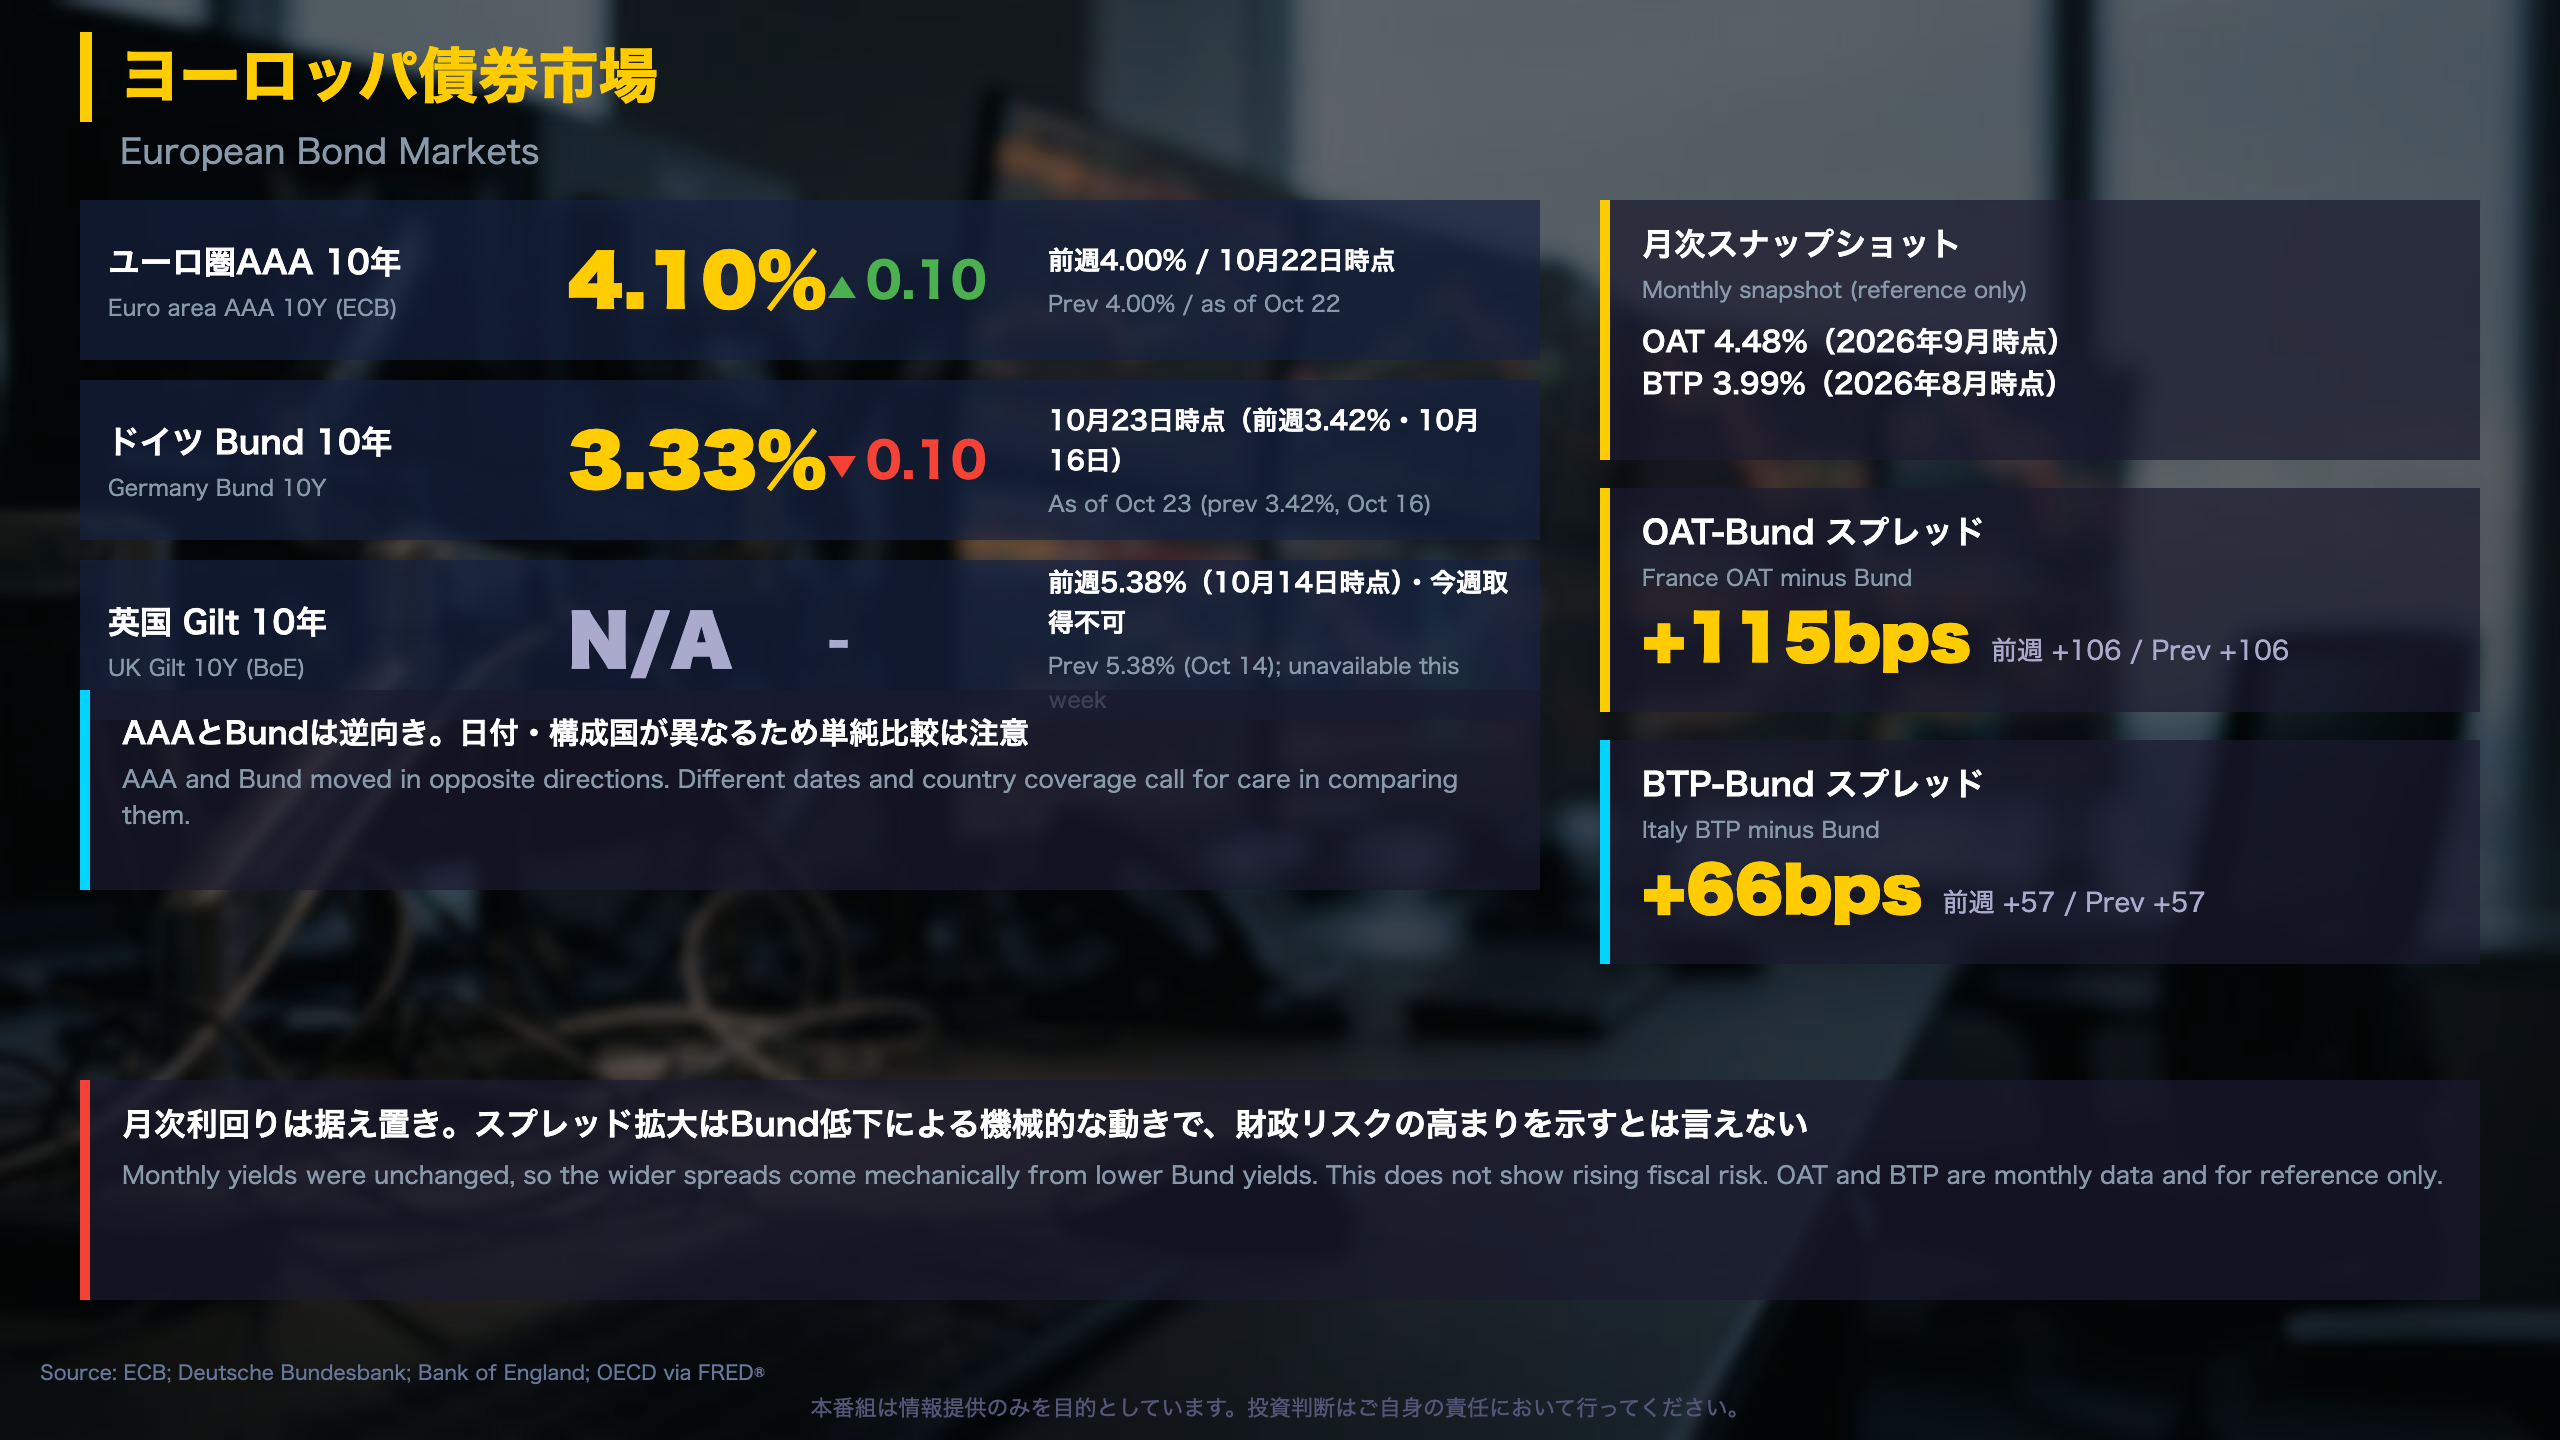
European bonds: diverging gauges and the monthly-data trap
Institutions and series
The euro area AAA yield comes from the ECB’s yield curve statistics, which fit a curve to AAA-rated euro area government bonds. The Bund yield comes from Deutsche Bundesbank, and UK gilts from the Bank of England’s database. France and Italy come from the OECD via FRED and are monthly.
| Series | This week | Last week |
|---|---|---|
| Euro AAA 10Y | 4.10% (Oct 22) | 4.00% |
| Bund 10Y | 3.33% (Oct 23) | 3.42% |
| Gilt 10Y | unavailable | 5.38% (Oct 14) |
| OAT 10Y | 4.48% (Sep, monthly) | 4.48% |
| BTP 10Y | 3.99% (Aug, monthly) | 3.99% |
Spread arithmetic
OAT-Bund rose from +106 to +115 bps and BTP-Bund from +57 to +66 bps. Because the OAT and BTP inputs are unchanged monthly values, the 9 bp widening is entirely the Bund’s decline. The source itself flags these as reference values.
Two readings
Lower Bund yields could reflect demand for safe assets, but the AAA series rose in the same period, so the evidence is mixed. The two series have different dates and coverage.
International comparison
France and Italy spreads are watched as proxies for fiscal and political risk, much as investors track US-Treasury-based credit spreads. With monthly inputs, they cannot capture weekly shifts.
Market implications (conditional)
Until French and Italian yields update, the spread series says little about euro-area risk sentiment this week.
Next: the monthly OAT/BTP update and whether gilt data return.
日本国債・日銀政策金利
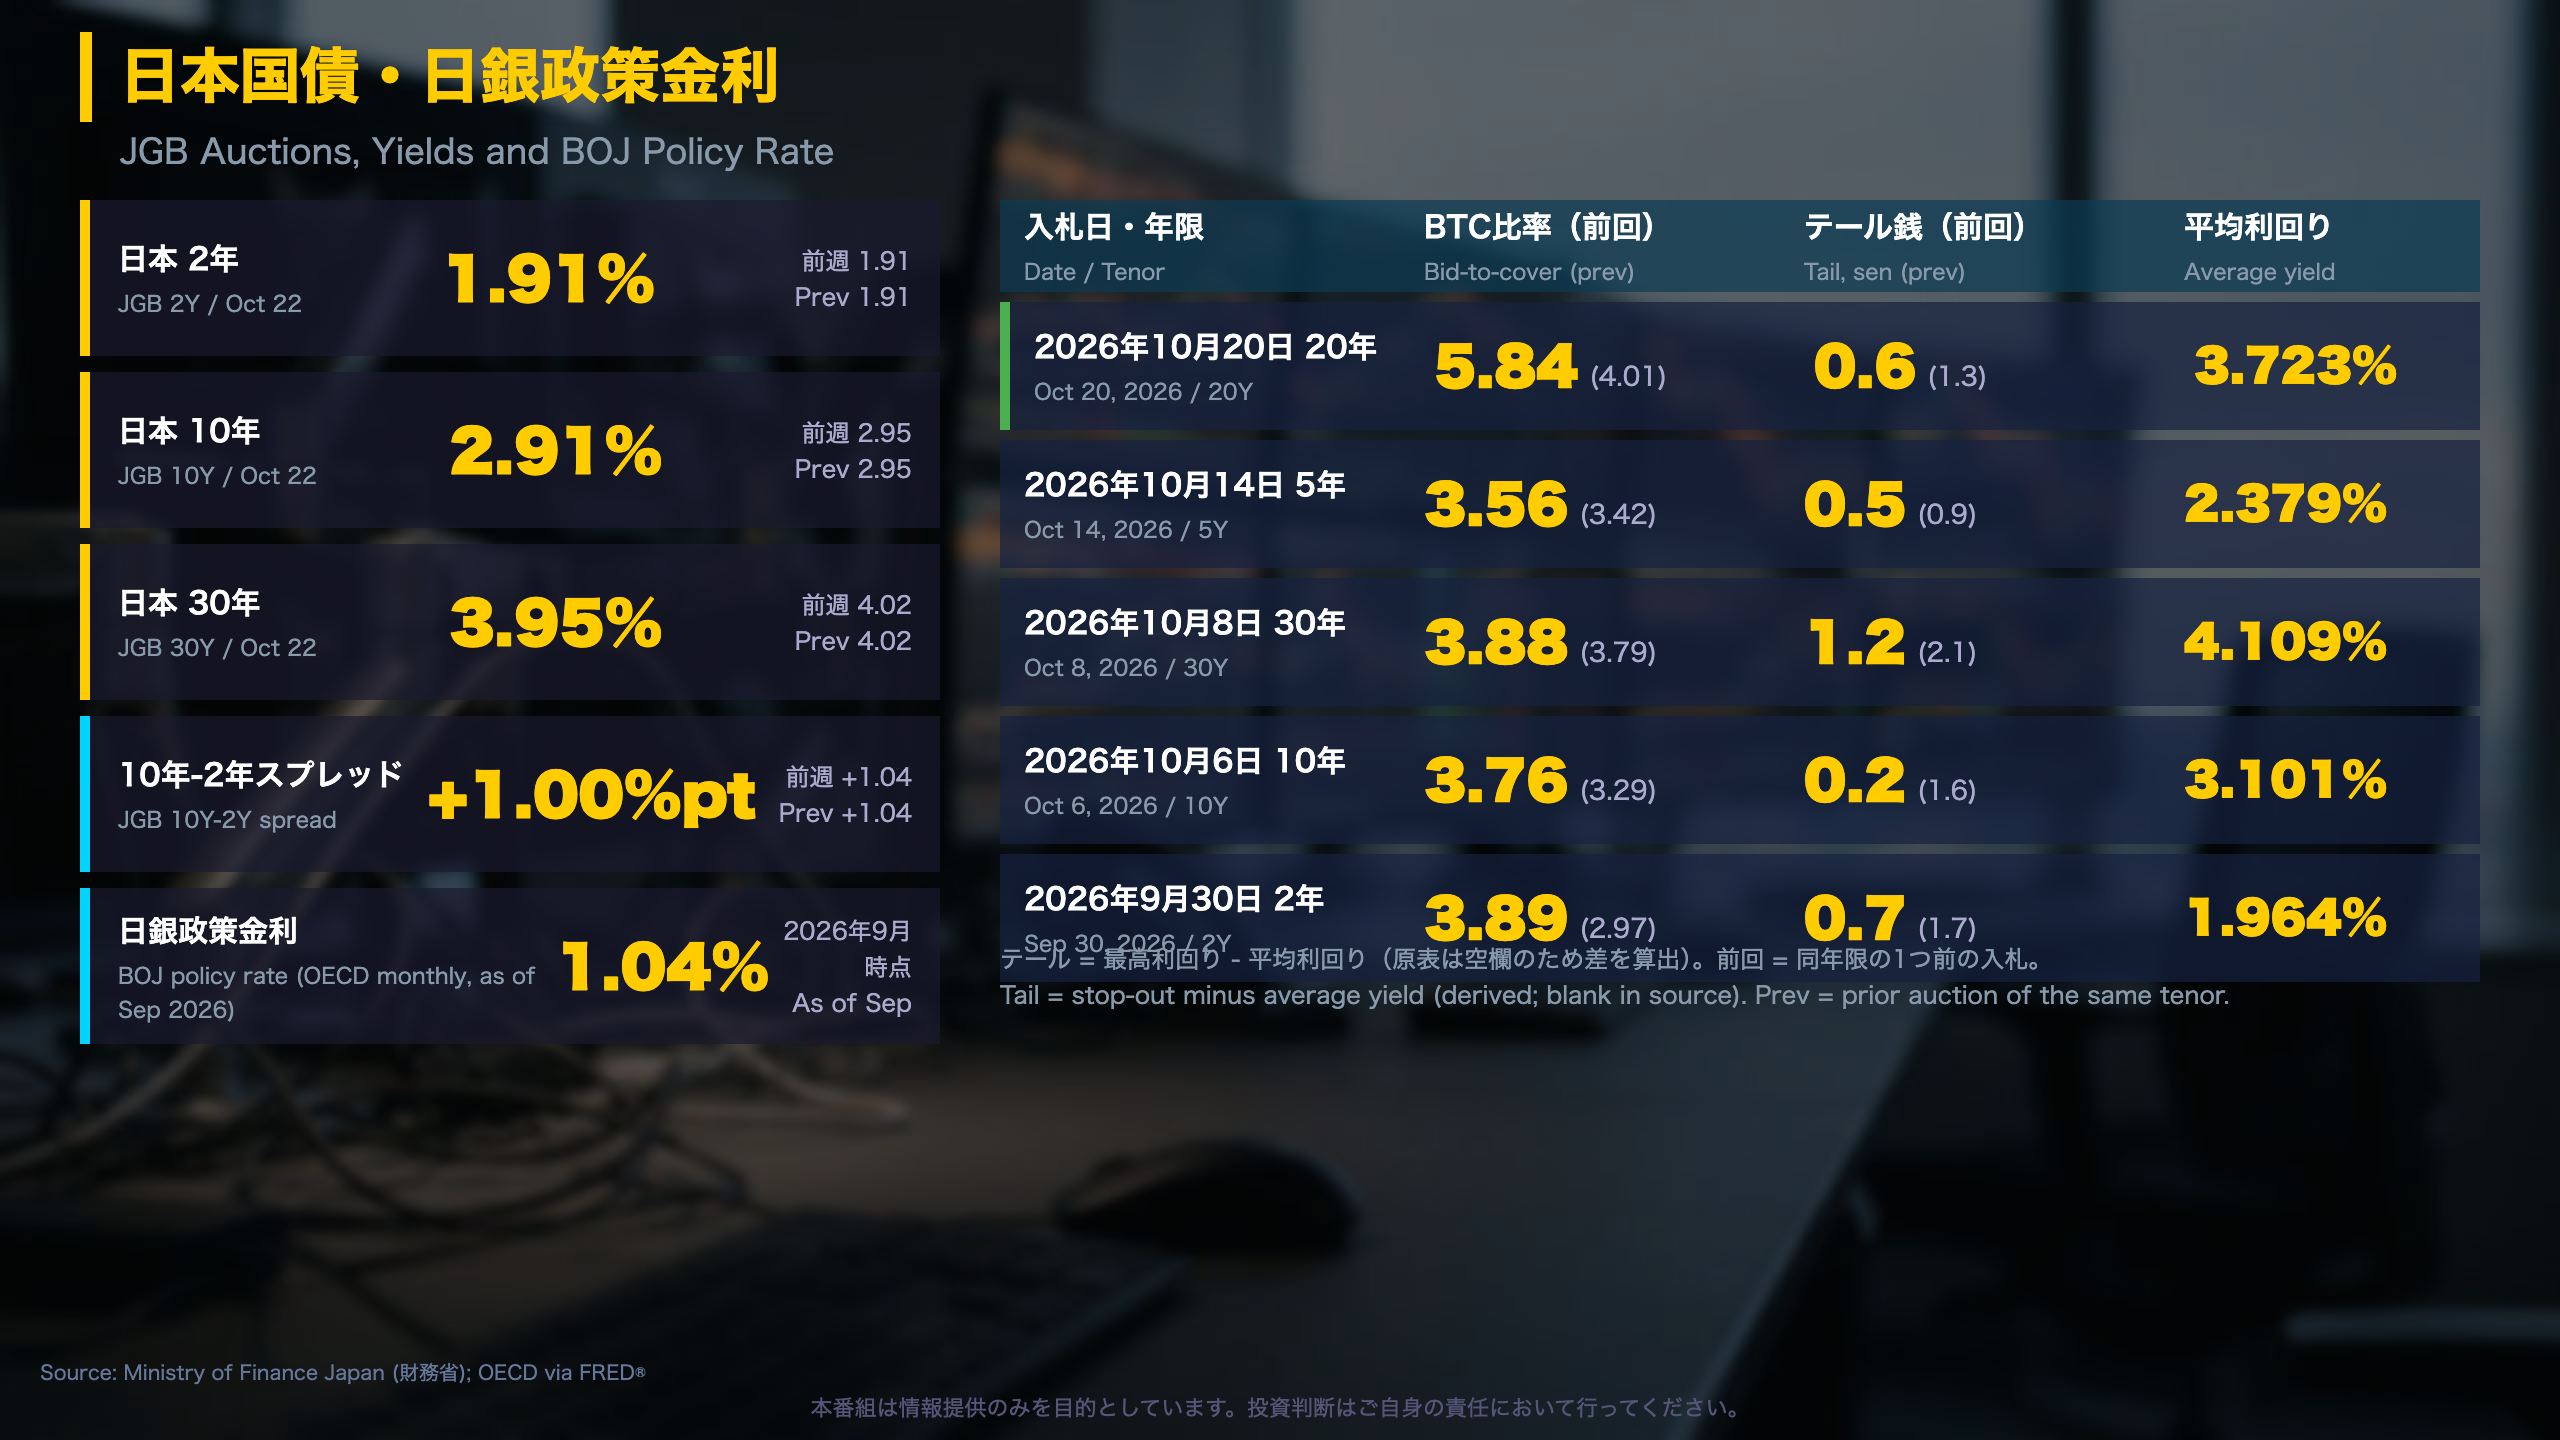
Japanese government bonds: firm auctions, higher yields
From the source: “Tail (Stop-out minus average): the larger it is, the more uneven demand is, a sign of supply-demand concern.”
Institution context
JGB auctions are run by Japan’s Ministry of Finance. The Bank of Japan sets the short-term policy rate; the 1.04% figure here is the OECD’s monthly series via FRED as of September 2026, so it can lag the BOJ’s own announcements.
| Auction date | Tenor | Bid-to-cover (prev) | Tail, sen (prev) | Avg yield (prev) |
|---|---|---|---|---|
| 2026-10-20 | 20Y | 5.84 (4.01) | 0.6 (1.3) | 3.723% (3.856%) |
| 2026-10-14 | 5Y | 3.56 (3.42) | 0.5 (0.9) | 2.379% (2.239%) |
| 2026-10-08 | 30Y | 3.88 (3.79) | 1.2 (2.1) | 4.109% (4.079%) |
| 2026-10-06 | 10Y | 3.76 (3.29) | 0.2 (1.6) | 3.101% (2.995%) |
| 2026-09-30 | 2Y | 3.89 (2.97) | 0.7 (1.7) | 1.964% (1.708%) |
Tail is derived as stop-out minus average yield, since the source column is blank.
Reading the data
The 20Y ratio of 5.84 is the highest among the 30 auctions listed. Yet average yields rose versus the previous round for four of the five maturities, so demand held even as yield levels moved up. JGB yields were slightly lower week on week: 10Y 2.91% (2.95%), 30Y 3.95% (4.02%), with the 10Y-2Y spread at +1.00 (1.04).
International comparison
A bid-to-cover near 3.5-3.9 is comparable to the ranges often seen in US Treasury auctions, though the two markets’ auction mechanics differ.
Market implications (conditional)
The 2Y yield (1.91%) above the 1.04% policy rate may partly reflect expectations of further hikes. A narrower tail suggests orderly demand.
Next: the next 20Y and 30Y auctions: does bid-to-cover hold and does the tail stay narrow?
FX・CFDへの含意とHMMレジーム

FX/CFD implications: connecting spreads to the NFC HMM regimes
What the NFC HMM is
The NFC Hidden Markov Model classifies each central bank’s policy stance into regimes using statistical inputs. It is a descriptive classification, not a forecast.
| Model | Currency | This week | Last week | Confidence |
|---|---|---|---|---|
| ECB | EUR | Moderate | Above-Target Drift | 100% |
| BOE | GBP | Restrictive Hold | Restrictive Hold | 100% |
| US | USD | Slack Recovery | Slack Recovery | 100% |
| BOJ | JPY | Hawkish | Hawkish | 100% |
Spread changes
- US-Japan 10Y: +2.15 to +2.05 points, the interest-rate basis for USD/JPY carry
- US-Germany 10Y: +1.68 to +1.63 points, a gauge sometimes correlated with EUR/USD
- OAT-Bund: +106 to +115 bps; BTP-Bund: +57 to +66 bps (monthly inputs, reference only)
Alignment and divergence
The BOJ Hawkish label sits comfortably with a JGB 2Y yield (1.91%) above the 1.04% policy rate. The ECB shift to Moderate coincides with lower Bund yields, but the euro AAA yield rose in the same week, so the signals are mixed.
International comparison
The Bank of Japan’s stance matters for global carry trades in the way the Federal Reserve’s matters for dollar funding. A smaller US-Japan gap reduces the rate margin for such positions, though it does not by itself determine the exchange rate.
Market implications (conditional)
A narrower gap may work toward a smaller carry appeal. Bond markets show lower US yields but missing US auction and gilt data, so neither risk-on nor risk-off can be asserted.
Next: US auction results, gilt yields, the monthly OAT/BTP update and whether the ECB regime persists.
Disclaimer: This article is for informational purposes only. All investment decisions are made solely at your own risk.