📺 Watch the Full Video Analysis
This article was automatically generated by the NFC Market Live AI analysis system. (Updated: 2026-06-27 11:02 JST)
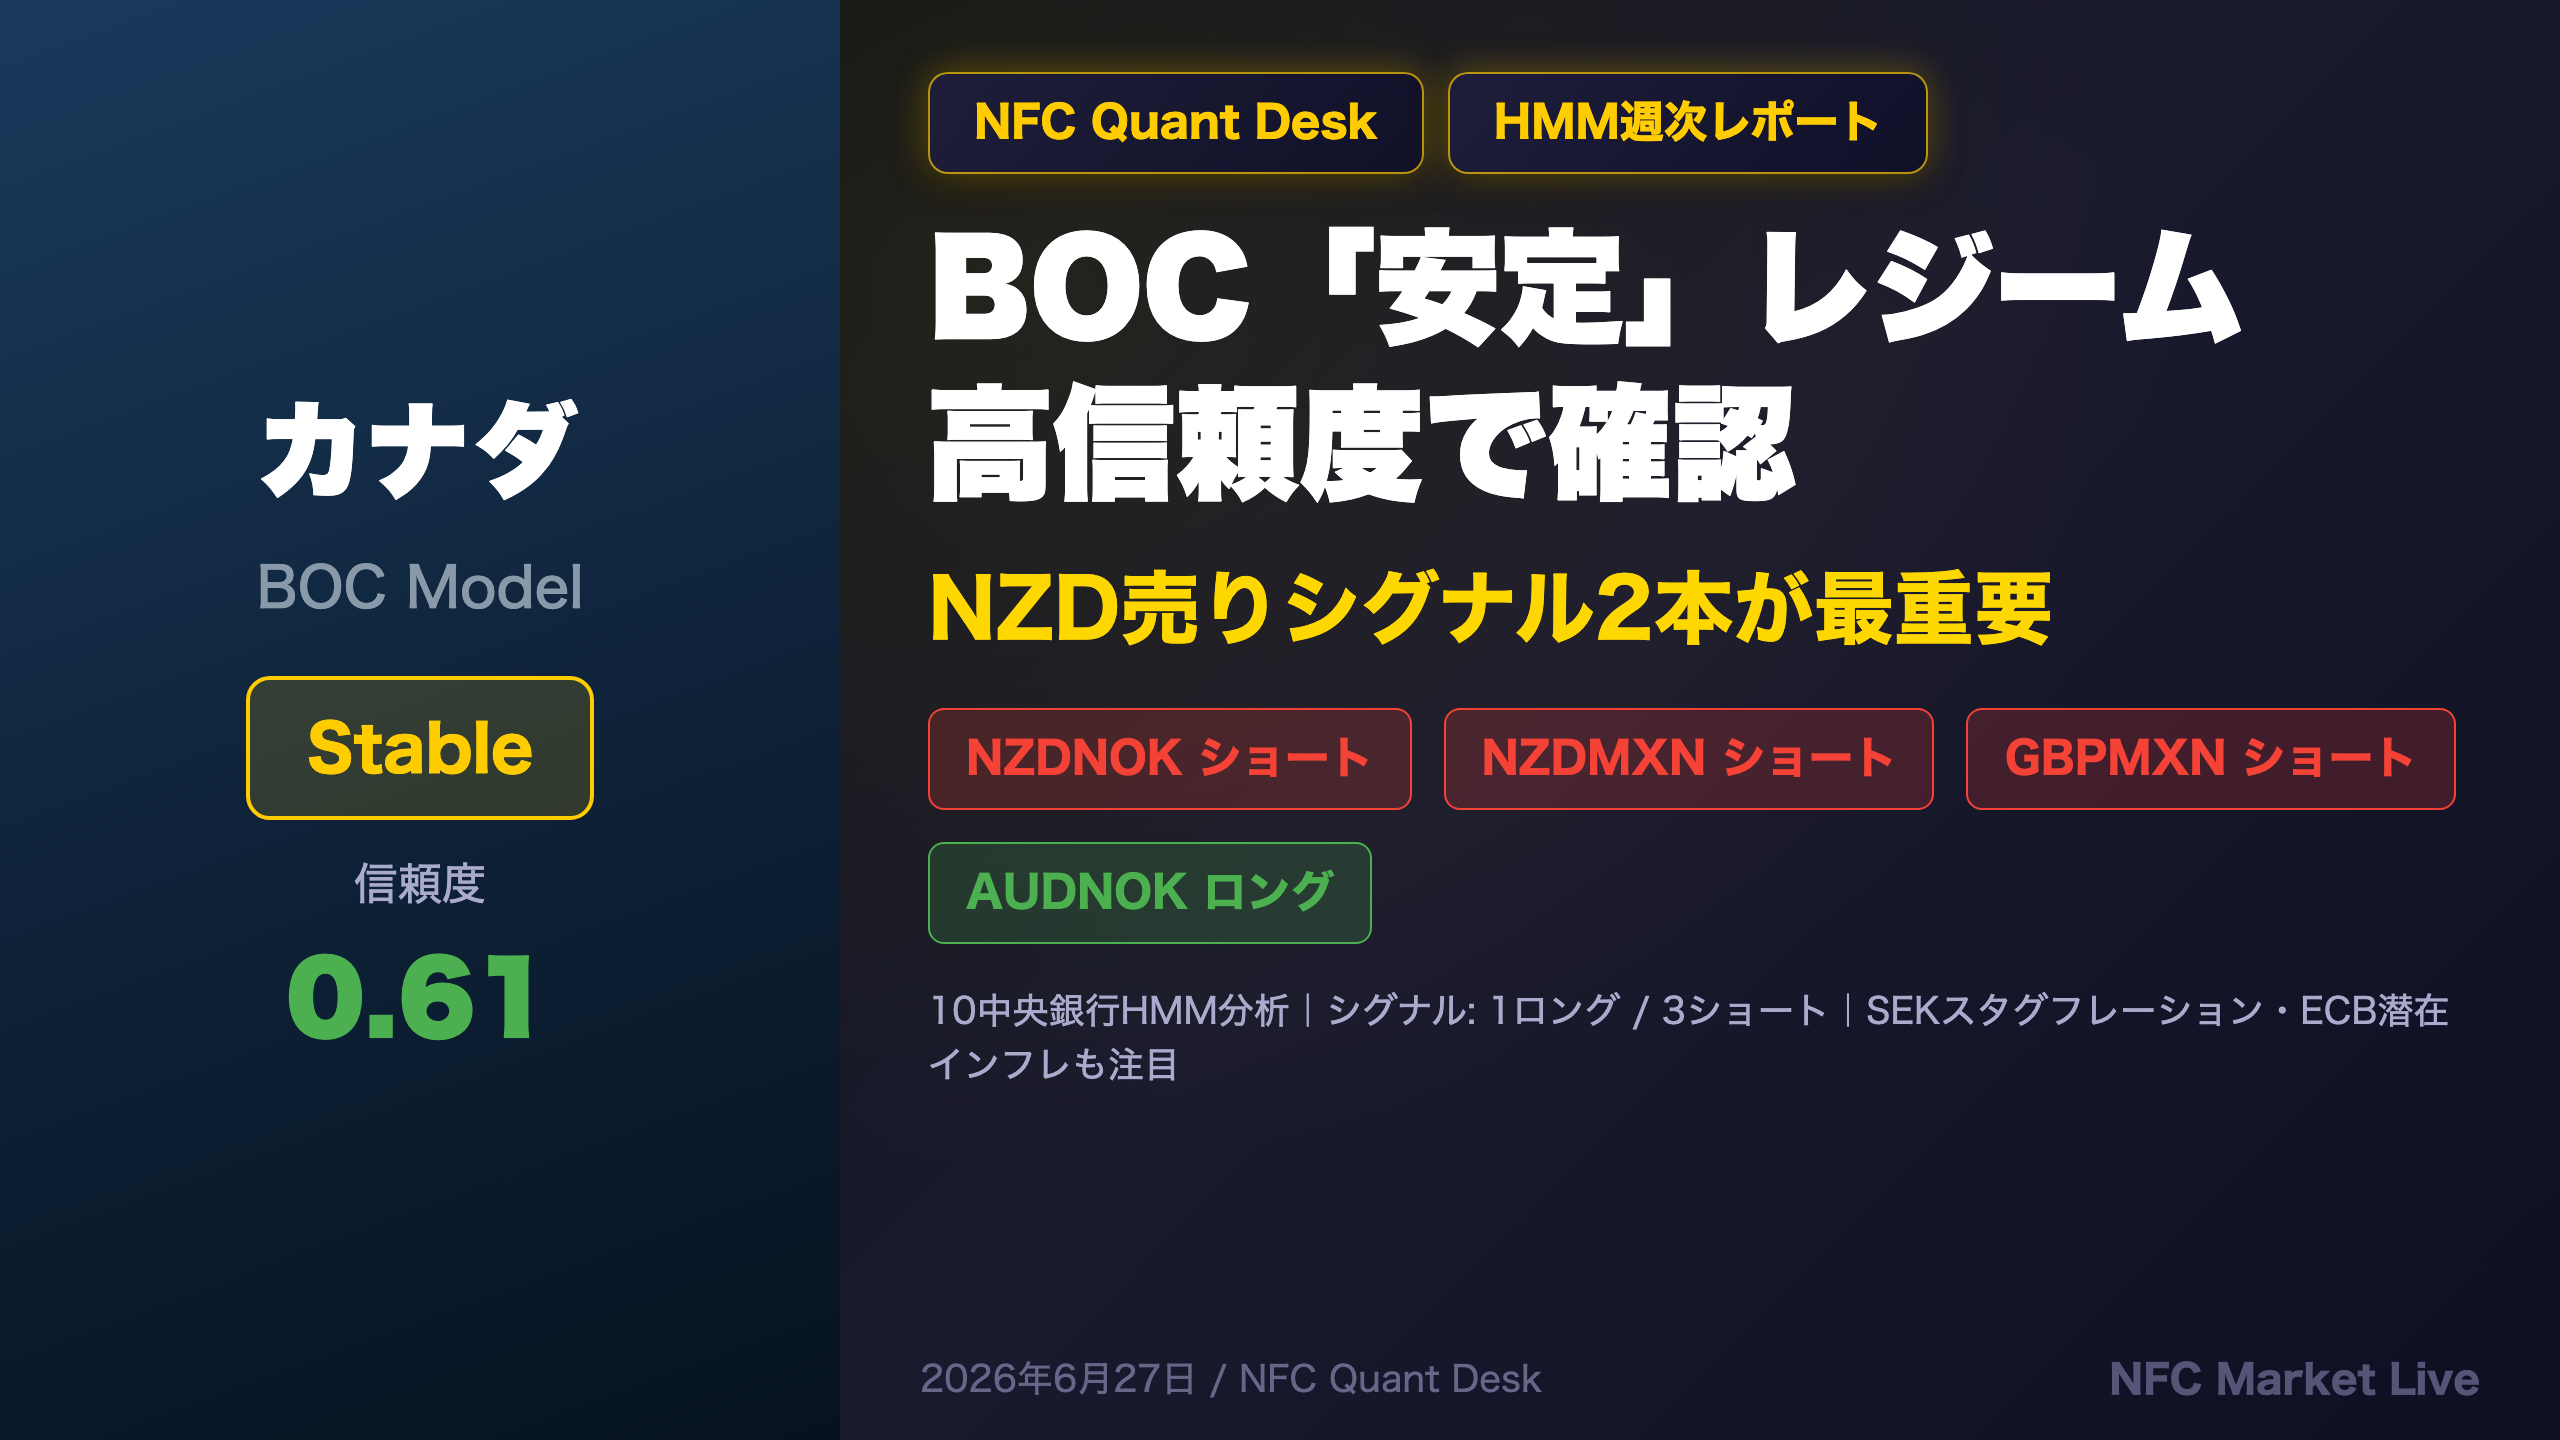
NFC Quant Desk breaks down this week’s HMM (Hidden Markov Model) regime analysis across 10 central bank models. The headline: BOC reaches high-confidence ‘Stable’ regime (conf=0.61), the only model with strong conviction this week. Meanwhile, RBNZ’s QE Easing vs NOK/MXN Hawkish divergence generates two strong NZD short signals. We also cover SEK Stagflation, ECB Latent Inflation, and where uncertainty is highest. Full signal breakdown, week-over-week comparison, and macro implications for FX traders.
The Ultimate Summary|今週のHMMレジーム総括
This Week’s HMM Regime Environment: BOC as the Sole High-Confidence Anchor
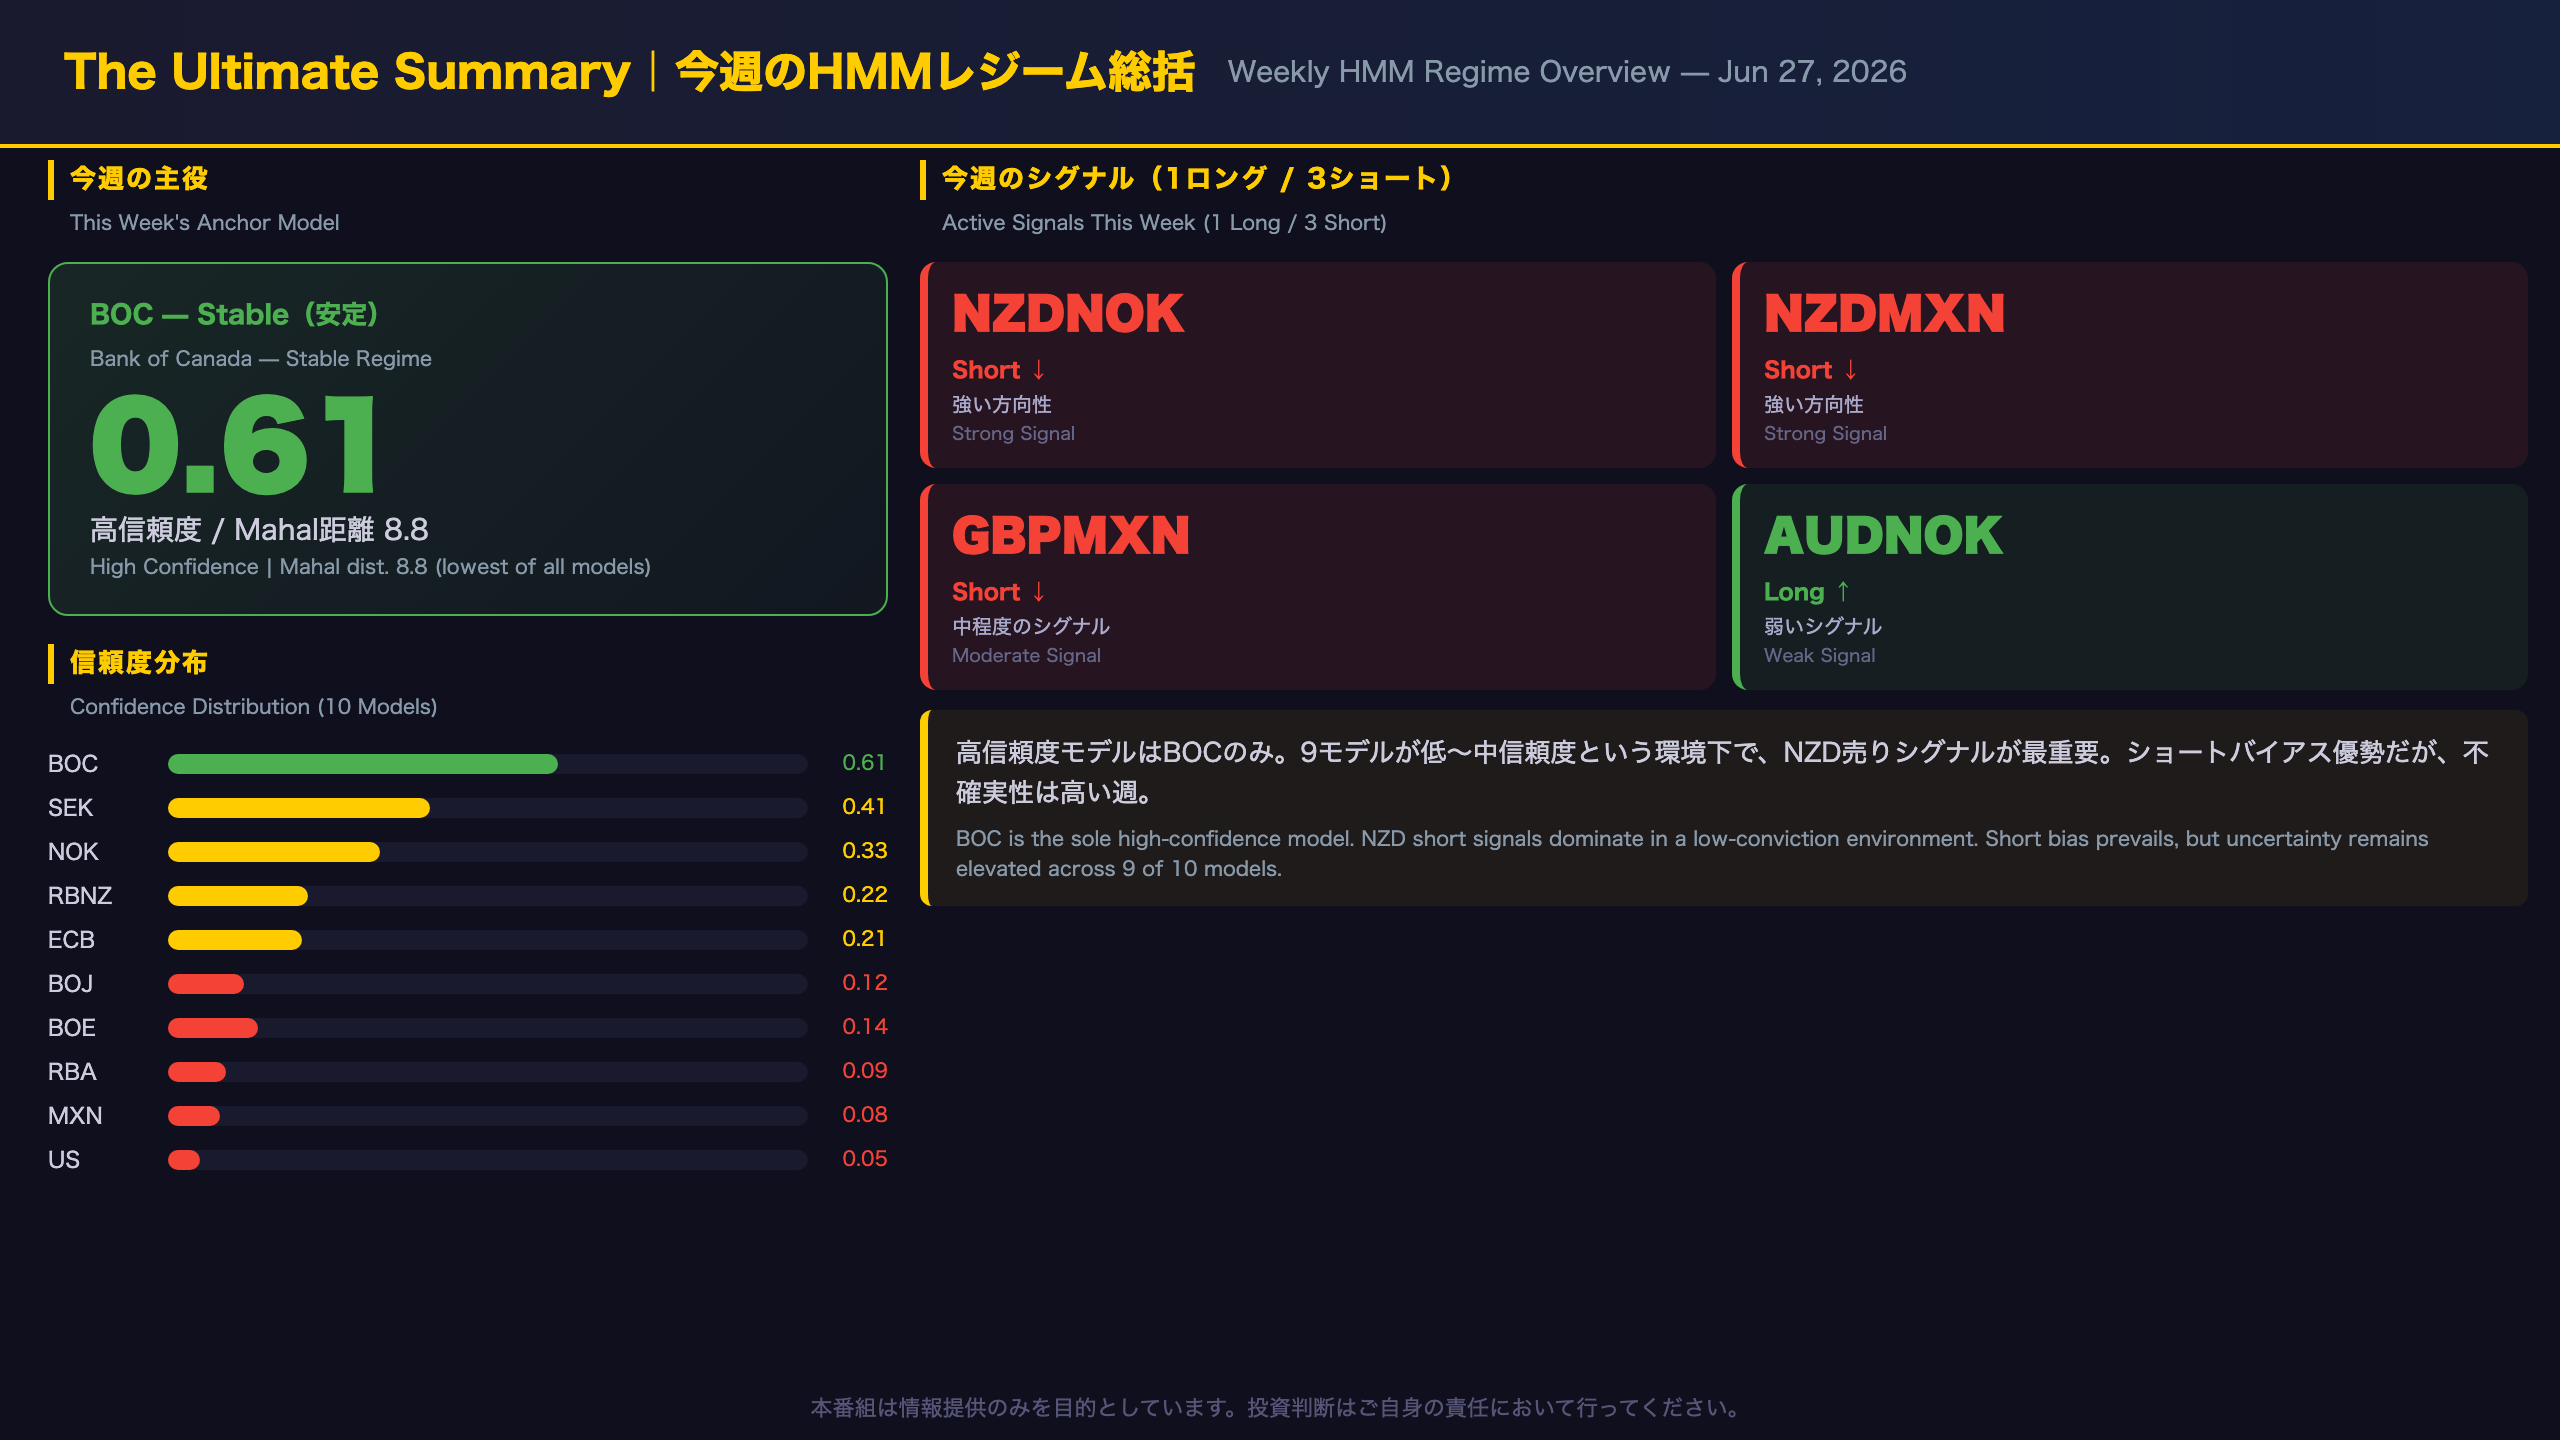
The NFC Quant Desk weekly report dated June 27, 2026 presents a striking asymmetry: of ten central bank HMM (Hidden Markov Model) models, only the Bank of Canada has reached high-confidence regime status.
What is HMM Regime Analysis?
HMM (Hidden Markov Model) regime analysis classifies each central bank’s policy environment into discrete “regimes” (e.g., Hawkish, Easing, Stable) based on macroeconomic data. The Mahalanobis distance measures how far the current data point sits from the regime’s centroid — the further away, the lower the confidence that the model’s regime label is reliable. A confidence score near 1.0 means the model is highly certain about the current regime; near 0.0 means the data is ambiguous.
Confidence Distribution This Week
| Confidence Tier | Count | Key Models |
|---|---|---|
| High (≥0.50) | 1 | BOC (0.61) |
| Medium (0.20–0.49) | 4 | SEK (0.41), NOK (0.33), RBNZ (0.22), ECB (0.21) |
| Low (<0.20) | 5 | US (0.05), MXN (0.08), RBA (0.09), BOE (0.14), BOJ (0.12) |
Signal Summary
Four FX pairs carry active signals this week: three shorts and one long. The directional skew toward shorts is notable. The two strongest signals — NZDNOK and NZDMXN — are both driven by the same structural divergence: RBNZ in QE Easing vs. NOK/MXN in Hawkish regimes.
Week-over-Week Comparison
Comparing this week’s data with the prior week reveals no change in regime labels, confidence scores, or signal composition. This continuity suggests the current regime structure is persistent, though it also raises the question of whether the models have fully absorbed the latest macro data releases.
Bottom Line
BOC’s high-confidence Stable regime is the week’s clearest structural signal. NZD short signals carry genuine policy divergence logic. However, with nine models in low-to-medium confidence territory, the overall environment warrants caution on position sizing.
今週の主役:BOC「Stable」レジームの経済的意味
Deep Dive: BOC ‘Stable’ Regime and the Significance of Mahal Distance 8.8
Understanding Mahalanobis Distance in HMM Regime Analysis
In Hidden Markov Model (HMM) regime analysis, the Mahalanobis distance measures how far the current multivariate observation sits from the centroid (mean vector) of the assigned regime. Unlike Euclidean distance, it accounts for the covariance structure of the data — making it a more statistically rigorous measure of “how typical” the current state is for a given regime. A lower distance means higher confidence; a higher distance signals that the current data is atypical for the assigned regime.
BOC’s Position This Week
| Metric | BOC | 2nd Best (SEK) | Furthest (ECB) |
|---|---|---|---|
| Mahal Distance | 8.8 | 13.3 | 70.6 |
| Confidence | 0.61 | 0.41 | 0.21 |
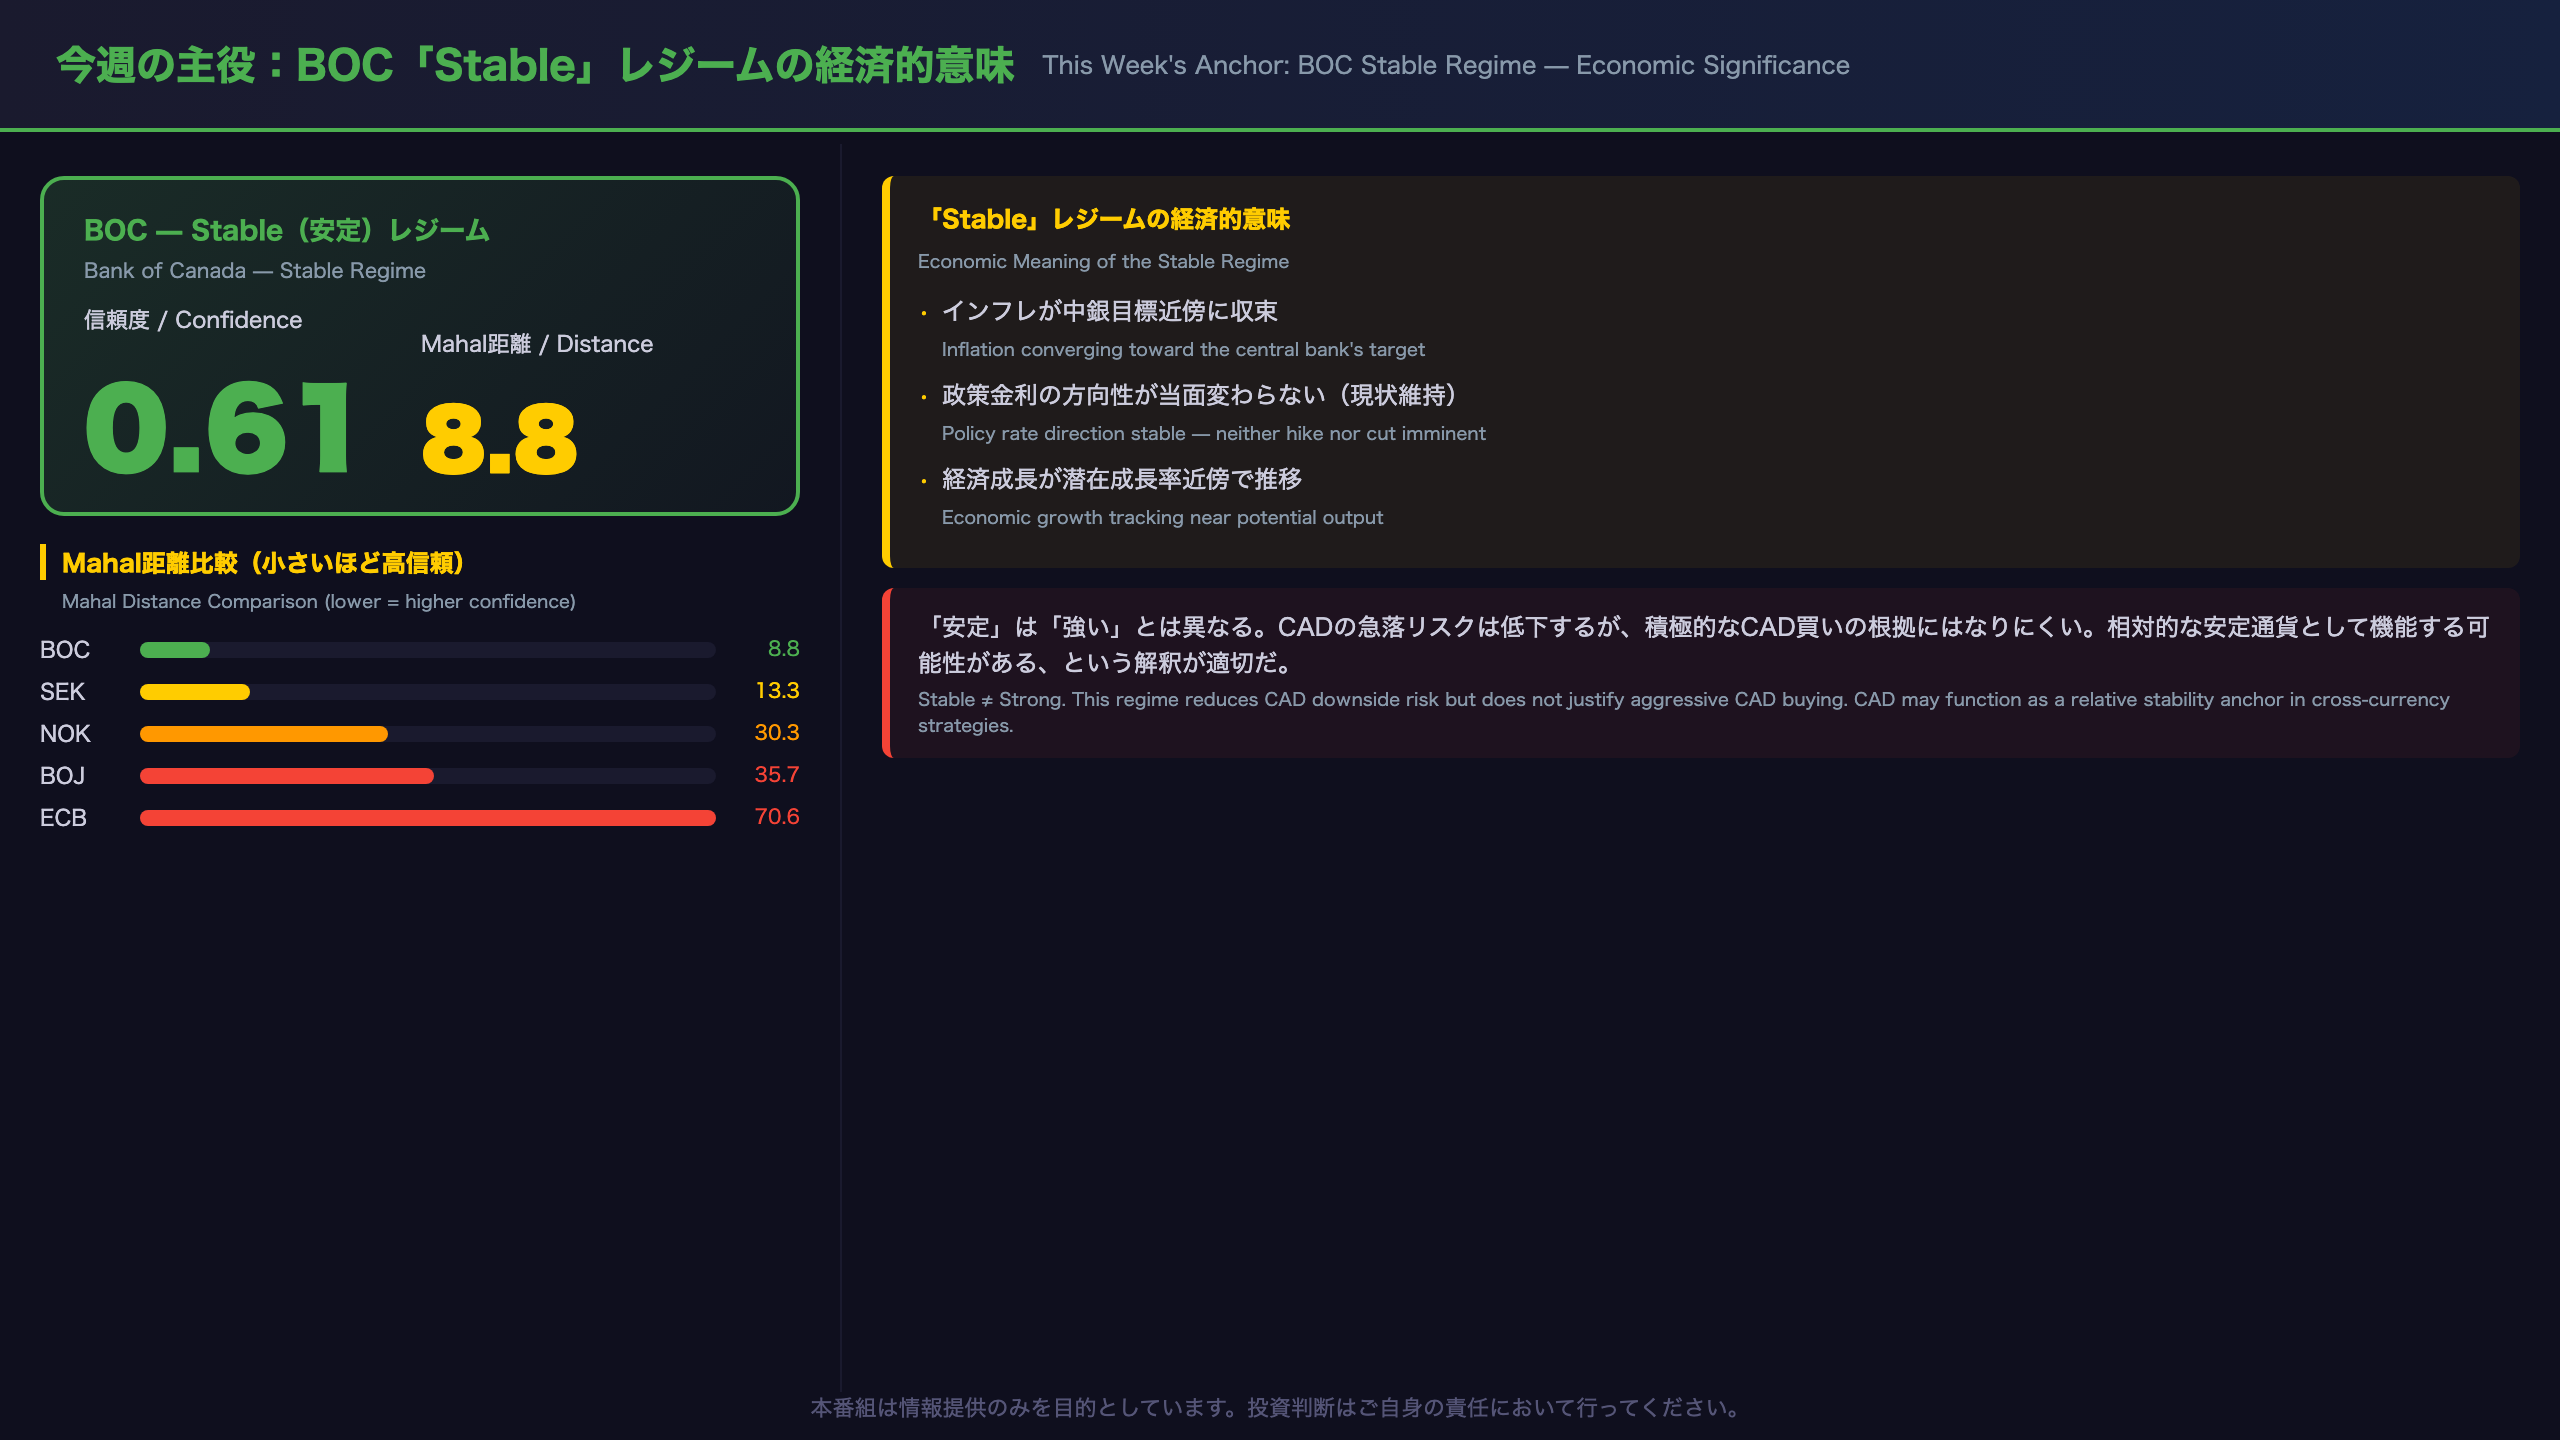
BOC’s Mahal distance of 8.8 is the lowest of all ten models — roughly 1.5x lower than SEK and 8x lower than ECB. This means the Bank of Canada’s current macro data profile is the closest to a “textbook” regime state in the entire model universe.
What Does ‘Stable’ Mean for CAD?
The Stable regime typically implies:
– Inflation converging toward the Bank of Canada’s 2% target
– No imminent policy rate shift expected by the market
– Economic growth tracking near potential
For FX positioning, this suggests CAD is less likely to be disrupted by surprise policy announcements. However, Stable ≠ Strong. This regime does not provide a basis for aggressively buying CAD; rather, it positions CAD as a relative stability anchor in cross-currency strategies.
Caveat
The regime label is derived from historical pattern-matching in the HMM model. It reflects the current data’s resemblance to past Stable periods — it does not forecast future policy decisions. Any unexpected macro shock (e.g., a sharp drop in oil prices, which is a key driver of the Canadian economy) could shift the regime rapidly.
シグナルの構造:NZD売りを生む政策乖離のメカニズム
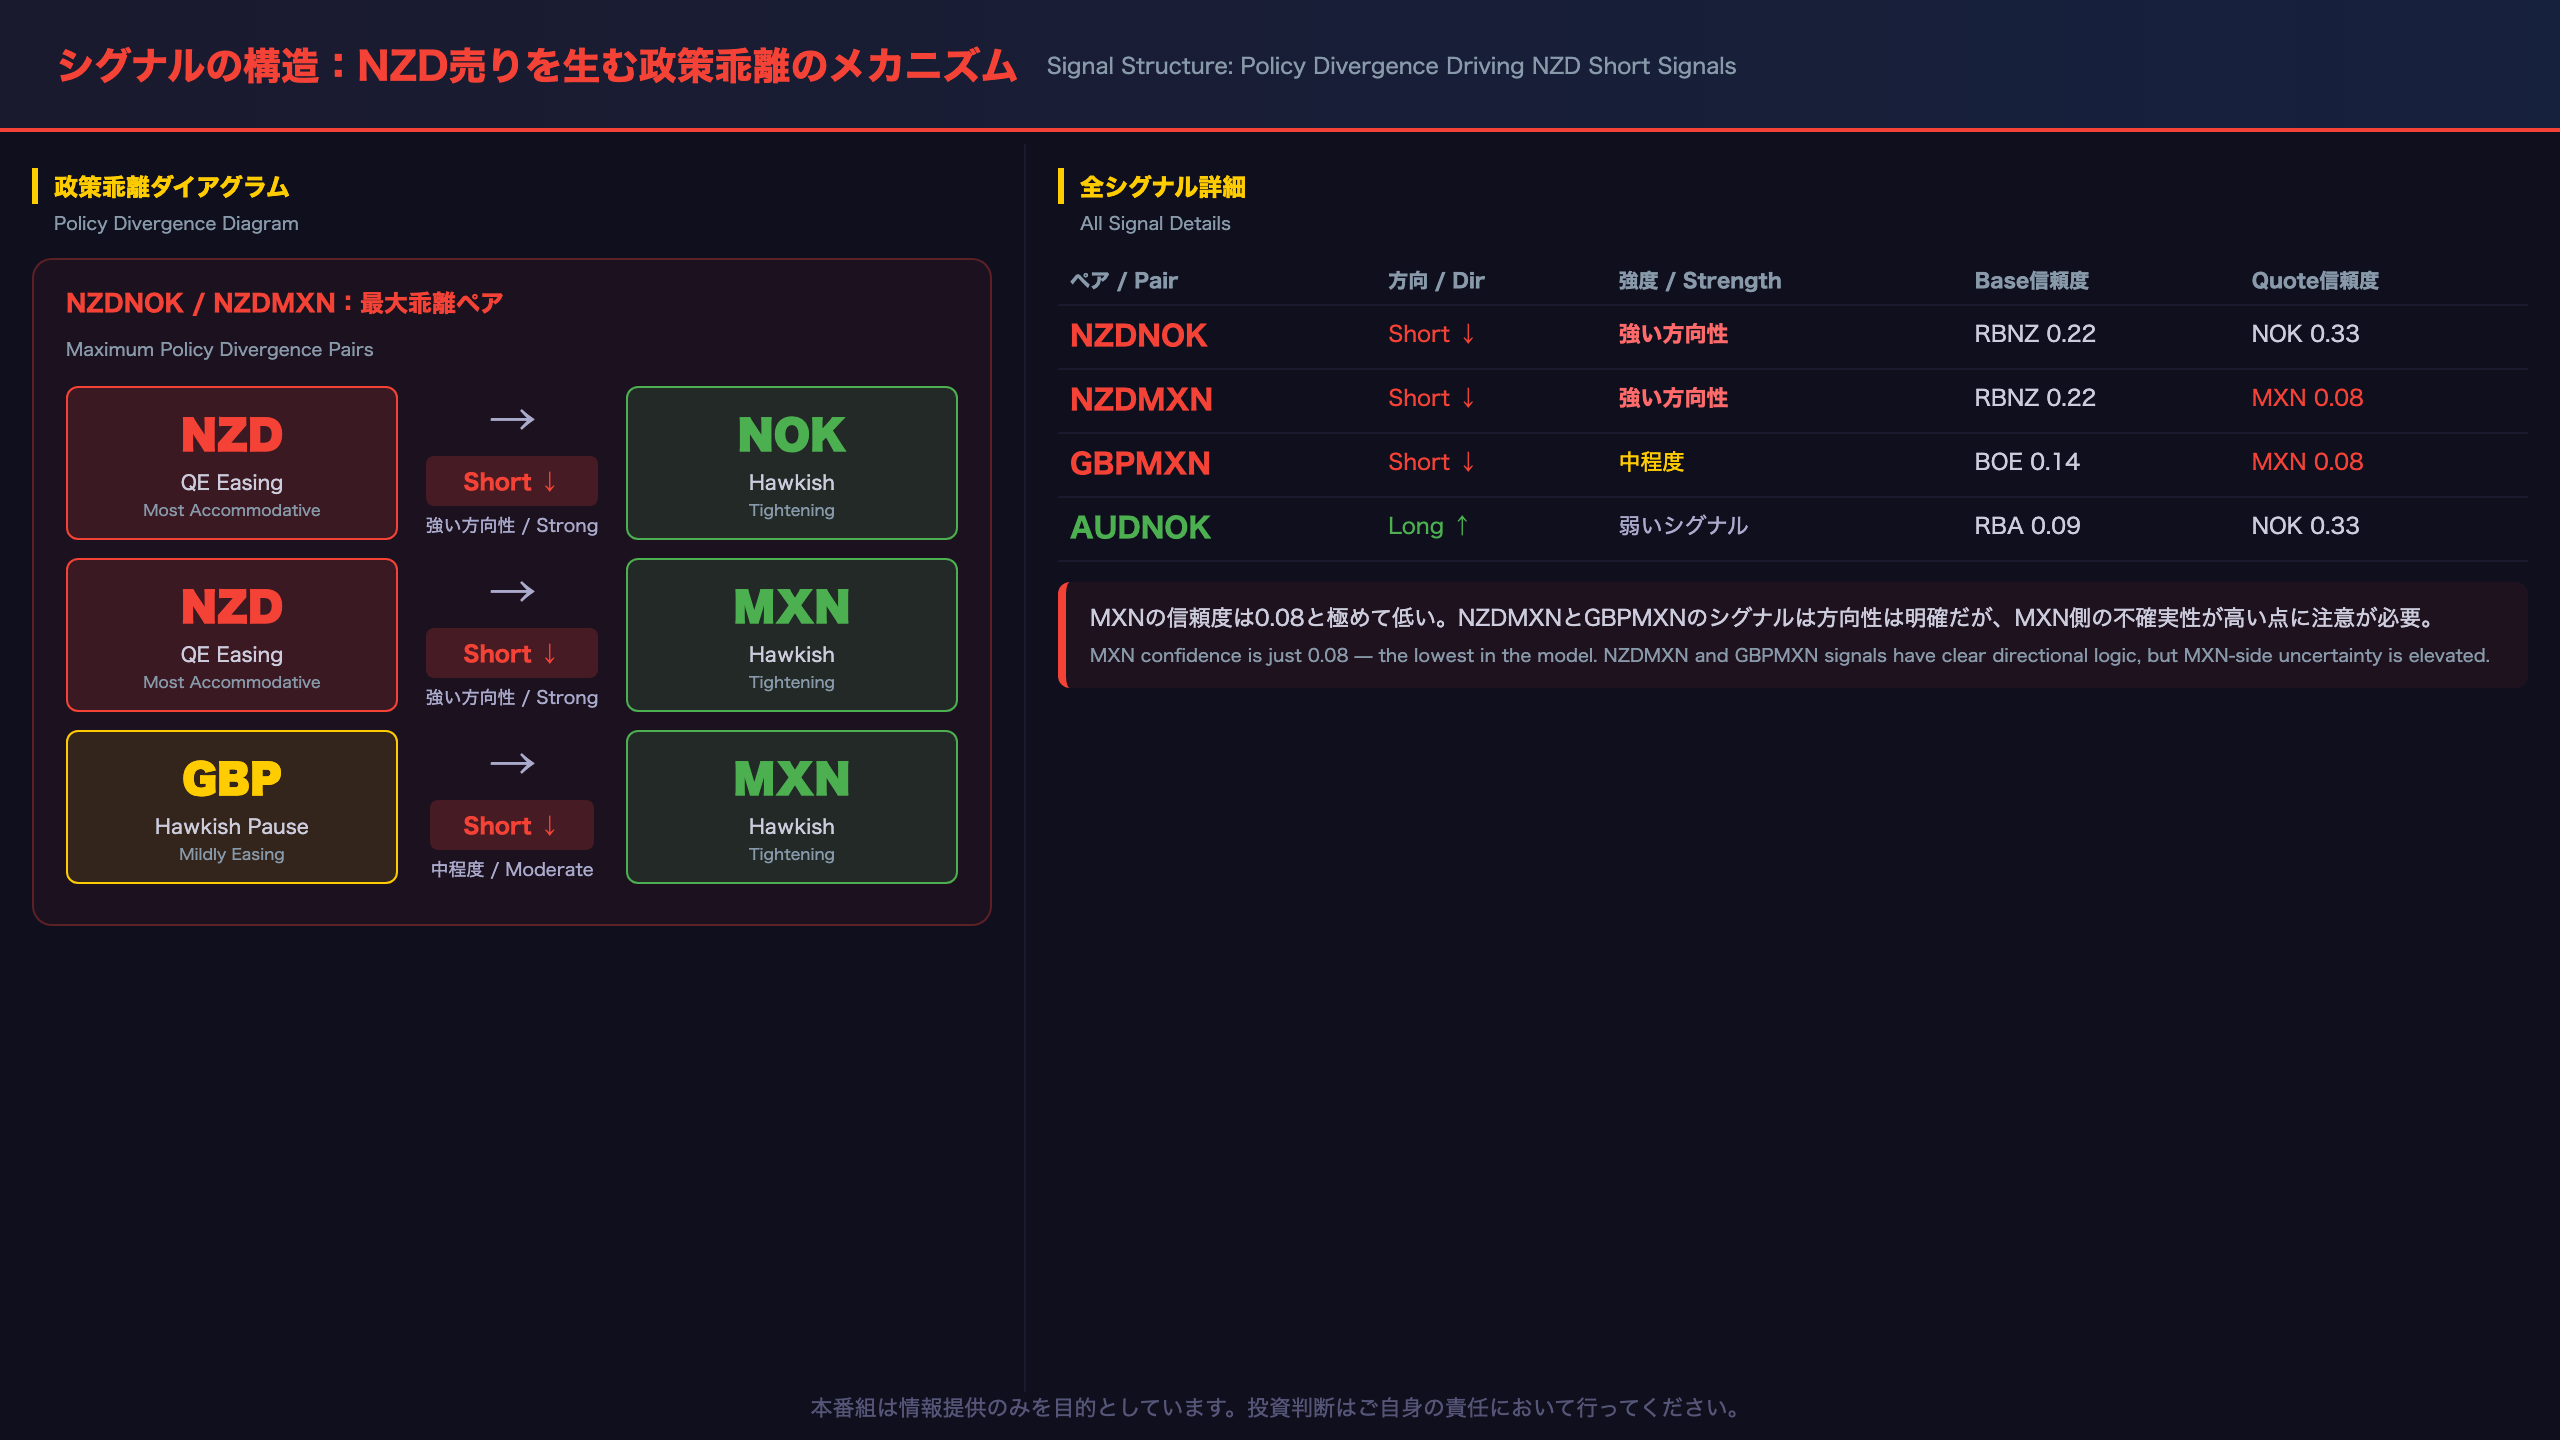
Structural Logic Behind NZD Short Signals: Reading Policy Divergence Scores
How Signals Are Generated
NFC Quant Desk’s HMM model quantifies the “policy stance gap” between the Base currency’s regime and the Quote currency’s regime. The larger the gap, the stronger the signal. This week, NZDNOK and NZDMXN represent the maximum policy divergence in the current model universe.
Policy Stance Comparison
| Currency | Regime | Policy Stance | Confidence |
|---|---|---|---|
| NZD (RBNZ) | QE Easing | Most accommodative | 0.22 (medium) |
| NOK | Hawkish | Tightening-oriented | 0.33 (medium) |
| MXN | Hawkish | Tightening-oriented | 0.08 (low) |
| GBP (BOE) | Hawkish Pause | Mildly accommodative shift | 0.14 (low) |
What Does ‘QE Easing’ Mean for RBNZ?
The Reserve Bank of New Zealand’s QE Easing regime label suggests a policy stance that goes beyond simple rate cut expectations — it implies a more actively accommodative posture, potentially including balance sheet expansion. This creates the widest policy divergence against Hawkish-labeled NOK and MXN in the current model set.
The Confidence Caveat
MXN’s confidence score of just 0.08 is a critical caveat. With a Mahal distance of 38.4, the Hawkish label for MXN is not strongly confirmed by the underlying data. The NZDMXN short signal has a clear directional basis, but the MXN side carries significant uncertainty.
AUDNOK Long: A Weak Signal from Same-Regime Divergence
The AUDNOK long signal emerges from a subtle difference between RBA (Hawkish) and NOK (Hawkish) — two models sharing the same regime label. Same-regime signals are inherently weak and are best treated as supplementary positions rather than primary directional bets.
不確実性の地図:どこに注意が必要か
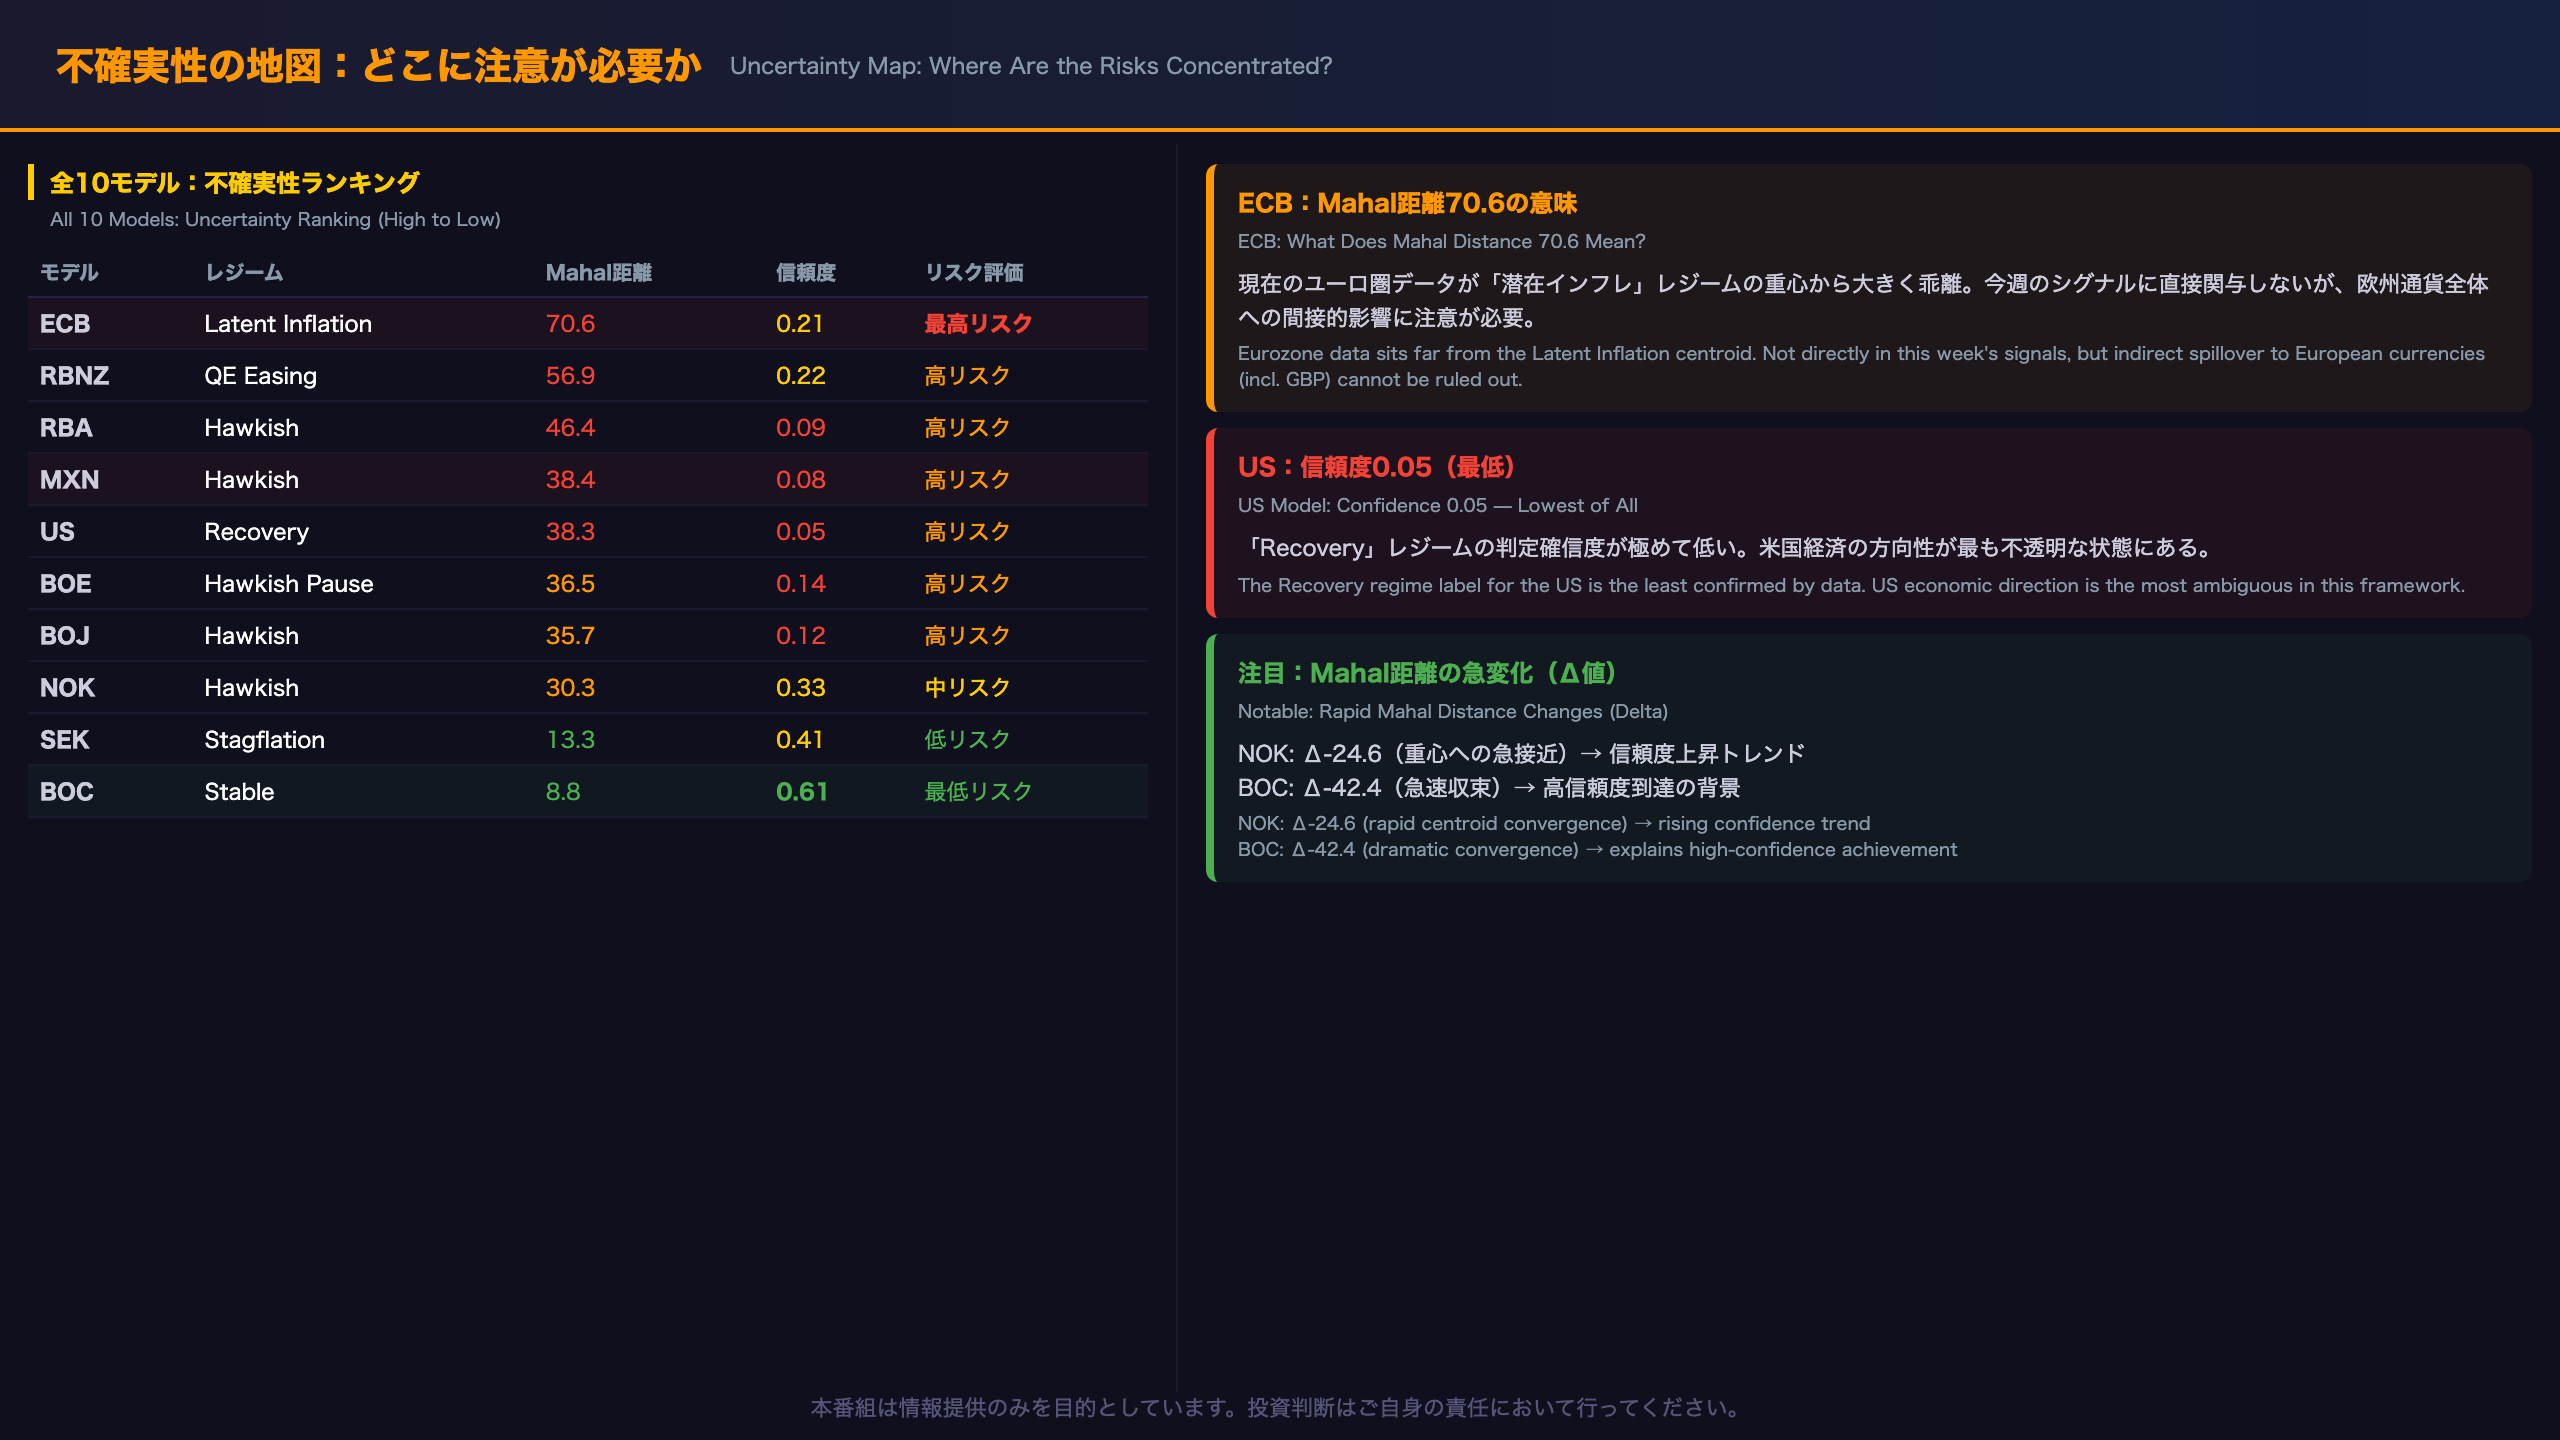
Uncertainty Map: Full Model Comparison of Mahal Distance and Confidence
Quantifying Uncertainty
In HMM regime analysis, uncertainty is primarily assessed along two axes: Mahalanobis distance and confidence score. The higher the distance and the lower the confidence, the less reliable the regime label. This week’s full model ranking by uncertainty:
| Model | Mahal Dist | Confidence | Risk Level |
|---|---|---|---|
| ECB | 70.6 | 0.21 | Highest |
| RBNZ | 56.9 | 0.22 | High |
| RBA | 46.4 | 0.09 | High |
| MXN | 38.4 | 0.08 | High |
| US | 38.3 | 0.05 | High |
| BOE | 36.5 | 0.14 | High |
| BOJ | 35.7 | 0.12 | High |
| NOK | 30.3 | 0.33 | Medium |
| SEK | 13.3 | 0.41 | Low |
| BOC | 8.8 | 0.61 | Lowest |
ECB’s ‘Latent Inflation’ Regime: The Highest-Distance Model
ECB’s Mahal distance of 70.6 stands out dramatically. The Latent Inflation regime label suggests that structural inflationary pressures may be building beneath the surface, even if headline CPI appears contained. The high distance means the current eurozone data profile is atypical for this regime — making the label less reliable and the outlook more uncertain.
SEK Stagflation: A Notable Regime
SEK (Swedish Krona) is in a Stagflation regime with a confidence of 0.41 — the second-highest in the model set. While SEK is not directly involved in this week’s signals, a stagflationary environment for Sweden implies a challenging backdrop: weak growth combined with persistent inflation, limiting the Riksbank’s room to maneuver.
Delta Values: Mahal Distance Trends
The delta values in the report show week-over-week changes in Mahal distance. NOK’s Δ-24.6 is the most notable — a sharp move toward the regime centroid, suggesting the NOK model is gaining confidence rapidly. BOC’s Δ-42.4 similarly reflects a dramatic convergence toward its centroid, which explains why it has reached high-confidence status.
前週比較:レジームの変化・継続・消滅
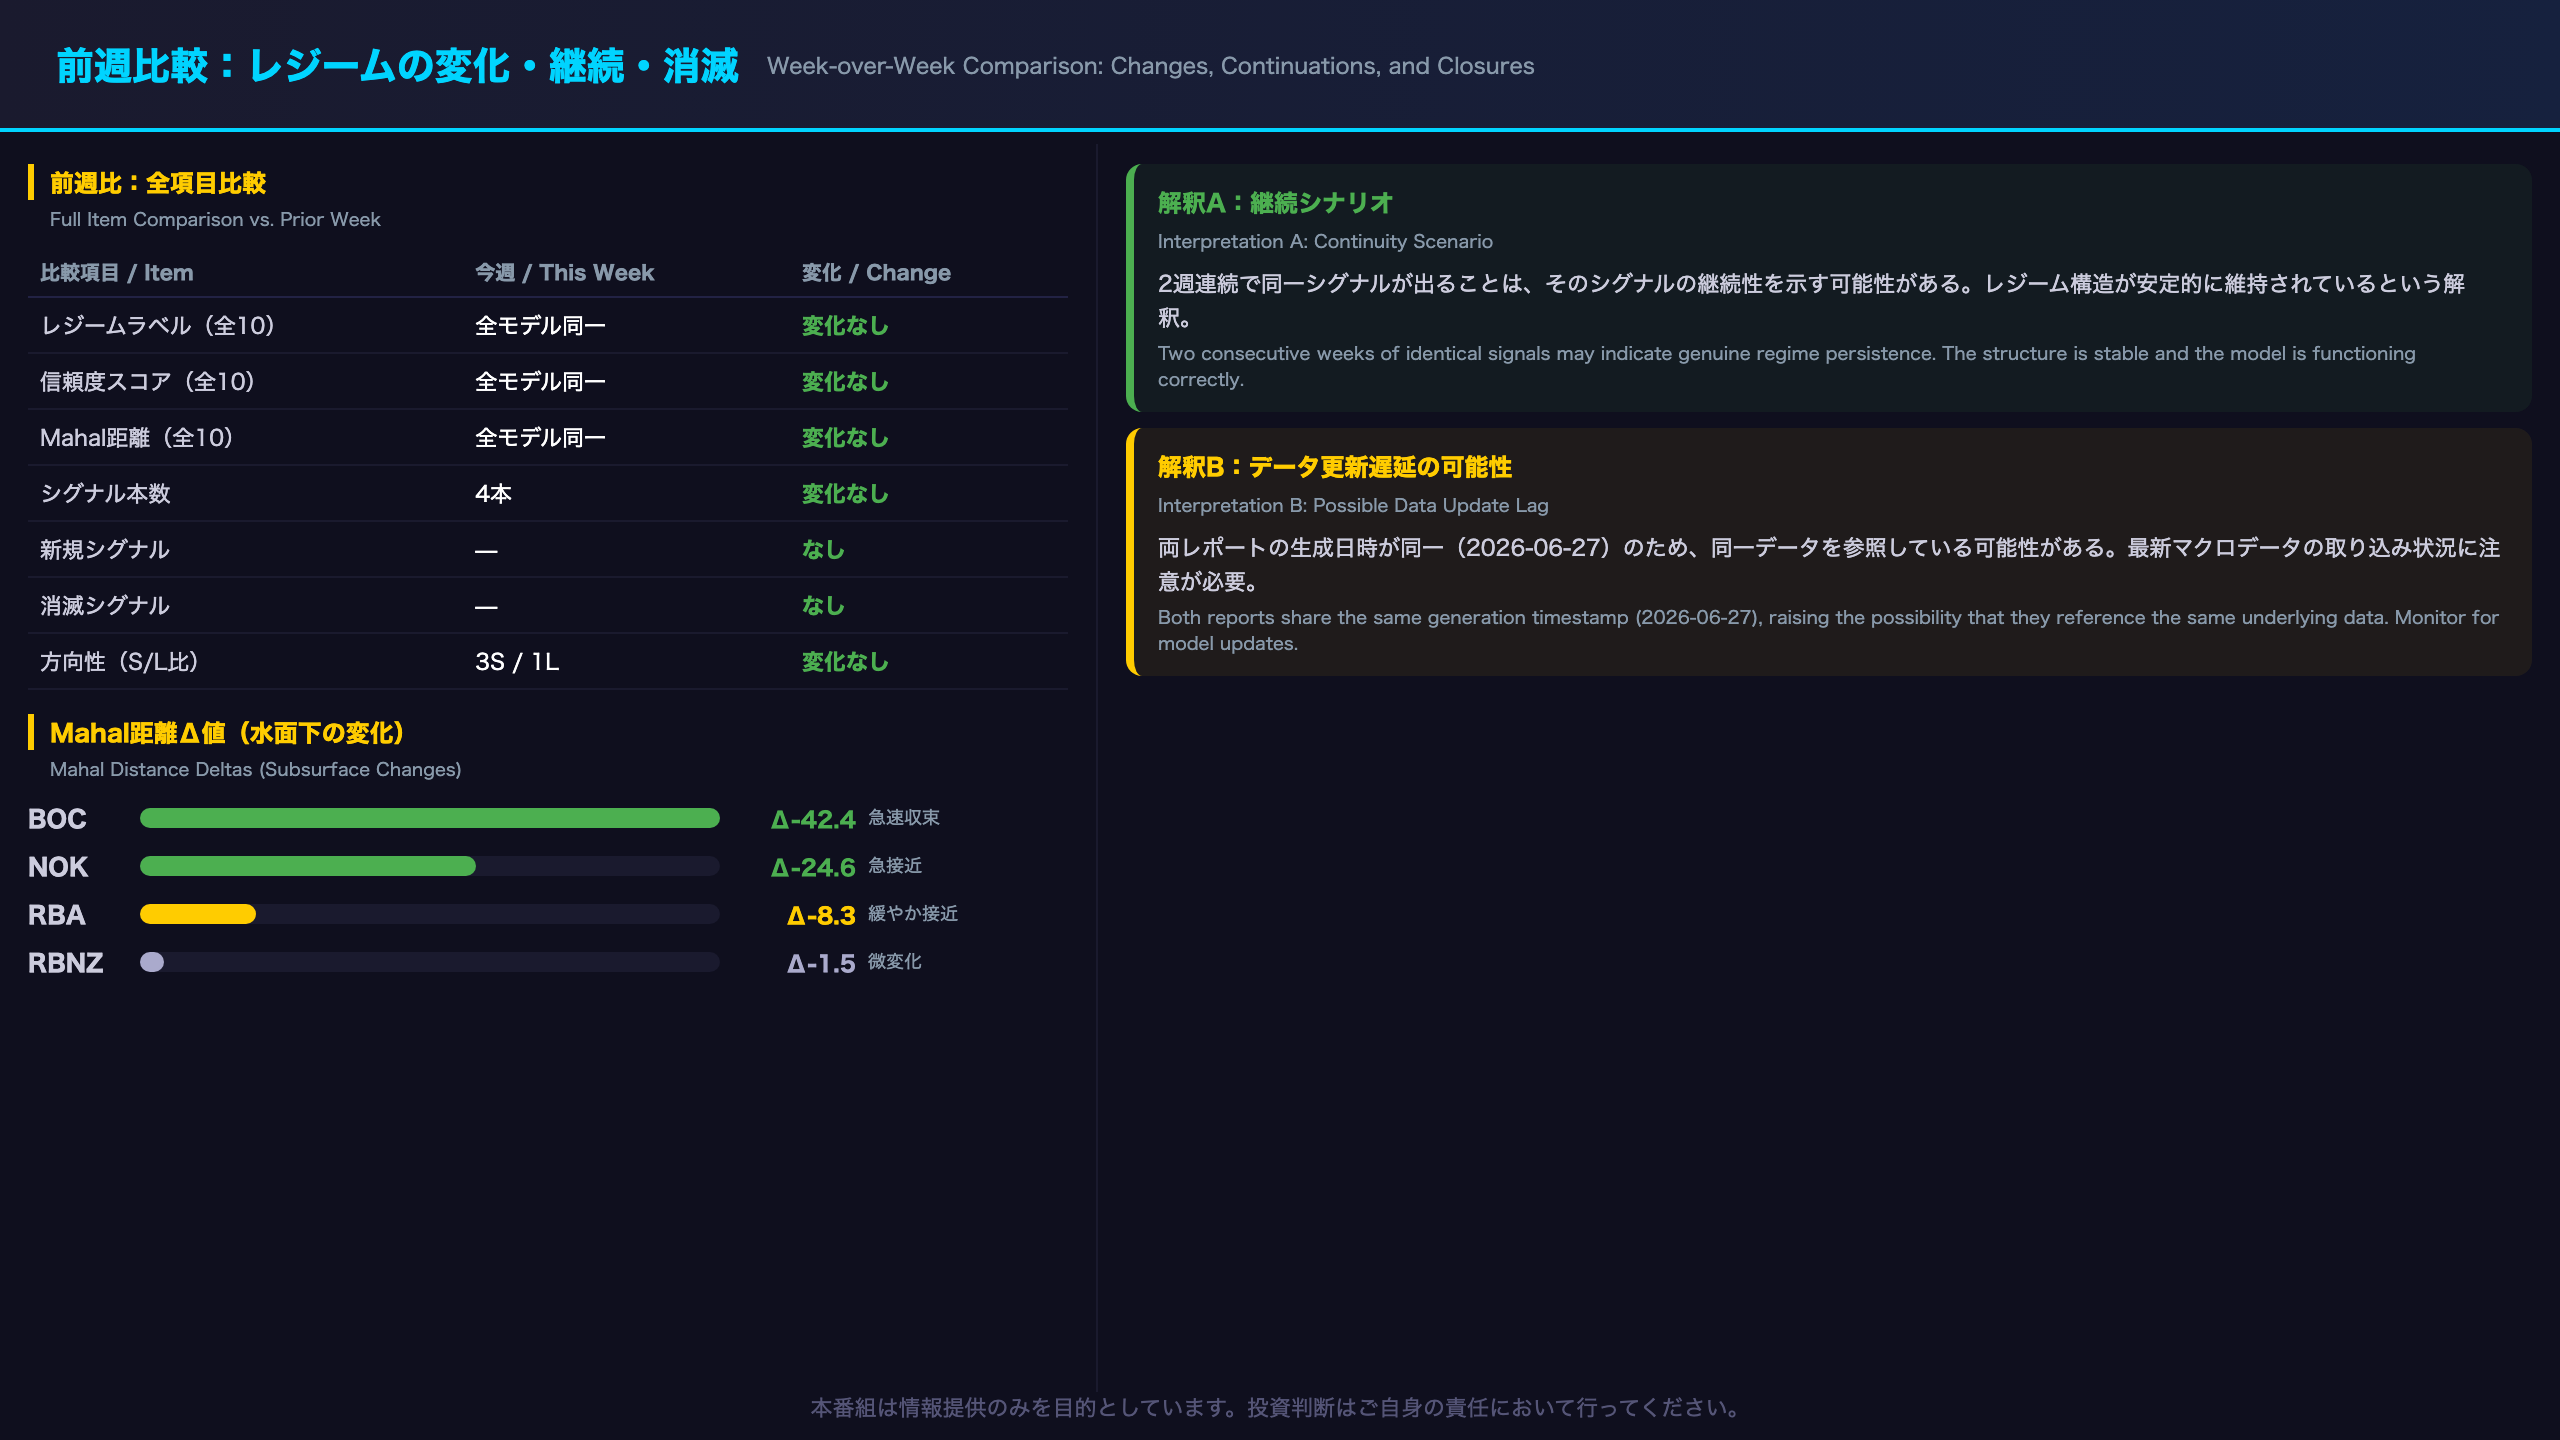
Week-over-Week Comparison: What ‘No Change’ Actually Means
Comparison Results
A full item-by-item comparison of this week’s and last week’s reports reveals complete identity across all fields.
| Comparison Item | Change |
|---|---|
| Regime labels (all 10 models) | None |
| Confidence scores (all 10 models) | None |
| Mahal distances (all 10 models) | None |
| Signal list (4 pairs) | None |
| Signal direction (3 short / 1 long) | None |
Two Interpretations of ‘No Change’
Interpretation A (Continuity Scenario): The current regime structure is genuinely stable and the model is functioning correctly. Two consecutive weeks of identical signals may actually strengthen the conviction behind those signals — persistence can be a form of confirmation.
Interpretation B (Data Update Lag): There is a possibility that the model has not yet incorporated the latest macro data releases. Given that both reports share the same generation timestamp (2026-06-27), this may reflect a data synchronization issue rather than true week-over-week continuity.
Delta Values: Subsurface Changes
While regime labels are unchanged, the Mahal distance delta values reveal important subsurface dynamics:
- NOK: Δ-24.6 — Rapid convergence toward the Hawkish centroid, suggesting the NOK model is gaining confidence
- BOC: Δ-42.4 — Dramatic convergence, explaining why BOC has reached high-confidence status
- RBA: Δ-8.3 — Gradual approach toward the Hawkish centroid
These delta values suggest that even without regime label changes, the underlying model confidence is evolving — particularly for NOK and BOC.
Caveat on Delta Interpretation
Delta values are based on single-week data. Confirming a trend requires multiple consecutive weeks of observation. The Δ values should be treated as directional indicators, not confirmed trends.
注目モデル深掘り:SEK「スタグフレーション」とECB「潜在インフレ」
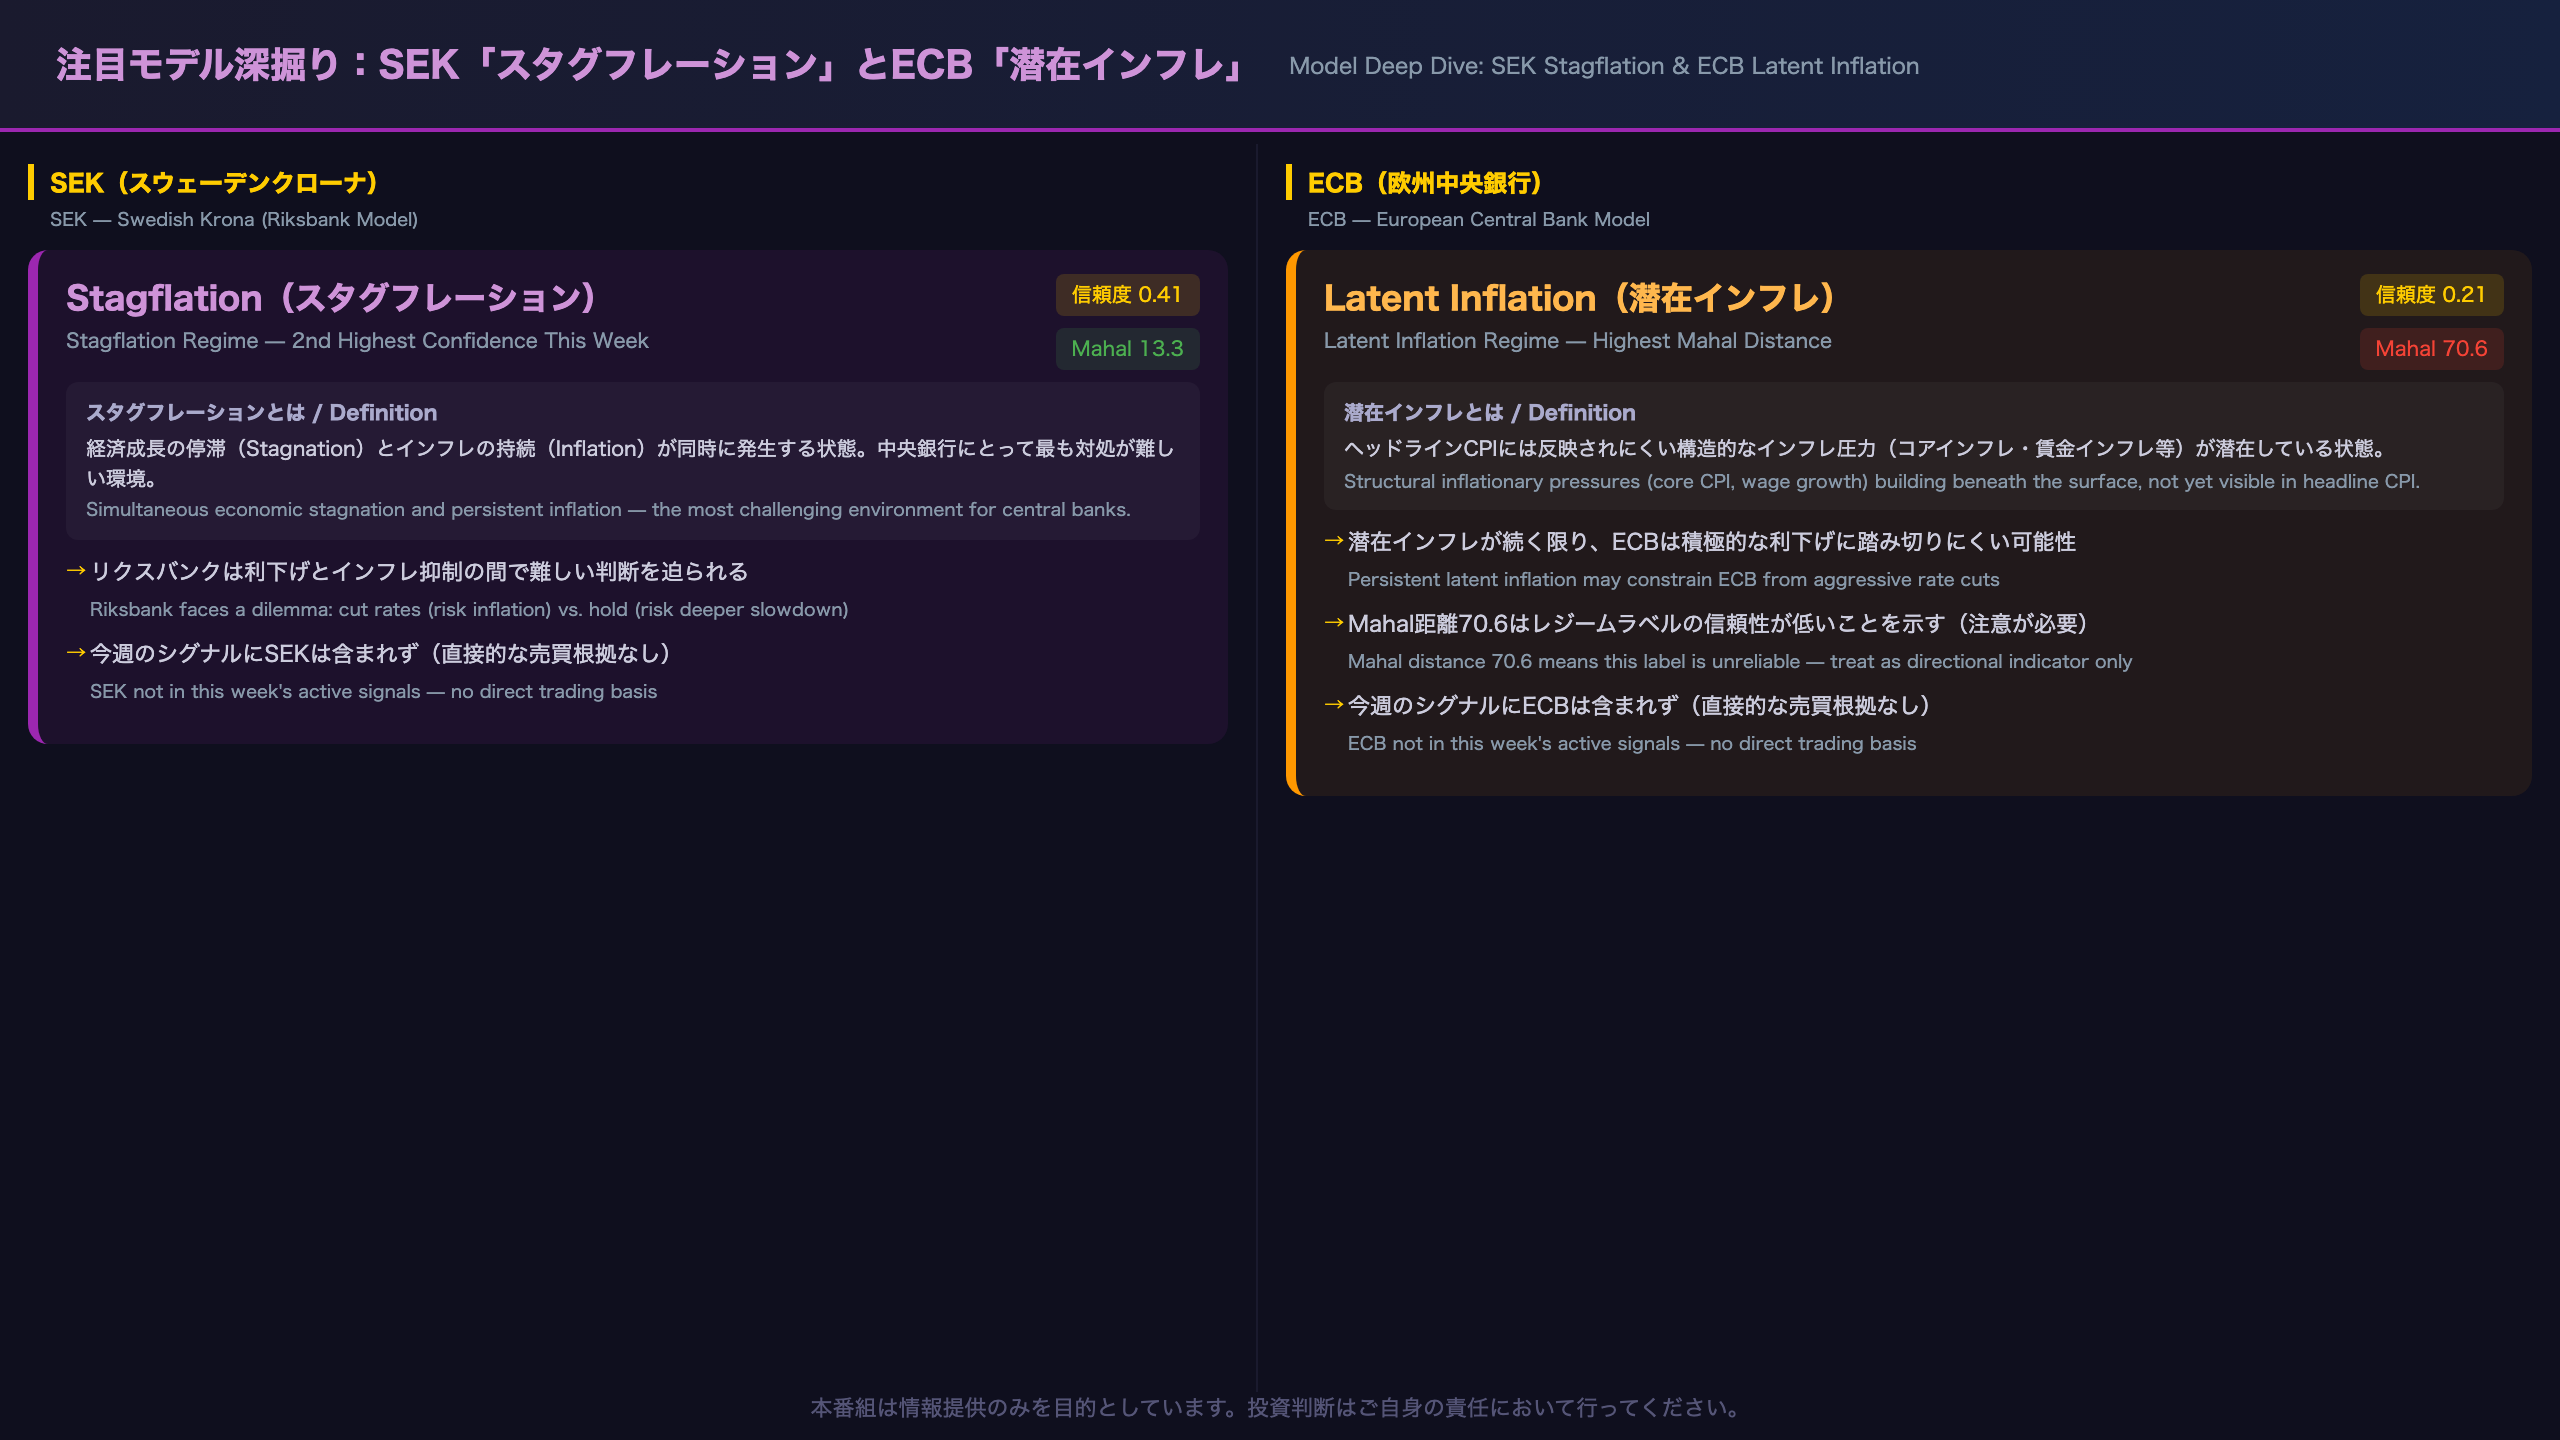
SEK Stagflation and ECB Latent Inflation: This Week’s Hidden Focal Points
SEK ‘Stagflation’ Regime: Details
The Swedish Krona (SEK) sits in a Stagflation regime this week with a confidence of 0.41 and Mahal distance of 13.3 — making it one of the more reliable regime assessments in the current model set.
What is Stagflation? Stagflation describes the simultaneous occurrence of economic stagnation and persistent inflation. It is one of the most challenging environments for central banks because the standard policy tools work in opposite directions: rate cuts stimulate growth but risk stoking inflation, while rate hikes combat inflation but deepen the growth slowdown.
Swedish Context: The Riksbank (Sweden’s central bank) entered a rate-cutting cycle in 2024. Cutting rates while inflation remains above target risks entrenching stagflationary dynamics. For SEK, a stagflationary environment typically creates dual selling pressure — from both growth concerns and inflation uncertainty.
Caveat: SEK is not in this week’s active signals. The above analysis is based on the regime label and general economic logic, not on a direct signal from the model.
ECB ‘Latent Inflation’ Regime: Details
ECB’s Latent Inflation regime carries the highest Mahal distance in the model set (70.6), making the label the least reliable. However, the directional implication is worth noting.
What is Latent Inflation? This regime suggests that structural inflationary pressures — such as core inflation, wage growth, or services inflation — may be building beneath the surface, even if headline CPI appears to be declining.
Implications for EUR: If latent inflation persists in the eurozone, the ECB may be constrained from aggressive rate cuts, which could provide a floor for EUR. However, given the high Mahal distance, this interpretation should be treated as a possibility rather than a confirmed signal.
Key Caveat: A Mahal distance of 70.6 means the current eurozone data is highly atypical for the Latent Inflation regime. The label may be transitioning — the next few weeks of data will be critical for confirming or refuting this regime assignment.
インプリケーション:市場への含意と今後の注目点
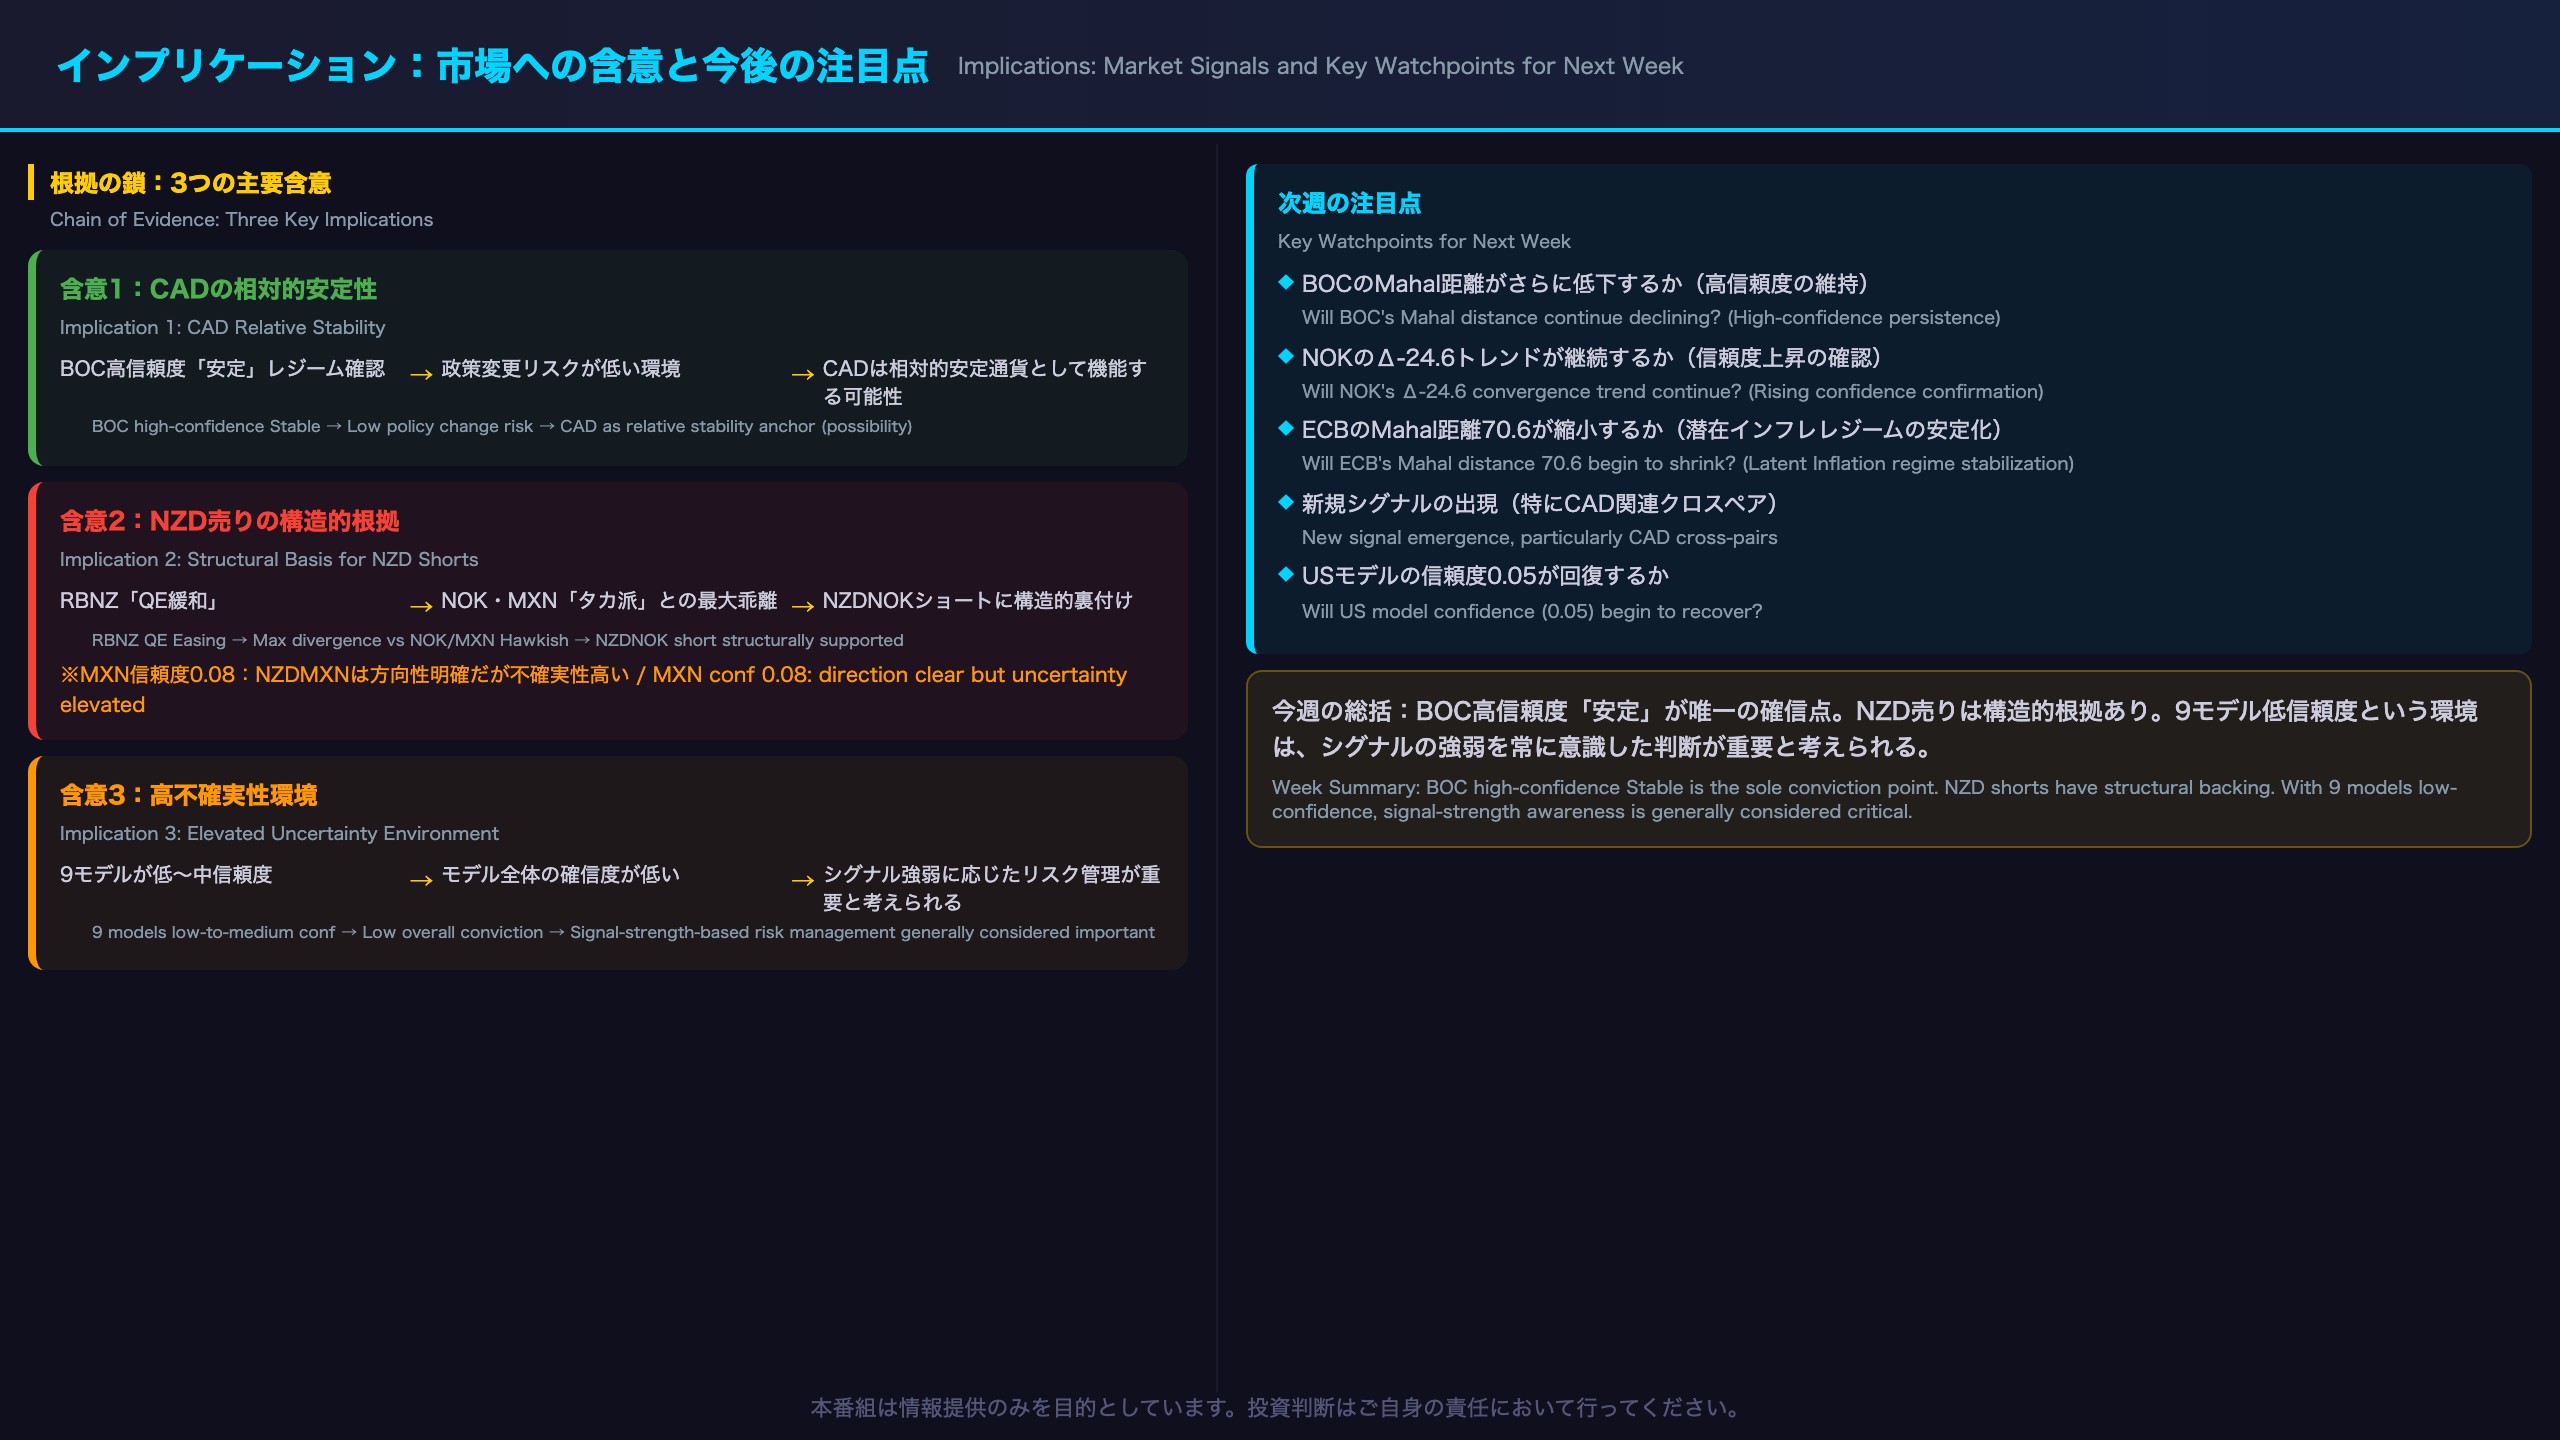
Market Implications: The ‘Chain of Evidence’ Framework
Implication 1: CAD Relative Stability
Chain of Evidence:
“BOC confidence 0.61, Mahal distance 8.8, Stable regime confirmed” → “Bank of Canada in an environment requiring no imminent policy change” → “CAD may function as a relative stability anchor, less susceptible to policy-driven shocks”
However, the Stable regime does not justify aggressive CAD buying. Determining CAD cross-pair direction requires comparing against the counterpart currency’s regime.
Implication 2: Structural Basis for NZD Shorts
Chain of Evidence (NOK side):
“RBNZ QE Easing (conf 0.22)” + “NOK Hawkish (conf 0.33)” → “Maximum-class policy stance divergence” → “NZDNOK short has structural underpinning”
Chain of Evidence (MXN side):
“RBNZ QE Easing (conf 0.22)” + “MXN Hawkish (conf 0.08)” → “Policy divergence is directionally clear, but MXN confidence is extremely low” → “NZDMXN short direction is clear, but MXN-side uncertainty is elevated”
Implication 3: Risk Management in a Low-Conviction Environment
With nine of ten models in low-to-medium confidence territory, the environment generally calls for careful calibration of position sizing according to signal strength. Treating strong signals (NZDNOK, NZDMXN) and weak signals (AUDNOK) equally would be inconsistent with the model’s design intent.
Key Watchpoints for Next Week
- Will BOC’s Mahal distance continue to decline? (Confirming high-confidence persistence)
- Will NOK’s Δ-24.6 trend continue? (Confirming rising confidence trajectory)
- Will ECB’s Mahal distance of 70.6 begin to shrink? (Stabilization of Latent Inflation regime)
- Will any new signals emerge, particularly CAD cross-pairs?
- Will the US model’s confidence (currently 0.05) begin to recover?
Disclaimer: This article is for informational purposes only. All investment decisions are made solely at your own risk.