📺 Watch the Full Video Analysis
This article was automatically generated by the NFC Market Live AI analysis system. (Updated: 2026-10-27 18:43 JST)
📊 A walk-through of the ECB’s September monetary data, released October 27.
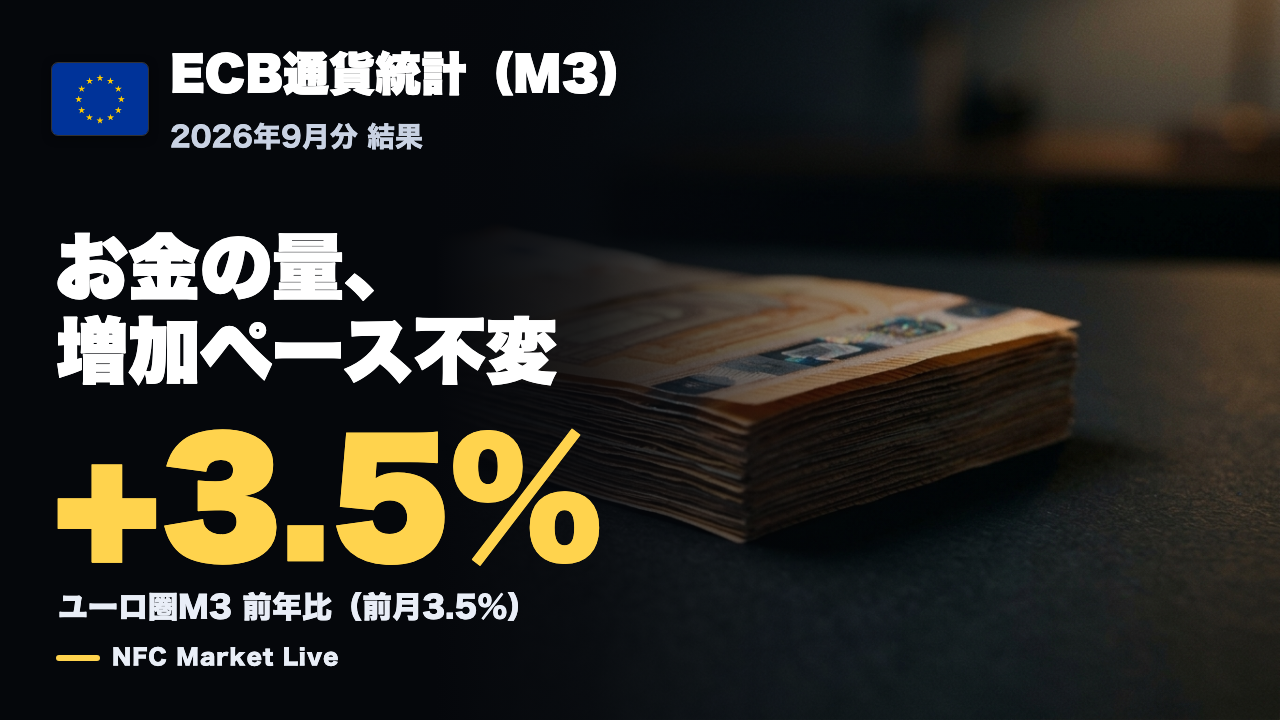
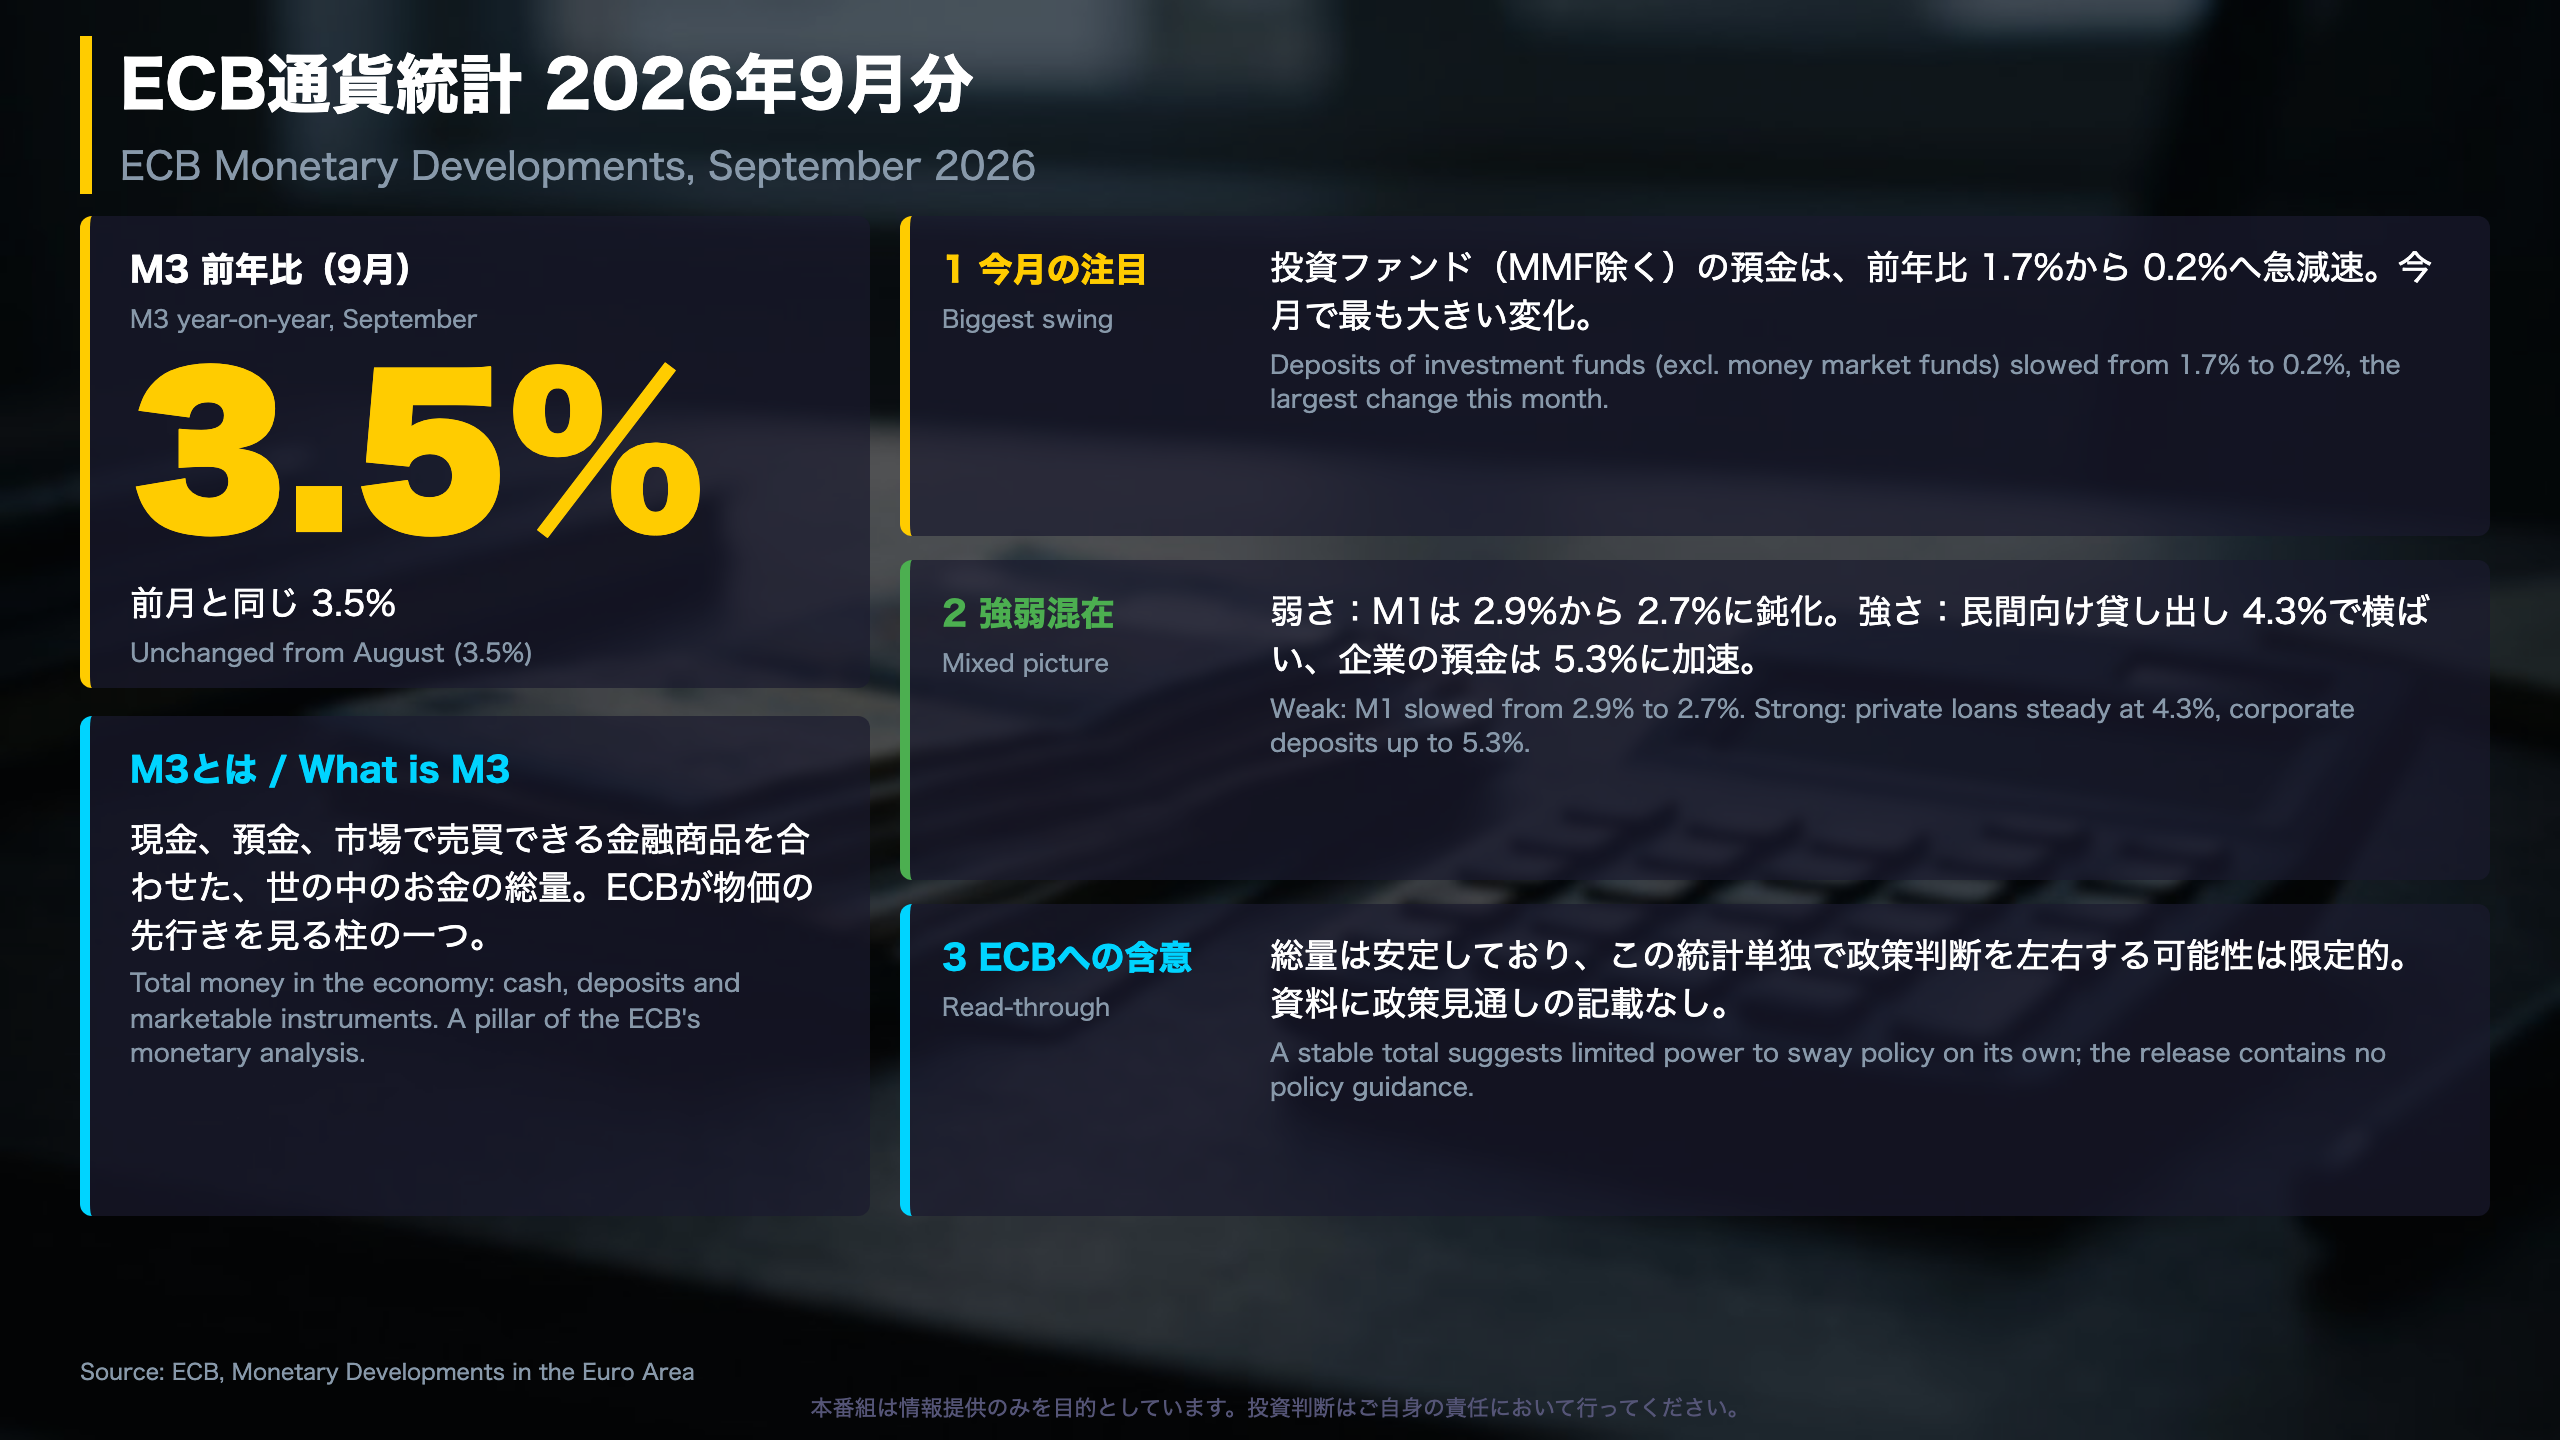
Euro area M3 grew 3.5% year on year, the same pace as in August.
📉 M1 slowed to 2.7%, and deposits of investment funds slowed from 1.7% to 0.2%.
📈 Meanwhile term deposits accelerated to 4.6% and private sector loans held at 4.3%.
💡 The total is flat, but the mix of money is shifting.
⚠️ Next: whether M1’s slowdown continues in the October data.
今月の発表:総量は横ばい、中身は変化
What the ECB reported
On October 27, 2026, the European Central Bank (ECB) published its monthly Monetary Developments release. Euro area M3, the broad money aggregate covering currency, deposits and marketable instruments, grew 3.5% year on year in September, unchanged from August, and the three-month average was also 3.5%.
Why investors watch it
The ECB’s framework rests on two pillars: an economic analysis and a monetary and financial analysis. M3 is a core input to the second. It is loosely comparable to the M2 series the Federal Reserve publishes, but the euro area figures are built from the consolidated balance sheet of monetary financial institutions.
The trend
M3 growth was 2.78% a year ago and 2.79% in April 2026, then rose for five straight months to 3.5%. September shows a pause rather than a further step up.
Strengths and weaknesses
- Resilience: adjusted loans to the private sector held at 4.3%, and corporate deposits accelerated to 5.3%.
- Softness: M1 slowed to 2.7%, and deposits of investment funds (excluding money market funds) slowed from 1.7% to 0.2%.
Market context
The release contains no policy guidance and no exchange-rate commentary, so it is best read as background on money and credit conditions, not as a direct signal for EUR/JPY or EUR/USD. The latest HICP inflation reading was not part of the source material, so the link between M3 and inflation cannot be assessed here.
注目点1:M1の減速と預金の置き場所
M1: the narrow end of the money supply
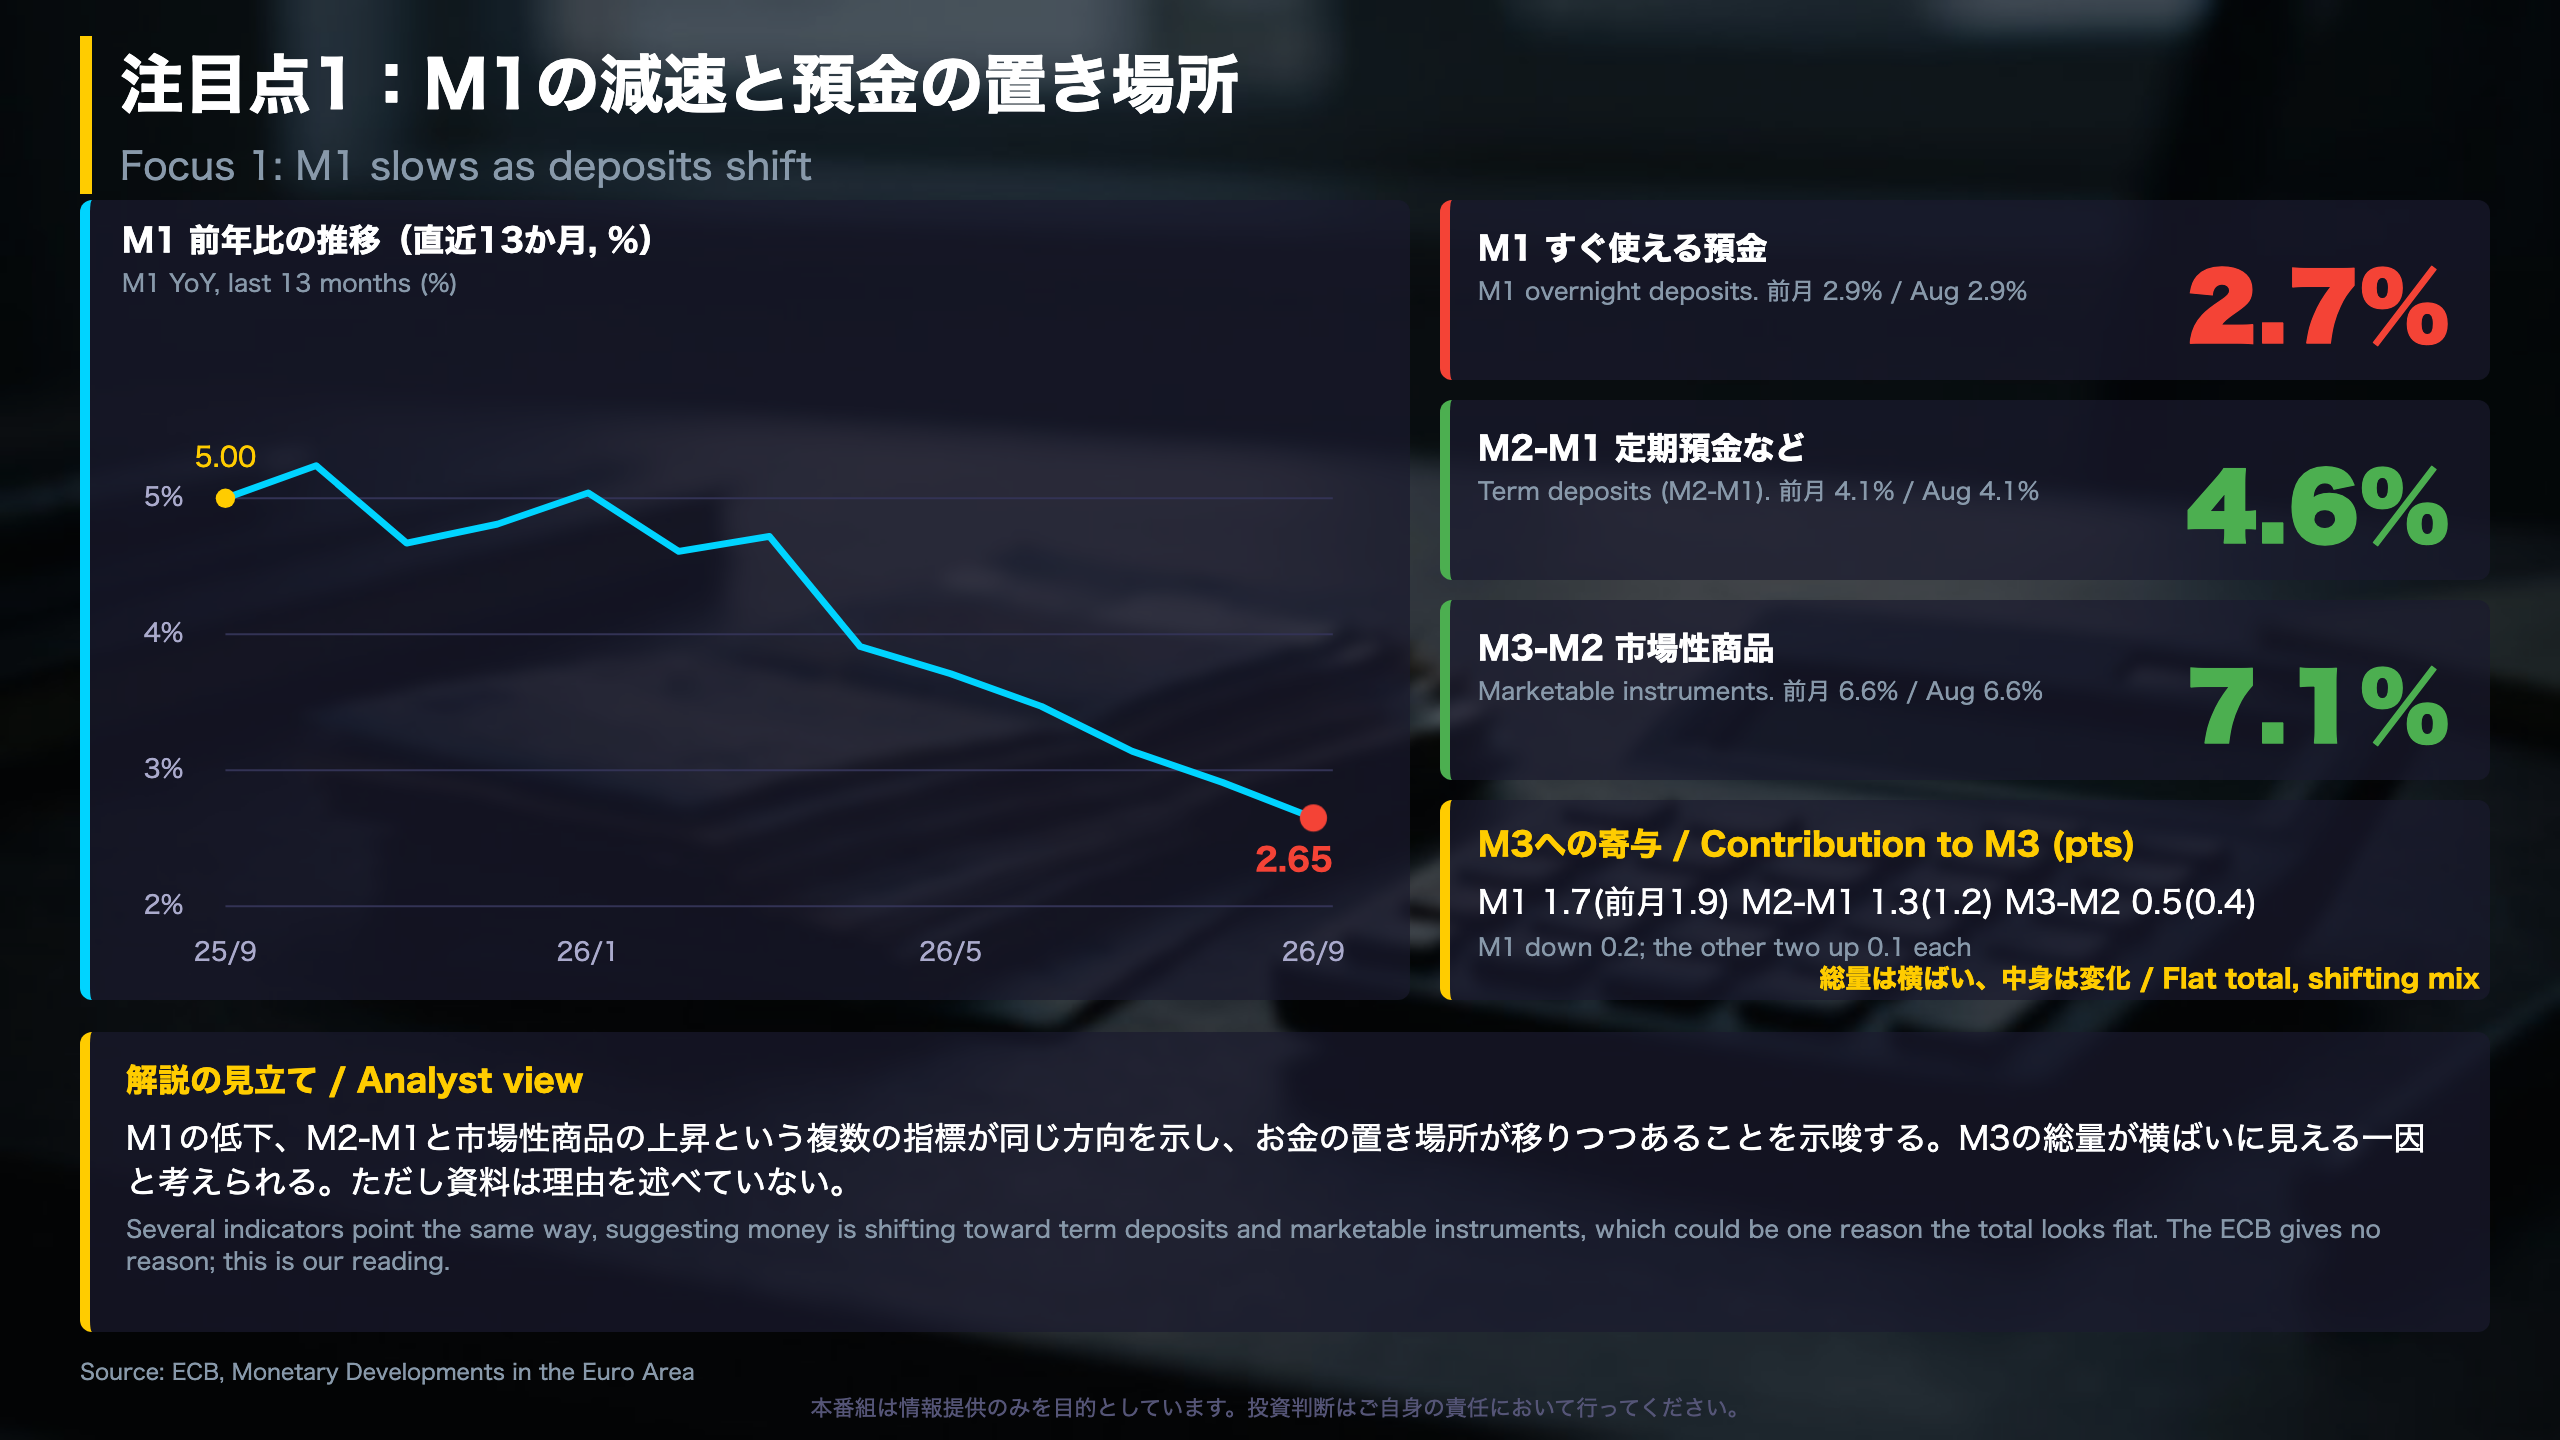
M1 is currency in circulation plus overnight deposits, the money households and firms can spend right away. The ECB reported that M1 growth slowed to 2.7% in September from 2.9% in August.
A six-month slide
The ECB’s data series shows M1 growth at 5.0% in September 2025, 4.72% in March 2026, and then lower every month to 2.65% in September 2026 (the press release rounds this to 2.7%). That is six consecutive monthly declines.
| Component | Aug | Sep | Contribution to M3 (Aug to Sep) |
|---|---|---|---|
| M1 | 2.9% | 2.7% | 1.9 to 1.7 pts |
| M2-M1 (term deposits) | 4.1% | 4.6% | 1.2 to 1.3 pts |
| M3-M2 (marketable instruments) | 6.6% | 7.1% | 0.4 to 0.5 pts |
Two readings
- Portfolio shift: a weaker M1 alongside stronger term deposits and marketable instruments is consistent with money moving into instruments with a maturity or a yield.
- Softer transactions demand: slower growth in spendable balances could also reflect a slower build-up of money held for payments.
The ECB does not say which applies, so neither should be treated as established.
Revision note
In last month’s release, August M3-M2 growth was shown as 7.1%. This release shows 6.6%, so the September step-up looks smaller than a naive comparison suggests.
What to watch
Whether M1 keeps slowing in the October data, and whether the pick-up in M2-M1 and M3-M2 persists.
注目点2:預金の持ち主と貸し出し
Deposits by holding sector
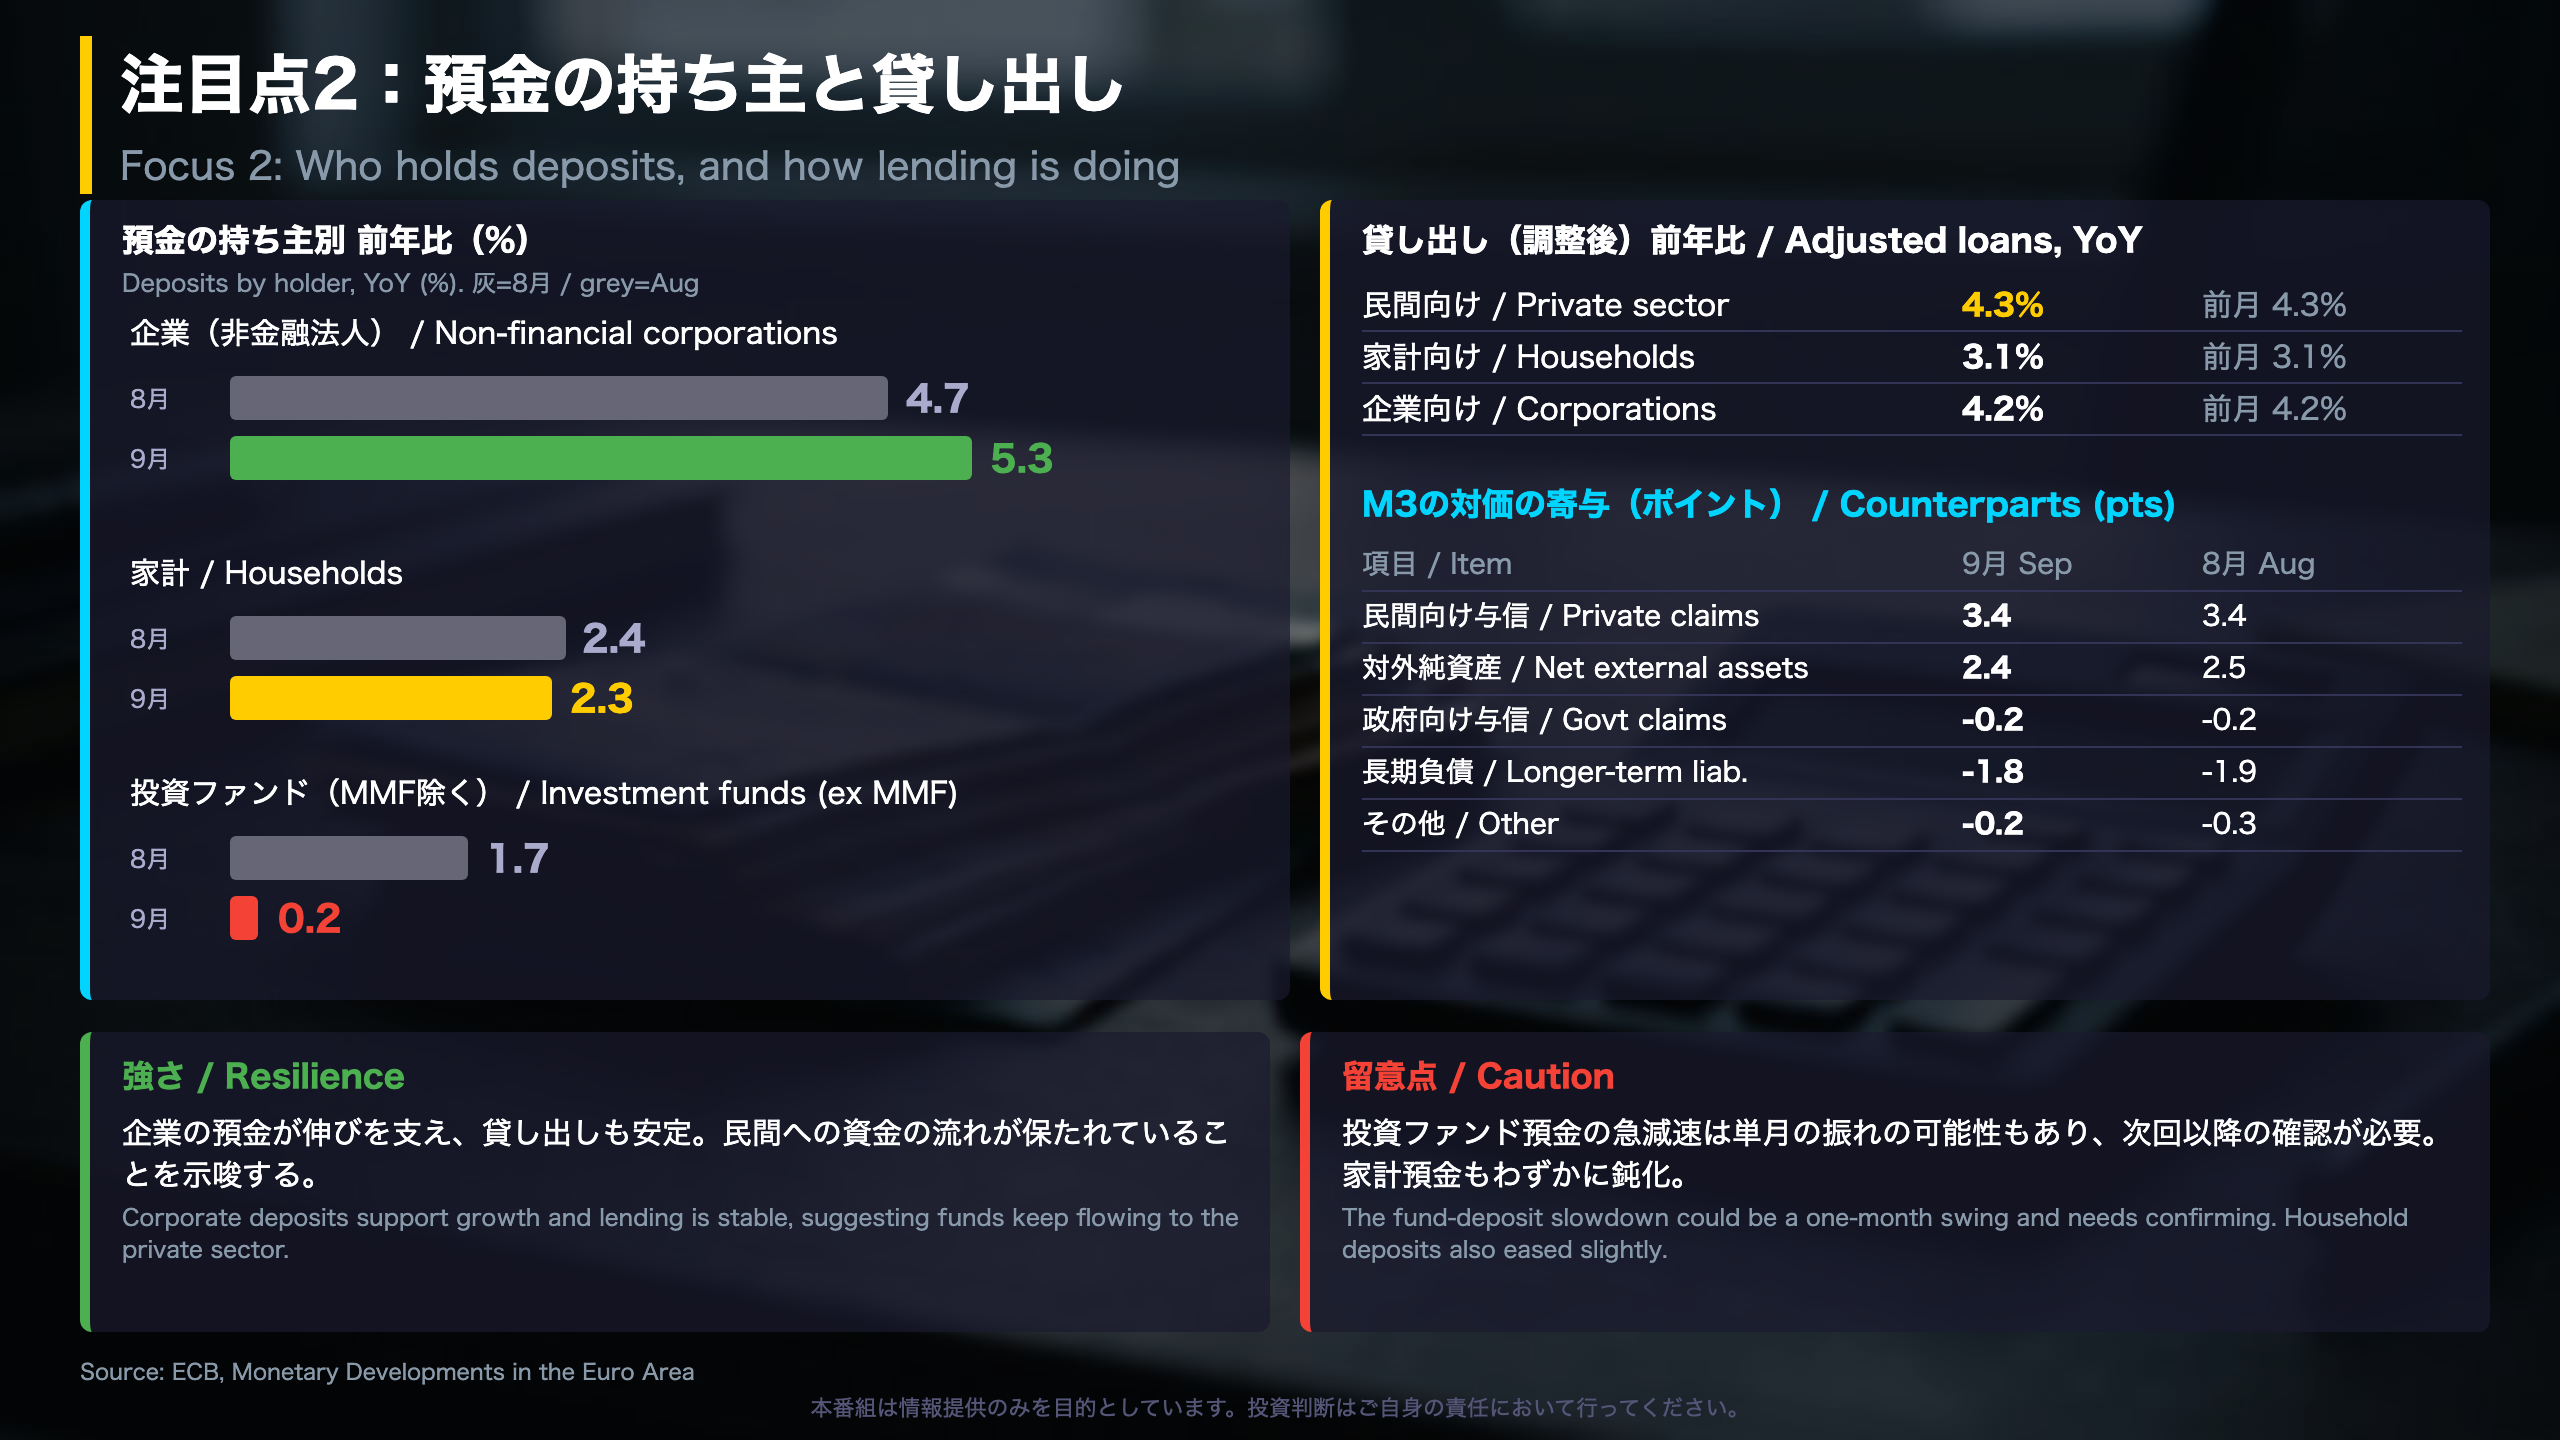
| Sector | Aug | Sep |
|---|---|---|
| Households | 2.4% | 2.3% |
| Non-financial corporations | 4.7% | 5.3% |
| Investment funds (ex money market funds) | 1.7% | 0.2% |
Corporate deposits accelerated while household deposits eased slightly. The investment fund line fell by 1.5 points, the largest move of the month. It is also a revised series: last month’s release put August at 1.8%, versus 1.7% now.
Credit stayed steady
- Claims on the private sector: 3.6%, unchanged
- Adjusted loans to the private sector: 4.3%, unchanged
- Adjusted loans to households 3.1% and to non-financial corporations 4.2%, both unchanged
- Claims on general government: -0.4% (previous month -0.6%)
Note: the ECB data API returned no time series for private credit or loans this month, so the 12-month trend cannot be charted; figures above come from the press release.
M3 counterparts (percentage points)
Claims on the private sector contributed 3.4 (unchanged), net external assets 2.4 (from 2.5), claims on government -0.2, longer-term liabilities -1.8 (from -1.9) and other items -0.2 (from -0.3). No item moved more than 0.1 point.
Balanced view
Corporate deposit growth and steady lending point to a private-sector funding channel that is holding up. Softer household deposits and the sharp fall in investment fund deposits warrant follow-up, though a single month cannot establish a trend. Neither the release nor this note implies a specific path for EUR/JPY.
質疑:M1の減速をどう読むか

Q&A recap: why a flat M3 hides a changing mix
M3 growth of 3.5% decomposes into contributions of 1.7 points from M1, 1.3 from M2-M1 and 0.5 from M3-M2. A month earlier the figures were 1.9, 1.2 and 0.4. M1 therefore lost 0.2 points while the other two components together gained 0.2, which is why the headline did not move.
How far can the data be pushed?
Falling M1 combined with rising term deposits and marketable instruments is consistent with money moving to instruments with a maturity or yield. That is a reading supported by several indicators, but the ECB offers no explanation and one month cannot confirm a structural shift. The alternative, softer transactions demand, cannot be ruled out.
For investors holding euro assets
Monetary Developments describes money and credit inside the euro area. It does not carry exchange-rate information, and EUR/JPY or EUR/USD are influenced by many other factors, including interest rate differentials and policy decisions that are outside this release. We therefore avoid drawing currency conclusions from it. Inflation context is also limited: the latest HICP reading was not in the source material.
Checklist for the October data
- Does M1 growth fall further from 2.7%?
- Do corporate deposits (5.3%) and adjusted private loans (4.3%) stay stable?
- Are investment fund deposits (0.2%) a one-month swing?
The next release date was not stated in the source; check the ECB statistical calendar.
Disclaimer: This article is for informational purposes only. All investment decisions are made solely at your own risk.